Equity report on apollo tyres
•Transferir como DOCX, PDF•
1 gostou•376 visualizações

Analysing Current Projections for Appollo Tyres by performing Market Approaach method with Rubber companies in India

Recomendados
Mais conteúdo relacionado
Mais procurados
Mais procurados (18)
Semelhante a Equity report on apollo tyres
Semelhante a Equity report on apollo tyres (20)
Mais de Tejas Jadhav
Último
Último (20)
Equity report on apollo tyres
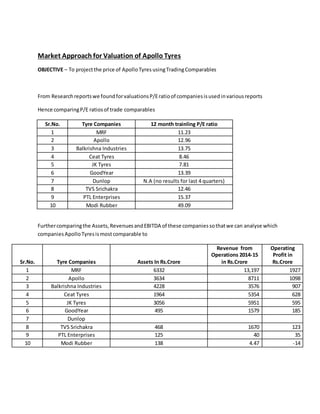
- 1. Market Approach for Valuation of Apollo Tyres OBJECTIVE – To projectthe price of ApolloTyresusingTradingComparables From Researchreportswe foundforvaluationsP/Eratioof companiesisusedinvariousreports Hence comparingP/E ratiosof trade comparables Sr.No. Tyre Companies 12 month trainling P/E ratio 1 MRF 11.23 2 Apollo 12.96 3 Balkrishna Industries 13.75 4 Ceat Tyres 8.46 5 JK Tyres 7.81 6 GoodYear 13.39 7 Dunlop N.A (no results for last 4 quarters) 8 TVS Srichakra 12.46 9 PTL Enterprises 15.37 10 Modi Rubber 49.09 Furthercomparingthe Assets, RevenuesandEBITDA of these companiessothatwe can analyse which companiesApolloTyresismostcomparable to Sr.No. Tyre Companies Assets In Rs.Crore Revenue from Operations 2014-15 in Rs.Crore Operating Profit in Rs.Crore 1 MRF 6332 13,197 1927 2 Apollo 3634 8711 1098 3 Balkrishna Industries 4228 3576 907 4 Ceat Tyres 1964 5354 628 5 JK Tyres 3056 5951 595 6 GoodYear 495 1579 185 7 Dunlop 8 TVS Srichakra 468 1670 123 9 PTL Enterprises 125 40 35 10 Modi Rubber 138 4.47 -14
- 2. Conclusions If we see AssetTurnoverratiowe canfindCeatTyres,TVSSrichakra,GoodYear,MRFcan be comparable For Revenue fromOperations,JKtyres,Ceat Tyres,BalkrishnaIndustriesandMRFare comparable We are thus eliminatingPTLEnterprisesandModi Rubberdue tothe misfitin the above parameters Classifyingthese companies furtherintoMatrix form Sr.No. Tyre Companies Revenue growth Asset Turnover Ratio Historical(CAGR 3 YEARS) Projected as RM prices are stable 1 MRF 2.08 9.58 9.5 2 Apollo 2.40 14.32 14.3 3 Balkrishna Industries 0.85 21.20 21.2 4 Ceat Tyres 2.73 14.31 14.3 5 JK Tyres 1.95 5.47 5.5 6 GoodYear 3.19 2.31 2.3 7 TVS Srichakra 3.57 12.56 12.6 Sr.No. Tyre Companies EBITDA growth YOY in percent Historical( CAGR 3 YEARS) Projected 1 MRF 33.91 30 2 Apollo 22.31 20 3 Balkrishna Industries 34.71 30 4 Ceat Tyres 54.89 50 5 JK Tyres 18.45 15 6 GoodYear 10.87 10 8 TVS Srichakra 6.44 6
- 3. Sr.No. Tyre Companies RM /sales from Operationsin Percentage R.M expenses growth Historical Projected 1 MRF 65.20 4.28 5 2 Apollo 68.23 12.00 15 3 Balkrishna Industries 52.05 13.47 15 4 Ceat Tyres 65.99 9.33 10 5 JK Tyres 69.30 2.83 3 6 GoodYear 68.72 -0.44 0 7 TVS Srichakra 68.14 6.20 7 Conclusionsand Inferences As per Global Reports RubberPrices which amount for 60-70 percent ofexpenditure will be stable till 2017 FinalizingP/E ratio 1. P/e RATIO in comparison with MRF- MRF beingan assetheavycompanygetsa competitive advantage due to the size andinvestmentsinRubberIndustry.Ithasperformedexceptionally well onthe basisof EBITDA marginsand stablitlyof RMcostsbut Revenue growthrate has not beensignificant.Sowe have takenaP/Eratiowhichwill be herthanthat of MRF comparedto Apolloi.e greaterthan11.23 2. P/e Ratio in comparison with Balkrishna Industries- EbitdaGrowth,Revenue Growthof BalkrishnaIndustriesishigherthanApollo tyresalsotheyhave maintainedthisgrowtheven thoughtheirRM expensesare high.P/Eratioshouldbe slightlylessthan13.47 for ApolloTyres 3. P/e Ratio in comparison with Ceat- Ceat ******* 4. P/e ratio in comparison with JK tyre& Goodyear – JK tyres and Goodyearcannotbe comparedat all as it has lowergrowthrates,lowersalesbothEBITA andRevenue Wise.
- 4. 5. P/e ratio in comparison with TVS Srichakra Althoughlowersalesturnoverbutrevenuegrowthrate ishigherlow EBITDA marginsas their RM expenseshave rose significantly.P/Eratioof Apollowillbe definitelyhigherthanthatof TVS Srichakrai.e.12.46 Since only Balkrishna Industriescan be compared to Apolli tyres and with the steadyprices of Rubber in Indonesianand other exportingmarkets we have consideredthe P/E ratio of ApolloTyres as 13 ApolloTyres – NewP/e ratio= 13 EPS for Apollo Tyres Now usingthe Projectedrates- Dividendper Share for FY2014-2015: Rs. 2 EPS ( TTM) : 12.70 For FY 14-15 Market Price of ApolloTyres= Projected P/e RATIO * EPS = 13*12.70 = Rs. 165.1 Current Market Price of ApolloTyres =164.20 onNSE Recommendation Apollois valuedcorrectly andthe projectedprice matches market price