
Recomendados
Recomendados
Mais conteúdo relacionado
Mais procurados
Mais procurados (20)
Semelhante a Australia demo
Semelhante a Australia demo (20)
Australia demo
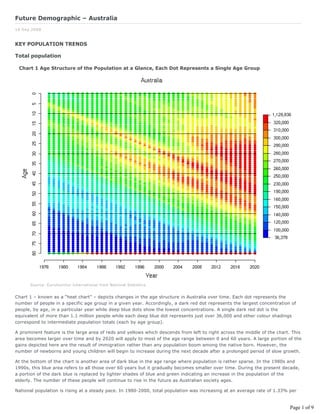
- 1. Future Demographic – Australia 16 Sep 2008 KEY POPULATION TRENDS Total population Chart 1 Age Structure of the Population at a Glance, Each Dot Represents a Single Age Group Source: Euromonitor International from National Statistics Chart 1 – known as a “heat chart” – depicts changes in the age structure in Australia over time. Each dot represents the number of people in a specific age group in a given year. Accordingly, a dark red dot represents the largest concentration of people, by age, in a particular year while deep blue dots show the lowest concentrations. A single dark red dot is the equivalent of more than 1.1 million people while each deep blue dot represents just over 36,000 and other colour shadings correspond to intermediate population totals (each by age group). A prominent feature is the large area of reds and yellows which descends from left to right across the middle of the chart. This area becomes larger over time and by 2020 will apply to most of the age range between 0 and 60 years. A large portion of the gains depicted here are the result of immigration rather than any population boom among the native born. However, the number of newborns and young children will begin to increase during the next decade after a prolonged period of slow growth. At the bottom of the chart is another area of dark blue in the age range where population is rather sparse. In the 1980s and 1990s, this blue area refers to all those over 60 years but it gradually becomes smaller over time. During the present decade, a portion of the dark blue is replaced by lighter shades of blue and green indicating an increase in the population of the elderly. The number of these people will continue to rise in the future as Australian society ages. National population is rising at a steady pace. In 1980-2000, total population was increasing at an average rate of 1.33% per Page 1 of 9
- 2. year and the expected pace in 2000-2020 should be around 1.28%. Between 1980 and 2020, Australia will add just over 10 million people, giving it a total population of 24.7 million by the end of the period. The potential workforce (those between 15 and 64 years) will be increasing at an even faster pace as a result of immigration. Australia’s potential work force was 9.6 million in 1980 and should be about 15.8 million by 2020. Proportionally, however, some of the largest gains over the 40-year period will occur among those over 60 years. The population of this group will jump from 2.0 million in 1980 to 5.8 million in 2020. Australia’s growing economic links within Asia will provide most of the dynamism for future growth. A wave of Chinese investment could sweep through the country over the next ten years. This development would be crucial, given Australia’s very low rate of domestic savings; Population ageing coupled with a modest birth rate poses problems for policy makers. To partially counter these trends, the government plans a series of programmes to boost labour force participation and raise productivity; An inadequate infrastructure and a lack of investment in human capital slow growth in productivity. The number of older workers is increasing but this, too, limits growth in productivity; According to the Australian Bureau of Statistics, net immigration presently accounts for 56% of total population growth. Nonetheless, there are continuing labour shortages in crucial fields such as health care and mining. Further changes in immigration laws are expected in order to attract more skilled workers to the country; The medium-term outlook for consumer markets is generally good as Australia should continue to benefit from strong demand in world commodity markets. As the population continues to age, the significance of elderly consumers will become more apparent. Chart 2 Population Age Shift 2000 and 2020, Each Column Represents a Single Age Group Source: Euromonitor International from National Statistics Chart 2 looks at the country’s demographic structure in 2000 and 2020. The population of all ages will be greater in 2020 than it was in 2000 but the largest gains will be among those 55 and over. Australia had 4.1 million people over 55 years in 2000 (21.6% of total population) and the number will rise to 7.3 million by 2020 (29.7%). Population ageing will slow rates of productivity growth and increase spending on healthcare and pensions. The youth dependency ratio (the number of people 0-14 years relative to the number aged 15-64) will fall from 0.310 in 2000 to 0.286 in 2020; The elderly dependency ratio (the number of people over 65 years relative to the number aged 15-64) will rise from 0.186 in 2000 to 0.275 in 2020; Employment rates are high and rising, particularly among older workers. Nevertheless, the flow of immigrants continues and their numbers will probably increase over the medium term. Recent studies have shown that immigrants add hundreds of Page 2 of 9
- 3. millions of dollars to the economy each year. Chart 3 Population Pyramid Source: Euromonitor International from National Statistics The figures in chart 3 are known as population pyramids because they typically have a wide base with tapering sides rising to an apex. That description loosely applies to the figure for 1980 but over time population ageing, immigration and relatively low birth rates combine to alter the appearance. The figure for 2020 is much more rectangular in shape with abruptly rounded corners at the top which refers to those aged 60 and over. Under the age of 40, males slightly outnumber females but the relationship is reversed among those over 40 and the gender gap widens with age. In 2020, the number of females over the age of 60 will total over 3.0 million compared with about 2.7 million males. The gender gap is partly due to the longer life expectancy of females. In 2007, at 60 years of age females had another 20.5 years of healthy life expectancy while the figure for males was 18.6 years. Males also suffer more health problems from job-related illnesses and generally lead a less healthy lifestyle. The figures in Table 1 provide more details on the demographic structure. The population of young children between 0 and 9 years was at a low in 1984 but has been slowly and steadily rising. The upward trend will continue through 2020 when a new high is recorded. The population of tweenagers and teenagers declined throughout the 1980s and reached a low in 1994. Since then, the number has been on the increase and that trend will persist through 2020. Although Australia’s fertility rate has been stable and higher than that of most industrialised countries, it is slightly less than the replacement level of 2.1 children per female and will remain below this benchmark for the foreseeable future. Immigration is a more important contributor to population growth but most of these people are over 20 years when they enter the country; The number of women of childbearing age (15 to 49 years) is increasing over time but this effect is offset by delays in childbearing; There has been a steady fall in rates of cohabitation in the past 20 years which also serves to offset any rise in fertility. In 1986, 74% of all those between 18 and 44 years were either married or in a de facto relationship. By 2006, this figure had fallen to 51%. Page 3 of 9
- 4. The population of those in their twenties has been rising slowly over time and the upward trend will continue until 2019 when a new high is reached. Among 30-39 year olds, the population was at a low in 1980 and has been steadily rising. The numbers will continue to grow in the future and a new high will be recorded in 2020. The pattern is similar for forty and fifty-year olds with new highs being reached in 2020. The population of those over 60 will see the largest proportional increase over the 40- year period as their numbers nearly triple. Australia has one of the highest life expectancies in the world (currently 80.8 years). The healthy life expectancy at 60 years has also shown substantial gains and in 2007 stood at 18.6 years for 60-year-old males while that for females was 20.5 years; Most Australians have access to health care of high quality. Health care is free to the user and largely unlimited in access. The system is predominately financed through public funding along with a small compulsory health insurance levy. Around 68% of total health funding comes from either the federal government or the individual states; Immigrants are generally in better health than those born in the country. This result stems from the “healthy immigrant effect” which includes stringent eligibility criteria designed to ensure that only healthy immigrants are allowed in the country. Table 1 Key Population Trends 1980-2020 ‘000 1980 1985 1990 1995 2000 2005 2010 2015 2020 CAGR Period % Growth Total 14,695 15,788 17,065 18,072 19,153 20,400 21,871 23,295 24,711 1.31 68.16 Male 7,338 7,883 8,511 8,994 9,505 10,135 10,878 11,588 12,293 1.30 67.52 Female 7,357 7,906 8,554 9,078 9,648 10,265 10,993 11,707 12,419 1.32 68.80 0-4 yrs 1,132 1,200 1,258 1,300 1,279 1,287 1,387 1,453 1,529 0.75 35.09 5-9 yrs 1,307 1,175 1,262 1,293 1,350 1,336 1,353 1,442 1,504 0.35 15.10 10-14 yrs 1,272 1,351 1,235 1,296 1,337 1,401 1,397 1,410 1,495 0.40 17.51 15-19 yrs 1,308 1,305 1,402 1,269 1,327 1,400 1,457 1,449 1,459 0.27 11.60 20-24 yrs 1,269 1,349 1,358 1,430 1,291 1,434 1,505 1,535 1,523 0.46 20.02 25-29 yrs 1,210 1,320 1,423 1,379 1,449 1,374 1,561 1,604 1,627 0.74 34.46 30-34 yrs 1,180 1,253 1,394 1,462 1,427 1,518 1,485 1,666 1,705 0.92 44.45 35-39 yrs 951 1,228 1,313 1,423 1,505 1,485 1,593 1,558 1,736 1.52 82.62 40-44 yrs 810 969 1,259 1,333 1,449 1,544 1,536 1,638 1,600 1.72 97.59 45-49 yrs 742 819 982 1,252 1,341 1,467 1,568 1,556 1,654 2.03 123.07 50-54 yrs 775 733 821 972 1,258 1,339 1,464 1,563 1,549 1.75 100.02 55-59 yrs 737 759 726 802 964 1,238 1,327 1,451 1,548 1.87 110.08 60-64 yrs 591 709 738 710 798 943 1,214 1,309 1,432 2.24 142.48 65-69 yrs 529 546 662 689 677 761 913 1,184 1,280 2.24 142.13 70-74 yrs 385 464 489 593 633 624 713 870 1,135 2.74 194.77 75-79 yrs 254 310 375 403 507 548 554 649 804 2.92 216.49 80+ yrs 246 300 367 466 562 700 845 959 1,130 3.89 360.12 Median 29 31 32 34 35 36 38 38 39 0.73 33.86 age Source: Euromonitor International from National Statistics Vital statistics Birth rates reached a peak in 1983 and have been falling since then. The downward trend will continue through 2020 when an all-time low is recorded. The number of live births was at a low in 1980 and will rise over time, driven by steady gains in population. A new high will be reached in 2020. Australia’s fertility rate has not breeched replacement level (2.1 children born per female) since 1960. The all-time high was reached in 1981 (1.94 children born per female). Fertility fell until 2001 when a low was reached. Since then, the rate has stabilised and will rise very slightly by 2020. The average age at childbirth also reveals a secular upward trend. It was at a low in 1980 and a new high will be reached in 2020. During these 40 years the average age will rise by 3.9 years. The secular decline in birth rates and fertility rates is largely due to the fact that more women either remain permanently childless or opt to have only one or two children. Presently, an estimated 16% of women of childbearing age are childless; Several factors combine to keep fertility rates below replacement. They include increased female participation in the labour force, longer periods of education and widespread access to modern means of contraception and abortion; More than two-fifths of the women over 30 who give birth are having their first child. This percentage is steadily rising; Page 4 of 9
- 5. Many policy makers argue that a rise in birth and fertility rates will be in the country’s long-term interests. This conviction has led to expansion of the country’s network of family policies. Death rates reached a high in 1983 and remained around that level until the 1990s when they began falling. They are expected to edge upward again in the coming decade and will be near the all-time high by 2020. The number of deaths was at a modern-day low in 1980 and has been steadily rising as population increases. It will reach a new all-time high in 2020. Australia’s population enjoys good health relative to other countries and the risk of dying is falling for people of all ages. By 2020, the life expectancy of males should reach 79.8 years, an increase of 8.7 years compared with the figure for 1980. Females will have a life expectancy of 85.1 years in 2020 – 7.1 years greater than the average in 1980; Circulatory diseases are the leading cause of death with heart disease accounting for a quarter of all deaths. Statisticians have identified poor diet and a lack of physical activity as the main risk factors. The proportion of overweight and obese people is increasing rapidly; The proportion of regular smokers has been declining over time and currently stands at 20.2%. The percentage of male smokers is expected to decline further in the future but the percentage of female smokers could rise during the next decade; Australia’s Aboriginal people and those living in rural areas have significantly lower life expectancies and higher mortality rates than people living in urban areas. Natural changes in population (defined as the number of births less the number of deaths) have consistently been positive and that relationship will hold through 2020. Annual additions to population range between 120,000 and 140,000. Net migration has been rather volatile, ranging between a high of 157,000 in 1989 and a low of 30,000 in 1993. Annual additions via migration have been generally rising over time and will range between 150,000 and 160,000 in the foreseeable future. Immigration since World War Two has transformed Australian society and population. Government statisticians calculate that in 2006 22% of the current Australian population were born overseas. In addition, another 26% of those born in Australia have at least one parent who was born overseas. For much of the post- war period, the UK and Ireland were the major source of immigrants although there were also successive waves from various non-English speaking countries. The latter groups first came from Eastern Europe followed by waves from the Netherlands, Germany, Italy, Greece, and the Middle East. By the late 1970s, substantial flows from Asia had begun and continue today. Since the late 1980s, Asia has been a more important origin of migrants than Europe. These patterns reflect some significant shifts in immigration policy. Australia experienced persistent labour shortages in the early post-war period. When these opportunities could not be filled by immigration from traditional sources, the government turned to Eastern Europe, providing assistance to more than 300,000 displaced persons to settle in Australia and fill vacant jobs. In the 1970s, immigration policy shifted from an emphasis on the recruitment of semi-skilled and skilled foreign workers for manufacturing to a more sophisticated approach designed to appeal to immigrants with more skills. The revised policies also allowed for family reunification, the acceptance of refugees and special provisions for New Zealanders who can move more or less freely across the Tasman Sea. Later, a points system to assess applicants for economic migration was introduced and the government specified the number of each of four types of immigration (economic, family reunification, refugees and special categories such as New Zealanders) that would be accepted annually. Immigration policy has not always been consistent over the past ten years but these four groups have retained their status as groups of primary focus. Refinements in immigration policy over the past ten years are mainly characterised by an increased emphasis on skilled migration. During this time, the pattern of migration has also changed. Migrants from the UK and New Zealand are still the two most important overseas-born groups, but the proportion of those coming from China, India and South Africa has increased sharply. Recent studies clearly suggest that immigrants make a strong contribution to economic growth. Analysts estimated that the migrants entering the country in 2007 would make a net fiscal benefit of A$610 million at the end of their first year and A$965 million at the end of their second year. After 20 years, their net contribution is forecast to be A$1.5 billion. The positive fiscal benefits are, of course, most pronounced for skilled immigrants. More than half of all immigrants are between 15 to 34 years, while just 2% are 65 or older. Thus, immigration appears to be slowing Australia’s ageing process; Opponents of increased immigration argue that the costs outweigh the benefits but government studies have concluded that if higher rates of immigration are allowed through 2025, the country’s GPD per capita contribution will rise by a small amount (around A$335). Table 2 Vital statistics 1980-2020 1980 1985 1990 1995 2000 2005 2010 2015 2020 CAGR % Period Growth Birth rates 15.2 15.3 15.1 14.3 13.0 12.5 11.7 11.1 10.7 -0.88 -29.90 Live births ('000) 225.5 247.3 262.6 256.2 249.6 259.8 274.0 285.7 294.6 0.67 30.64 Page 5 of 9
- 6. Fertility rates 1.9 1.9 1.9 1.8 1.8 1.8 1.8 1.9 1.9 -0.03 -1.34 Age at childbirth 27.1 27.6 28.3 29.0 29.8 30.3 30.7 30.9 31.0 0.33 14.17 Death rates 7.3 7.2 7.3 7.0 6.7 6.5 6.5 6.7 7.1 -0.07 -2.75 Deaths ('000) 108.7 118.8 120.1 125.1 128.3 130.7 144.2 157.0 170.0 1.12 56.43 Net migration ('000) 75.9 73.7 124.6 80.1 107.3 123.8 155.4 155.6 155.6 1.81 104.95 Source: Euromonitor International from National Statistics Note: Birth and death rates refer to the number per '000 population and fertility rates to the number of children born per female. Age at childbirth refers to average age of women in years. Growth of Urban Agglomerations Chart 4 Major cities: 1980, 2000 and 2020 Source: Euromonitor International from National Statistics Sydney, Australia’s largest city, is on the southeast coast. It is built in a coastal basin bordered by the Pacific Ocean on the east and the Blue Mountains in the west. Melbourne, the second largest city, is further south but also on the southeastern coast. Melbourne is located on Port Phillip Bay. Canberra, the capital, is about 280 kilometres southwest of Sydney and around 650 kilometres northwest of Melbourne. West of Melbourne is Adelaide on the Southern Ocean. Adelaide is near the Fleurieu Peninsula and the Mount Lofty Ranges. About 160 kilometres north of Sydney is Newcastle, located on the mouth of the Hunter River. Further north and also on the Pacific Coast is Brisbane. It lies on a low-lying flood plain and is situated on the Brisbane River and near Moreton Bay. In the far west of the country is Perth. It is located on the Swan River between the Indian Ocean and the Darling Range. Hobart is the only major city on the island of Tasmania. It is on the Derwent River in the southeast of the island. Australia’s population density is the lowest of any major country – 2.77 people per square kilometre in 2008. It has been slowly rising over time and by 2020 is expected to be around 3.22 people per square kilometre. The distribution of population is also unusual owing to the fact that much of the central part of the country can support little more than scattered, tiny communities. Thus, urban residents made up 85.8% of the total in the 1980s and their share will be 95.4% by 2020. In most states – including New South Wales, Victoria, South Australia and Western Australia – the vast majority of residents are concentrated in major cities. Urban migration has been forced on some residents as the result of severe droughts but most settlers and recent immigrants choose to live near the coast. Indigenous Australians make up nearly half the population in very remote areas. They tend to have higher fertility rates than the national average, meaning that there is a higher percentage of children between the ages of 0 and 14; The smaller cities and towns along the coast have the highest percentage of people over 50 years. The lower cost of Page 6 of 9
- 7. housing in these areas compared with highly urbanised centres is the main reason why these groups choose to live where they do. The median age in these smaller coastal towns is expected to rise over time as life expectancy increases. Given the country’s high degree of urbanisation, policies influencing this process are extremely important. Most major cities exhibit a "doughnut" pattern of population growth whereby the inner cities are experiencing population declines due to residential land uses being replaced by higher rent activities. Meanwhile, the bulk of population growth relocates to the peripheries. Government officials have had some success in altering this traditional pattern by changing land use policy to encourage higher population densities in built up areas. Australia’s largest city, Sydney, is steadily growing at moderate pace. Its economy is well-diversified but jobs have gradually been shifting from manufacturing to services. The city accounts for roughly a quarter of national GDP and has the country’s highest median household income. It is the headquarters for more than 90 banks, over half of Australia's leading companies, and the regional headquarters for around 500 multinationals. Sydney also has one of the region’s largest financial futures and options exchanges. Tourism is a major industry with more than 10 million visitors each year. Like Sydney, Melbourne is experiencing moderate growth and will see its population rise steadily between 1980 and 2020. Melbourne is a major centre for commerce, industry and tourism. It is the busiest seaport in the country and home to much of the country’s automobile industry, including Ford and Toyota. There is a large technology base with more than 60,000 being employed in the information technology industry. Melbourne is also home to one of the most influential financial centres in the Asia-Pacific region. It hosts more than nine million tourists each year and the industry is growing even faster than that of Sydney. Several of Australia's largest corporations have their headquarters there including the National Australia Bank, Rio Tinto and BHP Billiton. The country’s fastest-growing city and the third largest is Brisbane. The city’s economy includes information technology, financial services and education as well as important manufacturing operations such as metalworking, petroleum refining and paper milling. New industrial zones are under development in the suburbs. The Port of Brisbane is the third busiest in the country and one of the fastest-growing areas of development in Australia. Most major Australian companies, as well as numerous international companies, have contact offices or distribution centres in Brisbane. Tourism is an important part of the Brisbane economy, both in its own right and as a gateway to other parts of Queensland. Darwin is growing almost as fast as Brisbane but is much smaller. The city’s proximity to Asia makes it an important Australian gateway to countries in the region and as intra-Asian trade grows it will benefit. Darwin’s two largest industries are mining and tourism. The most important mineral resources are gold, zinc, bauxite and manganese. Significant energy production is carried out offshore with oil and natural gas being extracted from the Timor Sea. There are also uranium deposits near Darwin. Tourism employs 8% of the work force and is expected to grow as domestic and international tourists are now spending time in Darwin during the both the wet and the dry seasons. Federal spending is a major contributor to the local economy as well. Table 3 Population of 10 biggest cities 1980-2020 ‘000 1980 1985 1990 1995 2000 2005 2010 2015 2020 CAGR Period % Growth Sydney 3,292 3,470 3,644 3,821 4,096 4,368 4,618 4,843 5,045 1.07 53.24 Melbourne 2,812 2,970 3,127 3,244 3,450 3,670 3,870 4,052 4,216 1.02 49.91 Brisbane 1,114 1,210 1,331 1,487 1,624 1,756 1,874 1,976 2,066 1.56 85.43 Perth 1,035 1,101 1,175 1,272 1,378 1,488 1,585 1,670 1,745 1.31 68.60 Adelaide 928 984 1,045 1,075 1,096 1,118 1,145 1,177 1,210 0.67 30.43 Newcastle 378 397 415 438 484 537 581 618 650 1.36 71.99 Canberra 224 248 280 305 311 315 320 328 336 1.02 49.99 Hobart 169 179 189 195 194 191 191 193 196 0.36 15.67 Darwin 71 74 77 80 90 100 110 117 123 1.40 74.51 TOTAL 10,023 10,633 11,282 11,916 12,723 13,542 14,295 14,974 15,586 1.11 55.51 % of total 68 67 66 66 66 66 65 64 63 -0.20 -7.52 population Source: Euromonitor International from National Statistics Population by country of birth Australia has become increasingly diverse as a result of its immigration policies. In the immediate post-war period, 98% of the population were born either in Australia or another English-speaking country. By 1996, however, this figure had dropped to 86%. A distinctive feature of post-World War II immigration is that it has not been dominated by a single birthplace or ethno- linguistic group. People from the UK and Ireland still account for the largest number of foreign-born residents but their number has been falling since 1989. This group made up 7.8% of all residents in 1980 and today their share is down to 5.0%. It will fall to around 4.1% by 2020. New Zealanders are the second-largest group of foreign-born residents owing mainly to the relaxed Page 7 of 9
- 8. set of regulations governing their immigration. However, New Zealanders make up only a small proportion of total population (2.1% in 2008). The fastest-growing groups of foreigners are Asians (Indians, Vietnamese and Filipinos). Between half and three-quarters of the country’s Asian-born residents live in New South Wales. The rate of labour force participation among Asian immigrants is high, many have at least some tertiary education and a growing number are professionals. The settlement patterns of immigrants are also distinctive. Immigrants are heavily concentrated in urban areas where up to four-fifths of them reside; They are especially concentrated in Sydney, where 32% of the overseas-born are located as well as 38% of those who have been in Australia for less than five years; Immigrants are also more concentrated in some states (New South Wales, Victoria, Western Australia) than others. Australia’s immigration policies were initially based on the concept of assimilation. Later, however, a new policy of multiculturalism emerged. This approach was intended to encourage immigrants to retain their distinctive cultures while becoming part of broader Australian society. A number of mechanisms have been put in place to support this goal including the introduction of multicultural television and radio networks funded by the federal government. Immigration policies are being transformed under the present Labour government. The prime minister has announced that in 2008 his government will accept more than 190,000 “permanent” settlers, an increase of 25% over the figure for 2008. In addition, another 100,000 are expected to enter under a new short-term visa arrangement that permits employers to fill urgent vacancies from outside the country. Other changes are also expected to lead to a further relaxation in immigration requirements. Behind these changes is an economic boom that has lasted more than 15 years. This has created an extreme skills shortage. A related factor is the past failure to invest in skills and infrastructure to meet the demands of the current economic boom. Table 4 Population by country of birth 1980-2020 ‘000 1980 1985 1990 1995 2000 2005 2010 2015 2020 CAGR Period % Growth Australia 11,442 12,149 12,931 13,416 13,840 14,228 14,559 14,888 15,233 0.72 33.13 UK & Ireland 1,152 1,178 1,191 1,156 1,117 1,080 1,046 1,022 1,004 -0.34 -12.85 New Zealand 216 238 265 292 350 413 468 517 560 2.41 159.61 Italy 274 269 262 247 228 208 191 177 166 -1.25 -39.53 China 35 50 74 106 139 170 198 222 242 4.96 593.59 Vietnam 77 95 120 148 157 161 164 167 171 2.00 120.99 Philippines 43 55 71 91 104 115 124 132 140 2.99 224.99 India 36 46 60 76 94 111 127 140 152 3.66 320.77 Greece 149 146 141 132 121 111 102 95 89 -1.28 -40.23 Germany 109 112 115 113 111 109 107 106 105 -0.09 -3.63 Other 1,161 1,449 1,836 2,295 2,893 3,500 4,028 4,500 4,910 3.67 322.85 countries Source: Euromonitor International from National Statistics Population by language Australia has no official language but it is largely mono-lingual with English being the de facto national language. Currently, 88.7% of all residents are thought to be fluent English speakers and the number is steadily growing. By 2020, a projected 89.1% of all residents will be fluent in English. Among immigrants who come from non English-speaking countries, the government estimates that 82% are proficient English speakers. The number of those speaking Cantonese or Mandarin is growing fastest but this growth is from a small base. The same applies to Vietnamese. Chinese, Italian and Greek are the most common languages (other than English) that are spoken at home. Altogether, the government estimates that languages other than English are spoken in 20% of households. Included are virtually all European languages and a great many Asian languages as well as Russian, Kurdish and Uzbek. None of these are believed to be spoken at home by more than 100,000 people however. Table 5 Population by language 1980-2020 ‘000 1980 1985 1990 1995 2000 2005 2010 2015 2020 CAGR Period % Growth English 12,265 13,313 14,583 15,718 16,836 17,878 18,749 19,546 20,286 1.27 65.39 Page 8 of 9
- 9. Italian 434 435 422 376 354 339 329 322 319 -0.76 -26.42 Cantonese 29 47 79 132 207 279 334 378 413 6.84 1,311.47 Greek 287 291 286 263 261 264 266 269 273 -0.12 -4.84 Arabic (including 127 141 158 176 202 227 246 262 276 1.95 116.84 Lebanese) Vietnamese 73 86 105 129 164 200 227 249 267 3.30 267.03 © Copyright and database right Euromonitor Page 9 of 9