SlideShare uma empresa Scribd logo
1 de 9
Baixar para ler offline
TOJET: The Turkish Online Journal of Educational Technology – July 2012, volume 11 Issue 3
Copyright © The Turkish Online Journal of Educational Technology
144
THE IMPACT OF ICT ON EDUCATIONAL PERFORMANCE AND ITS
EFFICIENCY IN SELECTED EU AND OECD COUNTRIES: A NON-PARAMETRIC
ANALYSIS
Aleksander Aristovnik
University of Ljubljana, Slovenia
aleksander.aristovnik@fu.uni-lj.si
ABSTRACT
The purpose of the paper is to review some previous researches examining ICT efficiency and the impact of ICT
on educational output/outcome as well as different conceptual and methodological issues related to performance
measurement. Moreover, a definition, measurements and the empirical application of a model measuring the
efficiency of ICT use and its impact at national levels will be considered. For this purpose, the Data
Envelopment Analysis (DEA) technique is presented and then applied to selected EU-27 and OECD countries.
The empirical results show that the efficiency of ICT, when taking educational outputs/outcomes into
consideration, differs significantly across the great majority of EU and OECD countries. The analysis of the
varying levels of (output-oriented) efficiency (under the VRSTE framework) shows that Finland, Norway,
Belgium and Korea are the most efficient countries in terms of their ICT sectors. Finally, the analysis finds
evidence that most of the countries under consideration hold great potential for increased efficiency in ICT and
for improving their educational outputs and outcomes.
Keywords: Information and Communication Technology (ICT), education, performance, efficiency, DEA, EU,
OECD
INTRODUCTION
Information and communication technology (ICT) is one of the most important driving forces promoting
economic growth in the economy. However, there is less of a consensus among economists on whether the
impact of ICT also stems from higher total factor productivity (TFP) growth and improved efficiency of
production (due to a better educated population). During the last two decades countries have invested heavily in
ICT. Indeed, the use of ICT in education and training has been a key priority in most EU and OECD countries in
the last decade, although progress has been uneven. ICT has had a major impact on the education sector, on
organisation and on teaching and learning methods. Yet there are considerably different ICT expenditure levels
within and between countries, as well as between institutions within countries. In some countries schools have
embedded ICT into the curriculum, and demonstrate high levels of effective and appropriate ICT use to support
teaching and learning across a wide range of subject areas. However, in other countries schools are in the early
phase of adopting ICT, characterised by important enhancements of the learning process, some developments of
e-learning (ICT-enabled learning), but without any profound improvements in learning and teaching (Balanskat
et al., 2006).
One puzzling question concerns the effective impact of these technologies on educational outputs and outcomes.
As ICTs are being increasingly used in education, indicators to monitor their impact and demonstrate
accountability to funding sources and the public are ever more needed. Indicators are required to show the
relationships between technology use and educational performance. There is also a need to show that education
should be seen as using technology not only as an end in itself, but as a means to promote creativity,
empowerment and equality and produce efficient learners and problem solvers. Many academic researchers have
tried to answer this question at theoretical and empirical levels. They have faced two main difficulties. On one
hand, student performance is hard to observe and there is still confusion about its definition. On the other, ICT
entails evolving technologies and their effects are difficult to isolate from their environment. Consequently, the
relationship between the use of ICT and educational performance is unclear, and contradictory results are
presented in the literature (Youssef and Dahmani, 2008).
Accordingly, the paper’s purpose is to discuss and review some previous researches on ICT efficiency and ICT’s
impact on educational outcomes as well as different conceptual and methodological issues related to measuring
performance in education. Moreover, a definition, measurements and an empirical application of a model
measuring the efficiency of ICT at national levels will be considered, with a special focus on educational
variables as outputs/outcomes. In this context, the Data Envelopment Analysis (DEA) technique will be
presented and then applied to selected EU-27 and OECD countries.
The paper is structured as follows: first, a brief survey of the literature relating to ICTs and their impact on
education performance is presented, then the methodology is established and the specifications of the models are
defined. The next section outlines the results of the non-parametric efficiency analysis and presents partial
TOJET: The Turkish Online Journal of Educational Technology – July 2012, volume 11 Issue 3
Copyright © The Turkish Online Journal of Educational Technology
145
correlation coefficients in order to assess the impact of ICT on educational performance. The final section
provides concluding remarks and some policy implications.
LITERATURE REVIEW
Many theoretical and empirical efforts have been made to assess the impact of ICT on in educational
performance in various settings. Recent approaches to evaluating ICT in education often only focus on a few
aspects such as input, output and outcome/impact. The use of indicators can help assess how the input (e.g.
monetary, infrastructure, resources) relates to the impact. However, an evaluation must consider different stages
in the implementation process and analyse changes in the culture of the school system – at the micro level
(pupils) as well as at the meso (institutions/schools) and macro (national) levels. At national and institutional
levels, educational policies and regulations have been established to support the educational use of ICT. In
school and classroom settings, teachers and school administrators are attempting to find the best ways to harness
ICT technology to support their teaching and students’ success. However, accomplishments that are
convincingly the result of the direct causal impact of ICT use are not always easily identifiable (Kang et al.,
2008).
Currently, there is a significant number of initiatives to assess and monitor the efficiency of ICT use and its
impact on education. SITES (the second information technology in educational study), sponsored by the
International Association for the Evaluation of Educational Achievement (IEA), is an exemplary study which
identifies and describes the educational use of ICT across 26 countries in the world. The study explores the use
of computers in teaching through sampling teachers, principals and ICT responsibility in schools. While it does
not look into student achievement, it does look at the perceived impact of ICT on students from the teacher’s
perspective (Pelgrum and Anderson, 1999; Kozma, 2003). Moreover, Balanskat et al. (2006) reviewed several
studies on the impact of ICT on schools in Europe. They conclude that the evidence is scarce and comparability
is limited. Each study employs a different methodology and approach, and comparisons between countries must
be made cautiously. In addition, in several other studies (see Yusuf, & Afolabi, 2010; Shaikh, 2009; Jayson,
2008; Shaheeda et al., 2007) it is argued that ICT helps to improve the quality of learning and educational
outcomes. Some other surveys (e.g., Iqbal, and Ahmed, 2010; Hameed, 2006; Amjad, 2006; Khan, and Shah,
2004) argue that, in order to be successful, a country should improve its education system by implementing
effective and robust ICT policies.
In contrast, Trucano (2005) reviews a series of studies on ICT’s impact on schools and concludes that the impact
of ICT use on learning outcomes is unclear. Moreover, Cox and Marshall (2007) point out that ICT studies and
indicators do not demonstrate solid effects. Empirica (2006) also explores the access and use of ICT in European
schools in 2006. It presents information for 25 EU member states, Norway and Iceland, but does not look into
student results so it is impossible to study this important aspect of ICT impact. Machin et al. (2006) state that,
while there is a clear case for using ICT to enhance the computer skills of students, the role of technology-
enhanced learning (TEL) is more controversial (Machin et al., 2006). There is neither a strong and well-
developed theoretical case nor much empirical evidence supporting the expected benefits accruing from the use
of ICT in schools since different studies find mixed results (Kirkpatrick and Cuban, 1998). Indeed, while Becta
(2002) and Kulik (2003) find a positive effect on the use of ICT and educational attainment, researches by Fuchs
and Woessman (2004), Leuven et al. (2004) or Goolsbee and Guryan (2002) find no real positive effect of the
use of ICT on educational results once other factors, such as school characteristics or socioeconomic
background, are taken into account.1
A few previous studies on the performance and efficiency of the education sector (at the national level) applied
non-parametric methods. For instance, Gupta and Verhoeven (2001) measure the efficiency of education in
Africa, Clements (2002) does so for Europe, St. Aubyn (2003) for education spending in the OECD, and Afonso
and St. Aubyn (2005, 2006a, 2006b) in OECD countries. Most studies apply the Data Envelopment Analysis
(DEA) method, while Afonso and St. Aubyn (2006a) undertake a two-step DEA/Tobit analysis in the context of
a cross-country analysis of secondary education efficiency. However, very few recent studies have examined the
efficiency of countries in utilising their ICT resources for educational outputs and outcomes and the impact of
ICT on education in a particular country, for instance in Turkey (Tondeur et al., 2007) and Belgium (Gulbahar,
2008). Since very insightful, cross-country analyses have rarely been used for ICT policy analysis, the present
research addresses this gap in the literature.
1
Indeed, Kozma (2008) pointed out that ‘some studies reveal a positive correlation between the availability of computer access or computer
use and attainment, others reveal a negative correlation, whilst yet others indicate no correlation whatsoever between the two’.
TOJET: The Turkish Online Journal of Educational Technology – July 2012, volume 11 Issue 3
Copyright © The Turkish Online Journal of Educational Technology
146
METHODOLOGY AND DATA
The measurement of efficiency generally requires: (a) an estimation of costs; (b) an estimation of output; and (c)
a comparison between the two. Applying this concept to ICT activities, we can say, for example, that ICT
expenditure is efficient when, given the amount spent, it produces the largest possible benefit for the country’s
population.2
Often efficiency is defined in a comparative sense: the relation between benefits and costs in
country X is compared with that of other countries. If in country X the benefits exceed the costs by a larger
margin than in other countries, then ICT expenditure in country X is considered more efficient. However, the
measurement of ICT efficiency is relatively complicated since the comparison and measurement of both costs
and benefits may be difficult.
Figure 1 illustrates the link between input, output and outcome, the main components of efficiency and
effectiveness indicators. The monetary and non-monetary resources deployed (i.e. the input) produce an output.
For example, ICT spending, investment in the broadband network or a baseline computer-pupil ratio (as possible
inputs) affects the number of students completing a grade (as a possible output) and national test results (as a
possible outcome). The input-output ratio is the most basic measure of efficiency.3
However, compared to
productivity measurement, the efficiency concept incorporates the idea of the production possibility frontier,
which indicates feasible output levels given the scale of operations. The greater the output for a given input or
the lower the input for a given output, the more efficient the activity is. Productivity, by comparison, is simply
the ratio of outputs produced to the inputs used. On the other hand, effectiveness relates the input or the output to
the final objectives to be achieved, i.e. the outcome. The outcome is often linked to welfare or growth objectives
and may therefore be influenced by multiple factors (including outputs but also exogenous 'environment'
factors). Effectiveness is more difficult to assess than efficiency since the outcome is influenced by political
choices.
Figure 1: Conceptual Framework of Efficiency and Effectiveness
Source: Mandl et al., 2008.
A common non-parametric technique that has recently started to be commonly applied to expenditure analysis is
Data Envelopment Analysis (DEA).4
DEA is a non-parametric frontier estimation methodology originally
introduced by Charnes et al. (1978) that compares functionally similar entities described by a common set of
multiple numerical attributes. DEA classifies entities into “efficient” or “performers” versus “inefficient” or
“non-performers.” According to the DEA framework, inefficiencies are degrees of deviance from the frontier.
Input inefficiencies show the degree to which inputs must be reduced for an inefficient country to lie on the
efficient practice frontier. Output inefficiencies are the increase in outputs needed for a country to become
efficient. If a particular country either reduces its inputs by the inefficiency values or increases its outputs by the
amount of inefficiency, it can become efficient; that is, it can obtain an efficiency score of one. The criterion for
classification is determined by the location of an entity’s data point with respect to the efficient frontier of the
production possibility set. The classification of any particular entity can be achieved by solving a linear program
(LP).
Various types of DEA models can be used, depending upon the problem at hand. The DEA model we use can be
distinguished by the scale and orientation of the model. If one cannot assume that economies of scale do not
change, then a variable returns- to-scale (VRSTE) type of DEA model, the one selected here, is an appropriate
choice (as opposed to a constant-returns-to-scale, (CRS) model). Furthermore, if in order to achieve better
efficiency, economies’ priorities are to adjust their outputs (before inputs), then an output-oriented DEA model
2
The word benefit is used because economists often distinguish between output and outcome.
3
When measuring efficiency, a distinction can be made between technical and allocative efficiency. Technical efficiency measures the pure
relationship between inputs and outputs taking the production possibility frontier into account. On the other hand, allocative inefficiency
occurs if the distribution of particular public sector outputs is not in accordance with personal preferences (Bailey, 2002).
4
Originating from Farrell’s (1957) seminal work, DEA analysis was originally developed and applied to firms that convert inputs into
outputs (see Coelli et al. (2002) for a number of applications).
TOJET: The Turkish Online Journal of Educational Technology – July 2012, volume 11 Issue 3
Copyright © The Turkish Online Journal of Educational Technology
147
rather than an input-oriented model is appropriate. The way in which the DEA program computes efficiency
scores can be explained briefly using mathematical notation (adapted from Ozcan, 2007). The VRSTE
envelopment formulation is expressed as follows:
For decision making unit 1, xi1≥0 denotes the ith
input value, and yi1≥0 denotes the rth
output value. X1 and
Y1denote, respectively, the vectors of input and output values. Units that lie on (determine) the surface are
deemed efficient in DEA terminology. Units that do not lie on the surface are termed inefficient. Optimal values
of variables for decision making unit 1 are denoted by the s-vector s1
, the m-vector e1
, and the n-vector λ1
.
Table 1: Summary Statistics
Average St. Dev. Min. Max.
Inputs
Information and communication technology
expenditure (% of GDP)
6.0885 0.9366 3.702
(MEX)
7.722
(BUL)
Information and communication technology
expenditure (per capita, in USD)
1,682.4 950.9926 247.416
(SLK)
3,152.654
(USA)
Internet users (per 100 people) 40.3071 18.4235 9.5133
(MEX)
68,43111
(SWE)
International Internet bandwidth (bits per person) 4,722.9 5,756.232 84.81889
(MEX)
21,214.81
(DEN)
Outputs
School enrolment, primary (% gross) 102.972 4.0724 98.7438
(GRE)
119,6688
(POR)
School enrolment, secondary (% gross) 104.6418 13.0841 79.74
(MEX)
133.0922
(BEL)
School enrolment, tertiary (% gross) 59.2622 15.8078 22.7644
(MEX)
87.75778
(FIN)
Teachers per 100 pupils, secondary 8.5925 1.5601 5.2672
(JPN)
12.0387
(POL)
Outcomes
PISA average (2006) 491.2264 34.6888 408.601
(MEX)
552.8498
(FIN)
Labor force with tertiary education (% of total) 24.7961 9.2459 10.7429
(POR)
50.475
(USA)
Sources: World Bank, 2011; UNESCO, 2011; OECD, 2010; own calculations.
Although DEA is a powerful optimization technique that can assess the performance of each country, it has
certain limitations. When one has to deal with large numbers of inputs and outputs, and a small number of
countries are under evaluation, the discriminatory power of the DEA is limited. However, analysts can overcome
this limitation by including only those factors (input and output) that provide the essential components of
“production”, thus avoiding distortion of the DEA results. This is usually done by eliminating one of a pair of
factors that are strongly positively correlated with each other.
In the majority of studies using DEA the data are analysed cross-sectionally, with each decision-making unit
(DMU) – in this case a country – being observed only once. Nevertheless, data on DMUs are often available
over multiple time periods. In such cases, it is possible to perform DEA over time where each DMU in each time
period is treated as if it were a distinct DMU. However, in our case the data set for all the tests in the study
includes average data for the 1999–2007 period (including PISA 2006 average scores) in order to evaluate long-
term efficiency measures as the effects of ICT are characterised by time lags in 27 EU and OECD countries. The
program used for calculating the technical efficiencies is the DEA Frontier software. The data are provided by
the OECD, UNESCO and the World Bank’s World Development Indicators database (for Summary statistics see
Table 1).
TOJET: The Turkish Online Journal of Educational Technology – July 2012, volume 11 Issue 3
Copyright © The Turkish Online Journal of Educational Technology
148
The specification of the outputs and inputs is a crucial first step in DEA since the larger the number of outputs
and inputs included in any DEA, the higher will be the expected proportion of efficient DMUs, and the greater
will be the expected overall average efficiency (Chalos, 1997). Common measures of teaching output in
education used in previous studies are based on graduation and/or completion rates (see Johnes, 1996; Jafarov
and Gunnarsson, 2008), PISA scores (see Afonso and St. Aubyn, 2005; Jafarov and Gunnarsson, 2008), pupil-
teacher ratios and enrolment rates (see Jafarov and Gunnarsson, 2008). Nevertheless, these studies also
demonstrate that DEA is an effective research tool for evaluating the efficiency of ICT and its impact on the
education sector given the varying input mixes and types and numbers of outputs.
In this analysis the data set to evaluate the efficiency of ICT includes input/output/outcome data, i.e. information
and communication technology expenditure (% of GDP)5
, Internet users (per 100 people), teacher-pupil ratio
(secondary), school enrolment, all levels (% gross), labour force with tertiary education (% of total)and the PISA
2006 average score. Up to 28 countries are included in the analysis (selected EU and OECD countries). Different
inputs and outputs/outcomes are tested in four models (see Table 1). In addition, to evaluate the impact of ICT
on education, we calculate partial correlation coefficients for different ICT and education variables.
Table 2: Input and output/outcome set for the DEA
Model Inputs Outputs/Outcomes
I
o Information and communication
technology expenditure (% of
GDP) 1
o PISA average (2006) 2
II
o Information and communication
technology expenditure (% of
GDP)
o Internet users (per 100 people) 1
o PISA average (2006)
o Labour force with tertiary education (%
of total) 1
III
o Information and communication
technology expenditure (% of
GDP)
o Internet users (per 100 people)
o PISA average (2006)
o School enrolment, secondary (% gross) 1
o Teacher-pupil ratio, secondary 3
IV
o Information and communication
technology expenditure (% of
GDP)
o Internet users (per 100 people)
o PISA average (2006)
o School enrolment, primary (% gross) 1
o School enrolment, secondary (% gross)
o School enrolment, tertiary (% gross) 1
Sources: 1
World Bank; 2
UNESCO; 3
OECD.
EMPIRICAL RESULTS
To see whether ICT has any impact on educational outputs and outcomes, we calculate the partial correlations
between different variables, while controlling for the other(s) variable(s) (see Table 3). All educational output
and outcome variables show a weak and positive (but not statistically significant) correlation with ICT
expenditures (in % of GDP) when controlling for the number of Internet users. The impact of the number of
Internet users is strong and positive as the partial coefficient ranges from 0.53 to 0.71. An important ICT variable
which also influences PISA scores is ICT (per capita) as the partial coefficient reached 0.53. There are also some
educational output variables which positively influence the PISA scores, such as the teacher-pupil ratio (primary
and secondary). Nevertheless, the single most important related variable is the quality of the basic
telecommunications infrastructure and broadband penetration. Indeed, a strong ICT infrastructure and its use
alone already have an effect on perceived ICT-induced efficiency improvements but does not guarantee a good
educational performance in itself. The government and policymakers should not be interested in simply
introducing technology into educational institutions, but also in making sure that it is used effectively by teachers
and students in order to enhance educational outputs and outcomes.
Table 3: Partial correlation coefficients
Output/outcome variables Input variables
Completion rate –primary
(n=24)
ICT (GDP) IU
0.012 -0.09
Enrolment rate – ICT (GDP) IIB
5
ICT expenditures include computer hardware (computers, storage devices, printers, and other peripherals); computer software (operating
systems, programming tools, utilities, applications, and internal software development); computer services (information technology
consulting, computer and network systems integration, Web hosting, data processing services, and other services); and communications
services (voice and data communications services) and wired and wireless communications equipment (World Bank, 2011).
TOJET: The Turkish Online Journal of Educational Technology – July 2012, volume 11 Issue 3
Copyright © The Turkish Online Journal of Educational Technology
149
secondary (n=27) 0.005 0.684***
Enrolment rate - tertiary
(n=27)
ICT (GDP) IU
0.083 0.709***
Labour force with tertiary
education (n=27)
ICT (GDP) IU
0.075 0.525***
PISA score
(n=28)
ICT (GDP) IU
0.128 0.687***
PISA scores
(n=27)
ICT (p.c.) T/P
(secondary)
0.530*** 0.292
PISA scores
(n=26)
ICT (p.c.) T/P
(primary)
T/P
(secondary)
0.555*** -0.268 0.339*
PISA scores
(n=23)
ICT (GDP) IU T/P
(primary)
COMPL
(primary)
-0.014 0.701*** 0.410* -0.1724
Note: ***, **, * denote significance at the levels of 1%, 5% and 10%, respectively. ICT (GDP) -
Information and communication technology expenditure (% of GDP); IU - Internet users (per 100
people); ICT (p.c.) - Information and communication technology expenditure (per capita); T/P -
Teacher-pupil ratio; IIB - International Internet bandwidth (bits per person); COMPL - completion rate
(% of relevant age group).
Sources: World Bank, 2011; UNESCO, 2011; OECD, 2010; own calculations.
The results of the output-oriented VRSTE formulation of the DEA analysis (based on Models I–IV in Table 2)
suggest a relatively high level of inefficiency of ICT in selected EU and OECD countries and, correspondingly,
that there is significant room to improve educational outputs and outcomes (see Table 4). Indeed, the empirical
results show that the total number of efficient countries varies significantly from one model to another. There are
only two technically efficient countries in Model I, i.e. Finland and Slovakia. However, at 4.424% of GDP
Slovakia has the lowest level of ICT expenditure (in % of GDP) among all countries in the sample. The least
efficient nations are Bulgaria, Romania and Greece as a result of their relatively low PISA test scores, ranging
from 410 (Romania) to 464 (Greece) (for instance, the EU/OECD group average is around 494). In order to
enhance the reliability of the findings, additional inputs and outputs/outcomes were introduced, resulting in
models II, III and IV (for details also see Table 2).
Adding another input and output in the form (Model II) of Internet users (per 100 people) and labour force with
tertiary education (% of total), respectively, the results show Finland, Iceland, Norway, Slovakia and the USA to
be the technically most efficient countries. Not surprisingly, increasing the number of outputs/outcomes in a
relatively small sample leads to a higher number of efficient countries. In general, the rankings remain relatively
stable in comparison to Model I (with the USA, Italy, Poland and Iceland being the only significant exceptions).6
Model III includes additional output/outcome variables to PISA scores, i.e. school enrolment (secondary) and
teacher-pupil ratio (secondary). According to this model there are two additional efficient nations, i.e. Belgium
and Poland. Interestingly, the biggest improvement in the ranking is shown by Denmark, with one of the highest
levels of school enrolment (secondary) averages accounting for around 125% in the 1999–2007 period (the
EU/OECD average is around 106%). In order to become an efficient nation, selected countries should
significantly increase the level of their PISA scores (particularly in Romania), the level of their school enrolment
(secondary) (particularly in highly populated countries, such as Korea and the USA), and the teacher-pupil ratio
(secondary) (in Japan, Sweden and the UK).
Table 4: DEA results for ICT efficiency in selected OECD and EU countries
No. Country Model I Model II Model III Model IV
VRSTE Rank VRSTE Rank VRSTE Rank VRSTE Rank
1 Australia 1.06339 7 n.a. n.a. n.a. n.a. n.a. n.a.
2 Austria 1.10092 13 1.06040 13 1.05115 21 1.03784 22
3 Belgium 1.08288 9 1.01999 7 1.00000 1 1.00000 1
6
These ranking changes resulted from the relatively high level of labour force with a tertiary education (in the USA and Iceland) and
relatively small number of Internet users (in Italy and Poland).
TOJET: The Turkish Online Journal of Educational Technology – July 2012, volume 11 Issue 3
Copyright © The Turkish Online Journal of Educational Technology
150
4 Bulgaria 1.32790 27 n.a. n.a. 1.00000 1 1.00000 1
5 Czech R. 1.10171 14 1.00869 6 1.00596 8 1.00258 13
6 Denmark 1.10320 16 1.10320 21 1.01339 10 1.02449 19
7 Finland 1.00000 1 1.00000 1 1.00000 1 1.00000 1
8 France 1.12181 19 1.03470 9 1.02663 18 1.01070 16
9 Germany 1.09520 11 n.a. n.a. 1.02570 17 1.04204 23
10 Greece 1.19124 25 n.a. n.a. 1.02556 16 1.00000 1
11 Hungary 1.12273 20 1.08677 19 1.02372 14 1.02153 18
12 Iceland 1.11989 18 1.00000 1 1.02275 13 1.01361 17
13 Italy 1.17995 24 1.05702 12 1.11064 25 1.07881 26
14 Japan 1.06834 8 1.08181 18 1.04171 20 1.03091 21
15 Korea 1.02025 4 1.06586 15 1.00656 9 1.00000 1
16 Netherlands 1.06163 6 1.06163 14 1.03030 19 1.00000 1
17 New Zealand 1.05411 5 1.04909 11 1.00000 1 1.02618 20
18 Norway 1.01909 3 1.00000 1 1.00000 1 1.00000 1
19 Poland 1.10506 17 1.00507 5 1.00000 1 1.00000 1
20 Portugal 1.17397 23 1.07200 16 1.05337 22 1.00000 1
21 Romania 1.31120 26 1.18268 22 1.10368 24 1.00293 1
22 Slovakia 1.00000 1 1.00000 1 1.00000 1 1.00000 1
23 Slovenia 1.09282 10 1.02316 8 1.02193 12 1.00473 15
24 Spain 1.16046 22 1.04906 10 1.01584 11 1.00000 1
25 Sweden 1.09620 12 1.09620 20 1.02507 15 1.00000 1
26 UK 1.10181 15 1.07618 17 1.07807 23 1.04406 24
27 USA 1.14787 21 1.00000 1 1.12480 26 1.05256 25
Number of efficient
countries 2 5 7 12
Mean 1.11199 1.04928 1.03103 1.01511
Std. dev. 0.078309 0.045084 0.036037 0.021181
Note: Relative efficiency scores (models I–IV; see Table 2). Twenty-seven countries are included in
the analysis (Mexico is excluded as an outlier).
Sources: World Bank, 2011; UNESCO, 2011; OECD, 2010; own calculations.
In terms of the efficiency scores for ICT in Model IV, up to 12 of the analysed countries are labelled efficient
(see Table 4). The average output efficiency score is 1.01511, meaning that the average country could increase
its outputs/outcomes by around 1.5% if it were efficient. The worst efficiency performers are Italy, the USA and
the UK, with the last two having well above-average ICT expenditures and Internet users (per 100 people) and
well below-average PISA scores (in the USA), school enrolment (primary and secondary) (in the USA) and
school enrolment (tertiary) (in the UK). On the other hand, Italy has below-average levels of its inputs and
outputs/outcomes and therefore an increase in ICT expenditures and Internet users alongside a significant
efficiency improvement is needed in the county. Indeed, all three countries should increase their outputs by 4.4%
to 7.9 in order to become an efficient.
According to the above empirical analysis, it is obvious that the use of ICT in many of the countries considered
suffers from relatively low technical efficiency. This inefficiency is particularly highlighted in some highly
developed OECD members, i.e. the USA, the UK and Austria (see Table 5). Since all of these countries use
significantly above-average ICT resources, it will be crucial for them to increase their educational outputs and
outcomes. On the other hand, Italy, France and Hungary reveal low efficiency despite using a relatively low
level of ICT inputs. Hence, an improvement of the efficiency of ICT, which could significantly contribute to a
country’s stronger development and growth should therefore be a top priority in the near future for most
countries, particularly those in the third and fourth quartiles.
Table 5: Relative Efficiency of ICT in Selected OECD and EU countries
(Distribution by quartiles of the ranking of efficiency scores in three models)
Note: Relative efficiency scores (models I - IV; see Table 2). Twenty-seven countries are included in the
analysis.
Sources: World Bank, 2011; UNESCO, 2011; OECD, 2010; own calculations.
1st
quartile 2nd
quartile 3rd
quartile 4th
quartile
Finland
Slovakia
Norway
Belgium
Korea
Poland
Netherlands
New Zealand
Sweden
Bulgaria
Spain
Czech R.
Slovenia
Greece
Denmark
Portugal
Iceland
Japan
Germany
Romania
Hungary
France
Austria
UK
USA
Italy
TOJET: The Turkish Online Journal of Educational Technology – July 2012, volume 11 Issue 3
Copyright © The Turkish Online Journal of Educational Technology
151
CONCLUSIONS
The empirical results show that the efficiency of ICT, when taking educational outputs/outcomes into
consideration, differs significantly across the great majority of EU and OECD countries. The analysis of the
varying levels of (output-oriented) efficiency (under the VRS framework) shows that Finland, Norway, Belgium
and Korea are the most efficient countries in terms of their ICT sectors (when considering educational
output/outcome). The empirical results also suggest that, in general, some less developed EU countries such as
Slovakia and Poland show a relatively high level of ICT efficiency due to the low level of their ICT inputs.
Therefore, a significant increase in ICT expenditures is needed in those countries. All in all, the analysis finds
evidence that most of the countries under consideration hold great potential for increased efficiency in ICT and
for improving their educational outputs and outcomes.
However, a few limitations of the presented empirical study should be pointed out. Firstly, the application of the
presented techniques is hampered by a lack of suitable data. Quality data are called for because the techniques
available to measure efficiency are sensitive to outliers and may be influenced by exogenous factors. Secondly,
the precise definition of inputs, outputs and outcomes may significantly influence the results. Finally, it seems
important to bear in mind that by using a non-parametric approach, and in spite of DEA being an established and
valid methodology, differences across countries are not statistically assessed and this may be considered a
limitation of the methodology. Hence, further research is clearly needed to eliminate the above deficiencies, in
particular to test the influence of environmental factors on ICT efficiency.
REFERENCES
Afonso, A., & St. Aubyn, M. (2005). Non-parametric approaches to education and health efficiency in Oecd
countries. Journal of Applied Economics, 8(2): 227-246.
Afonso, A., & St. Aubyn, M. (2006a). Cross-country efficiency of secondary education provision: a semi-
parametric analysis with non-discretionary inputs. Economic Modelling, 23(3): 476-491.
Afonso, A., & St. Aubyn, M. (2006b). Relative efficiency of health provision: a DEA approach with non-
discretionary inputs. ISEG-UTL, Department of Economics Working Paper nº 33/2006/DE/UECE.
Amjad, R. 2006. Why Pakistan must break-into the knowledge economy. Lahore Journal of Economics, Special
Edition, September 2006.
Bailey, S. J. (2002). Public Sector Economics: Theory, Policy and Practice. London: Palgrave Macmillan.
Balanskat, A., Blamire, R., & Kefala, S. (2006). The ICT impact report: a review of studies of ICT impact on
schools in Europe. Brussels: European Schoolnet.
Becta. (2006). The Becta Review 2006: Evidence on the progress of ICT in education’, UK: Becta. Retrieved
March 01, 2012 from http://becta.org.uk/corporate/publications/documents/The_Becta_Review_2006.pdf
Chalos, P. (1997). An examination of budgetary inefficiency in education using data envelopment analysis.
Financial Accountability & Management, 13(1): 55–69.
Charnes, A., Cooper, W., & Rhodes, E. (1978). Measuring efficiency of decision-making units. European
Journal of Operational Research, 33: 429-444.
Clements, B. (2002). How efficient is education spending in Europe? European Review of Economics and
Finance, 1: 3-26.
Coelli T., Rao, D., & Battese, G. (2002). An introduction to efficiency and productivity analysis. 6th edition,
Massachusetts, Kluwer Academic Publishers.
Cox, M., J., & Marshall, G. M. (2007). Effects of ICT: do we know what we should know?’, Education and
Information Technologies, 12: 59–70.
Empirica. (2006). Benchmarking access and use of ICT in European schools 2006. Bonn: Empirica. Retrieved
February 02, 2012 from http://www.empirica.com/publikationen/documents/No08-2006_learnInd.pdf
Fuchs, T., & Woessmann, L. (2004). Computers and student learning: bivariate and multivariate evidence on the
availability and use of computers at home and at school, CESifo Working Paper. No. 1321. November.
Munich.
Goolsbee, A., & Guryan, J. (2002). The impact of internet subsidies in public schools, NBER Working Papers
9090, National Bureau of Economic Research, Inc.
Gülbahar, Y., (2008). ICT usage in higher education: a case study on preservice teachers and instructors, The
Turkish Online Journal of Educational Technology, 7(1): 32-37.
Gupta, S., & Verhoeven, M. (2001). The efficiency of government expenditure: experiences from Africa.
Journal of Policy Modelling, 23: 433-467.
Hameed, T. (2006). ICT as an enabler for socio-economic development. Digital Opportunity Forum 2006,
International Telecommunication Union, Seoul: Korea. Retrieved January 26, 2012, from
http://www.itu.int/osg/spu/digitalbridges/materials/hameed-paper.pdf
TOJET: The Turkish Online Journal of Educational Technology – July 2012, volume 11 Issue 3
Copyright © The Turkish Online Journal of Educational Technology
152
Iqbal, M. J., & Ahmed, M. (2010). Enhancing quality of education through e-learning: the case study of Allama
Iqbal Open University. The Turkish Online Journal of Distance Education, 11(1). Retrieved January 16,
2012 from https://tojde.anadolu.edu.tr/tojde37/articles/article_5.htm
Jafarov, E., & Gunnarsson, V. (2008). Government spending on health care and education in Croatia: efficiency
and reform options; International Monetary Fund; IMF Working Paper; WP/08/136.
Jayson, W. R. (2008). ICT in education reform in Cambodia: problems, politics, and policies impacting
implementation. Information Technologies and International Development, 4(4): 67–82.
Johnes, J. (1996). Performance assessment in higher education in Britain. Eur. J. Oper. Res., 89, 18-33.
Kang, M., Heo, H., Jo, I, Shin, J., Seo, J., & Shin, S. (2008). The new millennium learners and educational
performance: the 2nd year report. Technical report. KERIS
Khan, A. M., & Shah, Q. A. (2004). Study on impact of information and communication technology on decent
work in Pakistan. Islamabad: Pakistan Manpower Institute, Ministry of Labour Manpower & Overseas
Pakistanis, Government of Pakistan.
Kirpatrick, H., & L. Cuban. (1998). Computers make kids smarter--right? Technos Quarterly for Education and
Technology, 7, 2.
Klun, M., (2004). Performance measurement for tax administrations: the case of Slovenia. International Review
of Administrative Sciences, 70(3): 567-574.
Kozma, R. (2003). Technology and classroom practices: an international study, Journal of Research on
Technology in Education, 36(1): 1–14.
Kozma, R. B. (2008). Comparative analysis of policies for ICT in education. Center for Technology in Learning,
SRI International (to appear in the International Handbook on Information Technology in Education).
Kulik, J. (2003). The effects of using instructional technology in elementary and secondary schools: what
controlled evaluation studies say. Menlo Park, CA: SRI International.
Leuven, E., Lindahl, M., Oosterbeek, H., & Webbink, D. (2004). The effect of extra funding for disadvantaged
pupils on achievement. IZA Discussion Paper. No. 1122. Bonn: Institute for the Study of Labor.
Machin, S., McNally, S., & Silva, O. (2006). New technologies in schools: is there a pay off? London: Centre for
Economic Performance; Bonn: Institute for the Study of Labour.
Mandl, U., Dierx A., & Ilzkovitz, F. (2008). The effectiveness and efficiency of public spending. European
Commission, Economic Papers 31, February.
Markovic, R. M. (2009). Education through E-learning: Case of Serbia . Journal of Business Economics and
Management, 10(4), 313-319.
OECD. (2010). Education at glance 2010. OECD indicators. Retrieved February 21, 2012 from
http://www.oecd.org/document/52/0,3343,en_2649_39263238_45897844_1_1_1_1,00.html
Ozcan, Y. A. (2007). Health Care Benchmarking and Performance Evaluation: An Assessment using Data
Envelopment Analysis (DEA). New York: Springer.
Pelgrum, W.J., & Anderson, R.A. (Eds) (1999). ICT and the merging paradigm for life-long learning: A
worldwide assessment of infrastructure, goals and practices. Amsterdam: International Association for
the Evaluation of Educational Achievement.
Shaheeda, J., Dick, N., & Laura, C. (2007). The role of ICTs in higher education in South Africa: One strategy
for addressing teaching and learning challenges. International Journal of Education and Development
using Information and Communication Technology. 3(4): 131-142.
Shaikh, Z. A. (2009). Usage, acceptance, adoption, and diffusion of information and communication
technologies in higher education: a measurement of critical factors. Journal of Information Technology
Impact (JITI), 9(2): 63-80.
Shaikh, Z., A., & Khoja, S. A. (2011). Role of ICT in shaping the future of Pakistani higher education system.
The Turkish Online Journal of Educational Technology, 10(1): 149-161.
St. Aubyn, M. (2003). Evaluating efficiency in the Portuguese education sector. Economia, 26, 25-51.
Tondeur, J., van Braak, J., & Valcke, M. (2007). Towards a typology of computer use in primary education.
Journal of Computer Assisted Learning, 23, 197-206.
Trucano, M. (2005). Knowledge maps: ICT in education, Washington, DC: infoDev/World Bank.
Unesco. (2011). Data centre, Montreal: UNESCO Institute for Statistics, On-line.
Verma, A., & Gavirneni, S. (2006). Measuring police efficiency in India: an application of data envelopment
analysis. Policing: An International Journal of Police Strategies & Management, 29(1): 125-145.
World Bank. (2011). World development indicators, On-line.
Youssef, B., A., & Dahmani, M. (2008). Student's performances and ICTs, University and Knowledge Society
Journal (RUSC), March 2008, 45-56.
Yusuf, M. O., & Afolabi, A. O. (2010). Effects of computer assisted instruction (cai) on secondary school
students’ performance in biology. The Turkish Online Journal of Educational Technology, 9(1): 62-69.

Mais conteúdo relacionado

Mais procurados

Role of ICT in Shaping the Future of Pakistani Higher Education System
Role of ICT in Shaping the Future of Pakistani Higher Education SystemRole of ICT in Shaping the Future of Pakistani Higher Education System
Role of ICT in Shaping the Future of Pakistani Higher Education SystemZaffar Ahmed Shaikh
 
Ict competence among academic staff in universities
Ict competence among academic staff in universitiesIct competence among academic staff in universities
Ict competence among academic staff in universitiesTariq Ghayyur
 
Assessment of usage of information and communication technology among graduat...
Assessment of usage of information and communication technology among graduat...Assessment of usage of information and communication technology among graduat...
Assessment of usage of information and communication technology among graduat...Tariq Ghayyur
 
Capacity building for 21st century learning in secondary schools in Africa
Capacity building for 21st century learning in secondary schools in AfricaCapacity building for 21st century learning in secondary schools in Africa
Capacity building for 21st century learning in secondary schools in AfricaVrije Universiteit Brussel
 
Availability and utilization of information and communication technology ict...
Availability and utilization of information and communication technology  ict...Availability and utilization of information and communication technology  ict...
Availability and utilization of information and communication technology ict...Gambari Isiaka
 
Use of ICT in Education in Pakistan
Use of ICT in Education in PakistanUse of ICT in Education in Pakistan
Use of ICT in Education in PakistanAbdul Ghafoor Mangi
 
Towards a Framework for ICTs Integration in Teacher Education in India
Towards a Framework for ICTs Integration in Teacher Education in IndiaTowards a Framework for ICTs Integration in Teacher Education in India
Towards a Framework for ICTs Integration in Teacher Education in IndiaPremier Publishers
 
Course outline of ict 3rd semester ade
Course outline of ict 3rd semester adeCourse outline of ict 3rd semester ade
Course outline of ict 3rd semester adeaalipalh
 
The Impact of ICT on Schools
The Impact of ICT on SchoolsThe Impact of ICT on Schools
The Impact of ICT on SchoolsIOSRJBM
 
Integrating ict as an integral teaching and learning tool into pre
Integrating ict as an integral teaching and learning tool into preIntegrating ict as an integral teaching and learning tool into pre
Integrating ict as an integral teaching and learning tool into presyed ahmed
 
Application of ICT for Effective performance in Teachin and Learning
Application of ICT for Effective performance in Teachin and LearningApplication of ICT for Effective performance in Teachin and Learning
Application of ICT for Effective performance in Teachin and Learningshehu ringim
 
Impact of computer education on students interest and performance in automobi...
Impact of computer education on students interest and performance in automobi...Impact of computer education on students interest and performance in automobi...
Impact of computer education on students interest and performance in automobi...Alexander Decker
 
Use of ict for effective teaching and learning
Use of ict for effective teaching and learningUse of ict for effective teaching and learning
Use of ict for effective teaching and learningAjith Janardhanan T J
 
Impact Of Technology In Education Final Draft
Impact Of Technology In Education Final DraftImpact Of Technology In Education Final Draft
Impact Of Technology In Education Final Draftloraevanouski
 
Exploring ICT Integration in Foreign Language Teaching and Learning in an Ind...
Exploring ICT Integration in Foreign Language Teaching and Learning in an Ind...Exploring ICT Integration in Foreign Language Teaching and Learning in an Ind...
Exploring ICT Integration in Foreign Language Teaching and Learning in an Ind...Teddy Fiktorius
 
integrating ICT into teaching and learning in Malaysian school
integrating ICT into teaching and learning in Malaysian schoolintegrating ICT into teaching and learning in Malaysian school
integrating ICT into teaching and learning in Malaysian schoolwiwie08
 

Mais procurados (20)

Role of ICT in Shaping the Future of Pakistani Higher Education System
Role of ICT in Shaping the Future of Pakistani Higher Education SystemRole of ICT in Shaping the Future of Pakistani Higher Education System
Role of ICT in Shaping the Future of Pakistani Higher Education System
 
Ict competence among academic staff in universities
Ict competence among academic staff in universitiesIct competence among academic staff in universities
Ict competence among academic staff in universities
 
Assessment of usage of information and communication technology among graduat...
Assessment of usage of information and communication technology among graduat...Assessment of usage of information and communication technology among graduat...
Assessment of usage of information and communication technology among graduat...
 
Capacity building for 21st century learning in secondary schools in Africa
Capacity building for 21st century learning in secondary schools in AfricaCapacity building for 21st century learning in secondary schools in Africa
Capacity building for 21st century learning in secondary schools in Africa
 
Integrating ICT into Teaching Learning
Integrating ICT into Teaching LearningIntegrating ICT into Teaching Learning
Integrating ICT into Teaching Learning
 
602631
602631602631
602631
 
Availability and utilization of information and communication technology ict...
Availability and utilization of information and communication technology  ict...Availability and utilization of information and communication technology  ict...
Availability and utilization of information and communication technology ict...
 
Use of ICT in Education in Pakistan
Use of ICT in Education in PakistanUse of ICT in Education in Pakistan
Use of ICT in Education in Pakistan
 
Towards a Framework for ICTs Integration in Teacher Education in India
Towards a Framework for ICTs Integration in Teacher Education in IndiaTowards a Framework for ICTs Integration in Teacher Education in India
Towards a Framework for ICTs Integration in Teacher Education in India
 
Course outline of ict 3rd semester ade
Course outline of ict 3rd semester adeCourse outline of ict 3rd semester ade
Course outline of ict 3rd semester ade
 
The Impact of ICT on Schools
The Impact of ICT on SchoolsThe Impact of ICT on Schools
The Impact of ICT on Schools
 
The ICT Used by the English Lecturers for Non English Study Program Students ...
The ICT Used by the English Lecturers for Non English Study Program Students ...The ICT Used by the English Lecturers for Non English Study Program Students ...
The ICT Used by the English Lecturers for Non English Study Program Students ...
 
Qualitative research
Qualitative researchQualitative research
Qualitative research
 
Integrating ict as an integral teaching and learning tool into pre
Integrating ict as an integral teaching and learning tool into preIntegrating ict as an integral teaching and learning tool into pre
Integrating ict as an integral teaching and learning tool into pre
 
Application of ICT for Effective performance in Teachin and Learning
Application of ICT for Effective performance in Teachin and LearningApplication of ICT for Effective performance in Teachin and Learning
Application of ICT for Effective performance in Teachin and Learning
 
Impact of computer education on students interest and performance in automobi...
Impact of computer education on students interest and performance in automobi...Impact of computer education on students interest and performance in automobi...
Impact of computer education on students interest and performance in automobi...
 
Use of ict for effective teaching and learning
Use of ict for effective teaching and learningUse of ict for effective teaching and learning
Use of ict for effective teaching and learning
 
Impact Of Technology In Education Final Draft
Impact Of Technology In Education Final DraftImpact Of Technology In Education Final Draft
Impact Of Technology In Education Final Draft
 
Exploring ICT Integration in Foreign Language Teaching and Learning in an Ind...
Exploring ICT Integration in Foreign Language Teaching and Learning in an Ind...Exploring ICT Integration in Foreign Language Teaching and Learning in an Ind...
Exploring ICT Integration in Foreign Language Teaching and Learning in an Ind...
 
integrating ICT into teaching and learning in Malaysian school
integrating ICT into teaching and learning in Malaysian schoolintegrating ICT into teaching and learning in Malaysian school
integrating ICT into teaching and learning in Malaysian school
 

Destaque

Role of ict in education a case of indira college
Role of ict in education a case of indira collegeRole of ict in education a case of indira college
Role of ict in education a case of indira collegeIAEME Publication
 
e-Learning in Higher Education
e-Learning in Higher Educatione-Learning in Higher Education
e-Learning in Higher EducationMartin Ebner
 
Talk to MOE educators@Singapore Science Centre for Animate@South Zone
Talk to MOE educators@Singapore Science Centre for Animate@South ZoneTalk to MOE educators@Singapore Science Centre for Animate@South Zone
Talk to MOE educators@Singapore Science Centre for Animate@South ZoneJames Chan
 
Impact of ICT in Education: Evidence and Future Direction
Impact of ICT in Education: Evidence and Future DirectionImpact of ICT in Education: Evidence and Future Direction
Impact of ICT in Education: Evidence and Future DirectionOystein Johannessen
 
The impact of information and communication technology (ict) on teacher educa...
The impact of information and communication technology (ict) on teacher educa...The impact of information and communication technology (ict) on teacher educa...
The impact of information and communication technology (ict) on teacher educa...Tariq Ghayyur
 
Perspectives on e-Education (e-Learning)
Perspectives on e-Education (e-Learning)Perspectives on e-Education (e-Learning)
Perspectives on e-Education (e-Learning)Howard Gaukrodger
 
Advantages of elearning summary
Advantages of elearning summaryAdvantages of elearning summary
Advantages of elearning summaryCourtnie Ellis
 
Importance of e learning
Importance of e learningImportance of e learning
Importance of e learningAtif Chauhdary
 
Impact ict to education
Impact ict to educationImpact ict to education
Impact ict to educationCt Muna
 
The contribution of science and technology education to nigera
The contribution of science and technology education to nigeraThe contribution of science and technology education to nigera
The contribution of science and technology education to nigeraAlexander Decker
 
The impact of ICT in education
The impact of ICT in educationThe impact of ICT in education
The impact of ICT in educationIngrid Noguera
 
ICT in Education
ICT in EducationICT in Education
ICT in EducationOllie Bray
 
Impact of ict in education
Impact of ict in educationImpact of ict in education
Impact of ict in educationSanika Deshmukh
 

Destaque (18)

Impact of ict on learning
Impact of ict on learningImpact of ict on learning
Impact of ict on learning
 
Role of ict in education a case of indira college
Role of ict in education a case of indira collegeRole of ict in education a case of indira college
Role of ict in education a case of indira college
 
Falke amaan
Falke amaanFalke amaan
Falke amaan
 
e-Learning in Higher Education
e-Learning in Higher Educatione-Learning in Higher Education
e-Learning in Higher Education
 
Talk to MOE educators@Singapore Science Centre for Animate@South Zone
Talk to MOE educators@Singapore Science Centre for Animate@South ZoneTalk to MOE educators@Singapore Science Centre for Animate@South Zone
Talk to MOE educators@Singapore Science Centre for Animate@South Zone
 
Impact of ICT in Education: Evidence and Future Direction
Impact of ICT in Education: Evidence and Future DirectionImpact of ICT in Education: Evidence and Future Direction
Impact of ICT in Education: Evidence and Future Direction
 
ICT IMPACT BY SAMIRA
ICT IMPACT BY SAMIRAICT IMPACT BY SAMIRA
ICT IMPACT BY SAMIRA
 
The impact of information and communication technology (ict) on teacher educa...
The impact of information and communication technology (ict) on teacher educa...The impact of information and communication technology (ict) on teacher educa...
The impact of information and communication technology (ict) on teacher educa...
 
Perspectives on e-Education (e-Learning)
Perspectives on e-Education (e-Learning)Perspectives on e-Education (e-Learning)
Perspectives on e-Education (e-Learning)
 
What are the benefits of Elearning?
What are the benefits of Elearning?What are the benefits of Elearning?
What are the benefits of Elearning?
 
Advantages of elearning summary
Advantages of elearning summaryAdvantages of elearning summary
Advantages of elearning summary
 
Importance of e learning
Importance of e learningImportance of e learning
Importance of e learning
 
Impact ict to education
Impact ict to educationImpact ict to education
Impact ict to education
 
The contribution of science and technology education to nigera
The contribution of science and technology education to nigeraThe contribution of science and technology education to nigera
The contribution of science and technology education to nigera
 
E learning-for-education
E learning-for-educationE learning-for-education
E learning-for-education
 
The impact of ICT in education
The impact of ICT in educationThe impact of ICT in education
The impact of ICT in education
 
ICT in Education
ICT in EducationICT in Education
ICT in Education
 
Impact of ict in education
Impact of ict in educationImpact of ict in education
Impact of ict in education
 

Semelhante a The impact of ict on educational performance and its

THE IMPACT OF TECHNOLOGY INTEGRATION IN TEACHING AND LEARNING
THE IMPACT OF TECHNOLOGY INTEGRATION IN TEACHING AND LEARNINGTHE IMPACT OF TECHNOLOGY INTEGRATION IN TEACHING AND LEARNING
THE IMPACT OF TECHNOLOGY INTEGRATION IN TEACHING AND LEARNINGSIR SUCCESS PRINCE DUAH MENSAH
 
Lecturers' Attitudes towards Integration of E-Learning in Higher Education. C...
Lecturers' Attitudes towards Integration of E-Learning in Higher Education. C...Lecturers' Attitudes towards Integration of E-Learning in Higher Education. C...
Lecturers' Attitudes towards Integration of E-Learning in Higher Education. C...IJCSIS Research Publications
 
Technology enhancing learning: analysing uses of information and communicatio...
Technology enhancing learning: analysing uses of information and communicatio...Technology enhancing learning: analysing uses of information and communicatio...
Technology enhancing learning: analysing uses of information and communicatio...syaabdulrahman
 
PREPARING STUDENT TEACHERS TO TEACH WITH TECHNOLOGY: CASE STUDIES IN FINLAND ...
PREPARING STUDENT TEACHERS TO TEACH WITH TECHNOLOGY: CASE STUDIES IN FINLAND ...PREPARING STUDENT TEACHERS TO TEACH WITH TECHNOLOGY: CASE STUDIES IN FINLAND ...
PREPARING STUDENT TEACHERS TO TEACH WITH TECHNOLOGY: CASE STUDIES IN FINLAND ...IJITE
 
Preparing Student Teachers to Teach with Technology: Case Studies in Finland ...
Preparing Student Teachers to Teach with Technology: Case Studies in Finland ...Preparing Student Teachers to Teach with Technology: Case Studies in Finland ...
Preparing Student Teachers to Teach with Technology: Case Studies in Finland ...IJITE
 
Factors influencing the adoption of e learning in jordan
Factors influencing the adoption of e learning in jordanFactors influencing the adoption of e learning in jordan
Factors influencing the adoption of e learning in jordanAlexander Decker
 
USE OF ICT IN EDUCATION ONLINE COMPUTER BASED TEST
USE OF ICT IN EDUCATION ONLINE COMPUTER BASED TESTUSE OF ICT IN EDUCATION ONLINE COMPUTER BASED TEST
USE OF ICT IN EDUCATION ONLINE COMPUTER BASED TESTEditor IJMTER
 
Student teachers’ first reflections on information
Student teachers’ first reflections on informationStudent teachers’ first reflections on information
Student teachers’ first reflections on informationPamela Vásquez Costales
 
Supportive and hindering factors to a sustainable implementation
Supportive and hindering factors to a sustainable implementationSupportive and hindering factors to a sustainable implementation
Supportive and hindering factors to a sustainable implementationandrianyayan
 
Supportive and hindering factors to a sustainable implementation
Supportive and hindering factors to a sustainable implementationSupportive and hindering factors to a sustainable implementation
Supportive and hindering factors to a sustainable implementationandrianyayan
 
COMPUTER USE BY SECONDARY SCHOOL PRINCIPALS
COMPUTER USE BY SECONDARY SCHOOL PRINCIPALSCOMPUTER USE BY SECONDARY SCHOOL PRINCIPALS
COMPUTER USE BY SECONDARY SCHOOL PRINCIPALSsyaabdulrahman
 
Information & communication technology
Information & communication technology  Information & communication technology
Information & communication technology Omkar Rane
 
ICT and the changing role of the teacher
ICT and the changing role of the teacherICT and the changing role of the teacher
ICT and the changing role of the teacherSteve Wheeler
 
Demographic implications for the user perceptions of e-learning in higher edu...
Demographic implications for the user perceptions of e-learning in higher edu...Demographic implications for the user perceptions of e-learning in higher edu...
Demographic implications for the user perceptions of e-learning in higher edu...Tariq Ghayyur
 
Role of ict in shaping the future of pakistani higher education
Role of ict in shaping the future of pakistani higher educationRole of ict in shaping the future of pakistani higher education
Role of ict in shaping the future of pakistani higher educationTariq Ghayyur
 

Semelhante a The impact of ict on educational performance and its (20)

THE IMPACT OF TECHNOLOGY INTEGRATION IN TEACHING AND LEARNING
THE IMPACT OF TECHNOLOGY INTEGRATION IN TEACHING AND LEARNINGTHE IMPACT OF TECHNOLOGY INTEGRATION IN TEACHING AND LEARNING
THE IMPACT OF TECHNOLOGY INTEGRATION IN TEACHING AND LEARNING
 
Lecturers' Attitudes towards Integration of E-Learning in Higher Education. C...
Lecturers' Attitudes towards Integration of E-Learning in Higher Education. C...Lecturers' Attitudes towards Integration of E-Learning in Higher Education. C...
Lecturers' Attitudes towards Integration of E-Learning in Higher Education. C...
 
Technology enhancing learning: analysing uses of information and communicatio...
Technology enhancing learning: analysing uses of information and communicatio...Technology enhancing learning: analysing uses of information and communicatio...
Technology enhancing learning: analysing uses of information and communicatio...
 
PREPARING STUDENT TEACHERS TO TEACH WITH TECHNOLOGY: CASE STUDIES IN FINLAND ...
PREPARING STUDENT TEACHERS TO TEACH WITH TECHNOLOGY: CASE STUDIES IN FINLAND ...PREPARING STUDENT TEACHERS TO TEACH WITH TECHNOLOGY: CASE STUDIES IN FINLAND ...
PREPARING STUDENT TEACHERS TO TEACH WITH TECHNOLOGY: CASE STUDIES IN FINLAND ...
 
PREPARING STUDENT TEACHERS TO TEACH WITH TECHNOLOGY: CASE STUDIES IN FINLAND ...
PREPARING STUDENT TEACHERS TO TEACH WITH TECHNOLOGY: CASE STUDIES IN FINLAND ...PREPARING STUDENT TEACHERS TO TEACH WITH TECHNOLOGY: CASE STUDIES IN FINLAND ...
PREPARING STUDENT TEACHERS TO TEACH WITH TECHNOLOGY: CASE STUDIES IN FINLAND ...
 
Preparing Student Teachers to Teach with Technology: Case Studies in Finland ...
Preparing Student Teachers to Teach with Technology: Case Studies in Finland ...Preparing Student Teachers to Teach with Technology: Case Studies in Finland ...
Preparing Student Teachers to Teach with Technology: Case Studies in Finland ...
 
Factors influencing the adoption of e learning in jordan
Factors influencing the adoption of e learning in jordanFactors influencing the adoption of e learning in jordan
Factors influencing the adoption of e learning in jordan
 
USE OF ICT IN EDUCATION ONLINE COMPUTER BASED TEST
USE OF ICT IN EDUCATION ONLINE COMPUTER BASED TESTUSE OF ICT IN EDUCATION ONLINE COMPUTER BASED TEST
USE OF ICT IN EDUCATION ONLINE COMPUTER BASED TEST
 
Student teachers’ first reflections on information
Student teachers’ first reflections on informationStudent teachers’ first reflections on information
Student teachers’ first reflections on information
 
Supportive and hindering factors to a sustainable implementation
Supportive and hindering factors to a sustainable implementationSupportive and hindering factors to a sustainable implementation
Supportive and hindering factors to a sustainable implementation
 
B0352011017
B0352011017B0352011017
B0352011017
 
Supportive and hindering factors to a sustainable implementation
Supportive and hindering factors to a sustainable implementationSupportive and hindering factors to a sustainable implementation
Supportive and hindering factors to a sustainable implementation
 
COMPUTER USE BY SECONDARY SCHOOL PRINCIPALS
COMPUTER USE BY SECONDARY SCHOOL PRINCIPALSCOMPUTER USE BY SECONDARY SCHOOL PRINCIPALS
COMPUTER USE BY SECONDARY SCHOOL PRINCIPALS
 
Information & communication technology
Information & communication technology  Information & communication technology
Information & communication technology
 
ICT and the changing role of the teacher
ICT and the changing role of the teacherICT and the changing role of the teacher
ICT and the changing role of the teacher
 
Demographic implications for the user perceptions of e-learning in higher edu...
Demographic implications for the user perceptions of e-learning in higher edu...Demographic implications for the user perceptions of e-learning in higher edu...
Demographic implications for the user perceptions of e-learning in higher edu...
 
Article 1
Article 1Article 1
Article 1
 
School based computer
School based computerSchool based computer
School based computer
 
Role of ict in shaping the future of pakistani higher education
Role of ict in shaping the future of pakistani higher educationRole of ict in shaping the future of pakistani higher education
Role of ict in shaping the future of pakistani higher education
 
Identification of a framework for implementing ICT in Sri Lankan secondary ed...
Identification of a framework for implementing ICT in Sri Lankan secondary ed...Identification of a framework for implementing ICT in Sri Lankan secondary ed...
Identification of a framework for implementing ICT in Sri Lankan secondary ed...
 

Mais de Tariq Ghayyur

Comparative education
Comparative educationComparative education
Comparative educationTariq Ghayyur
 
Approaches to the study of comparative education by tariq ghayyur
Approaches to the study of comparative education by tariq ghayyurApproaches to the study of comparative education by tariq ghayyur
Approaches to the study of comparative education by tariq ghayyurTariq Ghayyur
 
Concept of literacy by tariq ghayyur
Concept of literacy by tariq ghayyurConcept of literacy by tariq ghayyur
Concept of literacy by tariq ghayyurTariq Ghayyur
 
Internet search techniques by tariq ghayyur1
Internet search techniques by tariq ghayyur1Internet search techniques by tariq ghayyur1
Internet search techniques by tariq ghayyur1Tariq Ghayyur
 
Information and digital competence in higher education
Information and digital competence in higher educationInformation and digital competence in higher education
Information and digital competence in higher educationTariq Ghayyur
 
E learning-opportunities-&-prospects-in-higher
E learning-opportunities-&-prospects-in-higherE learning-opportunities-&-prospects-in-higher
E learning-opportunities-&-prospects-in-higherTariq Ghayyur
 
Ict in higher education review of literature from 2004 2011
Ict in higher education review of literature from 2004 2011Ict in higher education review of literature from 2004 2011
Ict in higher education review of literature from 2004 2011Tariq Ghayyur
 
European state of art report
European state of art reportEuropean state of art report
European state of art reportTariq Ghayyur
 
The global gender repot 2011
The global gender repot 2011The global gender repot 2011
The global gender repot 2011Tariq Ghayyur
 
European report on quality education indicators 2000
European report on quality education indicators 2000European report on quality education indicators 2000
European report on quality education indicators 2000Tariq Ghayyur
 
The global information technology report 2008 9
The global information technology report 2008 9The global information technology report 2008 9
The global information technology report 2008 9Tariq Ghayyur
 
Zpd incidence development strategy for demand of ic ts in higher education
Zpd incidence development strategy for demand of ic ts in higher educationZpd incidence development strategy for demand of ic ts in higher education
Zpd incidence development strategy for demand of ic ts in higher educationTariq Ghayyur
 
Higher education in pakistan an ict integration
Higher education in pakistan an ict integrationHigher education in pakistan an ict integration
Higher education in pakistan an ict integrationTariq Ghayyur
 
Usage, acceptance, adoption, and diffusion of information & communication
Usage, acceptance, adoption, and diffusion of information & communicationUsage, acceptance, adoption, and diffusion of information & communication
Usage, acceptance, adoption, and diffusion of information & communicationTariq Ghayyur
 

Mais de Tariq Ghayyur (14)

Comparative education
Comparative educationComparative education
Comparative education
 
Approaches to the study of comparative education by tariq ghayyur
Approaches to the study of comparative education by tariq ghayyurApproaches to the study of comparative education by tariq ghayyur
Approaches to the study of comparative education by tariq ghayyur
 
Concept of literacy by tariq ghayyur
Concept of literacy by tariq ghayyurConcept of literacy by tariq ghayyur
Concept of literacy by tariq ghayyur
 
Internet search techniques by tariq ghayyur1
Internet search techniques by tariq ghayyur1Internet search techniques by tariq ghayyur1
Internet search techniques by tariq ghayyur1
 
Information and digital competence in higher education
Information and digital competence in higher educationInformation and digital competence in higher education
Information and digital competence in higher education
 
E learning-opportunities-&-prospects-in-higher
E learning-opportunities-&-prospects-in-higherE learning-opportunities-&-prospects-in-higher
E learning-opportunities-&-prospects-in-higher
 
Ict in higher education review of literature from 2004 2011
Ict in higher education review of literature from 2004 2011Ict in higher education review of literature from 2004 2011
Ict in higher education review of literature from 2004 2011
 
European state of art report
European state of art reportEuropean state of art report
European state of art report
 
The global gender repot 2011
The global gender repot 2011The global gender repot 2011
The global gender repot 2011
 
European report on quality education indicators 2000
European report on quality education indicators 2000European report on quality education indicators 2000
European report on quality education indicators 2000
 
The global information technology report 2008 9
The global information technology report 2008 9The global information technology report 2008 9
The global information technology report 2008 9
 
Zpd incidence development strategy for demand of ic ts in higher education
Zpd incidence development strategy for demand of ic ts in higher educationZpd incidence development strategy for demand of ic ts in higher education
Zpd incidence development strategy for demand of ic ts in higher education
 
Higher education in pakistan an ict integration
Higher education in pakistan an ict integrationHigher education in pakistan an ict integration
Higher education in pakistan an ict integration
 
Usage, acceptance, adoption, and diffusion of information & communication
Usage, acceptance, adoption, and diffusion of information & communicationUsage, acceptance, adoption, and diffusion of information & communication
Usage, acceptance, adoption, and diffusion of information & communication
 

Último

Interactive Powerpoint_How to Master effective communication
Interactive Powerpoint_How to Master effective communicationInteractive Powerpoint_How to Master effective communication
Interactive Powerpoint_How to Master effective communicationnomboosow
 
The basics of sentences session 2pptx copy.pptx
The basics of sentences session 2pptx copy.pptxThe basics of sentences session 2pptx copy.pptx
The basics of sentences session 2pptx copy.pptxheathfieldcps1
 
Measures of Central Tendency: Mean, Median and Mode
Measures of Central Tendency: Mean, Median and ModeMeasures of Central Tendency: Mean, Median and Mode
Measures of Central Tendency: Mean, Median and ModeThiyagu K
 
A Critique of the Proposed National Education Policy Reform
A Critique of the Proposed National Education Policy ReformA Critique of the Proposed National Education Policy Reform
A Critique of the Proposed National Education Policy ReformChameera Dedduwage
 
SOCIAL AND HISTORICAL CONTEXT - LFTVD.pptx
SOCIAL AND HISTORICAL CONTEXT - LFTVD.pptxSOCIAL AND HISTORICAL CONTEXT - LFTVD.pptx
SOCIAL AND HISTORICAL CONTEXT - LFTVD.pptxiammrhaywood
 
Nutritional Needs Presentation - HLTH 104
Nutritional Needs Presentation - HLTH 104Nutritional Needs Presentation - HLTH 104
Nutritional Needs Presentation - HLTH 104misteraugie
 
Grant Readiness 101 TechSoup and Remy Consulting
Grant Readiness 101 TechSoup and Remy ConsultingGrant Readiness 101 TechSoup and Remy Consulting
Grant Readiness 101 TechSoup and Remy ConsultingTechSoup
 
9548086042 for call girls in Indira Nagar with room service
9548086042  for call girls in Indira Nagar  with room service9548086042  for call girls in Indira Nagar  with room service
9548086042 for call girls in Indira Nagar with room servicediscovermytutordmt
 
Presentation by Andreas Schleicher Tackling the School Absenteeism Crisis 30 ...
Presentation by Andreas Schleicher Tackling the School Absenteeism Crisis 30 ...Presentation by Andreas Schleicher Tackling the School Absenteeism Crisis 30 ...
Presentation by Andreas Schleicher Tackling the School Absenteeism Crisis 30 ...EduSkills OECD
 
Call Girls in Dwarka Mor Delhi Contact Us 9654467111
Call Girls in Dwarka Mor Delhi Contact Us 9654467111Call Girls in Dwarka Mor Delhi Contact Us 9654467111
Call Girls in Dwarka Mor Delhi Contact Us 9654467111Sapana Sha
 
Sanyam Choudhary Chemistry practical.pdf
Sanyam Choudhary Chemistry practical.pdfSanyam Choudhary Chemistry practical.pdf
Sanyam Choudhary Chemistry practical.pdfsanyamsingh5019
 
Key note speaker Neum_Admir Softic_ENG.pdf
Key note speaker Neum_Admir Softic_ENG.pdfKey note speaker Neum_Admir Softic_ENG.pdf
Key note speaker Neum_Admir Softic_ENG.pdfAdmir Softic
 
Q4-W6-Restating Informational Text Grade 3
Q4-W6-Restating Informational Text Grade 3Q4-W6-Restating Informational Text Grade 3
Q4-W6-Restating Informational Text Grade 3JemimahLaneBuaron
 
Unit-IV- Pharma. Marketing Channels.pptx
Unit-IV- Pharma. Marketing Channels.pptxUnit-IV- Pharma. Marketing Channels.pptx
Unit-IV- Pharma. Marketing Channels.pptxVishalSingh1417
 
Class 11th Physics NEET formula sheet pdf
Class 11th Physics NEET formula sheet pdfClass 11th Physics NEET formula sheet pdf
Class 11th Physics NEET formula sheet pdfAyushMahapatra5
 
Student login on Anyboli platform.helpin
Student login on Anyboli platform.helpinStudent login on Anyboli platform.helpin
Student login on Anyboli platform.helpinRaunakKeshri1
 
Introduction to Nonprofit Accounting: The Basics
Introduction to Nonprofit Accounting: The BasicsIntroduction to Nonprofit Accounting: The Basics
Introduction to Nonprofit Accounting: The BasicsTechSoup
 

Último (20)

Interactive Powerpoint_How to Master effective communication
Interactive Powerpoint_How to Master effective communicationInteractive Powerpoint_How to Master effective communication
Interactive Powerpoint_How to Master effective communication
 
The basics of sentences session 2pptx copy.pptx
The basics of sentences session 2pptx copy.pptxThe basics of sentences session 2pptx copy.pptx
The basics of sentences session 2pptx copy.pptx
 
Measures of Central Tendency: Mean, Median and Mode
Measures of Central Tendency: Mean, Median and ModeMeasures of Central Tendency: Mean, Median and Mode
Measures of Central Tendency: Mean, Median and Mode
 
A Critique of the Proposed National Education Policy Reform
A Critique of the Proposed National Education Policy ReformA Critique of the Proposed National Education Policy Reform
A Critique of the Proposed National Education Policy Reform
 
SOCIAL AND HISTORICAL CONTEXT - LFTVD.pptx
SOCIAL AND HISTORICAL CONTEXT - LFTVD.pptxSOCIAL AND HISTORICAL CONTEXT - LFTVD.pptx
SOCIAL AND HISTORICAL CONTEXT - LFTVD.pptx
 
Nutritional Needs Presentation - HLTH 104
Nutritional Needs Presentation - HLTH 104Nutritional Needs Presentation - HLTH 104
Nutritional Needs Presentation - HLTH 104
 
Grant Readiness 101 TechSoup and Remy Consulting
Grant Readiness 101 TechSoup and Remy ConsultingGrant Readiness 101 TechSoup and Remy Consulting
Grant Readiness 101 TechSoup and Remy Consulting
 
9548086042 for call girls in Indira Nagar with room service
9548086042  for call girls in Indira Nagar  with room service9548086042  for call girls in Indira Nagar  with room service
9548086042 for call girls in Indira Nagar with room service
 
Presentation by Andreas Schleicher Tackling the School Absenteeism Crisis 30 ...
Presentation by Andreas Schleicher Tackling the School Absenteeism Crisis 30 ...Presentation by Andreas Schleicher Tackling the School Absenteeism Crisis 30 ...
Presentation by Andreas Schleicher Tackling the School Absenteeism Crisis 30 ...
 
Call Girls in Dwarka Mor Delhi Contact Us 9654467111
Call Girls in Dwarka Mor Delhi Contact Us 9654467111Call Girls in Dwarka Mor Delhi Contact Us 9654467111
Call Girls in Dwarka Mor Delhi Contact Us 9654467111
 
INDIA QUIZ 2024 RLAC DELHI UNIVERSITY.pptx
INDIA QUIZ 2024 RLAC DELHI UNIVERSITY.pptxINDIA QUIZ 2024 RLAC DELHI UNIVERSITY.pptx
INDIA QUIZ 2024 RLAC DELHI UNIVERSITY.pptx
 
Mattingly "AI & Prompt Design: The Basics of Prompt Design"
Mattingly "AI & Prompt Design: The Basics of Prompt Design"Mattingly "AI & Prompt Design: The Basics of Prompt Design"
Mattingly "AI & Prompt Design: The Basics of Prompt Design"
 
Sanyam Choudhary Chemistry practical.pdf
Sanyam Choudhary Chemistry practical.pdfSanyam Choudhary Chemistry practical.pdf
Sanyam Choudhary Chemistry practical.pdf
 
Key note speaker Neum_Admir Softic_ENG.pdf
Key note speaker Neum_Admir Softic_ENG.pdfKey note speaker Neum_Admir Softic_ENG.pdf
Key note speaker Neum_Admir Softic_ENG.pdf
 
Q4-W6-Restating Informational Text Grade 3
Q4-W6-Restating Informational Text Grade 3Q4-W6-Restating Informational Text Grade 3
Q4-W6-Restating Informational Text Grade 3
 
Unit-IV- Pharma. Marketing Channels.pptx
Unit-IV- Pharma. Marketing Channels.pptxUnit-IV- Pharma. Marketing Channels.pptx
Unit-IV- Pharma. Marketing Channels.pptx
 
Class 11th Physics NEET formula sheet pdf
Class 11th Physics NEET formula sheet pdfClass 11th Physics NEET formula sheet pdf
Class 11th Physics NEET formula sheet pdf
 
Student login on Anyboli platform.helpin
Student login on Anyboli platform.helpinStudent login on Anyboli platform.helpin
Student login on Anyboli platform.helpin
 
Introduction to Nonprofit Accounting: The Basics
Introduction to Nonprofit Accounting: The BasicsIntroduction to Nonprofit Accounting: The Basics
Introduction to Nonprofit Accounting: The Basics
 
Advance Mobile Application Development class 07
Advance Mobile Application Development class 07Advance Mobile Application Development class 07
Advance Mobile Application Development class 07
 

The impact of ict on educational performance and its

  • 1. TOJET: The Turkish Online Journal of Educational Technology – July 2012, volume 11 Issue 3 Copyright © The Turkish Online Journal of Educational Technology 144 THE IMPACT OF ICT ON EDUCATIONAL PERFORMANCE AND ITS EFFICIENCY IN SELECTED EU AND OECD COUNTRIES: A NON-PARAMETRIC ANALYSIS Aleksander Aristovnik University of Ljubljana, Slovenia aleksander.aristovnik@fu.uni-lj.si ABSTRACT The purpose of the paper is to review some previous researches examining ICT efficiency and the impact of ICT on educational output/outcome as well as different conceptual and methodological issues related to performance measurement. Moreover, a definition, measurements and the empirical application of a model measuring the efficiency of ICT use and its impact at national levels will be considered. For this purpose, the Data Envelopment Analysis (DEA) technique is presented and then applied to selected EU-27 and OECD countries. The empirical results show that the efficiency of ICT, when taking educational outputs/outcomes into consideration, differs significantly across the great majority of EU and OECD countries. The analysis of the varying levels of (output-oriented) efficiency (under the VRSTE framework) shows that Finland, Norway, Belgium and Korea are the most efficient countries in terms of their ICT sectors. Finally, the analysis finds evidence that most of the countries under consideration hold great potential for increased efficiency in ICT and for improving their educational outputs and outcomes. Keywords: Information and Communication Technology (ICT), education, performance, efficiency, DEA, EU, OECD INTRODUCTION Information and communication technology (ICT) is one of the most important driving forces promoting economic growth in the economy. However, there is less of a consensus among economists on whether the impact of ICT also stems from higher total factor productivity (TFP) growth and improved efficiency of production (due to a better educated population). During the last two decades countries have invested heavily in ICT. Indeed, the use of ICT in education and training has been a key priority in most EU and OECD countries in the last decade, although progress has been uneven. ICT has had a major impact on the education sector, on organisation and on teaching and learning methods. Yet there are considerably different ICT expenditure levels within and between countries, as well as between institutions within countries. In some countries schools have embedded ICT into the curriculum, and demonstrate high levels of effective and appropriate ICT use to support teaching and learning across a wide range of subject areas. However, in other countries schools are in the early phase of adopting ICT, characterised by important enhancements of the learning process, some developments of e-learning (ICT-enabled learning), but without any profound improvements in learning and teaching (Balanskat et al., 2006). One puzzling question concerns the effective impact of these technologies on educational outputs and outcomes. As ICTs are being increasingly used in education, indicators to monitor their impact and demonstrate accountability to funding sources and the public are ever more needed. Indicators are required to show the relationships between technology use and educational performance. There is also a need to show that education should be seen as using technology not only as an end in itself, but as a means to promote creativity, empowerment and equality and produce efficient learners and problem solvers. Many academic researchers have tried to answer this question at theoretical and empirical levels. They have faced two main difficulties. On one hand, student performance is hard to observe and there is still confusion about its definition. On the other, ICT entails evolving technologies and their effects are difficult to isolate from their environment. Consequently, the relationship between the use of ICT and educational performance is unclear, and contradictory results are presented in the literature (Youssef and Dahmani, 2008). Accordingly, the paper’s purpose is to discuss and review some previous researches on ICT efficiency and ICT’s impact on educational outcomes as well as different conceptual and methodological issues related to measuring performance in education. Moreover, a definition, measurements and an empirical application of a model measuring the efficiency of ICT at national levels will be considered, with a special focus on educational variables as outputs/outcomes. In this context, the Data Envelopment Analysis (DEA) technique will be presented and then applied to selected EU-27 and OECD countries. The paper is structured as follows: first, a brief survey of the literature relating to ICTs and their impact on education performance is presented, then the methodology is established and the specifications of the models are defined. The next section outlines the results of the non-parametric efficiency analysis and presents partial
  • 2. TOJET: The Turkish Online Journal of Educational Technology – July 2012, volume 11 Issue 3 Copyright © The Turkish Online Journal of Educational Technology 145 correlation coefficients in order to assess the impact of ICT on educational performance. The final section provides concluding remarks and some policy implications. LITERATURE REVIEW Many theoretical and empirical efforts have been made to assess the impact of ICT on in educational performance in various settings. Recent approaches to evaluating ICT in education often only focus on a few aspects such as input, output and outcome/impact. The use of indicators can help assess how the input (e.g. monetary, infrastructure, resources) relates to the impact. However, an evaluation must consider different stages in the implementation process and analyse changes in the culture of the school system – at the micro level (pupils) as well as at the meso (institutions/schools) and macro (national) levels. At national and institutional levels, educational policies and regulations have been established to support the educational use of ICT. In school and classroom settings, teachers and school administrators are attempting to find the best ways to harness ICT technology to support their teaching and students’ success. However, accomplishments that are convincingly the result of the direct causal impact of ICT use are not always easily identifiable (Kang et al., 2008). Currently, there is a significant number of initiatives to assess and monitor the efficiency of ICT use and its impact on education. SITES (the second information technology in educational study), sponsored by the International Association for the Evaluation of Educational Achievement (IEA), is an exemplary study which identifies and describes the educational use of ICT across 26 countries in the world. The study explores the use of computers in teaching through sampling teachers, principals and ICT responsibility in schools. While it does not look into student achievement, it does look at the perceived impact of ICT on students from the teacher’s perspective (Pelgrum and Anderson, 1999; Kozma, 2003). Moreover, Balanskat et al. (2006) reviewed several studies on the impact of ICT on schools in Europe. They conclude that the evidence is scarce and comparability is limited. Each study employs a different methodology and approach, and comparisons between countries must be made cautiously. In addition, in several other studies (see Yusuf, & Afolabi, 2010; Shaikh, 2009; Jayson, 2008; Shaheeda et al., 2007) it is argued that ICT helps to improve the quality of learning and educational outcomes. Some other surveys (e.g., Iqbal, and Ahmed, 2010; Hameed, 2006; Amjad, 2006; Khan, and Shah, 2004) argue that, in order to be successful, a country should improve its education system by implementing effective and robust ICT policies. In contrast, Trucano (2005) reviews a series of studies on ICT’s impact on schools and concludes that the impact of ICT use on learning outcomes is unclear. Moreover, Cox and Marshall (2007) point out that ICT studies and indicators do not demonstrate solid effects. Empirica (2006) also explores the access and use of ICT in European schools in 2006. It presents information for 25 EU member states, Norway and Iceland, but does not look into student results so it is impossible to study this important aspect of ICT impact. Machin et al. (2006) state that, while there is a clear case for using ICT to enhance the computer skills of students, the role of technology- enhanced learning (TEL) is more controversial (Machin et al., 2006). There is neither a strong and well- developed theoretical case nor much empirical evidence supporting the expected benefits accruing from the use of ICT in schools since different studies find mixed results (Kirkpatrick and Cuban, 1998). Indeed, while Becta (2002) and Kulik (2003) find a positive effect on the use of ICT and educational attainment, researches by Fuchs and Woessman (2004), Leuven et al. (2004) or Goolsbee and Guryan (2002) find no real positive effect of the use of ICT on educational results once other factors, such as school characteristics or socioeconomic background, are taken into account.1 A few previous studies on the performance and efficiency of the education sector (at the national level) applied non-parametric methods. For instance, Gupta and Verhoeven (2001) measure the efficiency of education in Africa, Clements (2002) does so for Europe, St. Aubyn (2003) for education spending in the OECD, and Afonso and St. Aubyn (2005, 2006a, 2006b) in OECD countries. Most studies apply the Data Envelopment Analysis (DEA) method, while Afonso and St. Aubyn (2006a) undertake a two-step DEA/Tobit analysis in the context of a cross-country analysis of secondary education efficiency. However, very few recent studies have examined the efficiency of countries in utilising their ICT resources for educational outputs and outcomes and the impact of ICT on education in a particular country, for instance in Turkey (Tondeur et al., 2007) and Belgium (Gulbahar, 2008). Since very insightful, cross-country analyses have rarely been used for ICT policy analysis, the present research addresses this gap in the literature. 1 Indeed, Kozma (2008) pointed out that ‘some studies reveal a positive correlation between the availability of computer access or computer use and attainment, others reveal a negative correlation, whilst yet others indicate no correlation whatsoever between the two’.
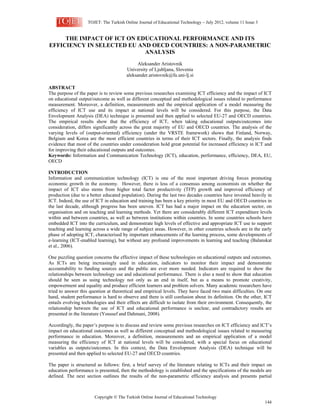
  • 3. TOJET: The Turkish Online Journal of Educational Technology – July 2012, volume 11 Issue 3 Copyright © The Turkish Online Journal of Educational Technology 146 METHODOLOGY AND DATA The measurement of efficiency generally requires: (a) an estimation of costs; (b) an estimation of output; and (c) a comparison between the two. Applying this concept to ICT activities, we can say, for example, that ICT expenditure is efficient when, given the amount spent, it produces the largest possible benefit for the country’s population.2 Often efficiency is defined in a comparative sense: the relation between benefits and costs in country X is compared with that of other countries. If in country X the benefits exceed the costs by a larger margin than in other countries, then ICT expenditure in country X is considered more efficient. However, the measurement of ICT efficiency is relatively complicated since the comparison and measurement of both costs and benefits may be difficult. Figure 1 illustrates the link between input, output and outcome, the main components of efficiency and effectiveness indicators. The monetary and non-monetary resources deployed (i.e. the input) produce an output. For example, ICT spending, investment in the broadband network or a baseline computer-pupil ratio (as possible inputs) affects the number of students completing a grade (as a possible output) and national test results (as a possible outcome). The input-output ratio is the most basic measure of efficiency.3 However, compared to productivity measurement, the efficiency concept incorporates the idea of the production possibility frontier, which indicates feasible output levels given the scale of operations. The greater the output for a given input or the lower the input for a given output, the more efficient the activity is. Productivity, by comparison, is simply the ratio of outputs produced to the inputs used. On the other hand, effectiveness relates the input or the output to the final objectives to be achieved, i.e. the outcome. The outcome is often linked to welfare or growth objectives and may therefore be influenced by multiple factors (including outputs but also exogenous 'environment' factors). Effectiveness is more difficult to assess than efficiency since the outcome is influenced by political choices. Figure 1: Conceptual Framework of Efficiency and Effectiveness Source: Mandl et al., 2008. A common non-parametric technique that has recently started to be commonly applied to expenditure analysis is Data Envelopment Analysis (DEA).4 DEA is a non-parametric frontier estimation methodology originally introduced by Charnes et al. (1978) that compares functionally similar entities described by a common set of multiple numerical attributes. DEA classifies entities into “efficient” or “performers” versus “inefficient” or “non-performers.” According to the DEA framework, inefficiencies are degrees of deviance from the frontier. Input inefficiencies show the degree to which inputs must be reduced for an inefficient country to lie on the efficient practice frontier. Output inefficiencies are the increase in outputs needed for a country to become efficient. If a particular country either reduces its inputs by the inefficiency values or increases its outputs by the amount of inefficiency, it can become efficient; that is, it can obtain an efficiency score of one. The criterion for classification is determined by the location of an entity’s data point with respect to the efficient frontier of the production possibility set. The classification of any particular entity can be achieved by solving a linear program (LP). Various types of DEA models can be used, depending upon the problem at hand. The DEA model we use can be distinguished by the scale and orientation of the model. If one cannot assume that economies of scale do not change, then a variable returns- to-scale (VRSTE) type of DEA model, the one selected here, is an appropriate choice (as opposed to a constant-returns-to-scale, (CRS) model). Furthermore, if in order to achieve better efficiency, economies’ priorities are to adjust their outputs (before inputs), then an output-oriented DEA model 2 The word benefit is used because economists often distinguish between output and outcome. 3 When measuring efficiency, a distinction can be made between technical and allocative efficiency. Technical efficiency measures the pure relationship between inputs and outputs taking the production possibility frontier into account. On the other hand, allocative inefficiency occurs if the distribution of particular public sector outputs is not in accordance with personal preferences (Bailey, 2002). 4 Originating from Farrell’s (1957) seminal work, DEA analysis was originally developed and applied to firms that convert inputs into outputs (see Coelli et al. (2002) for a number of applications).
  • 4. TOJET: The Turkish Online Journal of Educational Technology – July 2012, volume 11 Issue 3 Copyright © The Turkish Online Journal of Educational Technology 147 rather than an input-oriented model is appropriate. The way in which the DEA program computes efficiency scores can be explained briefly using mathematical notation (adapted from Ozcan, 2007). The VRSTE envelopment formulation is expressed as follows: For decision making unit 1, xi1≥0 denotes the ith input value, and yi1≥0 denotes the rth output value. X1 and Y1denote, respectively, the vectors of input and output values. Units that lie on (determine) the surface are deemed efficient in DEA terminology. Units that do not lie on the surface are termed inefficient. Optimal values of variables for decision making unit 1 are denoted by the s-vector s1 , the m-vector e1 , and the n-vector λ1 . Table 1: Summary Statistics Average St. Dev. Min. Max. Inputs Information and communication technology expenditure (% of GDP) 6.0885 0.9366 3.702 (MEX) 7.722 (BUL) Information and communication technology expenditure (per capita, in USD) 1,682.4 950.9926 247.416 (SLK) 3,152.654 (USA) Internet users (per 100 people) 40.3071 18.4235 9.5133 (MEX) 68,43111 (SWE) International Internet bandwidth (bits per person) 4,722.9 5,756.232 84.81889 (MEX) 21,214.81 (DEN) Outputs School enrolment, primary (% gross) 102.972 4.0724 98.7438 (GRE) 119,6688 (POR) School enrolment, secondary (% gross) 104.6418 13.0841 79.74 (MEX) 133.0922 (BEL) School enrolment, tertiary (% gross) 59.2622 15.8078 22.7644 (MEX) 87.75778 (FIN) Teachers per 100 pupils, secondary 8.5925 1.5601 5.2672 (JPN) 12.0387 (POL) Outcomes PISA average (2006) 491.2264 34.6888 408.601 (MEX) 552.8498 (FIN) Labor force with tertiary education (% of total) 24.7961 9.2459 10.7429 (POR) 50.475 (USA) Sources: World Bank, 2011; UNESCO, 2011; OECD, 2010; own calculations. Although DEA is a powerful optimization technique that can assess the performance of each country, it has certain limitations. When one has to deal with large numbers of inputs and outputs, and a small number of countries are under evaluation, the discriminatory power of the DEA is limited. However, analysts can overcome this limitation by including only those factors (input and output) that provide the essential components of “production”, thus avoiding distortion of the DEA results. This is usually done by eliminating one of a pair of factors that are strongly positively correlated with each other. In the majority of studies using DEA the data are analysed cross-sectionally, with each decision-making unit (DMU) – in this case a country – being observed only once. Nevertheless, data on DMUs are often available over multiple time periods. In such cases, it is possible to perform DEA over time where each DMU in each time period is treated as if it were a distinct DMU. However, in our case the data set for all the tests in the study includes average data for the 1999–2007 period (including PISA 2006 average scores) in order to evaluate long- term efficiency measures as the effects of ICT are characterised by time lags in 27 EU and OECD countries. The program used for calculating the technical efficiencies is the DEA Frontier software. The data are provided by the OECD, UNESCO and the World Bank’s World Development Indicators database (for Summary statistics see Table 1).
  • 5. TOJET: The Turkish Online Journal of Educational Technology – July 2012, volume 11 Issue 3 Copyright © The Turkish Online Journal of Educational Technology 148 The specification of the outputs and inputs is a crucial first step in DEA since the larger the number of outputs and inputs included in any DEA, the higher will be the expected proportion of efficient DMUs, and the greater will be the expected overall average efficiency (Chalos, 1997). Common measures of teaching output in education used in previous studies are based on graduation and/or completion rates (see Johnes, 1996; Jafarov and Gunnarsson, 2008), PISA scores (see Afonso and St. Aubyn, 2005; Jafarov and Gunnarsson, 2008), pupil- teacher ratios and enrolment rates (see Jafarov and Gunnarsson, 2008). Nevertheless, these studies also demonstrate that DEA is an effective research tool for evaluating the efficiency of ICT and its impact on the education sector given the varying input mixes and types and numbers of outputs. In this analysis the data set to evaluate the efficiency of ICT includes input/output/outcome data, i.e. information and communication technology expenditure (% of GDP)5 , Internet users (per 100 people), teacher-pupil ratio (secondary), school enrolment, all levels (% gross), labour force with tertiary education (% of total)and the PISA 2006 average score. Up to 28 countries are included in the analysis (selected EU and OECD countries). Different inputs and outputs/outcomes are tested in four models (see Table 1). In addition, to evaluate the impact of ICT on education, we calculate partial correlation coefficients for different ICT and education variables. Table 2: Input and output/outcome set for the DEA Model Inputs Outputs/Outcomes I o Information and communication technology expenditure (% of GDP) 1 o PISA average (2006) 2 II o Information and communication technology expenditure (% of GDP) o Internet users (per 100 people) 1 o PISA average (2006) o Labour force with tertiary education (% of total) 1 III o Information and communication technology expenditure (% of GDP) o Internet users (per 100 people) o PISA average (2006) o School enrolment, secondary (% gross) 1 o Teacher-pupil ratio, secondary 3 IV o Information and communication technology expenditure (% of GDP) o Internet users (per 100 people) o PISA average (2006) o School enrolment, primary (% gross) 1 o School enrolment, secondary (% gross) o School enrolment, tertiary (% gross) 1 Sources: 1 World Bank; 2 UNESCO; 3 OECD. EMPIRICAL RESULTS To see whether ICT has any impact on educational outputs and outcomes, we calculate the partial correlations between different variables, while controlling for the other(s) variable(s) (see Table 3). All educational output and outcome variables show a weak and positive (but not statistically significant) correlation with ICT expenditures (in % of GDP) when controlling for the number of Internet users. The impact of the number of Internet users is strong and positive as the partial coefficient ranges from 0.53 to 0.71. An important ICT variable which also influences PISA scores is ICT (per capita) as the partial coefficient reached 0.53. There are also some educational output variables which positively influence the PISA scores, such as the teacher-pupil ratio (primary and secondary). Nevertheless, the single most important related variable is the quality of the basic telecommunications infrastructure and broadband penetration. Indeed, a strong ICT infrastructure and its use alone already have an effect on perceived ICT-induced efficiency improvements but does not guarantee a good educational performance in itself. The government and policymakers should not be interested in simply introducing technology into educational institutions, but also in making sure that it is used effectively by teachers and students in order to enhance educational outputs and outcomes. Table 3: Partial correlation coefficients Output/outcome variables Input variables Completion rate –primary (n=24) ICT (GDP) IU 0.012 -0.09 Enrolment rate – ICT (GDP) IIB 5 ICT expenditures include computer hardware (computers, storage devices, printers, and other peripherals); computer software (operating systems, programming tools, utilities, applications, and internal software development); computer services (information technology consulting, computer and network systems integration, Web hosting, data processing services, and other services); and communications services (voice and data communications services) and wired and wireless communications equipment (World Bank, 2011).
  • 6. TOJET: The Turkish Online Journal of Educational Technology – July 2012, volume 11 Issue 3 Copyright © The Turkish Online Journal of Educational Technology 149 secondary (n=27) 0.005 0.684*** Enrolment rate - tertiary (n=27) ICT (GDP) IU 0.083 0.709*** Labour force with tertiary education (n=27) ICT (GDP) IU 0.075 0.525*** PISA score (n=28) ICT (GDP) IU 0.128 0.687*** PISA scores (n=27) ICT (p.c.) T/P (secondary) 0.530*** 0.292 PISA scores (n=26) ICT (p.c.) T/P (primary) T/P (secondary) 0.555*** -0.268 0.339* PISA scores (n=23) ICT (GDP) IU T/P (primary) COMPL (primary) -0.014 0.701*** 0.410* -0.1724 Note: ***, **, * denote significance at the levels of 1%, 5% and 10%, respectively. ICT (GDP) - Information and communication technology expenditure (% of GDP); IU - Internet users (per 100 people); ICT (p.c.) - Information and communication technology expenditure (per capita); T/P - Teacher-pupil ratio; IIB - International Internet bandwidth (bits per person); COMPL - completion rate (% of relevant age group). Sources: World Bank, 2011; UNESCO, 2011; OECD, 2010; own calculations. The results of the output-oriented VRSTE formulation of the DEA analysis (based on Models I–IV in Table 2) suggest a relatively high level of inefficiency of ICT in selected EU and OECD countries and, correspondingly, that there is significant room to improve educational outputs and outcomes (see Table 4). Indeed, the empirical results show that the total number of efficient countries varies significantly from one model to another. There are only two technically efficient countries in Model I, i.e. Finland and Slovakia. However, at 4.424% of GDP Slovakia has the lowest level of ICT expenditure (in % of GDP) among all countries in the sample. The least efficient nations are Bulgaria, Romania and Greece as a result of their relatively low PISA test scores, ranging from 410 (Romania) to 464 (Greece) (for instance, the EU/OECD group average is around 494). In order to enhance the reliability of the findings, additional inputs and outputs/outcomes were introduced, resulting in models II, III and IV (for details also see Table 2). Adding another input and output in the form (Model II) of Internet users (per 100 people) and labour force with tertiary education (% of total), respectively, the results show Finland, Iceland, Norway, Slovakia and the USA to be the technically most efficient countries. Not surprisingly, increasing the number of outputs/outcomes in a relatively small sample leads to a higher number of efficient countries. In general, the rankings remain relatively stable in comparison to Model I (with the USA, Italy, Poland and Iceland being the only significant exceptions).6 Model III includes additional output/outcome variables to PISA scores, i.e. school enrolment (secondary) and teacher-pupil ratio (secondary). According to this model there are two additional efficient nations, i.e. Belgium and Poland. Interestingly, the biggest improvement in the ranking is shown by Denmark, with one of the highest levels of school enrolment (secondary) averages accounting for around 125% in the 1999–2007 period (the EU/OECD average is around 106%). In order to become an efficient nation, selected countries should significantly increase the level of their PISA scores (particularly in Romania), the level of their school enrolment (secondary) (particularly in highly populated countries, such as Korea and the USA), and the teacher-pupil ratio (secondary) (in Japan, Sweden and the UK). Table 4: DEA results for ICT efficiency in selected OECD and EU countries No. Country Model I Model II Model III Model IV VRSTE Rank VRSTE Rank VRSTE Rank VRSTE Rank 1 Australia 1.06339 7 n.a. n.a. n.a. n.a. n.a. n.a. 2 Austria 1.10092 13 1.06040 13 1.05115 21 1.03784 22 3 Belgium 1.08288 9 1.01999 7 1.00000 1 1.00000 1 6 These ranking changes resulted from the relatively high level of labour force with a tertiary education (in the USA and Iceland) and relatively small number of Internet users (in Italy and Poland).
  • 7. TOJET: The Turkish Online Journal of Educational Technology – July 2012, volume 11 Issue 3 Copyright © The Turkish Online Journal of Educational Technology 150 4 Bulgaria 1.32790 27 n.a. n.a. 1.00000 1 1.00000 1 5 Czech R. 1.10171 14 1.00869 6 1.00596 8 1.00258 13 6 Denmark 1.10320 16 1.10320 21 1.01339 10 1.02449 19 7 Finland 1.00000 1 1.00000 1 1.00000 1 1.00000 1 8 France 1.12181 19 1.03470 9 1.02663 18 1.01070 16 9 Germany 1.09520 11 n.a. n.a. 1.02570 17 1.04204 23 10 Greece 1.19124 25 n.a. n.a. 1.02556 16 1.00000 1 11 Hungary 1.12273 20 1.08677 19 1.02372 14 1.02153 18 12 Iceland 1.11989 18 1.00000 1 1.02275 13 1.01361 17 13 Italy 1.17995 24 1.05702 12 1.11064 25 1.07881 26 14 Japan 1.06834 8 1.08181 18 1.04171 20 1.03091 21 15 Korea 1.02025 4 1.06586 15 1.00656 9 1.00000 1 16 Netherlands 1.06163 6 1.06163 14 1.03030 19 1.00000 1 17 New Zealand 1.05411 5 1.04909 11 1.00000 1 1.02618 20 18 Norway 1.01909 3 1.00000 1 1.00000 1 1.00000 1 19 Poland 1.10506 17 1.00507 5 1.00000 1 1.00000 1 20 Portugal 1.17397 23 1.07200 16 1.05337 22 1.00000 1 21 Romania 1.31120 26 1.18268 22 1.10368 24 1.00293 1 22 Slovakia 1.00000 1 1.00000 1 1.00000 1 1.00000 1 23 Slovenia 1.09282 10 1.02316 8 1.02193 12 1.00473 15 24 Spain 1.16046 22 1.04906 10 1.01584 11 1.00000 1 25 Sweden 1.09620 12 1.09620 20 1.02507 15 1.00000 1 26 UK 1.10181 15 1.07618 17 1.07807 23 1.04406 24 27 USA 1.14787 21 1.00000 1 1.12480 26 1.05256 25 Number of efficient countries 2 5 7 12 Mean 1.11199 1.04928 1.03103 1.01511 Std. dev. 0.078309 0.045084 0.036037 0.021181 Note: Relative efficiency scores (models I–IV; see Table 2). Twenty-seven countries are included in the analysis (Mexico is excluded as an outlier). Sources: World Bank, 2011; UNESCO, 2011; OECD, 2010; own calculations. In terms of the efficiency scores for ICT in Model IV, up to 12 of the analysed countries are labelled efficient (see Table 4). The average output efficiency score is 1.01511, meaning that the average country could increase its outputs/outcomes by around 1.5% if it were efficient. The worst efficiency performers are Italy, the USA and the UK, with the last two having well above-average ICT expenditures and Internet users (per 100 people) and well below-average PISA scores (in the USA), school enrolment (primary and secondary) (in the USA) and school enrolment (tertiary) (in the UK). On the other hand, Italy has below-average levels of its inputs and outputs/outcomes and therefore an increase in ICT expenditures and Internet users alongside a significant efficiency improvement is needed in the county. Indeed, all three countries should increase their outputs by 4.4% to 7.9 in order to become an efficient. According to the above empirical analysis, it is obvious that the use of ICT in many of the countries considered suffers from relatively low technical efficiency. This inefficiency is particularly highlighted in some highly developed OECD members, i.e. the USA, the UK and Austria (see Table 5). Since all of these countries use significantly above-average ICT resources, it will be crucial for them to increase their educational outputs and outcomes. On the other hand, Italy, France and Hungary reveal low efficiency despite using a relatively low level of ICT inputs. Hence, an improvement of the efficiency of ICT, which could significantly contribute to a country’s stronger development and growth should therefore be a top priority in the near future for most countries, particularly those in the third and fourth quartiles. Table 5: Relative Efficiency of ICT in Selected OECD and EU countries (Distribution by quartiles of the ranking of efficiency scores in three models) Note: Relative efficiency scores (models I - IV; see Table 2). Twenty-seven countries are included in the analysis. Sources: World Bank, 2011; UNESCO, 2011; OECD, 2010; own calculations. 1st quartile 2nd quartile 3rd quartile 4th quartile Finland Slovakia Norway Belgium Korea Poland Netherlands New Zealand Sweden Bulgaria Spain Czech R. Slovenia Greece Denmark Portugal Iceland Japan Germany Romania Hungary France Austria UK USA Italy
  • 8. TOJET: The Turkish Online Journal of Educational Technology – July 2012, volume 11 Issue 3 Copyright © The Turkish Online Journal of Educational Technology 151 CONCLUSIONS The empirical results show that the efficiency of ICT, when taking educational outputs/outcomes into consideration, differs significantly across the great majority of EU and OECD countries. The analysis of the varying levels of (output-oriented) efficiency (under the VRS framework) shows that Finland, Norway, Belgium and Korea are the most efficient countries in terms of their ICT sectors (when considering educational output/outcome). The empirical results also suggest that, in general, some less developed EU countries such as Slovakia and Poland show a relatively high level of ICT efficiency due to the low level of their ICT inputs. Therefore, a significant increase in ICT expenditures is needed in those countries. All in all, the analysis finds evidence that most of the countries under consideration hold great potential for increased efficiency in ICT and for improving their educational outputs and outcomes. However, a few limitations of the presented empirical study should be pointed out. Firstly, the application of the presented techniques is hampered by a lack of suitable data. Quality data are called for because the techniques available to measure efficiency are sensitive to outliers and may be influenced by exogenous factors. Secondly, the precise definition of inputs, outputs and outcomes may significantly influence the results. Finally, it seems important to bear in mind that by using a non-parametric approach, and in spite of DEA being an established and valid methodology, differences across countries are not statistically assessed and this may be considered a limitation of the methodology. Hence, further research is clearly needed to eliminate the above deficiencies, in particular to test the influence of environmental factors on ICT efficiency. REFERENCES Afonso, A., & St. Aubyn, M. (2005). Non-parametric approaches to education and health efficiency in Oecd countries. Journal of Applied Economics, 8(2): 227-246. Afonso, A., & St. Aubyn, M. (2006a). Cross-country efficiency of secondary education provision: a semi- parametric analysis with non-discretionary inputs. Economic Modelling, 23(3): 476-491. Afonso, A., & St. Aubyn, M. (2006b). Relative efficiency of health provision: a DEA approach with non- discretionary inputs. ISEG-UTL, Department of Economics Working Paper nº 33/2006/DE/UECE. Amjad, R. 2006. Why Pakistan must break-into the knowledge economy. Lahore Journal of Economics, Special Edition, September 2006. Bailey, S. J. (2002). Public Sector Economics: Theory, Policy and Practice. London: Palgrave Macmillan. Balanskat, A., Blamire, R., & Kefala, S. (2006). The ICT impact report: a review of studies of ICT impact on schools in Europe. Brussels: European Schoolnet. Becta. (2006). The Becta Review 2006: Evidence on the progress of ICT in education’, UK: Becta. Retrieved March 01, 2012 from http://becta.org.uk/corporate/publications/documents/The_Becta_Review_2006.pdf Chalos, P. (1997). An examination of budgetary inefficiency in education using data envelopment analysis. Financial Accountability & Management, 13(1): 55–69. Charnes, A., Cooper, W., & Rhodes, E. (1978). Measuring efficiency of decision-making units. European Journal of Operational Research, 33: 429-444. Clements, B. (2002). How efficient is education spending in Europe? European Review of Economics and Finance, 1: 3-26. Coelli T., Rao, D., & Battese, G. (2002). An introduction to efficiency and productivity analysis. 6th edition, Massachusetts, Kluwer Academic Publishers. Cox, M., J., & Marshall, G. M. (2007). Effects of ICT: do we know what we should know?’, Education and Information Technologies, 12: 59–70. Empirica. (2006). Benchmarking access and use of ICT in European schools 2006. Bonn: Empirica. Retrieved February 02, 2012 from http://www.empirica.com/publikationen/documents/No08-2006_learnInd.pdf Fuchs, T., & Woessmann, L. (2004). Computers and student learning: bivariate and multivariate evidence on the availability and use of computers at home and at school, CESifo Working Paper. No. 1321. November. Munich. Goolsbee, A., & Guryan, J. (2002). The impact of internet subsidies in public schools, NBER Working Papers 9090, National Bureau of Economic Research, Inc. Gülbahar, Y., (2008). ICT usage in higher education: a case study on preservice teachers and instructors, The Turkish Online Journal of Educational Technology, 7(1): 32-37. Gupta, S., & Verhoeven, M. (2001). The efficiency of government expenditure: experiences from Africa. Journal of Policy Modelling, 23: 433-467. Hameed, T. (2006). ICT as an enabler for socio-economic development. Digital Opportunity Forum 2006, International Telecommunication Union, Seoul: Korea. Retrieved January 26, 2012, from http://www.itu.int/osg/spu/digitalbridges/materials/hameed-paper.pdf
  • 9. TOJET: The Turkish Online Journal of Educational Technology – July 2012, volume 11 Issue 3 Copyright © The Turkish Online Journal of Educational Technology 152 Iqbal, M. J., & Ahmed, M. (2010). Enhancing quality of education through e-learning: the case study of Allama Iqbal Open University. The Turkish Online Journal of Distance Education, 11(1). Retrieved January 16, 2012 from https://tojde.anadolu.edu.tr/tojde37/articles/article_5.htm Jafarov, E., & Gunnarsson, V. (2008). Government spending on health care and education in Croatia: efficiency and reform options; International Monetary Fund; IMF Working Paper; WP/08/136. Jayson, W. R. (2008). ICT in education reform in Cambodia: problems, politics, and policies impacting implementation. Information Technologies and International Development, 4(4): 67–82. Johnes, J. (1996). Performance assessment in higher education in Britain. Eur. J. Oper. Res., 89, 18-33. Kang, M., Heo, H., Jo, I, Shin, J., Seo, J., & Shin, S. (2008). The new millennium learners and educational performance: the 2nd year report. Technical report. KERIS Khan, A. M., & Shah, Q. A. (2004). Study on impact of information and communication technology on decent work in Pakistan. Islamabad: Pakistan Manpower Institute, Ministry of Labour Manpower & Overseas Pakistanis, Government of Pakistan. Kirpatrick, H., & L. Cuban. (1998). Computers make kids smarter--right? Technos Quarterly for Education and Technology, 7, 2. Klun, M., (2004). Performance measurement for tax administrations: the case of Slovenia. International Review of Administrative Sciences, 70(3): 567-574. Kozma, R. (2003). Technology and classroom practices: an international study, Journal of Research on Technology in Education, 36(1): 1–14. Kozma, R. B. (2008). Comparative analysis of policies for ICT in education. Center for Technology in Learning, SRI International (to appear in the International Handbook on Information Technology in Education). Kulik, J. (2003). The effects of using instructional technology in elementary and secondary schools: what controlled evaluation studies say. Menlo Park, CA: SRI International. Leuven, E., Lindahl, M., Oosterbeek, H., & Webbink, D. (2004). The effect of extra funding for disadvantaged pupils on achievement. IZA Discussion Paper. No. 1122. Bonn: Institute for the Study of Labor. Machin, S., McNally, S., & Silva, O. (2006). New technologies in schools: is there a pay off? London: Centre for Economic Performance; Bonn: Institute for the Study of Labour. Mandl, U., Dierx A., & Ilzkovitz, F. (2008). The effectiveness and efficiency of public spending. European Commission, Economic Papers 31, February. Markovic, R. M. (2009). Education through E-learning: Case of Serbia . Journal of Business Economics and Management, 10(4), 313-319. OECD. (2010). Education at glance 2010. OECD indicators. Retrieved February 21, 2012 from http://www.oecd.org/document/52/0,3343,en_2649_39263238_45897844_1_1_1_1,00.html Ozcan, Y. A. (2007). Health Care Benchmarking and Performance Evaluation: An Assessment using Data Envelopment Analysis (DEA). New York: Springer. Pelgrum, W.J., & Anderson, R.A. (Eds) (1999). ICT and the merging paradigm for life-long learning: A worldwide assessment of infrastructure, goals and practices. Amsterdam: International Association for the Evaluation of Educational Achievement. Shaheeda, J., Dick, N., & Laura, C. (2007). The role of ICTs in higher education in South Africa: One strategy for addressing teaching and learning challenges. International Journal of Education and Development using Information and Communication Technology. 3(4): 131-142. Shaikh, Z. A. (2009). Usage, acceptance, adoption, and diffusion of information and communication technologies in higher education: a measurement of critical factors. Journal of Information Technology Impact (JITI), 9(2): 63-80. Shaikh, Z., A., & Khoja, S. A. (2011). Role of ICT in shaping the future of Pakistani higher education system. The Turkish Online Journal of Educational Technology, 10(1): 149-161. St. Aubyn, M. (2003). Evaluating efficiency in the Portuguese education sector. Economia, 26, 25-51. Tondeur, J., van Braak, J., & Valcke, M. (2007). Towards a typology of computer use in primary education. Journal of Computer Assisted Learning, 23, 197-206. Trucano, M. (2005). Knowledge maps: ICT in education, Washington, DC: infoDev/World Bank. Unesco. (2011). Data centre, Montreal: UNESCO Institute for Statistics, On-line. Verma, A., & Gavirneni, S. (2006). Measuring police efficiency in India: an application of data envelopment analysis. Policing: An International Journal of Police Strategies & Management, 29(1): 125-145. World Bank. (2011). World development indicators, On-line. Youssef, B., A., & Dahmani, M. (2008). Student's performances and ICTs, University and Knowledge Society Journal (RUSC), March 2008, 45-56. Yusuf, M. O., & Afolabi, A. O. (2010). Effects of computer assisted instruction (cai) on secondary school students’ performance in biology. The Turkish Online Journal of Educational Technology, 9(1): 62-69.