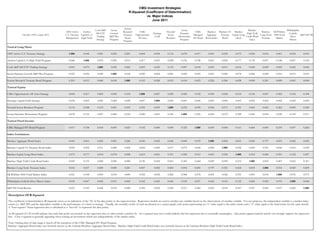
1. CMG Investment Strategies
R-Squared (Coefficient of Determination)
vs. Major Indices
June 2011
System
Cook S&P Scotia Scotia Barclays Philadelphia
AIFS Active Anchor Research CMG Howard CMG Barclays Barclays US Barclays Barclays DJ Wilshire
500 ETF Growth Heritage Dynamic High Yield Gold &
October 1993 to June 2011 U.S. Treasury Capital L/S Treasury Opportunistic Sector Managed Aggregate Treasury Equity Long Long-Term 5000 Total S&P 500 TR
Trading S&P Plus Gold Momentum Credit Bond Silver
Management High Yield Bond All Asset Rotation HY Bond Bond Index Bond Short Treasury Market
Strategy Program Program Index Miners
Program
Tactical Long/Short:
AIFS Active U.S. Treasury Strategy 1.000 0.044 0.001 0.023 0.201 0.004 0.054 0.116 0.078 0.017 0.041 0.055 0.073 0.000 0.016 0.061 0.018 0.051
Anchor Capital L/S High Yield Program 0.044 1.000 0.070 0.050 0.013 0.217 0.003 0.028 0.156 0.338 0.061 0.002 0.177 0.135 0.007 0.148 0.047 0.149
Cook S&P 500 ETF Trading Strategy 0.001 0.070 1.000 0.045 0.060 0.003 0.050 0.153 0.007 0.018 0.003 0.011 0.014 0.000 0.000 0.005 0.002 0.006
Scotia Partners Growth S&P Plus Program 0.023 0.050 0.045 1.000 0.018 0.030 0.064 0.001 0.000 0.003 0.001 0.000 0.074 0.006 0.000 0.014 0.013 0.019
System Research Treasury Bond Program 0.201 0.013 0.060 0.018 1.000 0.103 0.028 0.019 0.018 0.023 0.226 0.206 0.028 0.000 0.241 0.000 0.065 0.000
Tactical Equity:
CMG Opportunistic All Asset Strategy 0.004 0.217 0.003 0.030 0.103 1.000 0.007 0.295 0.429 0.192 0.030 0.002 0.619 0.136 0.007 0.452 0.162 0.394
Heritage Capital Gold Strategy 0.054 0.003 0.050 0.064 0.028 0.007 1.000 0.003 0.001 0.000 0.005 0.000 0.001 0.002 0.002 0.002 0.042 0.002
Howard Sector Rotation Program 0.116 0.028 0.153 0.001 0.019 0.295 0.003 1.000 0.236 0.090 0.024 0.071 0.351 0.063 0.065 0.262 0.045 0.249
Scotia Dynamic Momentum Program 0.078 0.156 0.007 0.000 0.018 0.429 0.001 0.236 1.000 0.325 0.000 0.072 0.529 0.343 0.054 0.548 0.102 0.511
Tactical Fixed Income:
CMG Managed HY Bond Program 0.017 0.338 0.018 0.003 0.023 0.192 0.000 0.090 0.325 1.000 0.039 0.000 0.161 0.444 0.005 0.278 0.037 0.260
Index Correlations:
Barclays Aggregate Bond Index 0.041 0.061 0.003 0.001 0.226 0.030 0.005 0.024 0.000 0.039 1.000 0.854 0.001 0.049 0.797 0.003 0.042 0.005
Barclays Capital US Treasury Bond Index 0.055 0.002 0.011 0.000 0.206 0.002 0.000 0.071 0.072 0.000 0.854 1.000 0.036 0.009 0.921 0.026 0.016 0.018
Barclays Equity Long Short Index 0.073 0.177 0.014 0.074 0.028 0.619 0.001 0.351 0.529 0.161 0.001 0.036 1.000 0.212 0.024 0.551 0.122 0.457
Barclays High Yield Credit Bond Index 0.000 0.135 0.000 0.006 0.000 0.136 0.002 0.063 0.343 0.444 0.049 0.009 0.212 1.000 0.003 0.401 0.062 0.367
Barclays Long-Term Treasury Index 0.016 0.007 0.000 0.000 0.241 0.007 0.002 0.065 0.054 0.005 0.797 0.921 0.024 0.003 1.000 0.014 0.020 0.009
DJ Wilshire 5000 Total Market Index 0.061 0.148 0.005 0.014 0.000 0.452 0.002 0.262 0.548 0.278 0.003 0.026 0.551 0.401 0.014 1.000 0.076 0.973
Philadelphia Gold & Silver Miners Index 0.018 0.047 0.002 0.013 0.065 0.162 0.042 0.045 0.102 0.037 0.042 0.016 0.122 0.062 0.020 0.076 1.000 0.060
S&P 500 Total Return 0.051 0.149 0.006 0.019 0.000 0.394 0.002 0.249 0.511 0.260 0.005 0.018 0.457 0.367 0.009 0.973 0.060 1.000
Description Of R-Squared
The coefficient of determination (R-Squared) serves as an indication of the “fit’ of the data points to the regression line. Regression models are used to predict one variable based on the observations of another variable. For our purposes, the independent variable is a market index
return (i.e. S&P 500) and the dependent variable is the performance of a fund or strategy. Visually, the monthly results of each are plotted on a scatter graph, each point representing an “x” value equal to the index return and a “y” value equal to the fund return for the same month.
A “least-squares” linear regression line is calculated as a “best-fit” to represent the data points.
An R-squared of 1.00 would indicate that each data point was located on the regression line; in other words, a perfect fit. An r-squared near zero would indicate that the regression line is essentially meaningless - date points appear random and do not strongly support the regression
line. A low r-squared is generally appealing when seeking an investment which acts independently of the market index.
Note: Starting date of data range is based off the inception of the CMG Managed HY Bond Program.
Barclays Aggregate Bond Index was formerly known as the Lehman Brothers Aggregate Bond Index. Barclays High Yield Credit Bond Index was formerly known as the Lehman Brothers High Yield Credit Bond Index
2. CMG Investment Strategies
Correlation Coefficient
vs. Major Indices
June 2011
System
Cook S&P Scotia Scotia Barclays
AIFS Active Anchor Research CMG Howard CMG Barclays Barclays US Barclays Barclays DJ Wilshire Philadelphia
500 ETF Growth Heritage Dynamic High Yield
October 1993 to June 2011 U.S. Treasury Capital L/S Treasury Opportunistic Sector Managed Aggregate Treasury Equity Long Long-Term 5000 Total Gold & Silver S&P 500 TR
Trading S&P Plus Gold Momentum Credit Bond
Management High Yield Bond All Asset Rotation HY Bond Bond Index Bond Short Treasury Market Miners
Strategy Program Program Index
Program
Tactical Long/Short:
AIFS Active U.S. Treasury Strategy 1.000 0.209 0.032 0.150 0.449 (0.064) (0.232) (0.340) (0.280) (0.130) 0.203 0.234 (0.270) (0.021) 0.125 (0.247) 0.135 (0.225)
Anchor Capital L/S High Yield Program 0.209 1.000 (0.265) (0.224) 0.113 0.466 (0.057) 0.166 0.395 0.581 0.246 0.042 0.421 0.368 0.082 0.385 0.217 0.385
Cook S&P 500 ETF Trading Strategy 0.032 (0.265) 1.000 0.213 0.245 (0.057) 0.224 (0.391) (0.082) (0.134) 0.058 0.104 (0.117) 0.001 0.017 0.074 (0.039) 0.078
Scotia Partners Growth S&P Plus Program 0.150 (0.224) 0.213 1.000 0.135 (0.174) 0.253 (0.023) (0.003) 0.051 (0.032) 0.015 (0.272) 0.076 (0.022) (0.120) (0.113) (0.137)
System Research Treasury Bond Program 0.449 0.113 0.245 0.135 1.000 0.322 (0.167) (0.138) (0.133) 0.151 0.475 0.454 (0.167) (0.014) 0.491 (0.006) 0.256 0.011
Tactical Equity:
CMG Opportunistic All Asset Strategy (0.064) 0.466 (0.057) (0.174) 0.322 1.000 0.085 0.543 0.655 0.438 0.173 0.042 0.787 0.369 0.085 0.673 0.403 0.627
Heritage Capital Gold Strategy (0.232) (0.057) 0.224 0.253 (0.167) 0.085 1.000 0.056 0.031 (0.011) (0.071) (0.021) (0.030) (0.040) (0.044) (0.040) 0.205 (0.044)
Howard Sector Rotation Program (0.340) 0.166 (0.391) (0.023) (0.138) 0.543 0.056 1.000 0.486 0.299 (0.156) (0.266) 0.592 0.251 (0.255) 0.512 0.213 0.499
Scotia Dynamic Momentum Program (0.280) 0.395 (0.082) (0.003) (0.133) 0.655 0.031 0.486 1.000 0.570 (0.019) (0.268) 0.727 0.586 (0.233) 0.741 0.320 0.715
Tactical Fixed Income:
CMG Managed HY Bond Program (0.130) 0.581 (0.134) 0.051 0.151 0.438 (0.011) 0.299 0.570 1.000 0.198 0.012 0.402 0.666 0.069 0.527 0.193 0.510
Index Correlations:
Barclays Aggregate Bond Index 0.203 0.246 0.058 (0.032) 0.475 0.173 (0.071) (0.156) (0.019) 0.198 1.000 0.924 (0.025) 0.221 0.893 0.052 0.206 0.073
Barclays Capital US Treasury Bond Index 0.234 0.042 0.104 0.015 0.454 0.042 (0.021) (0.266) (0.268) 0.012 0.924 1.000 (0.190) (0.097) 0.960 (0.160) 0.128 (0.135)
Barclays Equity Long Short Index (0.270) 0.421 (0.117) (0.272) (0.167) 0.787 (0.030) 0.592 0.727 0.402 (0.025) (0.190) 1.000 0.461 (0.154) 0.742 0.349 0.676
Barclays High Yield Credit Bond Index (0.021) 0.368 0.001 0.076 (0.014) 0.369 (0.040) 0.251 0.586 0.666 0.221 (0.097) 0.461 1.000 (0.055) 0.633 0.249 0.605
Barclays Long-Term Treasury Index 0.125 0.082 0.017 (0.022) 0.491 0.085 (0.044) (0.255) (0.233) 0.069 0.893 0.960 (0.154) (0.055) 1.000 (0.119) 0.142 (0.096)
DJ Wilshire 5000 Total Market Index (0.247) 0.385 0.074 (0.120) (0.006) 0.673 (0.040) 0.512 0.741 0.527 0.052 (0.160) 0.742 0.633 (0.119) 1.000 0.275 0.986
Philadelphia Gold & Silver Miners Index 0.135 0.217 (0.039) (0.113) 0.256 0.403 0.205 0.213 0.320 0.193 0.206 0.128 0.349 0.249 0.142 0.275 1.000 0.245
S&P 500 Total Return (0.225) 0.385 0.078 (0.137) 0.011 0.627 (0.044) 0.499 0.715 0.510 0.073 (0.135) 0.676 0.605 (0.096) 0.986 0.245 1.000
Description Of Correlation
Correlation, represented by the correlation coefficient (R), measures the extent of linear association of two variables, and ranges between -1 and +1. Perfect positive correlation (a correlation co-efficient of +1) implies that as one security moves, either up or down, the other security will
move in lockstep, in the same direction. Alternatively, perfect negative correlation (correlation co-efficient of -1) means that if one security moves in either direction the security that is perfectly negatively correlated will move by an equal amount in the opposite direction. If the
correlation is 0, the movements of the securities is said to have no correlation. It is completely random. For example, if one security moves up or down there is as good a chance that the other will move either up or down, but the way in which they move is totally random. A
correlation between -0.50 and 0.50 signifies a weak relationship between a strategy and either its peers or the general markets. We believe incorporating non-correlating strategies into a portfolio is essential for diversification.
Note: Starting date of data range is based off the inception of the CMG Managed HY Bond Program.
Barclays Aggregate Bond Index was formerly known as the Lehman Brothers Aggregate Bond Index. Barclays High Yield Credit Bond Index was formerly known as the Lehman Brothers High Yield Credit Bond Index.