1. Thermal Analysis
Thermogravimetric analysis(TGA)
Principle: In thermogravimetric analysis, the sample is heated in a given environment (air,
N2, CO2, He, Ar, etc.) at controlled rate. The change in the weight of the substance is
recorded as a function of temperature or time. The temperature is increased at a constant rate
for a known initial weight of the substance and the changes in weights are recorded as a
function of temperature at different time interval. This plot of weight change against
temperature is called thermogravimetric curve or thermogram, this is the basic principle of
TGA.
The change in the weight of the substance is due to the reason that, at higher
temperatures there is a rupture or formation of various physical and chemical bonds. As a
result of this process there is evolution of various volatile products or the formation of the
heavier reaction products. This leads to change in weight.
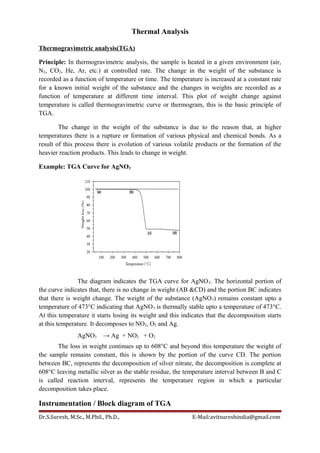
Example: TGA Curve for AgNO3
The diagram indicates the TGA curve for AgNO3. The horizontal portion of
the curve indicates that, there is no change in weight (AB &CD) and the portion BC indicates
that there is weight change. The weight of the substance (AgNO3) remains constant upto a
temperature of 473°C indicating that AgNO3 is thermally stable upto a temperature of 473°C.
At this temperature it starts losing its weight and this indicates that the decomposition starts
at this temperature. It decomposes to NO2, O2 and Ag.
AgNO3 → Ag + NO2 + O2
The loss in weight continues up to 608°C and beyond this temperature the weight of
the sample remains constant, this is shown by the portion of the curve CD. The portion
between BC, represents the decomposition of silver nitrate, the decomposition is complete at
608°C leaving metallic silver as the stable residue, the temperature interval between B and C
is called reaction interval, represents the temperature region in which a particular
decomposition takes place.
Instrumentation / Block diagram of TGA
Dr.S.Suresh, M.Sc., M.Phil., Ph.D., E-Mail:avitsureshindia@gmail.com
2. The apparatus required for TGA analysis are
(a) A furnace which can be heated so that the temperature gives linearity with time.
(b) A furnace controlled thermobalance:
A platinum crucible (sample container) is suspended from one end of the
balance. The other end of the balance is prevented from oscillating with a dewar flask
through a spiral during heating, so that it acts as damper. A known weight of the sample is
taken in a crucible(c), which is enclosed by a furnace (F). The furnace (F) temperature is
raised slowly, the temperature of the sample and the corresponding weight are taken as
follows.
A platinum/platinum rhodium thermocouple is used to measure the sample
temperature and the change in weights are found out by finding the beam deflection on
adding a known weight to the pan.(i.e) the change in the weight are recorded from the beam
deflection.
(c) Recorder: A recorder records the change in weight in y axis and w.r.to temperature on the
x-axis. We get a thermogram.
Factors affecting the TG curve
The factors which may affect the TG curves are classified into two main groups.
(1) Instrumental factors (2) Sample Characteristics
(1) Instrumental factors
(a) Furnace heating rate
(b) Furnace atmosphere
(c) Geometry of the sample holder
(d) Sensitivity of the recording balance and the recorder.
(a)Furnace Heating rate: The temperature at which the compound (or sample) decompose
depends upon the heating rate. When the heating rate is high, the decomposition
temperature is also high. If the rate of heating is less, the decomposition temperature is
also less. A low and constant heating should be done, to observe the various stages of
Dr.S.Suresh, M.Sc., M.Phil., Ph.D., E-Mail:avitsureshindia@gmail.com
3. decomposition. A heating rate of 3.5°C per minute is usually recommended for reliable
and reproducible TGA.
(b)Furnace atmosphere: The atmosphere inside the furnace surrounding the sample has a
profound effect on the decomposition temperature of the sample. One of the following
atmosphere can be used inside the furnace.
(i)Static air: In this maintaining ordinary air inside and outside the furnace.
(ii)Dynamic air: A pure N2 gas from a cylinder passed through the furnace which provides
an inert atmosphere.
(c) Crucible geometry/shape of the sample holder or crucible.
The crucible geometry influence the shape of the TG curve. A flat shaped crucible is used to
obtain a reproducible thermogram.
(d) Sensitivity of the thermobalance and the recorder.
The thermobalance should be highly sensitive, it should also give a slight change in weight
and the recorder should also be highly sensitive. It should record the slight changes in weight
and the temperature of the substance. The speed of recording should be perfect.
(2) Sample characteristics includes
(a) Weight of the sample
(b) Sample particle size
(c) Compactness of the sample
(a)Weight of the sample: A small weight of the sample is recommended using a small weight
eliminates the existence of temperature gradient throught the sample.
(b) Particle size of the sample: The particle size of the sample should be small and uniform.
The use of large particle or crystal may result in apparent, very rapid weight loss during
heating (or) larger particle size of the sample results in the rapid weight loss during heating.
(c)Compactness of the sample: A compressed, compact sample. Usually decompose at a
higher temperature than a loose sample.
Applications of TGA
(1) From TGA, we can determine the purity and thermal stability of both primary and
secondary standard.
(2) Determination of the composition of complex mixture and decomposition of complex.
6[Co(NH3)6]Cl3 → 3CoCl2 + 3(NH4)2CoCl4
3(NH4)2CoCl4 → 6NH4Cl(g) + 3CoCl2
Dr.S.Suresh, M.Sc., M.Phil., Ph.D., E-Mail:avitsureshindia@gmail.com
4. (3) For studying the sublimation behaviour of various substances.
(4) Correctness of error in gravimetric analysis.
(5) TGA is used to study the kinetics of the reaction rate constant.
(6) Used in the study of catalyst: The change in the chemical states of the catalyst may be
studied by TGA techniques. (Zn-ZnCrO4) Zinc-Zinc chromate is used as the catalyst
in the synthesis of methanol. The weight temperature curve of the catalyst obtained
during the reaction indicates that its composition is changed to ZnO.ZnCrO4.H2O in
the initial stage and then to 3 ZnO.ZnCrO4.
(7) Thermal stability of ligand: TGA and DTA gives information on the thermal
stabilities of groups(ligands) inside the coordination sphere. In a complex having
more than one type of ligand, which ligand leaves earlier on heating can be found out
from the weight of the complex, with increasing temperature. The trend stability of
ligand inside the coordination sphere is given as
Decreasing stability
NH3 > RNH2 > R2NH > R3N
(8) TGA is used in the analysis of mixture
(a) TGA of calcium oxalate monohydrate(CaC2O4.H2O)
• The successive plateau corresponds to the formation of anhydrous salt, calcium
carbonate and calcium oxide.
(a) CaC2O4.H2O → CaC2O4 + H2O
(b) CaC2O4 → CaCO3 + CO
(c) CaCO3 → CaO + CO2
• The thermogram indicates that the loss of water begins at 100°C and loss of CO at
400°C and CO2 at 680°C. This curve is quantitative, so stochiometrical calculation can
be done at any given temperature.
Dr.S.Suresh, M.Sc., M.Phil., Ph.D., E-Mail:avitsureshindia@gmail.com
5. Differential Thermal Analysis (DTA)
Principle:
The basic principle involved in DTA is the temperature difference (∆T) between the
test sample and an inert reference sample under controlled and identical conditions of heating
or cooling is recorded continuously as a function of temperature or time, thus the heat
absorbed or emitted by a chemical system is determined.
There is zero temperature difference between the sample and the reference material,
when the sample does not undergo any physical or chemical changes. If any reaction takes
place in the sample, then the temperature difference will occur between the sample and the
reference material.
In an endothermic change (such as melting or dehydration of the sample) the
temperature of the sample is lower than that of the reference material
(i.e) ∆T is negative for endothermic process
∆T = ve (for endothermic process)‒
In an exothermic change or process the sample temperature is higher than that of the
reference material.
(i.e) ∆T = + ve
After the completion of the reaction the ∆T will again be zero.
The shape and the size of the peak give information about the nature of the test sample.
(1)Sharp endothermic peaks indicate phase changes (such as melting, fusion etc.) transition
from one crystalline form to another crystalline form.
Dr.S.Suresh, M.Sc., M.Phil., Ph.D., E-Mail:avitsureshindia@gmail.com
6. (2) Broad endothermic peaks are obtained from dehydration reactions. Physical changes give
rise to endothermic curve, where as chemical reactions, particularly oxidative reactions are
exothermic reaction.
Instrumentation for DTA/Block Diagram
The DTA apparatus consists of the following components
(1) Furnace sample and reference holder with thermocouple assembly.
(2) Sample holder furnace(To heat the sample)
(3) Furnace temperature controller(to increase the furnace temperature steadily)
(4) Furnace atmospheric control system(To maintain a suitable atmosphere in the furnace
and sample holder)
(5) Low level DC amplifier
(6) Recording device(Recorder)
Differential temperature sensor (to measure the temperature difference between the
sample and reference material) the sample and reference holder are kept inside the furnace
and the temperature of the furnace and sample holder is controlled by using furnace
controller.
Atmospheric control:
The atmosphere inside the furnace surrounding the sample has some effect on the
temperature of the sample. An inert atmosphere is maintained. For this N2 gas from the
cylinder is passed through the furnace.
Dual thermocouple are used to measure the temperature difference between the sample
and the reference material, both the sample and the reference are heated in a furnace operated
by temperature programmer and controller, the output from the differential thermocouple are
amplified and recorded.
Factors affecting the DTA Curve
(a) Instrumental Factors:
(1) Size and shape of the sample and furnace holder.
(2) Material from which sample holder is made and its corrosive attack.
(3) Wire and beam size of the thermocouple junction(temp-sensor)
Dr.S.Suresh, M.Sc., M.Phil., Ph.D., E-Mail:avitsureshindia@gmail.com
7. (4) Position of the thermocouple in the sample and reference chamber.(thermocouple
should be in the middle of both the sample and reference material.
(5) Heating rate(furnace heating rate)
(6) Speed and response of recording equipment.
(b) Sample characteristics:
(1) Amount of the sample(sample weight)
(2) Particle size of the sample
(3) Packing density(compactness)
(4) Thermal conductivity of the sample material.
(5) Chemical activity of the sample.
(6) Heat capacity.
Applications of DTA
(1) DTA curves for two substances are not identical. Hence they serve as finger prints for
various substances.
(2) This method is used in determining the composition of naturally occurring and
manufactured products.
(3) Used to study the characteristic of polymeric material.
(4) This technique is used for testing the purity of the drug sample and also to test the
quality control of number of substances like cement, soil, glass textile, etc.
(5) Used for the determination of heat of reaction, specific heat and energy change
occurring during melting etc.
(6) Trend in ligand stability (thermal stability of the ligands) gives the information about
the ligands in the coordination sphere. If the complex contains more than one ligand,
then which ligand leaves first on heating can be found out easily from the weight of
the complex.
NH3 > RNH2 > R2NH > R3N
(7) DTA is useful in the study of organic reaction.
The rate and the nature of the organic reaction can be studied by DTA.
Example: Malonic acid on heating about 70°C, it undergoes phase transition and at
150°C it undergoes decarboxylation to acetic acid.
(8) The area of the DTA peaks gives quantitative information.
(9) DTA of calcium oxalate monohydrate: The DTA curve for the decomposition of
calcium oxalate monohydrate (CaC2O4.H2O) is shown in the diagram.
Dr.S.Suresh, M.Sc., M.Phil., Ph.D., E-Mail:avitsureshindia@gmail.com
8. The thermogram shows the decomposition in CO2 atmosphere. This has three peaks
corresponding to the successive elimination of H2O, CO and CO2. These three points
of weight loss corresponds to the three endothermic process. Each process requires
energy to break the bonds and thus is endothermic. Curve (b) represents the DTA
diagram for the same compound in air. The second peak in this curve is sharply
exothermic, but corresponds to the same weight loss as in carbon dioxide atmosphere.
This peak represents the exothermic burning of carbon monoxide in air at the
temperature of the furnace.
(10) DTA of calcium acetate monohydrate Ca(CH3COO)2H2O in different atmosphere.
(a)The first endothermic peak is unaffected by the change in the atmosphere. The
weight loss(less of water) initiates the formation of anhydrous salt.
Ca(CH3COO)2.H2O → (CH3COO)2Ca + H2O
(b)A second endothermic peak is obtained in argon and CO2 at. But exothermic is
obtained in air (O2). There is weight loss and this is due to the formation of CaCO3
and the evolution of one mole of CO2 and CO.
In O2 atmosphere, CO is oxidised to CO2, which is exothermic reaction.
Dr.S.Suresh, M.Sc., M.Phil., Ph.D., E-Mail:avitsureshindia@gmail.com
9. CO + 1/2O2 → CO2 (Heat evolved, exothermic)
(c)In the final stage, CaCO3 decomposes to calcium oxide (CaO) and CO2. This
process is a function of the partial pressure of CO2, so the decomposition of CaCO3
occurs at higher temperature in CO2 atmosphere (due to high partial pressure between
gas CO2 formed during decomposition and CO2 atmosphere), hence the peak is shifted
to a higher temperature in CO2 atmosphere.
Ca(CH3COO)2.H2O → (CH3COO)2Ca + H2O
Ca(CH3COO)2 → CaCO3 + CH3COCH3
CaCO3 → CaO + CO2
Dr.S.Suresh, M.Sc., M.Phil., Ph.D., E-Mail:avitsureshindia@gmail.com
10. CO + 1/2O2 → CO2 (Heat evolved, exothermic)
(c)In the final stage, CaCO3 decomposes to calcium oxide (CaO) and CO2. This
process is a function of the partial pressure of CO2, so the decomposition of CaCO3
occurs at higher temperature in CO2 atmosphere (due to high partial pressure between
gas CO2 formed during decomposition and CO2 atmosphere), hence the peak is shifted
to a higher temperature in CO2 atmosphere.
Ca(CH3COO)2.H2O → (CH3COO)2Ca + H2O
Ca(CH3COO)2 → CaCO3 + CH3COCH3
CaCO3 → CaO + CO2
Dr.S.Suresh, M.Sc., M.Phil., Ph.D., E-Mail:avitsureshindia@gmail.com