SlideShare uma empresa Scribd logo
1 de 60
Baixar para ler offline
A STUDY ON CONSUMER PREFERENCE FOR
SCENTED RICE IN BANGALORE CITY
SUNIL KUMAR, M.
MBAL 2027
DEPARTMENT OF AGRICULTURAL MARKETING,
CO-OPERATION AND BUSINESS MANAGEMENT
UNIVERSITY OF AGRICULTURAL SCIENCES
GKVK, BANGALORE- 560 065
2014
A STUDY ON CONSUMER PREFERENCE FOR
SCENTED RICE IN BANGALORE CITY
SUNIL KUMAR, M.
MBAL 2027
Project Report submitted to the
University of Agricultural Sciences, Bangalore
in partial fulfillment of the requirements
for the degree of
Master of Business Administration
(Agribusiness Management)
BANGALORE OCTOBER, 2014
Affectionately Dedicated to
My parents
Mrs. VIJAYA LAXMI
&
Mr. MALLIKARJUN
ACKNOWLEDGEMENT
I humble place before the throne of the Almighty, my most sincere gratitude. His
grace and tender mercies have renewed me every day, all the way on the journey through
my life.
I want to show my all the gratitude to my parents Mr. Mallikarjun and
Mrs. Vijaya Laxmi only because of their blessings I am here.
With immense pleasure and deep respect, I express my heartfelt gratitude to the
Chairman of my advisory committee Dr. G. N. Nagaraja, Professor, Dept. of
Agricultural Marketing, Co-operation and Business Management, UAS, GKVK,
Bangalore, for his excellent guidance, constant support, close counsel and valuable
suggestions throughout the period of my study. His enthusiasm, interest, concern,
perfection and constructive criticism have always aroused my spirits to do more, to
achieve higher.
I am extremely grateful to members of my Advisory Committee,
Dr. P. K. Mandanna, Professor and University Head, Dept. of Agricultural
Marketing, Co-operation and Business Management, UAS, GKVK, Banglore;
Dr. C. P. Gracy, Professor, Dept. of Agricultural Marketing, Co-operation and
Business Management, UAS, GKVK, Banglore and Dr. D. Nanjappa, Professor,
Dept. of Agricultural Extension,UAS, GKVK, Bangalore for their valuable
suggestions, encouragement and critical comments during the course of this study.
I express my deep sense of reverence to Dr. M. S. Jayaram, Professor and Head,
Department of Agricultural Marketing, co-operation and business management, UAS,
GKVK, Bangalore for his kind co-operation and constructive suggestions during my
project work.
I greatly acknowledge the cooperation and help extended by my teachers
Dr. B. M. R. Reddy and Dr. M. S. Ganapathy and Mr. P. V. Ramegowda (retired),
Department of Agricultural Marketing, Co-operation & Business Management.
My special thanks to Dr. M. R. Girish, Asst. Professor (Sr. scale) and placement
co-coordinator, Dept. of Agricultural Marketing, co-operation and business
management, UAS, GKVK, Bangalore, for his inspiring encouragement, friendly
atmosphere, valuable idea and suggestions.
I thank my friends Akhilesh, Gourav, Vivekananda, Sunil Gouda,
Naganagouda, Mahantesh, Satish and Nazeer for their friendship, love, help and care
and for making the two year study in Bangalore, enjoyable and memorable.
I thank to my brother Mr. Vinod Kumar M, my Cousins Mr. Basavaraj and
Prabhudeva Palled for their moral support extended to me.
Bangalore
October, 2014 (Sunil Kumar, M.)
A STUDY ON CONSUMER PREFERENCE FOR SCENTED RICE IN
BANGALORE CITY
SUNIL KUMAR, M.
ABSTRACT
The present study was conducted to analyze the consumer awareness, preference
and factors influencing buying of scented rice in Bangalore city. The primary data were
collected by 40 consumers, 20 retailers and 20 hoteliers. The sourcing scented rice by
hoteliers and retailers were also documented. The major findings of the study revealed
that all consumers were aware of Basmati rice and Kalijira was known to 27.50 per cent
consumers. The consumer preference was analysed using Best-Worst scaling technique.
While purchasing scented rice aroma, price, taste, grade, cooking time, brand and after
cooking grain size were most preferred characters and While consumers were least
preferred characteristics like impurities, texture, stickiness, broken grain, age of rice,
grain size and colour. The study was identified the factors influencing buying decision
using factor analysis. The factors that significantly influenced the buying of scented rice
were income, price of scented rice, festivals, country of origin, retailers, availability of
scented rice, nutritive value, traditions, friends, advertisements and taste. Offers and
marital status of the consumers were not significant factors influencing in buying scented
rice. Provision store owners were procuring scented rice from wholesalers. The owners of
convenience stores procured scented rice from distributors/stockists. The supermarket/
hypermarket procured scented rice from their respective distribution centres. Seventy five
per cent of the hoteliers procured scented rice from wholesalers, ten per cent of them
were procured scented rice from distributors and 15 per cent of the hoteliers were not
using any scented rice. There are ten different companies selling basmati rice with
thirteen brands in Bangalore city.
Date: October, 2014 G. N. NAGARAJA
Place: Bangalore Major Advisor
¨ÉAUÀ¼ÀÆgÀÄ £ÀUÀgÀzÀ ¸ÀĪÁ¹vÀ CQÌ UÁæºÀPÀgÀ DzÀåvÉ: MAzÀÄ CzsÀåAiÀÄ£À
¸ÀĤ¯ï PÀĪÀiÁgï, JA.
¸ÁgÁA±À
¥Àæ¸ÀÄÛvÀ CzsÀåAiÀÄ£ÀªÀÅ ¨ÉAUÀ¼ÀÆgÀÄ £ÀUÀgÀzÀ UÁæºÀPÀgÀ eÁUÀÈw, DzÀåvÉ ªÀÄvÀÄÛ ¸ÀĪÁ¹vÀ CQÌ Rjâ
CA±ÀUÀ¼À£ÀÄß «±Éèö¸À®Ä £ÀqɸÀ¯ÁVzÉ. zÀvÁÛA±ÀªÀ£ÀÄß 40 UÁæºÀPÀgÀÄ, 20 a®ègÉ CAUÀrAiÀĪÀgÀÄ ªÀÄvÀÄÛ 20
ºÉÆÃmÉ¯ï ªÀiÁ°ÃPÀgÀ ªÀÄÆ®PÀ ¸ÀAUÀ滸À¯ÁVzÉ ºÁUÀÄ a®ègÉ CAUÀr ªÀÄvÀÄÛ ºÉÆÃmÉ¯ï ªÀiÁ°ÃPÀjAzÀ ¸ÀÄUÀA¢üvÀ
CQÌ ¥ÀÆgÉÊPÉAiÀÄ §UÉÎ zsÁR°¹PÉƼÀî¯ÁVzÉ. CzsÀåAiÀÄ£À¢AzÀ w½zÀÄ §AzÀ ¥ÀæªÀÄÄR CA±ÀUÀ¼ÉAzÀgÉ, J¯Á
UÁæºÀPÀjUÉ ¨Á¸ÀĪÀÄw CQÌAiÀÄ §UÉÎ Cj«zÉ ªÀÄvÀÄÛ ±ÉÃ. 27.50 gÀµÀÄÖ UÁæºÀPÀgÀÄ PÁ°fÃgÀ CQÌAiÀÄ §UÉÎ
w½¢zÁÝgÉ. UÁæºÀPÀgÀ DzÀåvÉ CzsÀåAiÀÄ£ÀzÀ ¸À®ÄªÁV ¨É¸ïÖ-ªÀ¸ïÖ ªÀiÁ¥À£ÀªÀ£ÀÄß G¥ÀAiÉÆÃV¸À¯ÁVzÉ. ¸ÀĪÁ¹vÀ
CQÌAiÀÄ°è ¥ÀjªÀļÀ, CQÌAiÀÄ ¨É¯É, gÀÄa, UÉæÃqï, CqÀÄUÉUÉ vÀUÀ®ÄªÀ ¸ÀªÀÄAiÀÄ, ¨ÁæAqï ªÀÄvÀÄÛ CqÀÄUÉ £ÀAvÀgÀzÀ
zsÁ£Àå UÁvÀæ EªÀÅUÀ¼ÀÄ ºÉZÀÄÑ DzÀåvÉUÉ ¥ÁvÀæªÁVªÉ. UÁæºÀPÀgÀÄ CQÌAiÀÄ ªÀAiÀĸÀÄì, PÀ®ä±À, «£Áå¸À, fUÀÄlÄvÀ£À,
ªÀÄÄjzÀ zsÁ£Àå EªÀÅUÀ½UÉ PÀrªÉÄ DzÀåvÉ ¤ÃrzÁÝgÉ. Rjâ ¤zsÁðgÀ CA±ÀUÀ¼À£ÀÄß «±Éèö¸À®Ä CA±À «±ÉèõÀuÉ
§¼À¸À¯Á¬ÄvÀÄ. DzÁAiÀÄ, DQÌAiÀÄ ¨É¯É, ºÀ§âUÀ¼ÀÄ, ¸ÀA¥ÀæzÁAiÀÄUÀ¼ÀÄ, ¸ÉßûvÀgÀÄ, a®ègÉ CAUÀrAiÀĪÀgÀÄ,
eÁ»gÁvÀÄUÀ¼ÀÄ, ¥Ë¶ÖPÀvÉ, gÀÄa, ®¨sÀåvÉ ªÀÄvÀÄÛ zÉñÀ EªÀÅUÀ¼ÀÄ ¸ÀĪÁ¹vÀ CQÌ RjâAiÀÄ°è UÀªÀÄ£ÁºÀð ¥Àæ¨sÁªÀ
©ÃgÀĪÀ CA±ÀUÀ¼ÁVªÉ. PÉÆqÀÄUÉUÀ¼ÀÄ ªÀÄvÀÄÛ UÁæºÀPÀgÀ ªÉʪÁ»PÀ ¹Üw ¸ÀĪÁ¹vÀ CQÌ RjâAiÀÄ°è ¥ÀæªÀÄÄR
CA±ÀUÀ¼ÁVgÀĪÀÅ®è. a®ègÉ CAUÀrAiÀĪÀgÀÄ ¸ÀUÀlÄ ªÁå¥ÁjUÀ½AzÀ ¸ÀĪÁ¹vÀ CQÌAiÀÄ£ÀÄß Rjâ¸ÀÄvÁÛgÉ.
PÀ¤éäAiÀÄ£ïì ¸ÉÆÖÃgïì£À ªÀiÁ°ÃPÀgÀÄ «vÀgÀPÀgÀÄ/zÁ¸ÁÛ£ÀÄzÁgÀjAzÀ Rjâ¸ÀÄvÁÛgÉ. ¸ÀÆ¥Àgï ªÀiÁPÉðmï/ºÉÊ¥Àgï
ªÀiÁPÉðmïUÀ¼ÀÄ vÀªÀÄä «vÀgÀuÁPÉÃAzÀæUÀ½AzÀ ¥ÀÆgÉʹPÉƼÀÄîvÀÛªÉ. ±ÉÃ. 75 gÀµÀÄÖ ºÉÆÃmÉ¯ï ªÀiÁ°ÃPÀgÀÄ ¸ÀĪÁ¹vÀ
CQÌAiÀÄ£ÀÄß ¸ÀUÀlÄ ªÁå¥ÁjUÀ½AzÀ ¸ÀAUÀ滹gÀÄvÁÛgÉ. ±ÉÃ.10 gÀµÀÄÖ ºÉÆÃmÉ¯ï ªÀiÁ°ÃPÀgÀÄ
«vÀgÀPÀgÀÄ/zÁ¸ÁÛ£ÀÄzÁgÀjAzÀ ¸ÀĪÁ¹vÀ CQÌAiÀÄ£ÀÄß Rjâ¸ÀÄvÁÛgÉ. ±ÉÃ. 15 gÀµÀÄÖ ºÉÆÃmÉ¯ï ªÀiÁ°ÃPÀgÀÄ
AiÀiÁªÀÅzÉà ¸ÀĪÁ¹vÀ CQÌAiÀÄ£ÀÄß §¼À¸ÀĪÀÅ¢®è. ¨ÉAUÀ¼ÀÆgÀÄ £ÀUÀgÀzÀ°è ««zsÀ ¸ÀA¸ÉÜUÀ¼À 13 ¨ÁæAqïUÀ¼À
¨Á¸ÀĪÀÄw CQÌ ªÀiÁgÁlªÁUÀÄwÛªÉ.
¢£ÁAPÀ: CPÉÆÖçgï, 2014 f. J£ï. £ÁUÀgÁd
¸ÀܼÀ: ¨ÉAUÀ¼ÀÆgÀÄ ¥ÀæzsÁ£À ¸À®ºÉUÁgÀgÀÄ
CONTENTS
CHAPTER TITLE PAGE No.
I INTRODUCTION 1-7
II REVIEW OF LITERATURE 8-16
III METHODOLOGY 17-20
IV RESULTS 21-32
V DISCUSSION 33-36
VI SUMMARY AND CONCLUSION 37-39
VII REFERENCES 40-44
LIST OF TABLES
Table
No.
Title of table
Page
No.
4.1 Socio-economic profile of the consumers in Bangalore city 22
4.2 Profile of buying decision maker in Bangalore city 23
4.3 Awareness of consumers about different types of scented rice 24
4.4 Frequency of consumption of scented rice in Bangalore city 24
4.5
Food prepared by vegetarian consumers using scented rice in
Bangalore city
26
4.6
Food prepared by non-vegetarian consumers using scented rice
in Bangalore city
26
4.7
Consumers’ monthly purchase pattern of scented rice in
Bangalore city
28
4.8
Consumers’ preference for various attributes of scented rice in
Bangalore city
29
4.9
Factors influencing buying decision of scented rice by consumers
in Bangalore city
30
4.10 Procurement of scented rice by retailers in Bangalore city 32
4.11 Major brands of Basmati rice in Bangalore city 32
4.12 Other brands of scented rice in Bangalore city 32
LIST OF FIGURES
Fig.
No.
Title of figure
Between
Pages
1. Types of scented rice 26-27
2. Consumer preference for various rice attributes in Bangalore city 30-31
3. Major brands of Basmati rice available in Bangalore city 32-33
4. Kalijira rice brand available in Bangalore city 32-33
5. Jasmine rice brands available in Bangalore city 32-33
6. Brown rice brand available in Bangalore city 32-33
7. Gandhasale rice brand available in Bangalore city 32-33
A Study on Consumer Preference for Scented Rice in Bangalore City 1
I. INTRODUCTION
Rice (oriza sativa L.) is a dietary staple for about 62.80 per cent of the inhabitants
on the planet and accounts for 20 per cent of the calorie intake for the world population.
In Asia it accounts for 29.30 per cent (Timmer, 2010). This segment varies from 26.80
per cent for China to 69.80 per cent for Bangladesh. Currently, fragrant rice is a niche
market for the premium segment, whereas the main market for coarse rice trading is
through government procurements related to food policy and security in Asia and Africa.
Fragrant rice is generally identified by three main factors: appearance, aroma and
taste (Chaudhary et al., 2003). It is characterized as a superfine grain, with a pleasant and
subtle aroma. It has a soft texture and extreme grain elongation with a breadth-wise
swelling that occurs with cooking. Basmati and Jasmine are premium long grain rice and
their high value comes from the characteristic fragrance in both the raw and cooked
states, and for the distinctive shape of the grain, which upon cooking elongates to almost
double its length whilst its width remains the same. In addition to having a desirable taste
and texture, basmati and Jasmine rice are reported to be a good source of slow releasing
carbohydrates, i.e. it has a low glycemic index compared with other rice. Basmati rice has
traditionally been grown in the north and northwestern part of the Indian sub-continent
for centuries. The best cropping conditions for Jasmine are found in north and
northeastern Thailand. Fragrant rice produces the best quality grains under warm, humid,
and valley-like conditions. Because of the attractive price premiums, some stakeholders
are prone to provide fragrant rice, not sourced from its genuine regions and consequently
offer consumers less aroma.
1.1 Different types of scented rice
Some of the important varieties of scented rice in India include the Basmati of
north-western India, Kalanamak of Uttar Pradesh, Dubraj and Chinoor of Madhya
Pradesh, Ambemohar of Maharashtra, Radhunipagla of West Bengal, Jeerakasamba of
Tamil Nadu, Gandhasale of Karnataka and Kalijira from UP and Badshabog of Orissa.
1.1.1 Basmati
Basmati is long grain scented rice grown for many centuries in the specific
geographical area; at the Himalayan foot hills of Indian sub-continent, blessed with
characteristics extra- long slender grains that elongate at least twice of their original size
with a characteristics soft and fluffy texture upon cooking, delicious taste, superior aroma
and distinct flavour. Basmati rice is unique among other scented long grain rice varieties.
The aroma is due to the presence of chemical called 2-acetyl-1-pyrroline which is found
in basmati at about 90 ppb.
2 Sunil Kumar, M
1.1.2 Jasmine
Jasmine rice sometimes known as Thai fragrant rice is a long-grain variety
of rice that has a nutty aroma and a subtle pandan-like (Pandanus amaryllifolius) leaves.
The flavour caused by 2-Acetyl-1-pyrroline. Jasmine rice is originally
from Thailand. The grains will cling when cooked, though it is less sticky than other rice.
It is also known as Thai Hom Mali.
1.1.3 Kalijira
Kalijira rice is from UP. This is a miniature basmati which is non-glutinous.
1.1.4 Gandhasale
Gandhasale is a traditional flavoured and scented rice variety of Karnataka, has
been the favorite of rice farmers for ages. It is a disease resistant and a hardy variety. Has
high dietary fiber compared to white rice. Cultivated in small pockets and is on the verge
of being lost from the food basket.
1.1.5 Brown rice
Brown rice (or hulled or unmilled rice) is whole grain rice. It has a mild, nutty
flavour, and is chewier and more nutritious than white rice, but goes rancid more quickly
because the bran and germ which are removed to make white rice contain fats that can
spoil. Any rice, including long-grain, short-grain, or sticky rice, may be eaten as brown
rice.
1.2 Historical perspective
Scented rice always had a special place in countries where rice is the staple. For
example, in Japan, home grown Koshihikari is considered worth its weight in gold. Black
scented rice was a favourite of the royalty in china. Other important scented varieties in
the world market are Khao Dawk Mali 105, Siamati (Thailand), Bahra (Afganistan),
Sadri (Iran), Della, Texamati and Kasmati (USA).
Scented rice have been known in the Indian subcontinent since the times of
Charaka (600 B. C) and Sushruta (200 B.C). These rice have played an important role in
many regional economies, and have been the favourites of kings, religious heads, royal
and the elite of society (Ahuja et al., 2008).
The Rigveda (1000 B. C), the oldest of the vedas, mentions dhan, dhana and
dhanya. It is widely believed that these terms refers to rice, as the remains of both wild
and cultivated rice have been found in sites dating back to the Neolithic period. By the
time of Yejurveda, rice attained the status of a holy grain and formed an integral part of
offerings to God, in addition to its basic role in food (Kamal, 1988; Kansara, 1995).
During this period, the term vrihi was used for rice. The different types of rice recognized
A Study on Consumer Preference for Scented Rice in Bangalore City 3
included black (krishnavrihi), white (shukla vrihi), large (mahavrihi), swift-growing
(asunamvrihi) and wild (nivara) rice.
The Taittiriya Bramhana of Yajurveda (1200 B. C) mentions the use of specific
rice as offerings to specific divinities. Mahavrihi rice was offered to Indra, the God of
rain and the noblest of Gods; black krishnavrihi to Agni, the God of fire, white
shuklavrihi to Aditya, the sun God and wild nivara rice to Brihaspati, the God of speech
(Kumar, 1998).
By the time of the Atharvaveda, the terms tandula and odana were used
respectively for rice and boiled rice. Hayana, the red rice is mentioned in the Satapatha
Bramhana of the Atharvaveda, was also offered to indra.
In the Buddhist period, the terms Sali and sugandha for rice first appeared in the
scripture Vinaya Pitaka and the Charaka Samhita respectively. In his classical Ayurvedic
treatise, charaka classified rice into three types- Sali, vrihi and shastika (Kumar, 1998).
Later, Susruta identified 43 groups. Groups were differentiated on the basis of
morphological characters such as husk, grain and awn colour, grain shape, time of
ripening and planting, growth duration and presence of scent. This is evident from the
varietal names such as raktasali (red Sali), mahasali (large grained), kalama (large pen-
like stem), pandhu (pale awns), mahish (blach husked), rodhrapuspaka (red like the
rodhra flower) and dirghashuka (large awned). Scholars such as Charaka and Susruta
studied plants and rice varieties in the context of their medicinal value. Mahasali and
sugandhika, pramodaka, pundrika and pushpandaka groups were identified as scented
(Vidyalankar, 1994).
In the 9th
century Kashyapiyakrishisukti, one of the earliest treatises fully devoted
to agriculture, the philosopher Kashyapa gives an elaborate account of the cultivation
method, seed collection and classification of rice varieties (Ayachit, 2002). Kashyapa
classified rice into 26 groups with following distinct types: Sali, kalama, vrihi, yava,
sambhaka and nivara. Among these, the Sali, kalama, sambhaka and vrihi types had a
scented subgroup- long Sali (deergasali) having a sweet flavour, black sambhaka, palasa
vrihi (full of flavour) and Kalama (possessing great flavour) (Raychaudhuri, 1964).
1.3 Production
Worldwide, paddy crop was estimated at 721 mt during 2011, producing 481 mt
of milled rice, while global rice trade was estimated at 34.3 mt, on a milled basis (FAO,
2012). Specific data related to fragrant rice cropping is scarce, although it comes
primarily from three countries: India, Pakistan and Thailand (Chaudhary et al., 2003).
The USA started cropping of fragrant rice in 1990, but no data is available in this special
category on the well documented USDA website. Among the suppliers of the USA Rice
Federation, 13 millers are providing aromatic rice. In Asia, Vietnamese and Cambodian
fragrant rice is exported to Thailand as coarse rice.
4 Sunil Kumar, M
Although scented rice popular in world market are long grained, majority of the
Indian indigenous scented rice are small and medium-grained. A large number of land
races of these rice are found in Himalayan Tarai region of the state of UP and Bihar of
India, indicating that this region is probably the origin of scented rice.
India and Pakistan are the countries that hold the patent to produce basmati rice
in the world. In 2012, Basmati rice production was 9.5 mt. India accounts for 75 per cent
of total basmati rice produced. The remaining 25 per cent is contributed by Pakistan.
The Pusa 1121 Basmati rice variety was released for commercial cultivation in
2003. Pusa 1121 is known for its extraordinary length of up to 9.5 mm and unique
fragrance, and has since become hugely popular among both farmers and exporters.
Today, Pusa 1121 accounts for almost 70 per cent of around 2.6 million hectares of total
acreage under basmati rice cultivation in India.
In 2012, the major basmati rice producing states were Punjab (27.23 lakh tonne),
Haryana (24.26 lakh tonne) and Uttar Pradesh (17.53 lakh tonne). The other states were
Uttarkhand, Jammu and Kashmir, Himachal Pradesh and Delhi.
Fragrant rice is well-known for its low yield, which produces approximately half
that of coarse rice. Consequently the seed industry has sought to improve its yield
through crossbreeding of selected strains of promising agronomic traits. Year-after-year,
new varieties of fragrant rice are released on the market which are providing better results
at the harvesting stage. Stakeholders have also noticed that the fragrance of aromatic rice
is becoming lighter. Thus, it is worth considering the possible effect that yield
improvements have on aroma.
India leads globally in the production and export of Basmati rice, but this variety
accounts for less than 2 per cent of the total Indian rice production. It is estimated that
India produced approximately 4.25 million metric tonnes of Basmati rice which accounts
for 75 per cent of the entire global production of this rice type. Two-thirds of the Basmati
rice produced in India is exported. The yield/hectare of Basmati paddy in India is
approximately 30 per cent less than the yield/hectare of non-basmati paddy. Basmati is
exported across the globe, with a majority of consumers (by volume) in the Middle East,
UK and US. The main Basmati varieties grown in India are Basmati 370, Basmati 217,
Taraori (Karnal, Local, HBC–19), Haryana Basmati (HKR 228/IET 0367), Mahi
Suganda, Dehradun (Type 3), Basmati 386, Ranbir Basmati (IET 11348), and Kasturi
(IET 8580).
1.4 Global trade
Scented rice constitute a small but special group of rice which are considered best
in quality. These rice have long been popular in the orient, and are now becoming more
popular in middle east, Europe and the United States. Most of the trade in scented rice is
from India, Pakistan and Thailand. Non-scented long and medium grained indicas and
short grained japonicas constitute the bulk (79%) of world trade, mainly dominated by
A Study on Consumer Preference for Scented Rice in Bangalore City 5
Thailand, USA, Vietnam and Australia. Yet it is the scented Basmati rice of the Indian
sub-continent which clinches a premium and gets three-time higher price than high
quality non-Basmati types. Bulk of scented rice from India and Pakistan consists of
Basmati types, while Thailand is the supplier of Jasmine rice.
Globally rice trading is low and accounts for only 7.13 per cent of the rice
production. Fragrant rice (mainly basmati and Jasmine) is included in this production and
accounts for around 15-18 per cent of the worldwide rice trade. Some new players are
interested in entering this premium segment, including the US, Vietnam, and other rice
growers and traders (Georges, 2013). Fragrant rice is considered marginal in worldwide
trade and largely ignored in well-documented overviews of rice marketing (Baldwin and
Childs 2011; FAO 2012; Young and Wailes 2003). Basmati trade increased from 5.2 per
cent to 8.3 per cent in all world rice trade from 2003 to 2008, with a record of 2.45 mt, on
milled basis.
The fragrant rice trade is rather concentrated in a few countries. In 2008, the top
five clients of India have a share of 84.9 per cent, of basmati exports from this country,
those of Pakistan 68.5 per cent, and those of Thailand 51.7 per cent of Jasmine. Basmati
is primarily exported to Saudi Arabia, EU, Kuwait, Union of Arab Emirates and USA,
while Jasmine is shipped to China, Hong-Kong, Singapore, USA, EU and Macau.
According to GDP per capita, high-quality (grains) fragrant rice is exported to rich
countries, whereas fragrant broken grain is often exported to Africa, mainly the Ivory
Coast, Senegal and Ghana (Slayton and Muniroth, 2011).
The demand for basmati rice has been consistently growing at a compound annual
growth rate (CAGR) of 20 per cent driven by a robust growth in its exports as well as
domestic consumption. A 5 per cent lower output in 2012-13 has resulted in a demand-
supply mismatch for the commodity, thereby pushing the price higher by almost 50 per
cent.
India is the leading exporter of the Basmati Rice to the global market. The
country has exported 37,57,271.44 MT of Basmati Rice to the world for the worth of Rs.
29,299.96 crores during the year 2013-14. The major export destinations were Iran, Saudi
Arabia, Iraq, Kuwait and United Arab Emirates (www.apeda.gov.in).
The demand for basmati rice has grown at a CAGR of 20 per cent in the past
seven years. Around 45 per cent of the basmati rice demand emanates from exports and
the balance from domestic consumption. The sharp growth in India’s basmati rice exports
over the past five years (25% CAGR) has been underpinned by the inclusion of hybrid
varieties (such as Pusa 1121) in the basmati rice category. These hybrid varieties, which
are relatively cheaper than the traditional basmati varieties, have fast gained acceptability
in the major export markets such as Saudi Arabia and Iran, and thus expanded the market
for basmati rice.
Global demand for basmati rice emanates majorly from west Asia. The west
Asian countries together account for three-fourth of the total basmati rice exports from
6 Sunil Kumar, M
India. The demand for basmati rice from these destinations to remain steady, given the
insufficient domestic production of rice in these countries, the consistently declining
basmati rice exports from Pakistan, their proximity to India and the distinct preference for
superior quality basmati rice that has developed in these countries over the past decade.
Over the last five years, the Indian basmati rice exports have registered a CAGR
of 25 per cent whereas Pakistani rice exports have declined. Thus, India has doubled its
share in global basmati exports from 28 per cent to 57 per cent over the period. The
incremental global demand for basmati rice is thus being entirely met by increasing
exports from India.
1.5 Domestic consumption
In addition to India’s growing exports, the domestic consumption of basmati rice
is growing at a healthy CAGR of 15 per cent over the medium term, buoyed by the
increasing spending power of the middle-income sections of the society. Moreover, the
proliferation of the modern retailing format has helped fuel the consumption of a higher
quantum of branded products, as Indian consumers are fast embracing the mall culture
and organized retail, triggering a shift from unbranded to branded rice and from economy
to premium brands. In 2012, the domestic basmati rice market was worth Rs. 10,000
crores (Ajay, 2013).
The number of players in the packaged rice market has doubled in the past three
years, reflecting the confidence of the new entrants in the future of the packaged rice
segment in India. Furthermore, the major existing brands are expanding their distribution
network and focusing on their cost structure to cash in on the value-for-money and also
the high quality proposition to capture a share of the domestic market, e.g. by splurging
on promotional marketing techniques. Such brands include Lal Qilla, Double Diamond
Brand Basmati Rice, Hanuman Brand Basmati Rice, RST Brand Basmati Rice, Resham
Brand, Tilda Basmati rice, Pari Basmati Rice, Adora Basmati, Daawat Basmati, Kohinoor
Basmati, Blue Label Basmati, Lal Haveli Basmati, Doon Basmati, etc.
There are many store brands of basmati rice available in the market. These are
bought, packaged, and put on the shelves by retailers through their own individual
procurement and supply chain systems. Some of the popular private labels are Max
Economy, Max Premium, More Pvt. Ltd., Shoprite Pvt. Ltd., Spencer’s Smart Choice
Regular, Spencer’s Smart Choice Premium, Nilgiris Pvt. Ltd., Food Bazaar, Metro Pvt.
Ltd., Heritage Pvt. Ltd., V Fresh – Vishal Mega Mart, Reliance Select, etc.
The domestic consumption of basmati rice is expected to grow at a healthy CAGR
of 15 per cent over the medium term, buoyed by the increasing spending power of the
middle-income sections of the society. Moreover, the proliferation of the modern
retailing format has helped fuel the consumption of a higher quantum of branded
products, as Indian consumers are fast embracing the mall culture and organized retail,
triggering a shift from unbranded to branded rice and from economy to premium brands.
A Study on Consumer Preference for Scented Rice in Bangalore City 7
With this backdrop, a comprehensive study on the consumer preference for
scented rice was undertaken with the following objectives.
1.6 Objectives of the study
i. To examine the consumer awareness about types and brands of scented rice,
ii. To analyze the users preference for scented rice,
iii. To identify the factors influencing usage of scented rice and
iv. To identify the sourcing of scented rice.
1.7 Scope of the study
Scented rice is an important food crop of considerable commercial importance.
The changing life styles, rising middle class population, increase in disposable income
has resulted in increased consumption of scented rice. The expansion of organized
retailing has brought about the increase in scented rice consumption.
1.8 Limitations of the study
This study is based on the primary data collected from sample consumers by
survey method. Data on different types and brands of scented rice was also gathered.
Consumers’ preference and required information was collected and it was subjected to
their recall memory and experience. The study area was limited to Bangalore city and the
findings may not be generalised to other places, as vast difference exists among the
consumers with regard to demographic and psychographic characteristics.
1.9 Presentation of the study
The project report is organized into seven chapters. The first chapter provides a
brief introduction along with the background of the study, the specific objectives, scope
and limitations of the study. The second chapter pertains to the review of literature in
consonance with study objectives. The third chapter describes main features of the study
area, sampling framework and analytical tools employed. The empirical results are
presented in fourth chapter followed by critical discussion about the results of the study
in fifth chapter. Sixth chapter summarizes the major findings of the study and practical
utility. Finally, seventh chapter covers the list of references quoted in the present study.
A Study on Consumer Preference for Scented Rice in Bangalore City 8
II. REVIEW OF LITERATURE
1. Consumer awareness about types and brands of scented rice
Hori et al. (1992) conducted a survey on aromatic (scented) rice with 150 people
in each capital in Indonesia, Philippines, Korea and Japan in order to ascertain if they are
familiar with the rice and prefer the aroma. Many of the subjects in Jakarta and Manila
know of aromatic rice, and they often eat it and even prefer it. However, people in Seoul
and Tokyo do not knew of the rice. One hundred and seventy-five out of 246 persons
(71%) in Kochi, Japan, know of the rice and over 60 per cent of the subjects eat it. Most
of the subjects who have eaten aromatic rice prefer the aroma. There is a great difference
in the distribution of aromatic rice between East and South-east Asia. Significant
differences are also found between Jakarta and Manila in the distribution and preference
of rice.
Hori et al. (1996) studied the knowledge about aromatic rice and whether they
have a preference for the rice in Britain. The people knew of and have a high preference
for aromatic rice and have a high frequency of eating the rice, although they do not
usually buy or eat aromatic rice and/or ordinary rice. The sensory test showed that the
preferences of aroma, taste and overall palatability for plain cooked Basmati (aromatic)
rice were almost the same as for long grain (ordinary bland) rice. The aroma and taste of
the sushi made of Basmati, however, were given higher scores than those of the sushi
made of ordinary bland rice. On the other hand, the Japanese panelists did not give higher
scores to the plain rice cooked using aromatic rice and to the sushi made of the rice.
However, the sushi made of aromatic rice may be found acceptable by Japanese people.
This study shows a possible way of making use of aromatic rice in Japan as well as in
Britain.
Diako et al. (2010) reported that the consumer perceptions, knowledge and
preferences for aromatic rice as a basis for quality improvement of local rice. Results
showed that most consumers (94.9%) were more familiar with imported rice and this was
reflected in their patronage patterns.
Ibitoye, et al. (2014) studied to understand consumers’ awareness towards organic
rice in Malaysia. The survey was conducted at major supermarkets in Klang Valley. Data
were analysed using descriptive analysis and chi-square analysis using cross-
classification techniques, and correlation to determine their relationship, strength and
direction of their relationship. The findings showed majority of the respondents (85.6%)
have some level of awareness towards organic rice, while only 64.7 per cent planned to
consume organic rice in the future. The study indicated that awareness of consumers
towards organic rice does not necessarily translated to their planning to consume organic
rice. The study also showed that the younger respondents have more concern towards
organic rice
9 Sunil Kumar, M
2. Users preference for scented rice
Meullenet et al. (2001) studied twenty-one rice samples covering examples of
aromatic, long and medium grain, instant, and parboiled products were evaluated by a
group of 120 Asian consumers, currently living in the United States and by a
professionally trained sensory panel. Results showed that imported Thai Jasmine rice was
preferred by this group of Asian consumers over every other rice tested including
domestically grown Jasmine rice. The most important acceptance factors for Asian
consumers were cooked rice appearance and aroma. Predictive models of rice overall
acceptance were evaluated using descriptive sensory evaluation data (i. e. including
appearance, flavour and texture attributes).
Suwansri et al. (2002) evaluated three domestic and 12 imported commercial
Jasmine rice varieties by a trained sensory panel and by 105 Asian families who live in
the State of Arkansas. Results showed that consumers preferred imported over domestic
products. According to consumers, the sensory characteristics most important to the
acceptance of cooked Jasmine rice were, in the order of decreasing importance, colour,
flavour, aroma, stickiness, and hardness.
Tomlins et al. (2005) studied consumer preference and related sensory attributes
with consumer acceptability of rice. The majority of consumers preferred imported raw
and parboiled rice to that produced locally. Acceptability was influenced by location and
gender. Individual preferences of consumers varied and four different segments of
consumers with similar liking of the rice samples were identified. The largest three
segments (86% of consumers) preferred the imported rice but differed in their preferences
for the local rice. A niche segment (14%) mostly preferred traditional local rice. Al-
Hassan (2008) using hedonic price estimation model revealed that consumers of rice in
Accra pay highest premiums for taste, aroma and shape. Consumers also pay some
premium for smaller percentage broken and scarcity of a type of rice in the market.
Suwannaporn and Linnemann (2008) investigated consumer eating quality
preferences among consumers in target rice export countries to identify opportunities and
strategic implications. A quantitative study with consumers of target nationalities was
conducted in combination with focus group discussions. Discriminant analysis was
performed to investigate differences in perception between consumers from countries
which had different rice grain preference. Result showed that rice texture was the best
discriminator. It could correctly predict consumers from nonspecific grain preference,
short grain preference and Basmati preference at 63, 71 and 81 per cent, respectively.
Walisinghe (2008) assessed consumer preferences for different quality attributes
of rice based on conjoint methodology. The appropriate attributes and levels were
identified from a focus group discussion and subsequently a conjoint questionnaire was
administered using a sample of 185 consumers under a fractional factorial design.
ANOVA and part worth utility models were estimated. The relative importance of
attributes was calculated using part-worths. ANOVA results indicate that of the four
attributes, type, colour and purity were significant, but price was not significant. Part
A Study on Consumer Preference for Scented Rice in Bangalore City 10
worth estimates revealed that the purity is the most important attribute when selecting a
type of rice.
Kim et al. (2009) analyzed consumers' preference of rice brands and suggested a
way to reduce the number that stood at about 1700 in the Korean market. With data
collected from respondents, a conjoint analysis was conducted to identify consumers'
preferences of Korean rice in regard to such aspects as producing area, brand, category,
and price. They particularly focused on analyzing the consumers' preference of rice
brands, with some scenarios to decrease the number of brands. The paper also estimated
the virtual market shares of rice brands, as results of the analyses, the paper showed that
the grouping of individual rice brands in a city or county under one representative brand
is the most preferred by Korean consumers.
Galawat and Yabe (2010) observed that urban consumers prefer rice which has
white, purple, long, non-glutinous, aromatic and organic attributes. They also
demonstrate to have firm preference for white, long, and organic rice by observing the
high amount of MWTP for these attributes. Meanwhile, rural consumers prefer rice
which has white, glutinous, sweet and organic attributes. Rural consumers also show
strong preference for white, sweet and organic rice by observing the high amount of
MWTP for these attributes.
Mhlanga (2010) analyzed the relationship between price and product attributes
towards consumer’s choice for rice in Benin, using the hedonic pricing approach and
discrete choice modeling at the household level. The results of econometric estimation
indicated that consumers pay a premium for grain size, aroma, colour, wholeness and
cleanliness of grain and convenience attributes across the different regions studied.
Consumers (rural and urban) prefer parboiled and imported rice over domestic rice and
raw rice.
Diako et al. (2010) reported that the reasons for consumers not patronizing locally
cultivated rice were, poor post harvest handling, non-availability, and the generally
perceived poor quality. The few (29%) who consume local rice do so out of the
perception that it is inexpensive and has better nutritional quality. Both cooked and raw
attributes of rice influence consumer preference. At the same time the appearance of raw
rice (Friedman rank mean = 2.86) was critical to consumers’ choice, while taste and
aroma determined consumer preference for cooked rice; being ranked 4.96 and 4.46,
respectively.
Abdullahi et al. (2011) found that the product attributes such as flavour and
aroma, availability, brand name and quality also influence the frequent purchasing of
Basmati rice among the Malaysian consumers. However price and easy preparation are
not significant in influencing the frequent purchasing of Basmati rice since most
consumers are aware that special rice such as Basmati is expensive and all rice has to be
prepared in a usual way.
11 Sunil Kumar, M
Anang et al. (2011) determined influential factors on consumer preference for
various rice brands in the metropolis of Tamale and the quality characteristics which
affect prices. One hundred (100) respondents were randomly sampled and interviewed
using a semi-structured questionnaire. The Kendall’s coefficient of concordance was used
to determine the factors that influence consumer preference. The hedonic price model
was used toanalyze the effect of these preferences on price. The attributes that define the
quality of rice most preferred by consumers were taste, cooking quality, cooking time and
aroma. The attributes least preferred by consumers were price, impurities (presence of
foreign matter) and the source of rice. The hedonic price model showed that the
consumer paid higher premiums for aroma and source of rice (local or foreign).
Musa et al. (2011) indicated that rice attributes such as flavour, taste of cooking,
price, and location also affect their choices of the brands available in the market. The
majority of the consumers however, preferred to purchase local white rice instead of
those imported from overseas.
Hanis et al. (2012) study used conjoint analysis and revealed that the most
important attribute for rice was food safety, followed by taste and size of grain.
Consumers were also willing to pay premium prices for the demanded attributes. The
findings would have positive implications for the agrifood industry if it responds
effectively to translate into business opportunities to these changes.
Seila et al. (2012) used cross-sectional survey of 250 Cambodian households
across agro-climatic zones to understand rice production and consumption behaviours.
The results highlight diversity in varieties of rice grown and consumed, a continuing
preference for traditional varieties, and a high level of awareness of rice varieties. Most
households purchased rice from the market, and price was a major factor in choosing rice,
in addition to taste, texture, swelling capacity, and aroma.
Maxwell et al. (2013) found that consumers perceived grain colour, absence of
foreign material, fragrance and cooking behaviour as important. Grain length and shape,
translucence or chalkiness of grain, per cent brokenness and expansion ratio were not as
important to consumers as the former four qualities. They preferred imported rice to
locally-produced rice because of the absence of foreign matter, better grain appearance,
better cooking quality and presence of fragrance. They did not think that “ease of
availability” was a significant (p = 0.098) reason for their preference for imported rice.
Imported rices sold on the Ghanaian markets are predominantly U.S. conventional long
grain (long grain, intermediate amylose, intermediate gelatinization temperature) and
Jasmine-styled (long grain, low amylose content, low gelatinization temperature and
fragrance) rices from Asia.
Gurung (2013) using Ordinary Least Squares (OLS) analysis and empirically
found that there exists some relationship between price paid by consumers and the
characteristics of the rice. The study found that Bhutanese prefer paying a premium for
whiteness, less foreign materials, less broken rice and stickiness for imported rice while
A Study on Consumer Preference for Scented Rice in Bangalore City 12
reddish colour of local rice and cohesion are significant determinants while purchasing
domestic rice.
Oyinbo et al. (2013) determined consumption preference between imported rice
and locally produced rice by households in Kaduna state and the factors that influenced
the households’ consumption preference between the two. Primary data obtained from a
sample of 310 household heads with the aid of structured questionnaire were employed in
this study and the data were analysed using descriptive statistics and logit regression
analysis. The results of the data analysis indicated that 75 per cent of the sampled
households’ preferred imported rice to local rice and the factors that significantly
influenced the households rice consumption preference are quality of rice (p<0.01), ease
of preparation (p<0.1), price of rice (p<0.1), frequency of rice consumption (p<0.1)
household size (p<0.1) and household income (p<0.05).
Rose et al. (2013) assessed the effect of consumer purchasing criteria for types of
rice in Togo using choice modeling. the results highlighted the features like cleanness,
whiteness and taste as the first, second and third purchasing criteria respectively for non-
parboiled imported rice while the choice of non-parboiled local rice was based on taste,
swelling capacity and, again, taste as the first, second and third selection criteria,
respectively. These results were reinforced by using a random utility model to perform
the consumer utility analysis and their willingness-to-pay for the most important
purchasing criteria of rice types.
Sampson (2013) analyzed the consumer preference for rice consumption in Ghana
with the aim to study which attributes of rice consumers valued. The specific
methodological approach employed was Choice Experiment (CE) Technique which is
used to evaluate non-market goods by eliciting people`s stated preference for different
options in a hypothetical setting. The study also involved consumer Willingness to Pay
(WTP), which is defined as the maximum value of money that an individual contributed
to equalize utility. The findings suggested that the most important attribute for rice was
food safety, followed by aroma and length of grain. Consumers were willing to pay
premium prices for the demanded attributes.
Sudha et al. (2013) studied consumer acceptance of unmilled brown and
undermilled rice among urban south Indians. A 7-point hedonic scale was used to rate
consumer preferences. Consumers reported that the colour, appearance, texture, taste, and
overall quality of the 4.4 per cent polished rice was strongly preferred in both varieties
and forms. Ratings for zero per cent polished (brown rice) were substantially lower than
those of 2.3 per cent polished rice, which were intermediate in ratings between zero per
cent and 4.4 per cent polishing. However, most of the consumers (93%) expressed a
willingness to substitute brown or 2.3 per cent polished rice, if affordable, after the taste
tests and education on nutritional and health benefits of whole grains.Though most
consumers’ preferred polished white rice, education regarding health benefits may help
this population switch to brown or undermilled rice. Cooking quality and appearance of
the grains were perceived as the most important factors to consider when purchasing rice
among Chennai urban adults.
13 Sunil Kumar, M
Gideon et al. (2014) examined the determinants of consumer preference for
domestically processed rice and identified some of the constraints inhibiting the
consumption of local rice in the Tamale metropolis. Logistic regression model and
Kendell’s coefficient of concordance were used to analyze the determinants of consumer
preference for domestic rice and some of the factors inhibiting the patronage of local rice
respectively. The key variables influencing consumers preference for local rice includes;
age, household size, monthly expenditure on food and taste. The results also indicated
that about 65 percent of the respondents agreed that poor packaging of local rice is the
number one factor inhibiting the patronage of local rice. There is therefore an urgent need
to invest into the development and deployment of rice varieties to improve its taste. Local
rice processors should also worked at improving the packaging to make it competitive in
the market.
Lara (2014) conducted a consumer survey for preference for quality rice in the
greater area of Bangkok, Thailand based on Best-Worst Scaling with 300 sample
respondents. The aggregate analysis revealed health, safety, origin and texture were most
preferred rice attributes. Further, from latent class analysis it is found that 36.50 per cent
trusted in Thai quality and brands, 23.50 per cent considered rice as a staple food, and 40
per cent of the consumers were health and sustainability lovers.
3. Factors influencing usage of scented rice
Al-Hassan et al. (2008) observed that consumer preferences for quality
characteristics of rice in Accra had specific effects on the price of rice. Statistical analysis
of the relationship between income and education of consumers and the quality of rice
they prefer revealed a significant relationship between income and education on shape
and aroma.
Suwannaporn and Linnemann (2008) conducted quantitative study with 1128
consumers of target nationalities were conducted in combination with focus group
discussions. Factor analysis of consumers’ buying decision criteria yielded four factors:
marketing activities (explained variance 26.8%), quality (13%), price (10.5%), and
country of origin (7.7%).
Berta et al. (2009) examined importance of origin in rice purchasing decisions in
Talca and Temuco, Chile. Using a conjoint analysis and hierarchical clustering, five
market segments were distinguished. The largest group (35.4%) gave great importance to
the origin of the rice. The second largest group (25.1%) gave greater relevance to the
packaging. For the third and fourth largest groups (15.4 and 12.5%, respectively), the cost
of the product was the most important attribute. The smallest group (11.6%) gave slightly
higher importance to the origin of rice than the other attributes. Only this final group
preferred imported rice.
Onwuka et al. (2009) examined the socio-economic factors influencing foreign
rice consumption in Ikwuano and Umuahia North local government areas of Abia state. A
total of 93 rice consumers were selected across the two local government areas using the
A Study on Consumer Preference for Scented Rice in Bangalore City 14
simple random technique. The socio-economic characteristics were analyzed using
descriptive statistic such as percentages and frequencies. The ordinary least square (OLS)
model of multiple regression technique was used to analyze the consumption functions of
rice consumers. From the results obtained, it was revealed that the price of commodity,
price of substitute, Household size, frequency of consumption, and educational status
were significant and positively related to foreign rice consumption in the study area. The
economic implication is that foreign rice has become an essential commodity whose
demand is not easily decreased by the decrease or rise in its price or price of its substitute,
household size and its frequency of consumption in study area.
Fakayode et al. (2010) studied using a two stage sampling technique which was
used to survey 110 rice consumer households across two villages and six towns in Kwara
State. Analytical tools used in the study include descriptive statistics and the multinomial
logit model. The major factors that significantly influence household preferences for
either a combination of local and imported rice or the imported rice only to the local rice
were the income of the head of household, household size and the educational status of
the heads of household. The price per unit kilogramme of rice, however, was not a
significant factor.
Kassali et al. (2010) analysed the determinants of demand for rice in Ife Central
Local Government Area of Osun State, Nigeria. The objectives of the study were to
analyze the determinants of demand for rice, identify the various rice brands that are
mostly consumed and determine the nature of the relationship of other foods items to rice
selected. A random sampling procedure was used to select one hundred respondents from
the area. The findings revealed that price of rice, income of household head, price of
substitute good like yam and beans, and size of household have significant influence on
the demand for rice in the area. Various rice brands are consumed in the area but those
that are largely consumed are Tomato, Caprice, Royal Umbrella, Mama Africa, and Rice
Land brands of rice. Of all the staple foods declared by the respondents as substitutes to
rice, only yam and beans were positively significant and hence, these are substitutes to
rice in the area.
Mhlanga (2010) concluded that the socioeconomic factors are not important in
consumer purchasing decisions. Country of origin was found to influence rice preference
indirectly through perceived quality. The results from this study suggested that both
domestic and imported rice varieties have positive and negative implicit prices. This
emphasizes the importance of quality based attributes in future breeding programs to
make domestic rice more competitive to imported rice.
Abdullahi et al. (2011) investigated that socio-demographic factors and product
attributes affecting purchase decision of special rice by Malaysian consumer. The
primary data were analyzed by using binary logit model. Demographic factors and
consumer preference for special rice (with reference to basmati rice) attributes were
identified to affect purchasing behaviour for special rice. Size of household, marital
status, number of children, household income and gender of consumers were the main
15 Sunil Kumar, M
socio-demographic factors that significantly influenced households’ choices of special
rice for home consumption in the Klang Valley area.
Emodi and Madukwe (2011) analyzed the influence of socio economic attributes
of rice consumers on rice consumption in Southeast Nigeria. Eighty (80) rice consumers
were purposively selected from four purposively selected states in Southeast Nigeria.
Information was collected using questionnaire and interview schedule. The data analysis
was done using descriptive statistics and four functional forms of multiple regression
models. Findings indicated that women and youths were more involved in rice
consumption than their male counterparts. It was also observed that sex, age, marital
status, education and household size were statistically significant in influencing
consumers’ decision to consume rice in the study area.
Musa et al. (2011) examined the determinants affecting the consumer’ purchasing
behaviour for rice in Malaysia. From the analysis it is found that the variables of great
importance that affect the purchasing behaviour were marital status, gender, age,
occupational status of head and household number.
Supakornchuwong and Suwannaporn (2012) investigated the beliefs and attitudes
in four target European countries toward rice compared with their typical main starchy
foods (e.g., potatoes and pasta) in order to ascertain the possibility of rice serving as a
substitute. A quantitative questionnaire was designed to assess consumer attitudes toward
rice, potatoes and pasta with respect to taste, health aspects, price, calorie content,
harmful substances, trustworthiness, digestibility, allergenicity and perceived specialty
food. Attitudes about rice's taste, health benefits and low price were among the highest,
whereas its specialty received the lowest ratings. Rice was rated more positively than
potatoes and pasta for almost every attitude. Consumers' intentions to increase rice
consumption in the near future were significantly associated with perceptions regarding
four attributes of rice: good taste, healthfulness, low calorie content and specialty.
Agbogo et al. (2013) evaluated the factors affecting rice consumption in Cross
River State of Nigeria. Two hundred and forty rice consumers were randomly selected
from twelve purposively selected Local Government Areas in Cross River State. It was
discovered that the socio-economic variables that affect rice consumers in the study area
were age, marital status, household size, religion and educational level. The variables
included rice consumers disposable income, occupational status of the consumers, joint
effect of income and occupational status, brand of rice, price of rice and the joint effect of
rice brand and own price. The results showed that disposable income variable had a
magnitude of 0.352 and was positive, brand had a magnitude of 0.378 and was equally
positive, price had a negative magnitude of –0.121, occupational status variable had a
positive magnitude of 0.372, while the joint effects of income and occupational status and
rice brand and own price were 0.243 and 0.131, respectively. The implication of the
results is that any one unit change in income, occupational status of the rice consumers,
brand and price in the study area will result in an increase of 0.352, 0.372, 0.134 and -
0.121 units, respectively.
A Study on Consumer Preference for Scented Rice in Bangalore City 16
Ayinde et al. (2013) carried out to a study to determine the consumption pattern
of Ofada rice among civil servants in Abeokuta metropolis of Ogun State with a view to
identifying the various factors that affect Ofada rice consumption among the respondents
in the study area. A total of 60 respondents were selected from six randomly selected
ministries in the metropolis. The study revealed that household monthly expenditure on
Ofada rice increases with increase in household monthly income, household size and
household expenditure on food.
Zhigang et al. (2013) investigated consumers’ awareness and acceptance of the
Japanese rice in Beijing area using 400 consumers through face-to-face interview in
supermarkets during the period 2008-09. The results obtained from the survey showed
that consumers had relatively low cognition and acceptance on Japanese rice and only
14.8 per cent of the respondents had purchasing experience on Japanese rice. Although
Japanese rice maintained high quality property, high price, lack of purchasing motivation,
and sufficient and satisfying rice supply from domestic market obstructed the good sales
record of Japanese rice in China. The bivariate probit model results showed that
consumer’s gender, education level, monthly expense on foods, and time pressure
significantly positively affected the consumers’ cognition level on Japanese rice, while
consumers’ age and quantity concern degree negatively and significantly affected their
awareness. As far as the purchasing behavior of consumers on Japanese rice, consumer’s
gender, education level, family size, quantity and nutrition concern degree significantly
and positively affected the consumers’ purchasing behavior on Japanese rice, while their
monthly expense on food and quality concern degree negatively affected their purchase
significantly.
Oyinbo (2014) undertook a research to determine consumption preference
between imported rice and locally produced rice by households in Kaduna State, Nigeria
and found factors that influenced the households’ consumption preference between the
two types of rice, obtained from a sample of 310 household heads with the aid of
structured questionnaire. The data were analysed using descriptive and inferential
statistics. The results of the data analysis revealed that 75 per cent of the sampled
households’ preferred imported rice to local rice and the factors that significantly
influenced the households rice consumption preference are quality of rice (p<0.01), ease
of preparation (p<0.1), price of rice (p<0.1), frequency of rice consumption (p<0.1)
household size (p<0.1) and household income (p<0.05).
A Study on Consumer Preference for Scented Rice in Bangalore City 17
III. METHODOLOGY
The study was carried out to analyze the consumer preference for scented rice.
This chapter presents a brief description of the methodology used in the study under the
headings indicated below.
3.1 Selection and description of the study area
3.2 Sampling procedure
3.3 Collection of data
3.4 Analytical tools and techniques employed
3.1 Selection and Description of the Study Area
3.1.1. Selection of the study area
Bangalore, the capital of Karnataka is one of the fastest growing cosmopolitan
metropolis of India. It is the IT and BT hub of India, with industrial estates and numerous
financial and educational institutions. People of different religions, castes, occupation,
culture, speaking diverse languages and of different food preferences reside here. Hence,
Bangalore was selected for the study.
3.1.2. Description of the study area
Bangalore is located on the Deccan Plateau in south-eastern Karnataka; with an
estimated metropolitan population of 10 million, making it India's third-largest city and
fifth-largest metropolitan.
Over the years, Bangalore has evolved into a manufacturing hub for public sector
heavy industries-particularly aerospace, telecommunications, machine tools, heavy
equipment, space and defense. The establishment and success of business software
service firms in Bangalore after the liberalization of India's economy has led to the
growth of India's information technology industry. It is referred to as the Silicon Valley
of India and accounts for 35 percent of India's software exports. Home to prestigious
colleges and research institutions, the city has the second-highest literacy rate among the
metropolitan cities in the nation. Bangalore is known as the Garden City of India because
of its climate, greenery and the presence of many public parks.
Bangalore is situated in the south-east part of Karnataka at an average elevation of
920 meters (3018 feet). It is positioned at 12.97° N 77.56° E and covers an area of
2190 km. Bangalore District borders with Bangalore Rural and Chikkaballapura District
in the northeast, Tumkur District in the northwest, Ramanagar District in the southwest
and the neighboring state of Tamil Nadu in the southeast.
18 Sunil Kumar, M
Bangalore has a large number of lakes. Of these Sankey lake, Ulsoor lake and
Yediyur lake being the major ones. Because of its elevation, Bangalore enjoys a pleasant
and unflappable climate throughout the year. The highest temperature recorded is 39°C
(102°F) and the lowest is 11°C (52°F). The wettest months are August, September and
October; with a heaviest rainfall of 180 mm recorded in 24-hour period.
Bangalore is the 3rd
most populous city in India and the 27th
largest city in the
world by population. With a decadal growth rate of 38 per cent, it is the fastest-growing
Indian metropolis. Bangalore's population with an overall literacy rate of 83 per cent is
the second highest for an Indian metropolis, after Mumbai. The city's workforce structure
is predominantly non-agrarian, with only 6 per cent of Bangalore's workforce being
engaged in agriculture-related activities.
3.2. Sampling procedure
Data regarding the consumer preference for scented rice was collected using pre-
tested structured schedule. Purposive sampling method was adopted to select the
respondents. The sampling was done in different localities of Bangalore city. A total of
40 consumers were interviewed. In order to study sourcing of scented rice 20 retailers
and 20 hoteliers were also interviewed.
3.3. Collection of data
Primary data regarding socio-economic characteristics like household size, age,
income, education, consumer’s awareness about different types of scented rice,
consumer’s preference for different attributes of scented rice, purchasing pattern were
collected by personally interviewing the consumers using pre tested structured schedule.
Secondary data regarding different types and brands of rice was collected from
various published reports and websites.
3.4. Analytical tools and techniques employed
Detailed description of the analytical tools employed in the study is given below.
3.4.1. Descriptive Statistics
These are used to describe the basic features of the data gathered from various
sources. They provide simple summaries about the sample and percentage is used in the
study.
3.4.2. Factor analysis
Factor analysis is a multivariate technique in which, most commonly employed
factor analytic procedures in marketing applications are principal and common factor
A Study on Consumer Preference for Scented Rice in Bangalore City 19
analysis. The major objective to employ this analysis is to determine the variables which
influence the consumer’s buying decision for scented rice.
Principal component analysis can accommodate a large number of variables and reduce
the information to a convenient size. The inter-relationship among a set of many inter-
related variables are examined and represented in terms of a few underlying factors or
dimensions that explains the correlation among a set of variables. This assumes that the
observed variables are linear combinations of some underlying source variables, which
are known as factors.
The factor analysis program uses the correlation matrix as input to identify
interrelations between variables. Using those correlations one can see what information
and hypotheses can be obtained. Factor loadings provide the correlation between the
variable and the underlying dimension. The product of corresponding factor loadings can
obtain the correlation between any two variables.
Since the objective of the factor analysis is to represent each of the variables as
linear combination of the smaller set of factors, we can express this as
X1= λ11F1+ λ12F2+…+ λ1m Fm+ e1
X2= λ21F1+ λ22F2+…+ λ2m Fm+ e2
… … … … … …
… … … … … …
Xn= λn1F1+ λn2F2+…+ λnm Fm+ en
Where,
X1to Xn=Standardized scores
F1-Fn= Standardized factor scores
λ11- λmn=Factor loadings
e1- en=Error variance
The maximum number of factors possible is equal to the number of variables.
However, small number of factors by themselves may be sufficient for retaining most of
the information on the original variables.
20 Sunil Kumar, M
3.4.3 Best-worst scaling
The design in both studies was adopted from Finn and Louviere (1992), which
contains 14 sets of choices. The design ensures that each rice attribute appeared 4 times
across all the choice sets. The level of importance for each choice was determined by
subtracting the number of times the wine was least important (worst) from the number of
times it was most important (best) in all choice sets. The level of importance of each
attribute depends on the number of respondents and in the frequency that each attribute
appears in the choice sets. Hence, the level of importance of a particular attribute was
transformed to a standard score. The reason for standardization is to allow comparison
between different groups of respondents, where the number differs in each collection.
Count (Best) – Count (Worst)
Standard score = -----------------------------------
4n
Where,
Count (best) = total number of times an attribute was most important
Count (worst) = total number of times an attribute was least important
n is the number of respondents and
4 is the frequency of the appearance of each attribute in the design.
A Study on Consumer Preference for Scented Rice in Bangalore City 21
IV. RESULTS
The results of the analysis carried out for fulfilling the objectives of the study are
presented under the following headings:
4.1. General profile of the consumers
4.2. Consumer awareness about scented rice
4.3. Consumer preference for scented rice in Bangalore city
4.4. Factors influencing consumption of scented rice in Bangalore city
4.5. Sourcing of scented rice by retailers and hoteliers in Bangalore city
4.6. Major scented rice brands in Bangalore city
4.1. General profile of the consumers
4.1.1. Socio-economic profile of the consumer
Socio-economic profile of the consumers who were using scented rice are
presented in Table 4.1. Most of them (45%) belong to the age group of 20-30 years. It
was followed by age groups 31-40 years (40%), 41-50 years (10%) and more than 50
years (5%).
The literacy level of scented rice consumers were analysed and found that 70 per
cent of them are graduates, followed by 22.50 per cent of consumers had studied up to
pre-university and 5 per cent consumers studied up to high school. Only 2.50 per cent had
Primary education. The family size of the consumers were grouped and found that family
size of 1-2 persons accounts for 10 per cent. The family size 2-5 and >5 were 67.50 per
cent and 22.50 per cent respectively.
The grouping of the consumers based on household income revealed that 6
consumers fall under the income group of Rs.10,000-Rs.20,000 followed by 7 consumers
having income range of Rs.20,001-Rs.30,000. The consumers having income range of
Rs.30,001-Rs.50,000 was found to be 14. The remaining 13 consumers were grouped
under the income range of more than Rs.50,001.
4.1.2. Profile of the purchase decision maker
The profile of the purchase decision maker is shown in Table 4.2. The table shows
that the decision to buy scented rice is taken mostly by wife (47.50%), followed by
husband (25%), mother (15%) and father (12.50%).
The buying decision makers were grouped age wise. Majority of them (42.50%)
belonged to the age group of 41-500 years. It was followed by age group 31-40 years
(22.50%), 20-30 years (12.50%) and more than 50 years (22.50%).
22 Sunil Kumar, M
Table 4.1. Socio-economic profile of the consumers in Bangalore city
Sl. No Category No. of consumers Percentage to the total
1. Age (years)
a) 20 to 30 18 45.00
b) 31 to 40 16 40.00
c) 41 to 50 4 10.00
d) More than 50 2 05.00
Total 40 100.00
2. Gender
a) Male 33 82.50
b) Female 7 17.50
Total 40 100.00
3. Education
a) Primary 1 02.50
b) High school 2 05.00
c) Pre-university 9 22.50
d) Degree 28 70.00
Total 40 100.00
4. Profession
a) Professionals 19 47.50
b) Govt. Employee 17 42.50
c) Self employed 4 10.00
Total 40 100.00
5. Family size (number)
a) 1 to 2 4 10.00
b) 2 to 5 27 67.50
c) More than 5 9 22.50
Total 40 100.00
6. Monthly income (Rs.)
a) 10,000 to 20,000 6 15.00
b) 20,001 to 30,000 7 17.50
c) 30,001 to 50,000 14 35.00
d) More than 50,001 13 32.50
Total 40 100.00
7. Marital status
a) Married 30 75.00
b) Unmarried 10 25.00
Total 40 100.00
8. Food habit
a) Vegetarian 20 50.00
b) Non-vegetarian 20 50.00
Total 40 100.00
A Study on Consumer Preference for Scented Rice in Bangalore City 23
Table 4.2. Profile of buying decision maker in Bangalore city
Sl. No Category No. of consumers Percentage to the total
1. Decision maker
a) Husband 10 25.00
b) Wife 19 47.50
c) Mother 6 15.00
d) Father 5 12.50
Total 40 100.00
2. Age (years)
a) 20 to 30 5 12.50
b) 31 to 40 9 22.50
c) 41 to 50 17 42.50
d) More than 50 9 22.50
Total 40 100.00
3. Education
a) Primary 2 5.00
b) High school 10 25.00
c) Pre-university 8 20.00
d) Degree 20 50.00
Total 40 100.00
4. Profession
a) Homemaker 20 50.00
b) Professional 18 45.00
c) Retired 2 5.00
Total 40 100.00
24 Sunil Kumar, M
The education level of buying decision makers was found that 50 per cent of them
were graduates, 25 per cent were high school, 20 per cent of them were pre-university
and 5 per cent of them studied up to primary. The profession of the buying decision
maker was analysed and found that 50 per cent were homemakers, 18 per cent
professionals and 5 per cent were retired.
4.2. Consumers awareness about scented rice in Bangalore city
4.2.1. Consumers awareness about different types of scented rice
Consumers’ awareness about different types of scented rice is shown in the Table
4.3. The table revealed that all the sample consumers were aware of Basmati rice.
Kalijira rice was known to 27.50 per cent consumers. 7.50 per cent of consumers were
aware of Gandhasale and Jasmine rice. Brown rice and Ambemohar were known by 5 per
cent and 2.5 per cent of consumers, respectively.
4.2.2. Frequency of consumption of scented rice
Frequency of consumption of scented rice is furnished in the Table 4.4. The table
revealed that most consumers consumed scented rice monthly once (32.50%) followed by
whenever needed (27.50%). The table also showed that consumers used scented rice
weekly (17.50%), fortnightly (12.50%) and whenever needed (10%).
4.2.3. Food prepared by consumers using scented rice
Different type of food is being prepared by the vegetarian consumers using
scented rice is presented in the Table 4.5. The table revealed that most prepared food item
was Pulao (35%), followed by plain rice (27.50%), Kheer (10%), Biriyani (5%), Ghee
rice (2.50%) and Kesari bath (2.5%).
Different type of food prepared by the non-vegetarian consumers using scented
rice is presented in the Table 4.6. The table pointed that the most consumers prepared
Biriyani and Pulao in equal proportions (40%). Consumers also prepared plain rice
(25%), Kheer (20%), and ghee rice (5%).
4.2.4. Consumers purchase pattern of scented rice
4.2.4.1. Quantity purchased by consumer
Quantity purchased by the sample consumers were shown in the Table 4.7. The
table revealed that most (37.50%) consumers purchased 1 to 2 Kg of scented rice per
month, followed by 0.5 to 1 Kg (35%), 2 to 3 Kg (15%), 3 to 4 Kg (7.50%) and 4 to 5 Kg
(5.00%).
A Study on Consumer Preference for Scented Rice in Bangalore City 25
Table 4.3. Awareness of consumers about different types of scented rice
Sl. No Type of scented rice No. of consumers Percentage
1. Basmati 40 100
2. Jasmine 3 7.50
3. Kalijira 11 27.50
4. Gandhasale 3 7.50
5. Ambemohar 1 2.50
6. Brown rice 2 5.00
Table 4.4. Frequency of consumption of scented rice in Bangalore city
Sl. No Frequency No. of consumers Percentage to the total
1. Weekly 7 17.50
2. Once in a Fortnight 5 12.50
3. Once in a Month 13 32.50
4. No regular pattern 11 27.50
5. On special occasions 4 10.00
Total 40 100.00
26 Sunil Kumar, M
Table 4. 5. Food prepared by vegetarian consumers using scented rice in Bangalore
city
Sl. No Food Item No. of consumers percentage
1. Plain rice 11 27.50
2. Kheer 4 10.00
3. Biriyani 2 5.00
4. Pulao 14 35.00
5. Ghee rice 1 2.50
6. Kesaribath 1 2.50
Table 4.6. Food prepared by non-vegetarian consumers using scented rice in
Bangalore city
Sl. No Food Item No. of consumers Percentage
1. Plain rice 10 25.00
2. Kheer 8 20.00
3. Biriyani 16 40.00
4. Pulao 16 40.00
5. Ghee rice 2 5.00
A B
C D
E
Fig. 1 Types of scented rice.
A. Basmati, B. Brown rice, C. Gandhasale D. Kalijira, E. Jasmine rice
A Study on Consumer Preference for Scented Rice in Bangalore City 27
4.2.4.2. Type of store where consumers purchase scented rice
The type of store from which consumers purchased scented rice for was found to
be Provision stores (22.50%), Convenience stores (12.50%), supermarket (47.50%) and
hypermarket (17.50%).
4.2.4.3. Price paid by the consumers for scented rice
The price paid for scented rice by consumers is shown in the Table 4.7. It was
found that 60 per cent of consumers paid 50-100 Rs. /Kg and 40 per cent consumers paid
more than 100 Rs./Kg. Most of the consumers bought branded scented rice (87.50%).
Only few consumers bought unbranded scented rice (12.50%).
4.3. Consumer preference for scented rice in Bangalore City
The consumer preference level for different attributes of scented rice in Bangalore
city is furnished in Table 4.8. The attributes Aroma (0.387), price (0.381), taste (0.375),
grade (0.281), cooking time (0.212), brand (0.062), after cooking grain size (0.019) of
scented rice were most preferred in the decreasing order of their preference.
The attributes impurities (-0.512), texture (-0.356), stickiness (-0.200), broken
grain (-0.193), after cooking shelf life (-0.190), age of rice (-0.119), ease of cooking (-
0.075), grain size (-0.056) and colour (-0.051) were the least preferred attributes of
scented rice in the increasing order of their preference.
4.4. Factors influencing consumption of scented rice in Bangalore city
The rotated factor matrix loadings for identified factors are presented in Table 4.9.
This helps in identification of the variables that have large factor loadings on the same
factor. That factor interpreted in terms of variables that load high on it.
It can be seen from the table that the four factors contained seven, two, three and
two variables. Factor 1 represented the effect of publicity on buying behaviour of scented
rice consumers. Factors 2 captured the influence of financial status of consumers on
buying behaviour of scented rice consumers. Factor 3 is highly related culture’s influence
of consumers on buying behaviour. Finally, factor 4 represented the effect of education
and availability of scented rice on buying behaviour of scented rice by consumers.
The table revealed that in publicity factor retailers (0.780), friends (0.672),
advertisements (0.666), nutritive value (0.765), and country of origin (0.796) were the
significant variables. Offers (0.493) and marital status (0.491) of the consumers were not
significant. In financial status, income (0.931) of consumers and price (0.927) of scented
rice were significant. In cultural factor, taste (537), festivals (0.855) and traditions
(0.711) were significant. In education factor, availability (0.769) and education (0.640)
were significant.
28 Sunil Kumar, M
Table 4.7. Consumers’ monthly purchase pattern of scented rice in Bangalore City
Sl. No Category No. of consumers Percentage to the total
1. Quantity (Kg)
a) 0.5 to 1 14 35.00
b) More than 1 to 2 15 37.50
c) More than 2 to 3 6 15.00
d) More than 3 to 4 3 7.50
e) More than 4 to 5 2 5.00
Total 40 100.00
2. Type of store
a) Provision stores 9 22.50
b) Convenience stores 5 12.50
c) Super market 19 47.50
d) Hyper market 7 17.50
Total 40 100.00
3. Price (Rs./Kg)
a) 50 to 100 24 60.00
b) More than 100 16 40.00
Total 40 100.00
4. Branded/Unbranded
a) Branded 35 87.50
b) Unbranded 5 12.50
Total 40 100.00
A Study on Consumer Preference for Scented Rice in Bangalore City 29
Table 4.8. Consumers’ preference for various attributes of scented rice in Bangalore
city
Sl.
No
Attributes
Best
count
Worst
count
Best-worst
score
Standard score
1. Aroma 81 19 62 0.387
2. Price 80 19 61 0.381
3. Taste 77 17 60 0.375
4. Grade 60 15 45 0.281
5. Cooking time 53 19 34 0.212
6. Brand 58 48 10 0.062
7. After cooking grain
size
17 14 3 0.019
8. Colour 32 40 -8 -0.050
9. Grain size 31 40 -9 -0.056
10. Ease of cooking 30 42 -12 -0.075
11. Age of rice 12 31 -19 -0.119
12. After cooking shelf
life
22 52 -30 -0.190
13. Broken grain 14 45 -31 -0.193
14. Stickiness 11 43 -32 -0.200
15. Texture 3 60 -3 -0.356
16. Impurities 7 89 -82 -0.512
30 Sunil Kumar, M
Table 4.9. Factors influencing buying decision of scented rice by consumers in
Bangalore city
Sl No Factors
Publicity Financial status Culture Availability
1. Taste -0.083 0.131 0.537 0.524
2. Education 0.299 -0.165 0.114 0.640
3. Availability 0.057 0.295 -0.071 0.769
4. Offers 0.493 0.492 -0.296 0.478
5. Retailers 0.780 0.277 -0.266 0.168
6. Friends 0.672 0.165 0.110 0.280
7. Advertisements 0.666 0.378 0.182 -0.277
8. Price 0.136 0.927 0.272 0.068
9. Festivals 0.078 0.189 0.855 0.121
10. Traditions 0.263 0.270 0.711 -0.111
11. Nutritive value 0.765 0.038 0.332 -0.036
12. Marital status 0.491 -0.215 0.348 0.465
13. Country of origin 0.794 -0.039 0.083 0.278
14. Income 0.142 0.931 0.202 0.078
Fig 2: Consumer preference for various rice attributes in Bangalore city
-0.6
-0.5
-0.4
-0.3
-0.2
-0.1
0
0.1
0.2
0.3
0.4
0.5
Preferencelevel
Rice attributes
A Study on Consumer Preference for Scented Rice in Bangalore City 31
4.5. Sourcing of scented rice by retailers and hoteliers in Bangalore city
In order to document the source of procurement of scented rice, the 20 retailers
were interviewed. Among them 10 provision stores, 5 Convenience stores and 5
supermarkets/hypermarkets were selected (Table 4.10).
On interviewing the provision store owners, they were procuring scented rice
from wholesalers. The owners of convenience stores procured scented rice from
distributors/stockists. The supermarket/hypermarket procured scented rice from their
respective distribution centres.
In order to document the source of scented rice of hoteliers a sample of 20 were
selected. In the sample 15 of them were procured scented rice from wholesalers, 2 of
them were procured scented rice from distributors and 3 of the hoteliers were not using
any scented rice.
4.6. Major brands of scented rice in Bangalore city
The major Basmati rice brands India is furnished in Table 4.11. The table
indicates that there are ten different companies selling basmati rice with thirteen brands
in India.
Further, the details of the other scented rices presented in Table 4.12 and they are
Kalijira, Jasmine, Gandhasale and Brown rice. Kaliira rice was sold by four companies
with four different brands. The Jasmine rice imported from Thaitan Foods International
Co. Ltd. and sold by brand name Real Thai. The Gandhasale rice was sold by Pristine
Organics Pvt. Ltd with Pristine brand. The brown rice was sold by LT foods with the
brand Dawat.
32 Sunil Kumar, M
Table 4.10. Procurement of scented rice by retailers in Bangalore city
Sl No. Type of store Procured from No of respondents
1. Provision store Wholesalers 10
2. Convenience stores Distributors 5
3.
Super
markets/hypermarkets
Distribution centres of
respective retail chain
5
Table 4.11. Major brands of Basmati rice in Bangalore city
Sl. No. Company Brands
1. KRBL India Gate, Doon
2. Kohinoor Foods Kohinoor, Charminar
3. LT Foods Daawat, Heritage
4. REI Agro Raindrop
5. Chamanlal Seta Exports Maharani
6. Amira Foods Amira
7. Sunstar Overseas Hello
8. Best International Best
9. Deva Singh Sham Singh 817 elephant
10. Corporate retail chains Store brands
Source: Horizon Research
Table 4.12. Other brands of scented rice in Bangalore city
Sl. No Type of rice Company Brands
1. Kalijira Mother’s Choice Nawab
Bigbasket BB Royal
Halt Halt
Corporate Retail chains Store Brands
2. Jasmine Thaitan Foods International Co. Ltd. Real Thai
3. Gandhasale Pristine Organics Pvt. Ltd Pristine
4. Brown rice LT Foods Dawat
Fig. 3 Major brands of Basmati rice available in Bangalore city
Fig. 4 Kalijira rice brands available in Bangalore city
Fig. 5 Jasmine rice brand Fig. 6 Brown rice brand
in Bangalore city in Bangalore city
Fig. 7: Gandhasale Rice brand in Bangalore city
A Study on Consumer Preference for Scented Rice in Bangalore City 33
V. DISCUSSION
Results of investigation presented in the previous chapter were discussed and
drawn inferences in this chapter under the following headings.
5.1 Socio economic status of scented rice consumer
5.2 General profile of buying decision maker
5.3 Consumers awareness about scented rice in Bangalore city
5.4 Frequency of consumption and food prepared by consumers
5.5 Consumers’ purchase pattern of scented rice in Bangalore city
5.6 Consumer preference for scented rice
5.7 Factors influencing purchase of scented rice
5.8 Sourcing of scented rice in Bangalore city
5.9 Different types and brands of scented rice
5.1 Socio economic status of scented rice consumer
The socio-economic profile of the consumers is presented in Table 4.1. This
includes information about the age group, education qualification, family size and
monthly income.
The age group taken for the study indicates that scented rice is consumed by the
age group 20-30 years (45%) followed by 31-40 years (40%). Majority of it is consumed
by age group 20-30 years.
Based on educational qualification of consumers, it has been observed that the
graduates consumed more scented rice. The education also plays an important role in
getting informed about different types and brands of scented rice.
With respect to the family size 67.50 per cent of the families were consisting of 2
to 5 persons. Small families are the present trend in the modern cities like Bangalore
where large number of small families stay. Due to income and information availability
small families consume more scented rice.
Scented rice is relatively expensive food. Major consumers of scented rice were in
the income group of Rs. 30,001 to 50,000 (35%) followed by more than Rs. 50,001
(32.50%).
34 Sunil Kumar, M
5.2 General profile of buying decision maker
The general profile of the scented rice buyer is presented in the Table 4.2. This
includes information about the relationship with consumer, age, educational qualification
and profession of buyer.
The relationship status taken for the study revealed that women (Wife, mother)
were the main decision makers. The age group of the decision maker showed that they
were in the age group of 41 to 50 years (42.50%). The level of education of the
decision maker indicates most of them were graduates make them aware of different
types and brands of rice.
The profession of the decision maker is shown in the Table 4.2. It revealed that
most of them were homemakers (50%) followed by professionals (18%).
5.3 Consumer awareness about scented rice in Bangalore city
The awareness about scented rice is shown in the Table 4.3. The table revealed
that Basmati rice was known by all consumers and followed by Kalijira. The reason for
this behaviour is that the basmati rice is branded and advertised. Kalijira is mostly a store
brand.
5.4 Frequency of consumption and food prepared by consumers
Frequency of consumption of scented rice by consumers is presented in Table 4.4.
It revealed that most of them consumed scented rice monthly followed by whenever
needed. The possible reasons for this behaviour may be the price of the scented rice and
income level of the consumers.
Different types of food prepared by consumers using scented rice is given in
Table 4.5 and 4.6. It revealed that most of them prepared pulao followed by biriyani
using scented rice, as the vegetarian and non-vegetarians are in equal proportion.
5.5. Consumers purchasing pattern of scented rice in Bangalore city
It can be derived that most of the consumers bought scented rice ranging from 1
kg to 5 kg. The possible reasons for this behaviour were price of scented rice, family size,
and frequency of consumption. If a consumer purchased more than 5 kg of scented rice it
is because of the reason that it can be stored and used whenever needed (Table 4.6).
In Bangalore city there is a trend of shopping in supermarkets and hypermarkets.
Most of consumers purchased scented rice through supermarkets due to availability of
different brands at single place, offers and the discounts offered by the supermarkets.
Most of the consumers paid Rs.50-100/kg (60%) followed by more than Rs.100/kg(40%).
A Study on Consumer Preference for Scented Rice in Bangalore City 35
Most of the consumers purchased branded scented rice because of the reasons that
they have proper label, manufactured date, brand label.
5.6 Consumer preference for scented rice
The consumer preference for attributes of scented rice is indicated in Table 4.7.
From the table it can be interpreted that consumers prefer aroma, taste and price the most.
Consumers least preferred the impurities, texture and stickiness in scented rice. It is in
accordance with Al-Hassan et al, (2008) that consumers of rice in Accra pay highest
premiums for taste, aroma and shape. Consumers also pay some premium for smaller
percentage broken and scarcity of a type of rice in the market.
The study is also confirms with the investigations carried out by Mhlanga (2010)
that consumers pay a premium for grain size, aroma, colour, wholeness and cleanliness of
grain and convenience attributes across the different regions studied.
5.7. Factors influencing purchase of scented rice
The rotated factor matrix loadings for identified factors are given in Table 4.8.
From factor analysis table it can be deduced that factors influencing scented rice
consumption were income and price, festivals, country of origin, retailers, availability of
scented rice, nutritive value, traditions, friends, advertisements, education and taste were
significant in descending order of their significance. Offers and marital status of
consumers were not significantly influence the buying of scented rice.
The study confirms with studies conducted by Agbogo et al., (2013), Al-Hassan
et al., (2008) that household income, education level and price of the rice were
significantly influence the buying decision.
5.8 Sourcing of scented rice in Bangalore city
The owners of provision stores procured scented rice from wholesalers due to the
fact that they procured relatively small quantities.
The convenience store owners procured scented rice from distributors as they
were having agreement with them The supermarkets and hypermarkets were corporate
and they procured scented rice from distribution centers as they were having their own
supply chain arrangements.
In order to document the source of scented rice of hoteliers a sample of 20 were
selected. Out of which 15 of them were procured scented rice from wholesalers, 2 of
them were procured scented rice from distributors and 3 of the hoteliers were not using
any scented rice.
36 Sunil Kumar, M
5.9 Different types and brands of scented rice
Due to cosmopolitan nature people from different parts of the country and the
world lives in Bangalore. This makes people’s preference differ. The major Basmati rice
brands India is furnished in Table 4.10. The table indicates that there are ten different
companies selling basmati rice with thirteen brands in India.
Further the details of the other scented rices are Kalijira, Jasmine, Gandhasale and
Brown rice shown in Table 4.11. Kaliira rice was sold by four companies with four
different brands. The jasmine rice imported from Thaitan Foods International Co. Ltd.
and sold by brand Real Thai. The Gandhasale rice was sold by Pristine Organics Pvt. Ltd
with Pristine brand. The brown rice was sold by LT foods with the brand Dawat.
A Study on Consumer Preference for Scented Rice in Bangalore City 37
VI. SUMMARY AND CONCLUSION
Rice (Oryza sativa L.) is the world’s single most important crop and a primary
food source for half of the world’s population.Rice that possesses a scent in plant parts
and grains are known as scented rice.Scented rice has always had a special place in
countries where rice is the staple. Quality rice are characterized by not only aroma but
several other traits like grain length and width, elongation after cooking, etc.
Scented rice constitute a small but special group of rice which are considered best
in quality. These rice have long been popular in the orient, and are now becoming more
popular in middle east, Europe and the United States.
The domestic consumption of basmati rice is expected to grow at a healthy CAGR
of 15 per cent over the medium term, buoyed by the increasing spending power of the
middle-income sections of the society. Moreover, the proliferation of the modern
retailing format has helped fuel the consumption of a higher quantum of branded
products, as Indian consumers are fast embracing the mall culture and organized retail,
triggering a shift from unbranded to branded rice and from economy to premium brands.
Keeping these issues in mind a study of consumer preference for various types
and brands of scented rice in Bangalore city, consumption pattern of scented rice, factors
influencing the consumer preference was studied. Besides, sourcing of scented rice by
retailers and hoteliers were also studied.
The objectives of the study were:
i. To examine the consumer awareness about types and brands of scented rice,
ii. To analyze the users preference for scented rice,
iii. To identify the factors influencing usage of scented rice and
iv. To identify the sourcing of scented rice.
Methodology
The study was based on primary data. The primary data were collected from the
consumers, retailers and hoteliers using pre-tested schedule prepared for the purpose
through personal interview for evaluating the objectives of the study. The secondary data
regarding scented rice was collected from websites and published reports.
The study was conducted in Bangalore city because of its cosmopolitan nature
which gives a wide scope for studying the consumer preference towards types and brands
of scented rice. Purposive sampling method was adopted to select the consumers. The
sampling was done in different localities of Bangalore city.
A total of 40 consumers, 20 retailers and 20 hoteliers were interviewed. The data
was collected by personally interviewing the consumers through pre tested structured
38 Sunil Kumar, M
schedule. The data collected was analysed using descriptive statistics, Best-Worst scaling
method and factor analysis.
Major findings
 Forty five per cent of scented rice consumers belonged to the age group of 20 to
30 years followed by 31 to 40 years (40%).
 Seventy per cent of consumers had education level up to graduation.
 Most of the families among the sample were small size having 2 to 5 family
members.
 35 per cent of the consumers are in the household income range of Rs. 30,001 to
50,000 per month followed by more than Rs. 50,001 (32.50%).
 42.50 per cent of the buying decision makers were women in the age group of 41
to 50 years.
 Fifty per cent of buying decision makers were graduates and homemakers.
 All the sample consumers were aware about Basmati rice and Kalijira was known
to 27.50 per cent consumers.
 32.50% of the consumers used scented rice once in a month.
 Non vegetarian consumers prepared biriyani and pulao in equal proportions where
as vegetarian consumers mostly prepared pulao.
 37.50 per cent of the consumers on an average purchased scented rice more than 1
to 2 kg per month.
 Sixty per cent of consumers paid in the range of Rs. 50 to 100 per Kg of scented
rice.
 Majority (87.50%) of consumers bought branded scented rice.
 While purchasing scented rice aroma, price, taste, grade, cooking time, brand and
after cooking grain size were most preferred characters.
 While purchasing scented rice, consumers least preferred the characteristics like
impurities, texture, stickiness, broken grain, after cooking shelf life, age of rice,
ease of cooking, grain size and colour.
A Study on Consumer Preference for Scented Rice in Bangalore City 39
 The factors that significantly influenced the buying of scented rice were income,
price, festivals, country of origin, retailers, availability of scented rice, nutritive
value, traditions, friends, advertisements and taste.
 Offers and marital status of the consumers were not significant factors influencing
in buying scented rice.
 Provision store owners were procuring scented rice from wholesalers. The owners
of convenience stores procured scented rice from distributors/stockists. The
supermarket/hypermarket procured scented rice from their respective distribution
centres.
 75 per cent of the sample respondents procured scented rice from wholesalers, ten
per cent of them were procured scented rice from distributors and 15 per cent of
the hoteliers were not using any scented rice.
 There are ten different companies selling basmati rice with thirteen brands in
Bangalore city.
 Kaliira rice was sold by four companies with four different brands. The jasmine
rice imported from Thaitan Foods International Co. Ltd and sold by brand Real Thai.
The Gandhasale rice was sold by Pristine Organics Pvt. Ltd with Pristine brand.
The brown rice was sold by LT Foods with the brand Dawat.
Conclusion
From this study it can be concluded that the scented rice is consumed by the
people having higher income. All consumers know about Basmati rice. The scented rice
consumers preferred aroma, price and taste in the scented rice, and impurities and texture
were not preferred by consumers. It shows that consumers are quality and price conscious
while buying scented rice. The consumers were largely influenced by household income,
price of scented rice and taste of scented rice.
A Study on Consumer Preference for Scented Rice in Bangalore City 40
VII. REFERENCES
ABDULLAHI FARAH, A., ZAINALABIDIN, M. AND ISMAIL, A. L., 2011, The
influence of socio-demographic factors and product attributes on attitudes
toward purchasing special rice among Malaysian consumers. International Food
Research Journal 18(3):1135-1142.
AGBOGO, ELIAS, A., UDOUSO, ANIEDI, B. AND TIKU, EJOR N., 2013, Analysis of
Factors Affecting Rice Consumption in Cross River State, Nigeria, Journal of
Agriculture and Veterinary Science, 4(2): 29-33.
AHUJA, U., AHUJA S, C., THAKRAR, R AND RANI, N. S., 2008.Scented Rices of
India.Asian Agri-History, 12(4): 267-283.
AJAY MODI, Long in grained wisdom.Business Today.Newspaper22nd
December 2013.
AL-HASSAN, R. M., AGBEKPORNU, H. G. ANDSARPONG, D. B., 2008, Consumer
Preferences for Rice Quality Characteristics in Accra and the Effects of these
Preferences on Price, Agricultural and Food Science Journal of Ghana, 7: 575-
591.
ANANG, B. T., SIDNEY NII ADJEI ADJETEY AND STANISLAUS ADDY
ABIRIWE, 2011, Consumer preferences for rice quality characteristics and
the effects on price in the Tamale Metropolis, Northern Region, Ghana.
International Journal of Agri Science, 1(2): 67-74.
AYACHIT, S. M., 2002, Kashyapiyakrishisukti (A treatise on agriculture by Kashyapa).
Agri-history Bulletin No. 4. Asian Agri History Foundation, Secundrabad,
India, p. 158.
AYINDE IDRIS, KAREEM RASAKI, HODEFE, O.J AND BAKARE HAKEEM, 2013,
Consumption Pattern of Ofada Rice among Civil Servants in Abeokuta
Metropolis of Ogun State, Nigeria.Journal of Biology, Agriculture and
Healthcare, 6(3): 106-112.
BALDWIN, K. AND CHILDS, N., 2011, Rice Yearbook (2009/10). USDA, USA.
BERTA SCHNETTLER, DANILO RUIZ, ORIANA SEPÚLVEDA, JOSÉ
SEPÚLVEDA AND MARIANELA DENEGRI., 2009, Importance of origin in
rice purchasing decisions in Talca and Temuco, Chile. Cien.Inv. Agr.36(2):239-
248.
CHAUDHARY, D., TRAN, D. V. AND DUFFY, R., 2003.Specialty Rices of the World:
Breeding Production and Marketing. FAO books, Roma, p. 358.
41 Sunil Kumar, M
DIAKO, C., SAKYI-DAWSON, E., BEDIAKO-AMOA, B., SAALIA, F.K. AND
MANFUL, J.T. 2010, Consumer Perceptions, Knowledge and Preferences for
Aromatic Rice Types in Ghana. Nature and Science 8(12): 12-19.
EMODI, A.I AND MADUKWE, M. C., 2011, Influence of Consumers’ Socio-Economic
Characteristics onRice Consumption in South East Nigeria, Libyan Agriculture
Research Center Journal International.2 (3): 105-111.
FAKAYODE, S. B., OMOTESHO, O. A. and OMONIWA, A. E., 2010, Economic
Analysis of Rice Consumption Patterns in Nigeria. Journal of Agricultural
Science and Technology, 12(2): 135-144.
FAO, 2012.Rice Market Monitor.XV (4): November 37.
FINN, A. AND LOUVIERE, J. J., 1992, “Determining the Appropriate Response to
Evidence of Public Concerns: the Case of Food Safety”, Journal of Public
Policy and Marketing, 11(1): 12-25.
GALAWAT, F. AND YABE, M. 2010, Assessing consumer's preference for local rice in
Brunei: an application of choice model. Journal of International Society for
South-East Asian Agricultural Sciences, 16(2): 104-115.
GEORGES GIRAUD, 2013, The World Market of Fragrant Rice, Main Issues and
Perspectives. International Food and Agribusiness Management Review, 16(2):
1-20.
GIDEON DANSO-ABBEAM MUBARICK ARMED AND FRANCIS BAIDOO, 2014,
Determinants of Consumer Preference for Local Rice in Tamale Metropolis,
Ghana. International Journal of Education and Social Science, 1(2): 114-122.
GURUNG, B., 2013, A Hedonic Pricing Model of Rice for Bhutan.International Journal
of Humanities and Management Sciences, 1(2): 170-178.
HANISAHMAD, I. A. H., JINAP, S., MAD NASIR, S., ALIAS, R. AND
MUHAMMAD SHAHRIM, A. K., 2012, Consumers’ demand and willingness
to pay for rice attributes in Malaysia.International Food Research Journal,
19(1): 363-369.
HORI, K., PURBOYO, R. B. R. A., AKINAGA, Y., OKITA, T. and ITOH, K., 1992,
Knowledge and preference of aromatic rice by consumers in East and South-east
Asia.Journalof Consumer Studies & Home Economics, 16: 199–206.
HORI, K., JUNKO SONODA, YUKO AKINAGA andHEULWEN HALL, A., 1996,
Knowledge and preference for aromatic rice by people in Britain.Journal of
Consumer Studies & Home Economics, 20(2): 145-152.
CONSUMER PREFERENCE FOR SCENTED RICE IN BANGALORE CITY

Mais conteúdo relacionado

Mais procurados (16)

The Yangtze River
The Yangtze RiverThe Yangtze River
The Yangtze River
 
Business Research Process
Business Research ProcessBusiness Research Process
Business Research Process
 
agricultural statistics.ppt
agricultural statistics.pptagricultural statistics.ppt
agricultural statistics.ppt
 
Career opportunity in agriculture
Career opportunity in agricultureCareer opportunity in agriculture
Career opportunity in agriculture
 
The himalayas
The himalayasThe himalayas
The himalayas
 
Farm Retailing/ Farm Gate Marketing
Farm Retailing/ Farm Gate MarketingFarm Retailing/ Farm Gate Marketing
Farm Retailing/ Farm Gate Marketing
 
Supply chain of lemon grass
Supply chain of lemon grassSupply chain of lemon grass
Supply chain of lemon grass
 
Paradigm shift in agricultural extension
Paradigm shift in agricultural extensionParadigm shift in agricultural extension
Paradigm shift in agricultural extension
 
Farmers suicide
Farmers suicideFarmers suicide
Farmers suicide
 
Non-farming activities in rural society.pptx
Non-farming activities in rural society.pptxNon-farming activities in rural society.pptx
Non-farming activities in rural society.pptx
 
Supply chain management of vegetable marketing [www.writekraft.com]
Supply chain management of vegetable marketing  [www.writekraft.com]Supply chain management of vegetable marketing  [www.writekraft.com]
Supply chain management of vegetable marketing [www.writekraft.com]
 
Historical development of co operative
Historical development  of co  operativeHistorical development  of co  operative
Historical development of co operative
 
Agribusiness business development plan
Agribusiness business development planAgribusiness business development plan
Agribusiness business development plan
 
Agricultual marketing
Agricultual marketingAgricultual marketing
Agricultual marketing
 
Evolution of farming systems
Evolution of farming systemsEvolution of farming systems
Evolution of farming systems
 
Nabard
NabardNabard
Nabard
 

Destaque

Determinants of Consumers Purchasing Behaviour for Rice in Delhi (consumer be...
Determinants of Consumers Purchasing Behaviour for Rice in Delhi (consumer be...Determinants of Consumers Purchasing Behaviour for Rice in Delhi (consumer be...
Determinants of Consumers Purchasing Behaviour for Rice in Delhi (consumer be...ANKIT VERMA
 
Study on brand_preference_of_mobile_phon
Study on brand_preference_of_mobile_phonStudy on brand_preference_of_mobile_phon
Study on brand_preference_of_mobile_phonAkshay Thacholi
 
UNDERSTANDING CONSUMER PURCHASING BEHAVIOUR AND CONSUMPTION IN THE ORAL CARE ...
UNDERSTANDING CONSUMER PURCHASING BEHAVIOUR AND CONSUMPTION IN THE ORAL CARE ...UNDERSTANDING CONSUMER PURCHASING BEHAVIOUR AND CONSUMPTION IN THE ORAL CARE ...
UNDERSTANDING CONSUMER PURCHASING BEHAVIOUR AND CONSUMPTION IN THE ORAL CARE ...TIEZHENG YUAN
 
Dissertation By Damien Beatty
Dissertation By Damien BeattyDissertation By Damien Beatty
Dissertation By Damien BeattyDamien Beatty
 
Brand preference of mobile phones
Brand preference of mobile phonesBrand preference of mobile phones
Brand preference of mobile phonesviggy vanshi
 
Social Media Marketing Strategy: Lessons from the Hospitality Industry
Social Media Marketing Strategy: Lessons from the Hospitality IndustrySocial Media Marketing Strategy: Lessons from the Hospitality Industry
Social Media Marketing Strategy: Lessons from the Hospitality IndustryAni Nacheva
 
Mba research project report
Mba research project reportMba research project report
Mba research project reportMohit Verma
 
Best Practices In Collaborative Innovation: How CPG Manufacturers & Retailers...
Best Practices In Collaborative Innovation: How CPG Manufacturers & Retailers...Best Practices In Collaborative Innovation: How CPG Manufacturers & Retailers...
Best Practices In Collaborative Innovation: How CPG Manufacturers & Retailers...Jenna Dudevoir
 
Consumer Behavior - Attitudes ipad
Consumer Behavior - Attitudes ipadConsumer Behavior - Attitudes ipad
Consumer Behavior - Attitudes ipadGamze Saba
 
“A STUDY OF VARIOUS MOBILE OPERATORS PREFERRED BY COLLEGE STUDENTS” FOR FINAL...
“A STUDY OF VARIOUS MOBILE OPERATORS PREFERRED BY COLLEGE STUDENTS” FOR FINAL...“A STUDY OF VARIOUS MOBILE OPERATORS PREFERRED BY COLLEGE STUDENTS” FOR FINAL...
“A STUDY OF VARIOUS MOBILE OPERATORS PREFERRED BY COLLEGE STUDENTS” FOR FINAL...Sahil Grover
 
The impact of social media marketing communications on consumers perception o...
The impact of social media marketing communications on consumers perception o...The impact of social media marketing communications on consumers perception o...
The impact of social media marketing communications on consumers perception o...Deola Kayode
 
Viral marketing of digital products using social media - MBA Dissertation
Viral marketing of digital products using social media - MBA DissertationViral marketing of digital products using social media - MBA Dissertation
Viral marketing of digital products using social media - MBA DissertationKapil Gupta
 
role-of-packaging-on-consumer-buying-behavior
role-of-packaging-on-consumer-buying-behaviorrole-of-packaging-on-consumer-buying-behavior
role-of-packaging-on-consumer-buying-behaviorurvashimnm
 
“Impact of packaging on consumer buying behavior"
“Impact of packaging on consumer buying behavior"“Impact of packaging on consumer buying behavior"
“Impact of packaging on consumer buying behavior"Bhavik Parmar
 
The impact of online advertising on consumer buying behaviour towards mobile ...
The impact of online advertising on consumer buying behaviour towards mobile ...The impact of online advertising on consumer buying behaviour towards mobile ...
The impact of online advertising on consumer buying behaviour towards mobile ...rahul_yadav96
 
Impact of Social media on Consumer Preferences in Fashion Trends
Impact of Social media on Consumer Preferences in Fashion TrendsImpact of Social media on Consumer Preferences in Fashion Trends
Impact of Social media on Consumer Preferences in Fashion TrendsRohina Banerjee
 
A project report on benchmarking of hr practices
A project report on benchmarking of hr practicesA project report on benchmarking of hr practices
A project report on benchmarking of hr practicesProjects Kart
 

Destaque (20)

Determinants of Consumers Purchasing Behaviour for Rice in Delhi (consumer be...
Determinants of Consumers Purchasing Behaviour for Rice in Delhi (consumer be...Determinants of Consumers Purchasing Behaviour for Rice in Delhi (consumer be...
Determinants of Consumers Purchasing Behaviour for Rice in Delhi (consumer be...
 
Study on brand_preference_of_mobile_phon
Study on brand_preference_of_mobile_phonStudy on brand_preference_of_mobile_phon
Study on brand_preference_of_mobile_phon
 
UNDERSTANDING CONSUMER PURCHASING BEHAVIOUR AND CONSUMPTION IN THE ORAL CARE ...
UNDERSTANDING CONSUMER PURCHASING BEHAVIOUR AND CONSUMPTION IN THE ORAL CARE ...UNDERSTANDING CONSUMER PURCHASING BEHAVIOUR AND CONSUMPTION IN THE ORAL CARE ...
UNDERSTANDING CONSUMER PURCHASING BEHAVIOUR AND CONSUMPTION IN THE ORAL CARE ...
 
Dissertation By Damien Beatty
Dissertation By Damien BeattyDissertation By Damien Beatty
Dissertation By Damien Beatty
 
Brand preference of mobile phones
Brand preference of mobile phonesBrand preference of mobile phones
Brand preference of mobile phones
 
Mobile Website vs Mobile App
Mobile Website vs Mobile AppMobile Website vs Mobile App
Mobile Website vs Mobile App
 
Dissertaion on apple inc
Dissertaion on apple incDissertaion on apple inc
Dissertaion on apple inc
 
Social Media Marketing Strategy: Lessons from the Hospitality Industry
Social Media Marketing Strategy: Lessons from the Hospitality IndustrySocial Media Marketing Strategy: Lessons from the Hospitality Industry
Social Media Marketing Strategy: Lessons from the Hospitality Industry
 
Mba research project report
Mba research project reportMba research project report
Mba research project report
 
Best Practices In Collaborative Innovation: How CPG Manufacturers & Retailers...
Best Practices In Collaborative Innovation: How CPG Manufacturers & Retailers...Best Practices In Collaborative Innovation: How CPG Manufacturers & Retailers...
Best Practices In Collaborative Innovation: How CPG Manufacturers & Retailers...
 
Consumer Behavior - Attitudes ipad
Consumer Behavior - Attitudes ipadConsumer Behavior - Attitudes ipad
Consumer Behavior - Attitudes ipad
 
“A STUDY OF VARIOUS MOBILE OPERATORS PREFERRED BY COLLEGE STUDENTS” FOR FINAL...
“A STUDY OF VARIOUS MOBILE OPERATORS PREFERRED BY COLLEGE STUDENTS” FOR FINAL...“A STUDY OF VARIOUS MOBILE OPERATORS PREFERRED BY COLLEGE STUDENTS” FOR FINAL...
“A STUDY OF VARIOUS MOBILE OPERATORS PREFERRED BY COLLEGE STUDENTS” FOR FINAL...
 
Marketing mba project report
Marketing mba project reportMarketing mba project report
Marketing mba project report
 
The impact of social media marketing communications on consumers perception o...
The impact of social media marketing communications on consumers perception o...The impact of social media marketing communications on consumers perception o...
The impact of social media marketing communications on consumers perception o...
 
Viral marketing of digital products using social media - MBA Dissertation
Viral marketing of digital products using social media - MBA DissertationViral marketing of digital products using social media - MBA Dissertation
Viral marketing of digital products using social media - MBA Dissertation
 
role-of-packaging-on-consumer-buying-behavior
role-of-packaging-on-consumer-buying-behaviorrole-of-packaging-on-consumer-buying-behavior
role-of-packaging-on-consumer-buying-behavior
 
“Impact of packaging on consumer buying behavior"
“Impact of packaging on consumer buying behavior"“Impact of packaging on consumer buying behavior"
“Impact of packaging on consumer buying behavior"
 
The impact of online advertising on consumer buying behaviour towards mobile ...
The impact of online advertising on consumer buying behaviour towards mobile ...The impact of online advertising on consumer buying behaviour towards mobile ...
The impact of online advertising on consumer buying behaviour towards mobile ...
 
Impact of Social media on Consumer Preferences in Fashion Trends
Impact of Social media on Consumer Preferences in Fashion TrendsImpact of Social media on Consumer Preferences in Fashion Trends
Impact of Social media on Consumer Preferences in Fashion Trends
 
A project report on benchmarking of hr practices
A project report on benchmarking of hr practicesA project report on benchmarking of hr practices
A project report on benchmarking of hr practices
 

Semelhante a CONSUMER PREFERENCE FOR SCENTED RICE IN BANGALORE CITY

consumer preference for scented rice in bangalore city
consumer preference for scented rice in bangalore cityconsumer preference for scented rice in bangalore city
consumer preference for scented rice in bangalore citySunil Kumar Mallikarjun
 
Summer Internship Report- 2019 (Bestech Seeds India Pvt. Ltd.)
Summer Internship Report- 2019 (Bestech Seeds India Pvt. Ltd.)Summer Internship Report- 2019 (Bestech Seeds India Pvt. Ltd.)
Summer Internship Report- 2019 (Bestech Seeds India Pvt. Ltd.)HemantMeena50
 
Formatted report
Formatted reportFormatted report
Formatted reportAsif Sahir
 
Factors Influencing Purchase of Cake Premix by Bakeries in Madurai and Virudh...
Factors Influencing Purchase of Cake Premix by Bakeries in Madurai and Virudh...Factors Influencing Purchase of Cake Premix by Bakeries in Madurai and Virudh...
Factors Influencing Purchase of Cake Premix by Bakeries in Madurai and Virudh...Associate Professor in VSB Coimbatore
 
HT Live coverage - Morarka Organic - 25th June.mht
HT Live coverage - Morarka Organic - 25th June.mhtHT Live coverage - Morarka Organic - 25th June.mht
HT Live coverage - Morarka Organic - 25th June.mhtSunil Kumar
 
Exotic vegetables 500% growth In India (by Gouri Jadhav)
Exotic vegetables 500% growth In India (by Gouri Jadhav)Exotic vegetables 500% growth In India (by Gouri Jadhav)
Exotic vegetables 500% growth In India (by Gouri Jadhav)Gouri Jadhav
 
MINOR PROJECT REPORT ON MARKET POTENTIAL OF RICE POWDER BY JAYABHARATH MODERN...
MINOR PROJECT REPORT ON MARKET POTENTIAL OF RICE POWDER BY JAYABHARATH MODERN...MINOR PROJECT REPORT ON MARKET POTENTIAL OF RICE POWDER BY JAYABHARATH MODERN...
MINOR PROJECT REPORT ON MARKET POTENTIAL OF RICE POWDER BY JAYABHARATH MODERN...Akaresh Jose Kaviyil JY
 
State symposium assam 2009
State symposium assam 2009State symposium assam 2009
State symposium assam 2009Ashutosh Pal
 
Organic Mandya Project Report
Organic Mandya Project ReportOrganic Mandya Project Report
Organic Mandya Project ReportRohan Telang
 
Cv of md zahidul islam 120316
Cv of md zahidul islam 120316Cv of md zahidul islam 120316
Cv of md zahidul islam 120316Zahidul Islam
 
Cv of md zahidul islam 120316
Cv of md zahidul islam 120316Cv of md zahidul islam 120316
Cv of md zahidul islam 120316Zahidul Islam
 
Presentation of rawe.pptx
Presentation of rawe.pptxPresentation of rawe.pptx
Presentation of rawe.pptxssuser6cbc4b
 
rawe presentation.pptx
rawe presentation.pptxrawe presentation.pptx
rawe presentation.pptxssuser6cbc4b
 
Dheeraj synopsis
Dheeraj synopsisDheeraj synopsis
Dheeraj synopsisamol0745
 
Production and Supply Chain Management of Organic and Inorganic Vegetables in...
Production and Supply Chain Management of Organic and Inorganic Vegetables in...Production and Supply Chain Management of Organic and Inorganic Vegetables in...
Production and Supply Chain Management of Organic and Inorganic Vegetables in...ijtsrd
 
Invitation to Bkumar from Assocham._9824930108
Invitation to Bkumar from Assocham._9824930108Invitation to Bkumar from Assocham._9824930108
Invitation to Bkumar from Assocham._9824930108BHIKHUKUMAR KUNWARADIYA
 

Semelhante a CONSUMER PREFERENCE FOR SCENTED RICE IN BANGALORE CITY (20)

consumer preference for scented rice in bangalore city
consumer preference for scented rice in bangalore cityconsumer preference for scented rice in bangalore city
consumer preference for scented rice in bangalore city
 
Summer Internship Report- 2019 (Bestech Seeds India Pvt. Ltd.)
Summer Internship Report- 2019 (Bestech Seeds India Pvt. Ltd.)Summer Internship Report- 2019 (Bestech Seeds India Pvt. Ltd.)
Summer Internship Report- 2019 (Bestech Seeds India Pvt. Ltd.)
 
Formatted report
Formatted reportFormatted report
Formatted report
 
Daily foods
Daily foodsDaily foods
Daily foods
 
Factors Influencing Purchase of Cake Premix by Bakeries in Madurai and Virudh...
Factors Influencing Purchase of Cake Premix by Bakeries in Madurai and Virudh...Factors Influencing Purchase of Cake Premix by Bakeries in Madurai and Virudh...
Factors Influencing Purchase of Cake Premix by Bakeries in Madurai and Virudh...
 
HT Live coverage - Morarka Organic - 25th June.mht
HT Live coverage - Morarka Organic - 25th June.mhtHT Live coverage - Morarka Organic - 25th June.mht
HT Live coverage - Morarka Organic - 25th June.mht
 
Exotic vegetables 500% growth In India (by Gouri Jadhav)
Exotic vegetables 500% growth In India (by Gouri Jadhav)Exotic vegetables 500% growth In India (by Gouri Jadhav)
Exotic vegetables 500% growth In India (by Gouri Jadhav)
 
MINOR PROJECT REPORT ON MARKET POTENTIAL OF RICE POWDER BY JAYABHARATH MODERN...
MINOR PROJECT REPORT ON MARKET POTENTIAL OF RICE POWDER BY JAYABHARATH MODERN...MINOR PROJECT REPORT ON MARKET POTENTIAL OF RICE POWDER BY JAYABHARATH MODERN...
MINOR PROJECT REPORT ON MARKET POTENTIAL OF RICE POWDER BY JAYABHARATH MODERN...
 
State symposium assam 2009
State symposium assam 2009State symposium assam 2009
State symposium assam 2009
 
Organic Mandya Project Report
Organic Mandya Project ReportOrganic Mandya Project Report
Organic Mandya Project Report
 
Cv of md zahidul islam 120316
Cv of md zahidul islam 120316Cv of md zahidul islam 120316
Cv of md zahidul islam 120316
 
Cv of md zahidul islam 120316
Cv of md zahidul islam 120316Cv of md zahidul islam 120316
Cv of md zahidul islam 120316
 
suryanarayan BIL Reports
suryanarayan BIL Reportssuryanarayan BIL Reports
suryanarayan BIL Reports
 
Presentation of rawe.pptx
Presentation of rawe.pptxPresentation of rawe.pptx
Presentation of rawe.pptx
 
rawe presentation.pptx
rawe presentation.pptxrawe presentation.pptx
rawe presentation.pptx
 
Dheeraj synopsis
Dheeraj synopsisDheeraj synopsis
Dheeraj synopsis
 
AGRIFARM
AGRIFARMAGRIFARM
AGRIFARM
 
Navendra Trivedi-17
Navendra Trivedi-17Navendra Trivedi-17
Navendra Trivedi-17
 
Production and Supply Chain Management of Organic and Inorganic Vegetables in...
Production and Supply Chain Management of Organic and Inorganic Vegetables in...Production and Supply Chain Management of Organic and Inorganic Vegetables in...
Production and Supply Chain Management of Organic and Inorganic Vegetables in...
 
Invitation to Bkumar from Assocham._9824930108
Invitation to Bkumar from Assocham._9824930108Invitation to Bkumar from Assocham._9824930108
Invitation to Bkumar from Assocham._9824930108
 

Mais de Sunil Kumar Mallikarjun

Mais de Sunil Kumar Mallikarjun (8)

Ocimum tenuiflorum tissue culture
Ocimum tenuiflorum tissue cultureOcimum tenuiflorum tissue culture
Ocimum tenuiflorum tissue culture
 
Molecular farming
Molecular farmingMolecular farming
Molecular farming
 
Plant disease cycle
Plant disease cyclePlant disease cycle
Plant disease cycle
 
Food packaging and labelling
Food packaging and labellingFood packaging and labelling
Food packaging and labelling
 
food packaging and labeling
food packaging and labelingfood packaging and labeling
food packaging and labeling
 
Silk industry in india 2013
Silk industry in india 2013Silk industry in india 2013
Silk industry in india 2013
 
Fairtreade report
Fairtreade reportFairtreade report
Fairtreade report
 
minimizatoin of wastage of fruits and vegetables at reliance fresh outlet
minimizatoin of wastage of fruits and vegetables at reliance fresh outletminimizatoin of wastage of fruits and vegetables at reliance fresh outlet
minimizatoin of wastage of fruits and vegetables at reliance fresh outlet
 

Último

VIP Kolkata Call Girl Howrah 👉 8250192130 Available With Room
VIP Kolkata Call Girl Howrah 👉 8250192130  Available With RoomVIP Kolkata Call Girl Howrah 👉 8250192130  Available With Room
VIP Kolkata Call Girl Howrah 👉 8250192130 Available With Roomdivyansh0kumar0
 
Lucknow 💋 Escorts in Lucknow - 450+ Call Girl Cash Payment 8923113531 Neha Th...
Lucknow 💋 Escorts in Lucknow - 450+ Call Girl Cash Payment 8923113531 Neha Th...Lucknow 💋 Escorts in Lucknow - 450+ Call Girl Cash Payment 8923113531 Neha Th...
Lucknow 💋 Escorts in Lucknow - 450+ Call Girl Cash Payment 8923113531 Neha Th...anilsa9823
 
Creating Low-Code Loan Applications using the Trisotech Mortgage Feature Set
Creating Low-Code Loan Applications using the Trisotech Mortgage Feature SetCreating Low-Code Loan Applications using the Trisotech Mortgage Feature Set
Creating Low-Code Loan Applications using the Trisotech Mortgage Feature SetDenis Gagné
 
Yaroslav Rozhankivskyy: Три складові і три передумови максимальної продуктивн...
Yaroslav Rozhankivskyy: Три складові і три передумови максимальної продуктивн...Yaroslav Rozhankivskyy: Три складові і три передумови максимальної продуктивн...
Yaroslav Rozhankivskyy: Три складові і три передумови максимальної продуктивн...Lviv Startup Club
 
M.C Lodges -- Guest House in Jhang.
M.C Lodges --  Guest House in Jhang.M.C Lodges --  Guest House in Jhang.
M.C Lodges -- Guest House in Jhang.Aaiza Hassan
 
Socio-economic-Impact-of-business-consumers-suppliers-and.pptx
Socio-economic-Impact-of-business-consumers-suppliers-and.pptxSocio-economic-Impact-of-business-consumers-suppliers-and.pptx
Socio-economic-Impact-of-business-consumers-suppliers-and.pptxtrishalcan8
 
Eni 2024 1Q Results - 24.04.24 business.
Eni 2024 1Q Results - 24.04.24 business.Eni 2024 1Q Results - 24.04.24 business.
Eni 2024 1Q Results - 24.04.24 business.Eni
 
Insurers' journeys to build a mastery in the IoT usage
Insurers' journeys to build a mastery in the IoT usageInsurers' journeys to build a mastery in the IoT usage
Insurers' journeys to build a mastery in the IoT usageMatteo Carbone
 
A DAY IN THE LIFE OF A SALESMAN / WOMAN
A DAY IN THE LIFE OF A  SALESMAN / WOMANA DAY IN THE LIFE OF A  SALESMAN / WOMAN
A DAY IN THE LIFE OF A SALESMAN / WOMANIlamathiKannappan
 
MONA 98765-12871 CALL GIRLS IN LUDHIANA LUDHIANA CALL GIRL
MONA 98765-12871 CALL GIRLS IN LUDHIANA LUDHIANA CALL GIRLMONA 98765-12871 CALL GIRLS IN LUDHIANA LUDHIANA CALL GIRL
MONA 98765-12871 CALL GIRLS IN LUDHIANA LUDHIANA CALL GIRLSeo
 
The Coffee Bean & Tea Leaf(CBTL), Business strategy case study
The Coffee Bean & Tea Leaf(CBTL), Business strategy case studyThe Coffee Bean & Tea Leaf(CBTL), Business strategy case study
The Coffee Bean & Tea Leaf(CBTL), Business strategy case studyEthan lee
 
Tech Startup Growth Hacking 101 - Basics on Growth Marketing
Tech Startup Growth Hacking 101  - Basics on Growth MarketingTech Startup Growth Hacking 101  - Basics on Growth Marketing
Tech Startup Growth Hacking 101 - Basics on Growth MarketingShawn Pang
 
BEST ✨ Call Girls In Indirapuram Ghaziabad ✔️ 9871031762 ✔️ Escorts Service...
BEST ✨ Call Girls In  Indirapuram Ghaziabad  ✔️ 9871031762 ✔️ Escorts Service...BEST ✨ Call Girls In  Indirapuram Ghaziabad  ✔️ 9871031762 ✔️ Escorts Service...
BEST ✨ Call Girls In Indirapuram Ghaziabad ✔️ 9871031762 ✔️ Escorts Service...noida100girls
 
Best VIP Call Girls Noida Sector 40 Call Me: 8448380779
Best VIP Call Girls Noida Sector 40 Call Me: 8448380779Best VIP Call Girls Noida Sector 40 Call Me: 8448380779
Best VIP Call Girls Noida Sector 40 Call Me: 8448380779Delhi Call girls
 
Russian Faridabad Call Girls(Badarpur) : ☎ 8168257667, @4999
Russian Faridabad Call Girls(Badarpur) : ☎ 8168257667, @4999Russian Faridabad Call Girls(Badarpur) : ☎ 8168257667, @4999
Russian Faridabad Call Girls(Badarpur) : ☎ 8168257667, @4999Tina Ji
 
Monte Carlo simulation : Simulation using MCSM
Monte Carlo simulation : Simulation using MCSMMonte Carlo simulation : Simulation using MCSM
Monte Carlo simulation : Simulation using MCSMRavindra Nath Shukla
 
7.pdf This presentation captures many uses and the significance of the number...
7.pdf This presentation captures many uses and the significance of the number...7.pdf This presentation captures many uses and the significance of the number...
7.pdf This presentation captures many uses and the significance of the number...Paul Menig
 
Pharma Works Profile of Karan Communications
Pharma Works Profile of Karan CommunicationsPharma Works Profile of Karan Communications
Pharma Works Profile of Karan Communicationskarancommunications
 
Call Girls Pune Just Call 9907093804 Top Class Call Girl Service Available
Call Girls Pune Just Call 9907093804 Top Class Call Girl Service AvailableCall Girls Pune Just Call 9907093804 Top Class Call Girl Service Available
Call Girls Pune Just Call 9907093804 Top Class Call Girl Service AvailableDipal Arora
 

Último (20)

VIP Kolkata Call Girl Howrah 👉 8250192130 Available With Room
VIP Kolkata Call Girl Howrah 👉 8250192130  Available With RoomVIP Kolkata Call Girl Howrah 👉 8250192130  Available With Room
VIP Kolkata Call Girl Howrah 👉 8250192130 Available With Room
 
Lucknow 💋 Escorts in Lucknow - 450+ Call Girl Cash Payment 8923113531 Neha Th...
Lucknow 💋 Escorts in Lucknow - 450+ Call Girl Cash Payment 8923113531 Neha Th...Lucknow 💋 Escorts in Lucknow - 450+ Call Girl Cash Payment 8923113531 Neha Th...
Lucknow 💋 Escorts in Lucknow - 450+ Call Girl Cash Payment 8923113531 Neha Th...
 
Creating Low-Code Loan Applications using the Trisotech Mortgage Feature Set
Creating Low-Code Loan Applications using the Trisotech Mortgage Feature SetCreating Low-Code Loan Applications using the Trisotech Mortgage Feature Set
Creating Low-Code Loan Applications using the Trisotech Mortgage Feature Set
 
Yaroslav Rozhankivskyy: Три складові і три передумови максимальної продуктивн...
Yaroslav Rozhankivskyy: Три складові і три передумови максимальної продуктивн...Yaroslav Rozhankivskyy: Три складові і три передумови максимальної продуктивн...
Yaroslav Rozhankivskyy: Три складові і три передумови максимальної продуктивн...
 
M.C Lodges -- Guest House in Jhang.
M.C Lodges --  Guest House in Jhang.M.C Lodges --  Guest House in Jhang.
M.C Lodges -- Guest House in Jhang.
 
Socio-economic-Impact-of-business-consumers-suppliers-and.pptx
Socio-economic-Impact-of-business-consumers-suppliers-and.pptxSocio-economic-Impact-of-business-consumers-suppliers-and.pptx
Socio-economic-Impact-of-business-consumers-suppliers-and.pptx
 
Eni 2024 1Q Results - 24.04.24 business.
Eni 2024 1Q Results - 24.04.24 business.Eni 2024 1Q Results - 24.04.24 business.
Eni 2024 1Q Results - 24.04.24 business.
 
Insurers' journeys to build a mastery in the IoT usage
Insurers' journeys to build a mastery in the IoT usageInsurers' journeys to build a mastery in the IoT usage
Insurers' journeys to build a mastery in the IoT usage
 
A DAY IN THE LIFE OF A SALESMAN / WOMAN
A DAY IN THE LIFE OF A  SALESMAN / WOMANA DAY IN THE LIFE OF A  SALESMAN / WOMAN
A DAY IN THE LIFE OF A SALESMAN / WOMAN
 
MONA 98765-12871 CALL GIRLS IN LUDHIANA LUDHIANA CALL GIRL
MONA 98765-12871 CALL GIRLS IN LUDHIANA LUDHIANA CALL GIRLMONA 98765-12871 CALL GIRLS IN LUDHIANA LUDHIANA CALL GIRL
MONA 98765-12871 CALL GIRLS IN LUDHIANA LUDHIANA CALL GIRL
 
The Coffee Bean & Tea Leaf(CBTL), Business strategy case study
The Coffee Bean & Tea Leaf(CBTL), Business strategy case studyThe Coffee Bean & Tea Leaf(CBTL), Business strategy case study
The Coffee Bean & Tea Leaf(CBTL), Business strategy case study
 
Tech Startup Growth Hacking 101 - Basics on Growth Marketing
Tech Startup Growth Hacking 101  - Basics on Growth MarketingTech Startup Growth Hacking 101  - Basics on Growth Marketing
Tech Startup Growth Hacking 101 - Basics on Growth Marketing
 
BEST ✨ Call Girls In Indirapuram Ghaziabad ✔️ 9871031762 ✔️ Escorts Service...
BEST ✨ Call Girls In  Indirapuram Ghaziabad  ✔️ 9871031762 ✔️ Escorts Service...BEST ✨ Call Girls In  Indirapuram Ghaziabad  ✔️ 9871031762 ✔️ Escorts Service...
BEST ✨ Call Girls In Indirapuram Ghaziabad ✔️ 9871031762 ✔️ Escorts Service...
 
Best VIP Call Girls Noida Sector 40 Call Me: 8448380779
Best VIP Call Girls Noida Sector 40 Call Me: 8448380779Best VIP Call Girls Noida Sector 40 Call Me: 8448380779
Best VIP Call Girls Noida Sector 40 Call Me: 8448380779
 
Russian Faridabad Call Girls(Badarpur) : ☎ 8168257667, @4999
Russian Faridabad Call Girls(Badarpur) : ☎ 8168257667, @4999Russian Faridabad Call Girls(Badarpur) : ☎ 8168257667, @4999
Russian Faridabad Call Girls(Badarpur) : ☎ 8168257667, @4999
 
Nepali Escort Girl Kakori \ 9548273370 Indian Call Girls Service Lucknow ₹,9517
Nepali Escort Girl Kakori \ 9548273370 Indian Call Girls Service Lucknow ₹,9517Nepali Escort Girl Kakori \ 9548273370 Indian Call Girls Service Lucknow ₹,9517
Nepali Escort Girl Kakori \ 9548273370 Indian Call Girls Service Lucknow ₹,9517
 
Monte Carlo simulation : Simulation using MCSM
Monte Carlo simulation : Simulation using MCSMMonte Carlo simulation : Simulation using MCSM
Monte Carlo simulation : Simulation using MCSM
 
7.pdf This presentation captures many uses and the significance of the number...
7.pdf This presentation captures many uses and the significance of the number...7.pdf This presentation captures many uses and the significance of the number...
7.pdf This presentation captures many uses and the significance of the number...
 
Pharma Works Profile of Karan Communications
Pharma Works Profile of Karan CommunicationsPharma Works Profile of Karan Communications
Pharma Works Profile of Karan Communications
 
Call Girls Pune Just Call 9907093804 Top Class Call Girl Service Available
Call Girls Pune Just Call 9907093804 Top Class Call Girl Service AvailableCall Girls Pune Just Call 9907093804 Top Class Call Girl Service Available
Call Girls Pune Just Call 9907093804 Top Class Call Girl Service Available
 

CONSUMER PREFERENCE FOR SCENTED RICE IN BANGALORE CITY

  • 1. A STUDY ON CONSUMER PREFERENCE FOR SCENTED RICE IN BANGALORE CITY SUNIL KUMAR, M. MBAL 2027 DEPARTMENT OF AGRICULTURAL MARKETING, CO-OPERATION AND BUSINESS MANAGEMENT UNIVERSITY OF AGRICULTURAL SCIENCES GKVK, BANGALORE- 560 065 2014
  • 2. A STUDY ON CONSUMER PREFERENCE FOR SCENTED RICE IN BANGALORE CITY SUNIL KUMAR, M. MBAL 2027 Project Report submitted to the University of Agricultural Sciences, Bangalore in partial fulfillment of the requirements for the degree of Master of Business Administration (Agribusiness Management) BANGALORE OCTOBER, 2014
  • 3. Affectionately Dedicated to My parents Mrs. VIJAYA LAXMI & Mr. MALLIKARJUN
  • 4.
  • 5. ACKNOWLEDGEMENT I humble place before the throne of the Almighty, my most sincere gratitude. His grace and tender mercies have renewed me every day, all the way on the journey through my life. I want to show my all the gratitude to my parents Mr. Mallikarjun and Mrs. Vijaya Laxmi only because of their blessings I am here. With immense pleasure and deep respect, I express my heartfelt gratitude to the Chairman of my advisory committee Dr. G. N. Nagaraja, Professor, Dept. of Agricultural Marketing, Co-operation and Business Management, UAS, GKVK, Bangalore, for his excellent guidance, constant support, close counsel and valuable suggestions throughout the period of my study. His enthusiasm, interest, concern, perfection and constructive criticism have always aroused my spirits to do more, to achieve higher. I am extremely grateful to members of my Advisory Committee, Dr. P. K. Mandanna, Professor and University Head, Dept. of Agricultural Marketing, Co-operation and Business Management, UAS, GKVK, Banglore; Dr. C. P. Gracy, Professor, Dept. of Agricultural Marketing, Co-operation and Business Management, UAS, GKVK, Banglore and Dr. D. Nanjappa, Professor, Dept. of Agricultural Extension,UAS, GKVK, Bangalore for their valuable suggestions, encouragement and critical comments during the course of this study. I express my deep sense of reverence to Dr. M. S. Jayaram, Professor and Head, Department of Agricultural Marketing, co-operation and business management, UAS, GKVK, Bangalore for his kind co-operation and constructive suggestions during my project work.
  • 6. I greatly acknowledge the cooperation and help extended by my teachers Dr. B. M. R. Reddy and Dr. M. S. Ganapathy and Mr. P. V. Ramegowda (retired), Department of Agricultural Marketing, Co-operation & Business Management. My special thanks to Dr. M. R. Girish, Asst. Professor (Sr. scale) and placement co-coordinator, Dept. of Agricultural Marketing, co-operation and business management, UAS, GKVK, Bangalore, for his inspiring encouragement, friendly atmosphere, valuable idea and suggestions. I thank my friends Akhilesh, Gourav, Vivekananda, Sunil Gouda, Naganagouda, Mahantesh, Satish and Nazeer for their friendship, love, help and care and for making the two year study in Bangalore, enjoyable and memorable. I thank to my brother Mr. Vinod Kumar M, my Cousins Mr. Basavaraj and Prabhudeva Palled for their moral support extended to me. Bangalore October, 2014 (Sunil Kumar, M.)
  • 7. A STUDY ON CONSUMER PREFERENCE FOR SCENTED RICE IN BANGALORE CITY SUNIL KUMAR, M. ABSTRACT The present study was conducted to analyze the consumer awareness, preference and factors influencing buying of scented rice in Bangalore city. The primary data were collected by 40 consumers, 20 retailers and 20 hoteliers. The sourcing scented rice by hoteliers and retailers were also documented. The major findings of the study revealed that all consumers were aware of Basmati rice and Kalijira was known to 27.50 per cent consumers. The consumer preference was analysed using Best-Worst scaling technique. While purchasing scented rice aroma, price, taste, grade, cooking time, brand and after cooking grain size were most preferred characters and While consumers were least preferred characteristics like impurities, texture, stickiness, broken grain, age of rice, grain size and colour. The study was identified the factors influencing buying decision using factor analysis. The factors that significantly influenced the buying of scented rice were income, price of scented rice, festivals, country of origin, retailers, availability of scented rice, nutritive value, traditions, friends, advertisements and taste. Offers and marital status of the consumers were not significant factors influencing in buying scented rice. Provision store owners were procuring scented rice from wholesalers. The owners of convenience stores procured scented rice from distributors/stockists. The supermarket/ hypermarket procured scented rice from their respective distribution centres. Seventy five per cent of the hoteliers procured scented rice from wholesalers, ten per cent of them were procured scented rice from distributors and 15 per cent of the hoteliers were not using any scented rice. There are ten different companies selling basmati rice with thirteen brands in Bangalore city. Date: October, 2014 G. N. NAGARAJA Place: Bangalore Major Advisor
  • 8. ¨ÉAUÀ¼ÀÆgÀÄ £ÀUÀgÀzÀ ¸ÀĪÁ¹vÀ CQÌ UÁæºÀPÀgÀ DzÀåvÉ: MAzÀÄ CzsÀåAiÀÄ£À ¸ÀĤ¯ï PÀĪÀiÁgï, JA. ¸ÁgÁA±À ¥Àæ¸ÀÄÛvÀ CzsÀåAiÀÄ£ÀªÀÅ ¨ÉAUÀ¼ÀÆgÀÄ £ÀUÀgÀzÀ UÁæºÀPÀgÀ eÁUÀÈw, DzÀåvÉ ªÀÄvÀÄÛ ¸ÀĪÁ¹vÀ CQÌ Rjâ CA±ÀUÀ¼À£ÀÄß «±Éèö¸À®Ä £ÀqɸÀ¯ÁVzÉ. zÀvÁÛA±ÀªÀ£ÀÄß 40 UÁæºÀPÀgÀÄ, 20 a®ègÉ CAUÀrAiÀĪÀgÀÄ ªÀÄvÀÄÛ 20 ºÉÆÃmÉ¯ï ªÀiÁ°ÃPÀgÀ ªÀÄÆ®PÀ ¸ÀAUÀ滸À¯ÁVzÉ ºÁUÀÄ a®ègÉ CAUÀr ªÀÄvÀÄÛ ºÉÆÃmÉ¯ï ªÀiÁ°ÃPÀjAzÀ ¸ÀÄUÀA¢üvÀ CQÌ ¥ÀÆgÉÊPÉAiÀÄ §UÉÎ zsÁR°¹PÉƼÀî¯ÁVzÉ. CzsÀåAiÀÄ£À¢AzÀ w½zÀÄ §AzÀ ¥ÀæªÀÄÄR CA±ÀUÀ¼ÉAzÀgÉ, J¯Á UÁæºÀPÀjUÉ ¨Á¸ÀĪÀÄw CQÌAiÀÄ §UÉÎ Cj«zÉ ªÀÄvÀÄÛ ±ÉÃ. 27.50 gÀµÀÄÖ UÁæºÀPÀgÀÄ PÁ°fÃgÀ CQÌAiÀÄ §UÉÎ w½¢zÁÝgÉ. UÁæºÀPÀgÀ DzÀåvÉ CzsÀåAiÀÄ£ÀzÀ ¸À®ÄªÁV ¨É¸ïÖ-ªÀ¸ïÖ ªÀiÁ¥À£ÀªÀ£ÀÄß G¥ÀAiÉÆÃV¸À¯ÁVzÉ. ¸ÀĪÁ¹vÀ CQÌAiÀÄ°è ¥ÀjªÀļÀ, CQÌAiÀÄ ¨É¯É, gÀÄa, UÉæÃqï, CqÀÄUÉUÉ vÀUÀ®ÄªÀ ¸ÀªÀÄAiÀÄ, ¨ÁæAqï ªÀÄvÀÄÛ CqÀÄUÉ £ÀAvÀgÀzÀ zsÁ£Àå UÁvÀæ EªÀÅUÀ¼ÀÄ ºÉZÀÄÑ DzÀåvÉUÉ ¥ÁvÀæªÁVªÉ. UÁæºÀPÀgÀÄ CQÌAiÀÄ ªÀAiÀĸÀÄì, PÀ®ä±À, «£Áå¸À, fUÀÄlÄvÀ£À, ªÀÄÄjzÀ zsÁ£Àå EªÀÅUÀ½UÉ PÀrªÉÄ DzÀåvÉ ¤ÃrzÁÝgÉ. Rjâ ¤zsÁðgÀ CA±ÀUÀ¼À£ÀÄß «±Éèö¸À®Ä CA±À «±ÉèõÀuÉ §¼À¸À¯Á¬ÄvÀÄ. DzÁAiÀÄ, DQÌAiÀÄ ¨É¯É, ºÀ§âUÀ¼ÀÄ, ¸ÀA¥ÀæzÁAiÀÄUÀ¼ÀÄ, ¸ÉßûvÀgÀÄ, a®ègÉ CAUÀrAiÀĪÀgÀÄ, eÁ»gÁvÀÄUÀ¼ÀÄ, ¥Ë¶ÖPÀvÉ, gÀÄa, ®¨sÀåvÉ ªÀÄvÀÄÛ zÉñÀ EªÀÅUÀ¼ÀÄ ¸ÀĪÁ¹vÀ CQÌ RjâAiÀÄ°è UÀªÀÄ£ÁºÀð ¥Àæ¨sÁªÀ ©ÃgÀĪÀ CA±ÀUÀ¼ÁVªÉ. PÉÆqÀÄUÉUÀ¼ÀÄ ªÀÄvÀÄÛ UÁæºÀPÀgÀ ªÉʪÁ»PÀ ¹Üw ¸ÀĪÁ¹vÀ CQÌ RjâAiÀÄ°è ¥ÀæªÀÄÄR CA±ÀUÀ¼ÁVgÀĪÀÅ®è. a®ègÉ CAUÀrAiÀĪÀgÀÄ ¸ÀUÀlÄ ªÁå¥ÁjUÀ½AzÀ ¸ÀĪÁ¹vÀ CQÌAiÀÄ£ÀÄß Rjâ¸ÀÄvÁÛgÉ. PÀ¤éäAiÀÄ£ïì ¸ÉÆÖÃgïì£À ªÀiÁ°ÃPÀgÀÄ «vÀgÀPÀgÀÄ/zÁ¸ÁÛ£ÀÄzÁgÀjAzÀ Rjâ¸ÀÄvÁÛgÉ. ¸ÀÆ¥Àgï ªÀiÁPÉðmï/ºÉÊ¥Àgï ªÀiÁPÉðmïUÀ¼ÀÄ vÀªÀÄä «vÀgÀuÁPÉÃAzÀæUÀ½AzÀ ¥ÀÆgÉʹPÉƼÀÄîvÀÛªÉ. ±ÉÃ. 75 gÀµÀÄÖ ºÉÆÃmÉ¯ï ªÀiÁ°ÃPÀgÀÄ ¸ÀĪÁ¹vÀ CQÌAiÀÄ£ÀÄß ¸ÀUÀlÄ ªÁå¥ÁjUÀ½AzÀ ¸ÀAUÀ滹gÀÄvÁÛgÉ. ±ÉÃ.10 gÀµÀÄÖ ºÉÆÃmÉ¯ï ªÀiÁ°ÃPÀgÀÄ «vÀgÀPÀgÀÄ/zÁ¸ÁÛ£ÀÄzÁgÀjAzÀ ¸ÀĪÁ¹vÀ CQÌAiÀÄ£ÀÄß Rjâ¸ÀÄvÁÛgÉ. ±ÉÃ. 15 gÀµÀÄÖ ºÉÆÃmÉ¯ï ªÀiÁ°ÃPÀgÀÄ AiÀiÁªÀÅzÉà ¸ÀĪÁ¹vÀ CQÌAiÀÄ£ÀÄß §¼À¸ÀĪÀÅ¢®è. ¨ÉAUÀ¼ÀÆgÀÄ £ÀUÀgÀzÀ°è ««zsÀ ¸ÀA¸ÉÜUÀ¼À 13 ¨ÁæAqïUÀ¼À ¨Á¸ÀĪÀÄw CQÌ ªÀiÁgÁlªÁUÀÄwÛªÉ. ¢£ÁAPÀ: CPÉÆÖçgï, 2014 f. J£ï. £ÁUÀgÁd ¸ÀܼÀ: ¨ÉAUÀ¼ÀÆgÀÄ ¥ÀæzsÁ£À ¸À®ºÉUÁgÀgÀÄ
  • 9.
  • 10. CONTENTS CHAPTER TITLE PAGE No. I INTRODUCTION 1-7 II REVIEW OF LITERATURE 8-16 III METHODOLOGY 17-20 IV RESULTS 21-32 V DISCUSSION 33-36 VI SUMMARY AND CONCLUSION 37-39 VII REFERENCES 40-44
  • 11. LIST OF TABLES Table No. Title of table Page No. 4.1 Socio-economic profile of the consumers in Bangalore city 22 4.2 Profile of buying decision maker in Bangalore city 23 4.3 Awareness of consumers about different types of scented rice 24 4.4 Frequency of consumption of scented rice in Bangalore city 24 4.5 Food prepared by vegetarian consumers using scented rice in Bangalore city 26 4.6 Food prepared by non-vegetarian consumers using scented rice in Bangalore city 26 4.7 Consumers’ monthly purchase pattern of scented rice in Bangalore city 28 4.8 Consumers’ preference for various attributes of scented rice in Bangalore city 29 4.9 Factors influencing buying decision of scented rice by consumers in Bangalore city 30 4.10 Procurement of scented rice by retailers in Bangalore city 32 4.11 Major brands of Basmati rice in Bangalore city 32 4.12 Other brands of scented rice in Bangalore city 32
  • 12. LIST OF FIGURES Fig. No. Title of figure Between Pages 1. Types of scented rice 26-27 2. Consumer preference for various rice attributes in Bangalore city 30-31 3. Major brands of Basmati rice available in Bangalore city 32-33 4. Kalijira rice brand available in Bangalore city 32-33 5. Jasmine rice brands available in Bangalore city 32-33 6. Brown rice brand available in Bangalore city 32-33 7. Gandhasale rice brand available in Bangalore city 32-33
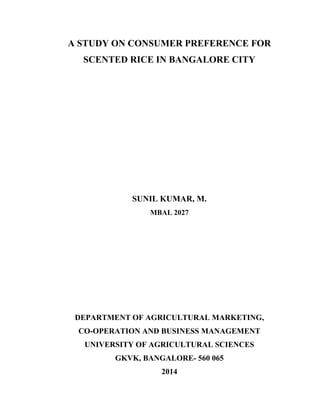
  • 13. A Study on Consumer Preference for Scented Rice in Bangalore City 1 I. INTRODUCTION Rice (oriza sativa L.) is a dietary staple for about 62.80 per cent of the inhabitants on the planet and accounts for 20 per cent of the calorie intake for the world population. In Asia it accounts for 29.30 per cent (Timmer, 2010). This segment varies from 26.80 per cent for China to 69.80 per cent for Bangladesh. Currently, fragrant rice is a niche market for the premium segment, whereas the main market for coarse rice trading is through government procurements related to food policy and security in Asia and Africa. Fragrant rice is generally identified by three main factors: appearance, aroma and taste (Chaudhary et al., 2003). It is characterized as a superfine grain, with a pleasant and subtle aroma. It has a soft texture and extreme grain elongation with a breadth-wise swelling that occurs with cooking. Basmati and Jasmine are premium long grain rice and their high value comes from the characteristic fragrance in both the raw and cooked states, and for the distinctive shape of the grain, which upon cooking elongates to almost double its length whilst its width remains the same. In addition to having a desirable taste and texture, basmati and Jasmine rice are reported to be a good source of slow releasing carbohydrates, i.e. it has a low glycemic index compared with other rice. Basmati rice has traditionally been grown in the north and northwestern part of the Indian sub-continent for centuries. The best cropping conditions for Jasmine are found in north and northeastern Thailand. Fragrant rice produces the best quality grains under warm, humid, and valley-like conditions. Because of the attractive price premiums, some stakeholders are prone to provide fragrant rice, not sourced from its genuine regions and consequently offer consumers less aroma. 1.1 Different types of scented rice Some of the important varieties of scented rice in India include the Basmati of north-western India, Kalanamak of Uttar Pradesh, Dubraj and Chinoor of Madhya Pradesh, Ambemohar of Maharashtra, Radhunipagla of West Bengal, Jeerakasamba of Tamil Nadu, Gandhasale of Karnataka and Kalijira from UP and Badshabog of Orissa. 1.1.1 Basmati Basmati is long grain scented rice grown for many centuries in the specific geographical area; at the Himalayan foot hills of Indian sub-continent, blessed with characteristics extra- long slender grains that elongate at least twice of their original size with a characteristics soft and fluffy texture upon cooking, delicious taste, superior aroma and distinct flavour. Basmati rice is unique among other scented long grain rice varieties. The aroma is due to the presence of chemical called 2-acetyl-1-pyrroline which is found in basmati at about 90 ppb.
  • 14. 2 Sunil Kumar, M 1.1.2 Jasmine Jasmine rice sometimes known as Thai fragrant rice is a long-grain variety of rice that has a nutty aroma and a subtle pandan-like (Pandanus amaryllifolius) leaves. The flavour caused by 2-Acetyl-1-pyrroline. Jasmine rice is originally from Thailand. The grains will cling when cooked, though it is less sticky than other rice. It is also known as Thai Hom Mali. 1.1.3 Kalijira Kalijira rice is from UP. This is a miniature basmati which is non-glutinous. 1.1.4 Gandhasale Gandhasale is a traditional flavoured and scented rice variety of Karnataka, has been the favorite of rice farmers for ages. It is a disease resistant and a hardy variety. Has high dietary fiber compared to white rice. Cultivated in small pockets and is on the verge of being lost from the food basket. 1.1.5 Brown rice Brown rice (or hulled or unmilled rice) is whole grain rice. It has a mild, nutty flavour, and is chewier and more nutritious than white rice, but goes rancid more quickly because the bran and germ which are removed to make white rice contain fats that can spoil. Any rice, including long-grain, short-grain, or sticky rice, may be eaten as brown rice. 1.2 Historical perspective Scented rice always had a special place in countries where rice is the staple. For example, in Japan, home grown Koshihikari is considered worth its weight in gold. Black scented rice was a favourite of the royalty in china. Other important scented varieties in the world market are Khao Dawk Mali 105, Siamati (Thailand), Bahra (Afganistan), Sadri (Iran), Della, Texamati and Kasmati (USA). Scented rice have been known in the Indian subcontinent since the times of Charaka (600 B. C) and Sushruta (200 B.C). These rice have played an important role in many regional economies, and have been the favourites of kings, religious heads, royal and the elite of society (Ahuja et al., 2008). The Rigveda (1000 B. C), the oldest of the vedas, mentions dhan, dhana and dhanya. It is widely believed that these terms refers to rice, as the remains of both wild and cultivated rice have been found in sites dating back to the Neolithic period. By the time of Yejurveda, rice attained the status of a holy grain and formed an integral part of offerings to God, in addition to its basic role in food (Kamal, 1988; Kansara, 1995). During this period, the term vrihi was used for rice. The different types of rice recognized
  • 15. A Study on Consumer Preference for Scented Rice in Bangalore City 3 included black (krishnavrihi), white (shukla vrihi), large (mahavrihi), swift-growing (asunamvrihi) and wild (nivara) rice. The Taittiriya Bramhana of Yajurveda (1200 B. C) mentions the use of specific rice as offerings to specific divinities. Mahavrihi rice was offered to Indra, the God of rain and the noblest of Gods; black krishnavrihi to Agni, the God of fire, white shuklavrihi to Aditya, the sun God and wild nivara rice to Brihaspati, the God of speech (Kumar, 1998). By the time of the Atharvaveda, the terms tandula and odana were used respectively for rice and boiled rice. Hayana, the red rice is mentioned in the Satapatha Bramhana of the Atharvaveda, was also offered to indra. In the Buddhist period, the terms Sali and sugandha for rice first appeared in the scripture Vinaya Pitaka and the Charaka Samhita respectively. In his classical Ayurvedic treatise, charaka classified rice into three types- Sali, vrihi and shastika (Kumar, 1998). Later, Susruta identified 43 groups. Groups were differentiated on the basis of morphological characters such as husk, grain and awn colour, grain shape, time of ripening and planting, growth duration and presence of scent. This is evident from the varietal names such as raktasali (red Sali), mahasali (large grained), kalama (large pen- like stem), pandhu (pale awns), mahish (blach husked), rodhrapuspaka (red like the rodhra flower) and dirghashuka (large awned). Scholars such as Charaka and Susruta studied plants and rice varieties in the context of their medicinal value. Mahasali and sugandhika, pramodaka, pundrika and pushpandaka groups were identified as scented (Vidyalankar, 1994). In the 9th century Kashyapiyakrishisukti, one of the earliest treatises fully devoted to agriculture, the philosopher Kashyapa gives an elaborate account of the cultivation method, seed collection and classification of rice varieties (Ayachit, 2002). Kashyapa classified rice into 26 groups with following distinct types: Sali, kalama, vrihi, yava, sambhaka and nivara. Among these, the Sali, kalama, sambhaka and vrihi types had a scented subgroup- long Sali (deergasali) having a sweet flavour, black sambhaka, palasa vrihi (full of flavour) and Kalama (possessing great flavour) (Raychaudhuri, 1964). 1.3 Production Worldwide, paddy crop was estimated at 721 mt during 2011, producing 481 mt of milled rice, while global rice trade was estimated at 34.3 mt, on a milled basis (FAO, 2012). Specific data related to fragrant rice cropping is scarce, although it comes primarily from three countries: India, Pakistan and Thailand (Chaudhary et al., 2003). The USA started cropping of fragrant rice in 1990, but no data is available in this special category on the well documented USDA website. Among the suppliers of the USA Rice Federation, 13 millers are providing aromatic rice. In Asia, Vietnamese and Cambodian fragrant rice is exported to Thailand as coarse rice.
  • 16. 4 Sunil Kumar, M Although scented rice popular in world market are long grained, majority of the Indian indigenous scented rice are small and medium-grained. A large number of land races of these rice are found in Himalayan Tarai region of the state of UP and Bihar of India, indicating that this region is probably the origin of scented rice. India and Pakistan are the countries that hold the patent to produce basmati rice in the world. In 2012, Basmati rice production was 9.5 mt. India accounts for 75 per cent of total basmati rice produced. The remaining 25 per cent is contributed by Pakistan. The Pusa 1121 Basmati rice variety was released for commercial cultivation in 2003. Pusa 1121 is known for its extraordinary length of up to 9.5 mm and unique fragrance, and has since become hugely popular among both farmers and exporters. Today, Pusa 1121 accounts for almost 70 per cent of around 2.6 million hectares of total acreage under basmati rice cultivation in India. In 2012, the major basmati rice producing states were Punjab (27.23 lakh tonne), Haryana (24.26 lakh tonne) and Uttar Pradesh (17.53 lakh tonne). The other states were Uttarkhand, Jammu and Kashmir, Himachal Pradesh and Delhi. Fragrant rice is well-known for its low yield, which produces approximately half that of coarse rice. Consequently the seed industry has sought to improve its yield through crossbreeding of selected strains of promising agronomic traits. Year-after-year, new varieties of fragrant rice are released on the market which are providing better results at the harvesting stage. Stakeholders have also noticed that the fragrance of aromatic rice is becoming lighter. Thus, it is worth considering the possible effect that yield improvements have on aroma. India leads globally in the production and export of Basmati rice, but this variety accounts for less than 2 per cent of the total Indian rice production. It is estimated that India produced approximately 4.25 million metric tonnes of Basmati rice which accounts for 75 per cent of the entire global production of this rice type. Two-thirds of the Basmati rice produced in India is exported. The yield/hectare of Basmati paddy in India is approximately 30 per cent less than the yield/hectare of non-basmati paddy. Basmati is exported across the globe, with a majority of consumers (by volume) in the Middle East, UK and US. The main Basmati varieties grown in India are Basmati 370, Basmati 217, Taraori (Karnal, Local, HBC–19), Haryana Basmati (HKR 228/IET 0367), Mahi Suganda, Dehradun (Type 3), Basmati 386, Ranbir Basmati (IET 11348), and Kasturi (IET 8580). 1.4 Global trade Scented rice constitute a small but special group of rice which are considered best in quality. These rice have long been popular in the orient, and are now becoming more popular in middle east, Europe and the United States. Most of the trade in scented rice is from India, Pakistan and Thailand. Non-scented long and medium grained indicas and short grained japonicas constitute the bulk (79%) of world trade, mainly dominated by
  • 17. A Study on Consumer Preference for Scented Rice in Bangalore City 5 Thailand, USA, Vietnam and Australia. Yet it is the scented Basmati rice of the Indian sub-continent which clinches a premium and gets three-time higher price than high quality non-Basmati types. Bulk of scented rice from India and Pakistan consists of Basmati types, while Thailand is the supplier of Jasmine rice. Globally rice trading is low and accounts for only 7.13 per cent of the rice production. Fragrant rice (mainly basmati and Jasmine) is included in this production and accounts for around 15-18 per cent of the worldwide rice trade. Some new players are interested in entering this premium segment, including the US, Vietnam, and other rice growers and traders (Georges, 2013). Fragrant rice is considered marginal in worldwide trade and largely ignored in well-documented overviews of rice marketing (Baldwin and Childs 2011; FAO 2012; Young and Wailes 2003). Basmati trade increased from 5.2 per cent to 8.3 per cent in all world rice trade from 2003 to 2008, with a record of 2.45 mt, on milled basis. The fragrant rice trade is rather concentrated in a few countries. In 2008, the top five clients of India have a share of 84.9 per cent, of basmati exports from this country, those of Pakistan 68.5 per cent, and those of Thailand 51.7 per cent of Jasmine. Basmati is primarily exported to Saudi Arabia, EU, Kuwait, Union of Arab Emirates and USA, while Jasmine is shipped to China, Hong-Kong, Singapore, USA, EU and Macau. According to GDP per capita, high-quality (grains) fragrant rice is exported to rich countries, whereas fragrant broken grain is often exported to Africa, mainly the Ivory Coast, Senegal and Ghana (Slayton and Muniroth, 2011). The demand for basmati rice has been consistently growing at a compound annual growth rate (CAGR) of 20 per cent driven by a robust growth in its exports as well as domestic consumption. A 5 per cent lower output in 2012-13 has resulted in a demand- supply mismatch for the commodity, thereby pushing the price higher by almost 50 per cent. India is the leading exporter of the Basmati Rice to the global market. The country has exported 37,57,271.44 MT of Basmati Rice to the world for the worth of Rs. 29,299.96 crores during the year 2013-14. The major export destinations were Iran, Saudi Arabia, Iraq, Kuwait and United Arab Emirates (www.apeda.gov.in). The demand for basmati rice has grown at a CAGR of 20 per cent in the past seven years. Around 45 per cent of the basmati rice demand emanates from exports and the balance from domestic consumption. The sharp growth in India’s basmati rice exports over the past five years (25% CAGR) has been underpinned by the inclusion of hybrid varieties (such as Pusa 1121) in the basmati rice category. These hybrid varieties, which are relatively cheaper than the traditional basmati varieties, have fast gained acceptability in the major export markets such as Saudi Arabia and Iran, and thus expanded the market for basmati rice. Global demand for basmati rice emanates majorly from west Asia. The west Asian countries together account for three-fourth of the total basmati rice exports from
  • 18. 6 Sunil Kumar, M India. The demand for basmati rice from these destinations to remain steady, given the insufficient domestic production of rice in these countries, the consistently declining basmati rice exports from Pakistan, their proximity to India and the distinct preference for superior quality basmati rice that has developed in these countries over the past decade. Over the last five years, the Indian basmati rice exports have registered a CAGR of 25 per cent whereas Pakistani rice exports have declined. Thus, India has doubled its share in global basmati exports from 28 per cent to 57 per cent over the period. The incremental global demand for basmati rice is thus being entirely met by increasing exports from India. 1.5 Domestic consumption In addition to India’s growing exports, the domestic consumption of basmati rice is growing at a healthy CAGR of 15 per cent over the medium term, buoyed by the increasing spending power of the middle-income sections of the society. Moreover, the proliferation of the modern retailing format has helped fuel the consumption of a higher quantum of branded products, as Indian consumers are fast embracing the mall culture and organized retail, triggering a shift from unbranded to branded rice and from economy to premium brands. In 2012, the domestic basmati rice market was worth Rs. 10,000 crores (Ajay, 2013). The number of players in the packaged rice market has doubled in the past three years, reflecting the confidence of the new entrants in the future of the packaged rice segment in India. Furthermore, the major existing brands are expanding their distribution network and focusing on their cost structure to cash in on the value-for-money and also the high quality proposition to capture a share of the domestic market, e.g. by splurging on promotional marketing techniques. Such brands include Lal Qilla, Double Diamond Brand Basmati Rice, Hanuman Brand Basmati Rice, RST Brand Basmati Rice, Resham Brand, Tilda Basmati rice, Pari Basmati Rice, Adora Basmati, Daawat Basmati, Kohinoor Basmati, Blue Label Basmati, Lal Haveli Basmati, Doon Basmati, etc. There are many store brands of basmati rice available in the market. These are bought, packaged, and put on the shelves by retailers through their own individual procurement and supply chain systems. Some of the popular private labels are Max Economy, Max Premium, More Pvt. Ltd., Shoprite Pvt. Ltd., Spencer’s Smart Choice Regular, Spencer’s Smart Choice Premium, Nilgiris Pvt. Ltd., Food Bazaar, Metro Pvt. Ltd., Heritage Pvt. Ltd., V Fresh – Vishal Mega Mart, Reliance Select, etc. The domestic consumption of basmati rice is expected to grow at a healthy CAGR of 15 per cent over the medium term, buoyed by the increasing spending power of the middle-income sections of the society. Moreover, the proliferation of the modern retailing format has helped fuel the consumption of a higher quantum of branded products, as Indian consumers are fast embracing the mall culture and organized retail, triggering a shift from unbranded to branded rice and from economy to premium brands.
  • 19. A Study on Consumer Preference for Scented Rice in Bangalore City 7 With this backdrop, a comprehensive study on the consumer preference for scented rice was undertaken with the following objectives. 1.6 Objectives of the study i. To examine the consumer awareness about types and brands of scented rice, ii. To analyze the users preference for scented rice, iii. To identify the factors influencing usage of scented rice and iv. To identify the sourcing of scented rice. 1.7 Scope of the study Scented rice is an important food crop of considerable commercial importance. The changing life styles, rising middle class population, increase in disposable income has resulted in increased consumption of scented rice. The expansion of organized retailing has brought about the increase in scented rice consumption. 1.8 Limitations of the study This study is based on the primary data collected from sample consumers by survey method. Data on different types and brands of scented rice was also gathered. Consumers’ preference and required information was collected and it was subjected to their recall memory and experience. The study area was limited to Bangalore city and the findings may not be generalised to other places, as vast difference exists among the consumers with regard to demographic and psychographic characteristics. 1.9 Presentation of the study The project report is organized into seven chapters. The first chapter provides a brief introduction along with the background of the study, the specific objectives, scope and limitations of the study. The second chapter pertains to the review of literature in consonance with study objectives. The third chapter describes main features of the study area, sampling framework and analytical tools employed. The empirical results are presented in fourth chapter followed by critical discussion about the results of the study in fifth chapter. Sixth chapter summarizes the major findings of the study and practical utility. Finally, seventh chapter covers the list of references quoted in the present study.
  • 20. A Study on Consumer Preference for Scented Rice in Bangalore City 8 II. REVIEW OF LITERATURE 1. Consumer awareness about types and brands of scented rice Hori et al. (1992) conducted a survey on aromatic (scented) rice with 150 people in each capital in Indonesia, Philippines, Korea and Japan in order to ascertain if they are familiar with the rice and prefer the aroma. Many of the subjects in Jakarta and Manila know of aromatic rice, and they often eat it and even prefer it. However, people in Seoul and Tokyo do not knew of the rice. One hundred and seventy-five out of 246 persons (71%) in Kochi, Japan, know of the rice and over 60 per cent of the subjects eat it. Most of the subjects who have eaten aromatic rice prefer the aroma. There is a great difference in the distribution of aromatic rice between East and South-east Asia. Significant differences are also found between Jakarta and Manila in the distribution and preference of rice. Hori et al. (1996) studied the knowledge about aromatic rice and whether they have a preference for the rice in Britain. The people knew of and have a high preference for aromatic rice and have a high frequency of eating the rice, although they do not usually buy or eat aromatic rice and/or ordinary rice. The sensory test showed that the preferences of aroma, taste and overall palatability for plain cooked Basmati (aromatic) rice were almost the same as for long grain (ordinary bland) rice. The aroma and taste of the sushi made of Basmati, however, were given higher scores than those of the sushi made of ordinary bland rice. On the other hand, the Japanese panelists did not give higher scores to the plain rice cooked using aromatic rice and to the sushi made of the rice. However, the sushi made of aromatic rice may be found acceptable by Japanese people. This study shows a possible way of making use of aromatic rice in Japan as well as in Britain. Diako et al. (2010) reported that the consumer perceptions, knowledge and preferences for aromatic rice as a basis for quality improvement of local rice. Results showed that most consumers (94.9%) were more familiar with imported rice and this was reflected in their patronage patterns. Ibitoye, et al. (2014) studied to understand consumers’ awareness towards organic rice in Malaysia. The survey was conducted at major supermarkets in Klang Valley. Data were analysed using descriptive analysis and chi-square analysis using cross- classification techniques, and correlation to determine their relationship, strength and direction of their relationship. The findings showed majority of the respondents (85.6%) have some level of awareness towards organic rice, while only 64.7 per cent planned to consume organic rice in the future. The study indicated that awareness of consumers towards organic rice does not necessarily translated to their planning to consume organic rice. The study also showed that the younger respondents have more concern towards organic rice
  • 21. 9 Sunil Kumar, M 2. Users preference for scented rice Meullenet et al. (2001) studied twenty-one rice samples covering examples of aromatic, long and medium grain, instant, and parboiled products were evaluated by a group of 120 Asian consumers, currently living in the United States and by a professionally trained sensory panel. Results showed that imported Thai Jasmine rice was preferred by this group of Asian consumers over every other rice tested including domestically grown Jasmine rice. The most important acceptance factors for Asian consumers were cooked rice appearance and aroma. Predictive models of rice overall acceptance were evaluated using descriptive sensory evaluation data (i. e. including appearance, flavour and texture attributes). Suwansri et al. (2002) evaluated three domestic and 12 imported commercial Jasmine rice varieties by a trained sensory panel and by 105 Asian families who live in the State of Arkansas. Results showed that consumers preferred imported over domestic products. According to consumers, the sensory characteristics most important to the acceptance of cooked Jasmine rice were, in the order of decreasing importance, colour, flavour, aroma, stickiness, and hardness. Tomlins et al. (2005) studied consumer preference and related sensory attributes with consumer acceptability of rice. The majority of consumers preferred imported raw and parboiled rice to that produced locally. Acceptability was influenced by location and gender. Individual preferences of consumers varied and four different segments of consumers with similar liking of the rice samples were identified. The largest three segments (86% of consumers) preferred the imported rice but differed in their preferences for the local rice. A niche segment (14%) mostly preferred traditional local rice. Al- Hassan (2008) using hedonic price estimation model revealed that consumers of rice in Accra pay highest premiums for taste, aroma and shape. Consumers also pay some premium for smaller percentage broken and scarcity of a type of rice in the market. Suwannaporn and Linnemann (2008) investigated consumer eating quality preferences among consumers in target rice export countries to identify opportunities and strategic implications. A quantitative study with consumers of target nationalities was conducted in combination with focus group discussions. Discriminant analysis was performed to investigate differences in perception between consumers from countries which had different rice grain preference. Result showed that rice texture was the best discriminator. It could correctly predict consumers from nonspecific grain preference, short grain preference and Basmati preference at 63, 71 and 81 per cent, respectively. Walisinghe (2008) assessed consumer preferences for different quality attributes of rice based on conjoint methodology. The appropriate attributes and levels were identified from a focus group discussion and subsequently a conjoint questionnaire was administered using a sample of 185 consumers under a fractional factorial design. ANOVA and part worth utility models were estimated. The relative importance of attributes was calculated using part-worths. ANOVA results indicate that of the four attributes, type, colour and purity were significant, but price was not significant. Part
  • 22. A Study on Consumer Preference for Scented Rice in Bangalore City 10 worth estimates revealed that the purity is the most important attribute when selecting a type of rice. Kim et al. (2009) analyzed consumers' preference of rice brands and suggested a way to reduce the number that stood at about 1700 in the Korean market. With data collected from respondents, a conjoint analysis was conducted to identify consumers' preferences of Korean rice in regard to such aspects as producing area, brand, category, and price. They particularly focused on analyzing the consumers' preference of rice brands, with some scenarios to decrease the number of brands. The paper also estimated the virtual market shares of rice brands, as results of the analyses, the paper showed that the grouping of individual rice brands in a city or county under one representative brand is the most preferred by Korean consumers. Galawat and Yabe (2010) observed that urban consumers prefer rice which has white, purple, long, non-glutinous, aromatic and organic attributes. They also demonstrate to have firm preference for white, long, and organic rice by observing the high amount of MWTP for these attributes. Meanwhile, rural consumers prefer rice which has white, glutinous, sweet and organic attributes. Rural consumers also show strong preference for white, sweet and organic rice by observing the high amount of MWTP for these attributes. Mhlanga (2010) analyzed the relationship between price and product attributes towards consumer’s choice for rice in Benin, using the hedonic pricing approach and discrete choice modeling at the household level. The results of econometric estimation indicated that consumers pay a premium for grain size, aroma, colour, wholeness and cleanliness of grain and convenience attributes across the different regions studied. Consumers (rural and urban) prefer parboiled and imported rice over domestic rice and raw rice. Diako et al. (2010) reported that the reasons for consumers not patronizing locally cultivated rice were, poor post harvest handling, non-availability, and the generally perceived poor quality. The few (29%) who consume local rice do so out of the perception that it is inexpensive and has better nutritional quality. Both cooked and raw attributes of rice influence consumer preference. At the same time the appearance of raw rice (Friedman rank mean = 2.86) was critical to consumers’ choice, while taste and aroma determined consumer preference for cooked rice; being ranked 4.96 and 4.46, respectively. Abdullahi et al. (2011) found that the product attributes such as flavour and aroma, availability, brand name and quality also influence the frequent purchasing of Basmati rice among the Malaysian consumers. However price and easy preparation are not significant in influencing the frequent purchasing of Basmati rice since most consumers are aware that special rice such as Basmati is expensive and all rice has to be prepared in a usual way.
  • 23. 11 Sunil Kumar, M Anang et al. (2011) determined influential factors on consumer preference for various rice brands in the metropolis of Tamale and the quality characteristics which affect prices. One hundred (100) respondents were randomly sampled and interviewed using a semi-structured questionnaire. The Kendall’s coefficient of concordance was used to determine the factors that influence consumer preference. The hedonic price model was used toanalyze the effect of these preferences on price. The attributes that define the quality of rice most preferred by consumers were taste, cooking quality, cooking time and aroma. The attributes least preferred by consumers were price, impurities (presence of foreign matter) and the source of rice. The hedonic price model showed that the consumer paid higher premiums for aroma and source of rice (local or foreign). Musa et al. (2011) indicated that rice attributes such as flavour, taste of cooking, price, and location also affect their choices of the brands available in the market. The majority of the consumers however, preferred to purchase local white rice instead of those imported from overseas. Hanis et al. (2012) study used conjoint analysis and revealed that the most important attribute for rice was food safety, followed by taste and size of grain. Consumers were also willing to pay premium prices for the demanded attributes. The findings would have positive implications for the agrifood industry if it responds effectively to translate into business opportunities to these changes. Seila et al. (2012) used cross-sectional survey of 250 Cambodian households across agro-climatic zones to understand rice production and consumption behaviours. The results highlight diversity in varieties of rice grown and consumed, a continuing preference for traditional varieties, and a high level of awareness of rice varieties. Most households purchased rice from the market, and price was a major factor in choosing rice, in addition to taste, texture, swelling capacity, and aroma. Maxwell et al. (2013) found that consumers perceived grain colour, absence of foreign material, fragrance and cooking behaviour as important. Grain length and shape, translucence or chalkiness of grain, per cent brokenness and expansion ratio were not as important to consumers as the former four qualities. They preferred imported rice to locally-produced rice because of the absence of foreign matter, better grain appearance, better cooking quality and presence of fragrance. They did not think that “ease of availability” was a significant (p = 0.098) reason for their preference for imported rice. Imported rices sold on the Ghanaian markets are predominantly U.S. conventional long grain (long grain, intermediate amylose, intermediate gelatinization temperature) and Jasmine-styled (long grain, low amylose content, low gelatinization temperature and fragrance) rices from Asia. Gurung (2013) using Ordinary Least Squares (OLS) analysis and empirically found that there exists some relationship between price paid by consumers and the characteristics of the rice. The study found that Bhutanese prefer paying a premium for whiteness, less foreign materials, less broken rice and stickiness for imported rice while
  • 24. A Study on Consumer Preference for Scented Rice in Bangalore City 12 reddish colour of local rice and cohesion are significant determinants while purchasing domestic rice. Oyinbo et al. (2013) determined consumption preference between imported rice and locally produced rice by households in Kaduna state and the factors that influenced the households’ consumption preference between the two. Primary data obtained from a sample of 310 household heads with the aid of structured questionnaire were employed in this study and the data were analysed using descriptive statistics and logit regression analysis. The results of the data analysis indicated that 75 per cent of the sampled households’ preferred imported rice to local rice and the factors that significantly influenced the households rice consumption preference are quality of rice (p<0.01), ease of preparation (p<0.1), price of rice (p<0.1), frequency of rice consumption (p<0.1) household size (p<0.1) and household income (p<0.05). Rose et al. (2013) assessed the effect of consumer purchasing criteria for types of rice in Togo using choice modeling. the results highlighted the features like cleanness, whiteness and taste as the first, second and third purchasing criteria respectively for non- parboiled imported rice while the choice of non-parboiled local rice was based on taste, swelling capacity and, again, taste as the first, second and third selection criteria, respectively. These results were reinforced by using a random utility model to perform the consumer utility analysis and their willingness-to-pay for the most important purchasing criteria of rice types. Sampson (2013) analyzed the consumer preference for rice consumption in Ghana with the aim to study which attributes of rice consumers valued. The specific methodological approach employed was Choice Experiment (CE) Technique which is used to evaluate non-market goods by eliciting people`s stated preference for different options in a hypothetical setting. The study also involved consumer Willingness to Pay (WTP), which is defined as the maximum value of money that an individual contributed to equalize utility. The findings suggested that the most important attribute for rice was food safety, followed by aroma and length of grain. Consumers were willing to pay premium prices for the demanded attributes. Sudha et al. (2013) studied consumer acceptance of unmilled brown and undermilled rice among urban south Indians. A 7-point hedonic scale was used to rate consumer preferences. Consumers reported that the colour, appearance, texture, taste, and overall quality of the 4.4 per cent polished rice was strongly preferred in both varieties and forms. Ratings for zero per cent polished (brown rice) were substantially lower than those of 2.3 per cent polished rice, which were intermediate in ratings between zero per cent and 4.4 per cent polishing. However, most of the consumers (93%) expressed a willingness to substitute brown or 2.3 per cent polished rice, if affordable, after the taste tests and education on nutritional and health benefits of whole grains.Though most consumers’ preferred polished white rice, education regarding health benefits may help this population switch to brown or undermilled rice. Cooking quality and appearance of the grains were perceived as the most important factors to consider when purchasing rice among Chennai urban adults.
  • 25. 13 Sunil Kumar, M Gideon et al. (2014) examined the determinants of consumer preference for domestically processed rice and identified some of the constraints inhibiting the consumption of local rice in the Tamale metropolis. Logistic regression model and Kendell’s coefficient of concordance were used to analyze the determinants of consumer preference for domestic rice and some of the factors inhibiting the patronage of local rice respectively. The key variables influencing consumers preference for local rice includes; age, household size, monthly expenditure on food and taste. The results also indicated that about 65 percent of the respondents agreed that poor packaging of local rice is the number one factor inhibiting the patronage of local rice. There is therefore an urgent need to invest into the development and deployment of rice varieties to improve its taste. Local rice processors should also worked at improving the packaging to make it competitive in the market. Lara (2014) conducted a consumer survey for preference for quality rice in the greater area of Bangkok, Thailand based on Best-Worst Scaling with 300 sample respondents. The aggregate analysis revealed health, safety, origin and texture were most preferred rice attributes. Further, from latent class analysis it is found that 36.50 per cent trusted in Thai quality and brands, 23.50 per cent considered rice as a staple food, and 40 per cent of the consumers were health and sustainability lovers. 3. Factors influencing usage of scented rice Al-Hassan et al. (2008) observed that consumer preferences for quality characteristics of rice in Accra had specific effects on the price of rice. Statistical analysis of the relationship between income and education of consumers and the quality of rice they prefer revealed a significant relationship between income and education on shape and aroma. Suwannaporn and Linnemann (2008) conducted quantitative study with 1128 consumers of target nationalities were conducted in combination with focus group discussions. Factor analysis of consumers’ buying decision criteria yielded four factors: marketing activities (explained variance 26.8%), quality (13%), price (10.5%), and country of origin (7.7%). Berta et al. (2009) examined importance of origin in rice purchasing decisions in Talca and Temuco, Chile. Using a conjoint analysis and hierarchical clustering, five market segments were distinguished. The largest group (35.4%) gave great importance to the origin of the rice. The second largest group (25.1%) gave greater relevance to the packaging. For the third and fourth largest groups (15.4 and 12.5%, respectively), the cost of the product was the most important attribute. The smallest group (11.6%) gave slightly higher importance to the origin of rice than the other attributes. Only this final group preferred imported rice. Onwuka et al. (2009) examined the socio-economic factors influencing foreign rice consumption in Ikwuano and Umuahia North local government areas of Abia state. A total of 93 rice consumers were selected across the two local government areas using the
  • 26. A Study on Consumer Preference for Scented Rice in Bangalore City 14 simple random technique. The socio-economic characteristics were analyzed using descriptive statistic such as percentages and frequencies. The ordinary least square (OLS) model of multiple regression technique was used to analyze the consumption functions of rice consumers. From the results obtained, it was revealed that the price of commodity, price of substitute, Household size, frequency of consumption, and educational status were significant and positively related to foreign rice consumption in the study area. The economic implication is that foreign rice has become an essential commodity whose demand is not easily decreased by the decrease or rise in its price or price of its substitute, household size and its frequency of consumption in study area. Fakayode et al. (2010) studied using a two stage sampling technique which was used to survey 110 rice consumer households across two villages and six towns in Kwara State. Analytical tools used in the study include descriptive statistics and the multinomial logit model. The major factors that significantly influence household preferences for either a combination of local and imported rice or the imported rice only to the local rice were the income of the head of household, household size and the educational status of the heads of household. The price per unit kilogramme of rice, however, was not a significant factor. Kassali et al. (2010) analysed the determinants of demand for rice in Ife Central Local Government Area of Osun State, Nigeria. The objectives of the study were to analyze the determinants of demand for rice, identify the various rice brands that are mostly consumed and determine the nature of the relationship of other foods items to rice selected. A random sampling procedure was used to select one hundred respondents from the area. The findings revealed that price of rice, income of household head, price of substitute good like yam and beans, and size of household have significant influence on the demand for rice in the area. Various rice brands are consumed in the area but those that are largely consumed are Tomato, Caprice, Royal Umbrella, Mama Africa, and Rice Land brands of rice. Of all the staple foods declared by the respondents as substitutes to rice, only yam and beans were positively significant and hence, these are substitutes to rice in the area. Mhlanga (2010) concluded that the socioeconomic factors are not important in consumer purchasing decisions. Country of origin was found to influence rice preference indirectly through perceived quality. The results from this study suggested that both domestic and imported rice varieties have positive and negative implicit prices. This emphasizes the importance of quality based attributes in future breeding programs to make domestic rice more competitive to imported rice. Abdullahi et al. (2011) investigated that socio-demographic factors and product attributes affecting purchase decision of special rice by Malaysian consumer. The primary data were analyzed by using binary logit model. Demographic factors and consumer preference for special rice (with reference to basmati rice) attributes were identified to affect purchasing behaviour for special rice. Size of household, marital status, number of children, household income and gender of consumers were the main
  • 27. 15 Sunil Kumar, M socio-demographic factors that significantly influenced households’ choices of special rice for home consumption in the Klang Valley area. Emodi and Madukwe (2011) analyzed the influence of socio economic attributes of rice consumers on rice consumption in Southeast Nigeria. Eighty (80) rice consumers were purposively selected from four purposively selected states in Southeast Nigeria. Information was collected using questionnaire and interview schedule. The data analysis was done using descriptive statistics and four functional forms of multiple regression models. Findings indicated that women and youths were more involved in rice consumption than their male counterparts. It was also observed that sex, age, marital status, education and household size were statistically significant in influencing consumers’ decision to consume rice in the study area. Musa et al. (2011) examined the determinants affecting the consumer’ purchasing behaviour for rice in Malaysia. From the analysis it is found that the variables of great importance that affect the purchasing behaviour were marital status, gender, age, occupational status of head and household number. Supakornchuwong and Suwannaporn (2012) investigated the beliefs and attitudes in four target European countries toward rice compared with their typical main starchy foods (e.g., potatoes and pasta) in order to ascertain the possibility of rice serving as a substitute. A quantitative questionnaire was designed to assess consumer attitudes toward rice, potatoes and pasta with respect to taste, health aspects, price, calorie content, harmful substances, trustworthiness, digestibility, allergenicity and perceived specialty food. Attitudes about rice's taste, health benefits and low price were among the highest, whereas its specialty received the lowest ratings. Rice was rated more positively than potatoes and pasta for almost every attitude. Consumers' intentions to increase rice consumption in the near future were significantly associated with perceptions regarding four attributes of rice: good taste, healthfulness, low calorie content and specialty. Agbogo et al. (2013) evaluated the factors affecting rice consumption in Cross River State of Nigeria. Two hundred and forty rice consumers were randomly selected from twelve purposively selected Local Government Areas in Cross River State. It was discovered that the socio-economic variables that affect rice consumers in the study area were age, marital status, household size, religion and educational level. The variables included rice consumers disposable income, occupational status of the consumers, joint effect of income and occupational status, brand of rice, price of rice and the joint effect of rice brand and own price. The results showed that disposable income variable had a magnitude of 0.352 and was positive, brand had a magnitude of 0.378 and was equally positive, price had a negative magnitude of –0.121, occupational status variable had a positive magnitude of 0.372, while the joint effects of income and occupational status and rice brand and own price were 0.243 and 0.131, respectively. The implication of the results is that any one unit change in income, occupational status of the rice consumers, brand and price in the study area will result in an increase of 0.352, 0.372, 0.134 and - 0.121 units, respectively.
  • 28. A Study on Consumer Preference for Scented Rice in Bangalore City 16 Ayinde et al. (2013) carried out to a study to determine the consumption pattern of Ofada rice among civil servants in Abeokuta metropolis of Ogun State with a view to identifying the various factors that affect Ofada rice consumption among the respondents in the study area. A total of 60 respondents were selected from six randomly selected ministries in the metropolis. The study revealed that household monthly expenditure on Ofada rice increases with increase in household monthly income, household size and household expenditure on food. Zhigang et al. (2013) investigated consumers’ awareness and acceptance of the Japanese rice in Beijing area using 400 consumers through face-to-face interview in supermarkets during the period 2008-09. The results obtained from the survey showed that consumers had relatively low cognition and acceptance on Japanese rice and only 14.8 per cent of the respondents had purchasing experience on Japanese rice. Although Japanese rice maintained high quality property, high price, lack of purchasing motivation, and sufficient and satisfying rice supply from domestic market obstructed the good sales record of Japanese rice in China. The bivariate probit model results showed that consumer’s gender, education level, monthly expense on foods, and time pressure significantly positively affected the consumers’ cognition level on Japanese rice, while consumers’ age and quantity concern degree negatively and significantly affected their awareness. As far as the purchasing behavior of consumers on Japanese rice, consumer’s gender, education level, family size, quantity and nutrition concern degree significantly and positively affected the consumers’ purchasing behavior on Japanese rice, while their monthly expense on food and quality concern degree negatively affected their purchase significantly. Oyinbo (2014) undertook a research to determine consumption preference between imported rice and locally produced rice by households in Kaduna State, Nigeria and found factors that influenced the households’ consumption preference between the two types of rice, obtained from a sample of 310 household heads with the aid of structured questionnaire. The data were analysed using descriptive and inferential statistics. The results of the data analysis revealed that 75 per cent of the sampled households’ preferred imported rice to local rice and the factors that significantly influenced the households rice consumption preference are quality of rice (p<0.01), ease of preparation (p<0.1), price of rice (p<0.1), frequency of rice consumption (p<0.1) household size (p<0.1) and household income (p<0.05).
  • 29. A Study on Consumer Preference for Scented Rice in Bangalore City 17 III. METHODOLOGY The study was carried out to analyze the consumer preference for scented rice. This chapter presents a brief description of the methodology used in the study under the headings indicated below. 3.1 Selection and description of the study area 3.2 Sampling procedure 3.3 Collection of data 3.4 Analytical tools and techniques employed 3.1 Selection and Description of the Study Area 3.1.1. Selection of the study area Bangalore, the capital of Karnataka is one of the fastest growing cosmopolitan metropolis of India. It is the IT and BT hub of India, with industrial estates and numerous financial and educational institutions. People of different religions, castes, occupation, culture, speaking diverse languages and of different food preferences reside here. Hence, Bangalore was selected for the study. 3.1.2. Description of the study area Bangalore is located on the Deccan Plateau in south-eastern Karnataka; with an estimated metropolitan population of 10 million, making it India's third-largest city and fifth-largest metropolitan. Over the years, Bangalore has evolved into a manufacturing hub for public sector heavy industries-particularly aerospace, telecommunications, machine tools, heavy equipment, space and defense. The establishment and success of business software service firms in Bangalore after the liberalization of India's economy has led to the growth of India's information technology industry. It is referred to as the Silicon Valley of India and accounts for 35 percent of India's software exports. Home to prestigious colleges and research institutions, the city has the second-highest literacy rate among the metropolitan cities in the nation. Bangalore is known as the Garden City of India because of its climate, greenery and the presence of many public parks. Bangalore is situated in the south-east part of Karnataka at an average elevation of 920 meters (3018 feet). It is positioned at 12.97° N 77.56° E and covers an area of 2190 km. Bangalore District borders with Bangalore Rural and Chikkaballapura District in the northeast, Tumkur District in the northwest, Ramanagar District in the southwest and the neighboring state of Tamil Nadu in the southeast.
  • 30. 18 Sunil Kumar, M Bangalore has a large number of lakes. Of these Sankey lake, Ulsoor lake and Yediyur lake being the major ones. Because of its elevation, Bangalore enjoys a pleasant and unflappable climate throughout the year. The highest temperature recorded is 39°C (102°F) and the lowest is 11°C (52°F). The wettest months are August, September and October; with a heaviest rainfall of 180 mm recorded in 24-hour period. Bangalore is the 3rd most populous city in India and the 27th largest city in the world by population. With a decadal growth rate of 38 per cent, it is the fastest-growing Indian metropolis. Bangalore's population with an overall literacy rate of 83 per cent is the second highest for an Indian metropolis, after Mumbai. The city's workforce structure is predominantly non-agrarian, with only 6 per cent of Bangalore's workforce being engaged in agriculture-related activities. 3.2. Sampling procedure Data regarding the consumer preference for scented rice was collected using pre- tested structured schedule. Purposive sampling method was adopted to select the respondents. The sampling was done in different localities of Bangalore city. A total of 40 consumers were interviewed. In order to study sourcing of scented rice 20 retailers and 20 hoteliers were also interviewed. 3.3. Collection of data Primary data regarding socio-economic characteristics like household size, age, income, education, consumer’s awareness about different types of scented rice, consumer’s preference for different attributes of scented rice, purchasing pattern were collected by personally interviewing the consumers using pre tested structured schedule. Secondary data regarding different types and brands of rice was collected from various published reports and websites. 3.4. Analytical tools and techniques employed Detailed description of the analytical tools employed in the study is given below. 3.4.1. Descriptive Statistics These are used to describe the basic features of the data gathered from various sources. They provide simple summaries about the sample and percentage is used in the study. 3.4.2. Factor analysis Factor analysis is a multivariate technique in which, most commonly employed factor analytic procedures in marketing applications are principal and common factor
  • 31. A Study on Consumer Preference for Scented Rice in Bangalore City 19 analysis. The major objective to employ this analysis is to determine the variables which influence the consumer’s buying decision for scented rice. Principal component analysis can accommodate a large number of variables and reduce the information to a convenient size. The inter-relationship among a set of many inter- related variables are examined and represented in terms of a few underlying factors or dimensions that explains the correlation among a set of variables. This assumes that the observed variables are linear combinations of some underlying source variables, which are known as factors. The factor analysis program uses the correlation matrix as input to identify interrelations between variables. Using those correlations one can see what information and hypotheses can be obtained. Factor loadings provide the correlation between the variable and the underlying dimension. The product of corresponding factor loadings can obtain the correlation between any two variables. Since the objective of the factor analysis is to represent each of the variables as linear combination of the smaller set of factors, we can express this as X1= λ11F1+ λ12F2+…+ λ1m Fm+ e1 X2= λ21F1+ λ22F2+…+ λ2m Fm+ e2 … … … … … … … … … … … … Xn= λn1F1+ λn2F2+…+ λnm Fm+ en Where, X1to Xn=Standardized scores F1-Fn= Standardized factor scores λ11- λmn=Factor loadings e1- en=Error variance The maximum number of factors possible is equal to the number of variables. However, small number of factors by themselves may be sufficient for retaining most of the information on the original variables.
  • 32. 20 Sunil Kumar, M 3.4.3 Best-worst scaling The design in both studies was adopted from Finn and Louviere (1992), which contains 14 sets of choices. The design ensures that each rice attribute appeared 4 times across all the choice sets. The level of importance for each choice was determined by subtracting the number of times the wine was least important (worst) from the number of times it was most important (best) in all choice sets. The level of importance of each attribute depends on the number of respondents and in the frequency that each attribute appears in the choice sets. Hence, the level of importance of a particular attribute was transformed to a standard score. The reason for standardization is to allow comparison between different groups of respondents, where the number differs in each collection. Count (Best) – Count (Worst) Standard score = ----------------------------------- 4n Where, Count (best) = total number of times an attribute was most important Count (worst) = total number of times an attribute was least important n is the number of respondents and 4 is the frequency of the appearance of each attribute in the design.
  • 33. A Study on Consumer Preference for Scented Rice in Bangalore City 21 IV. RESULTS The results of the analysis carried out for fulfilling the objectives of the study are presented under the following headings: 4.1. General profile of the consumers 4.2. Consumer awareness about scented rice 4.3. Consumer preference for scented rice in Bangalore city 4.4. Factors influencing consumption of scented rice in Bangalore city 4.5. Sourcing of scented rice by retailers and hoteliers in Bangalore city 4.6. Major scented rice brands in Bangalore city 4.1. General profile of the consumers 4.1.1. Socio-economic profile of the consumer Socio-economic profile of the consumers who were using scented rice are presented in Table 4.1. Most of them (45%) belong to the age group of 20-30 years. It was followed by age groups 31-40 years (40%), 41-50 years (10%) and more than 50 years (5%). The literacy level of scented rice consumers were analysed and found that 70 per cent of them are graduates, followed by 22.50 per cent of consumers had studied up to pre-university and 5 per cent consumers studied up to high school. Only 2.50 per cent had Primary education. The family size of the consumers were grouped and found that family size of 1-2 persons accounts for 10 per cent. The family size 2-5 and >5 were 67.50 per cent and 22.50 per cent respectively. The grouping of the consumers based on household income revealed that 6 consumers fall under the income group of Rs.10,000-Rs.20,000 followed by 7 consumers having income range of Rs.20,001-Rs.30,000. The consumers having income range of Rs.30,001-Rs.50,000 was found to be 14. The remaining 13 consumers were grouped under the income range of more than Rs.50,001. 4.1.2. Profile of the purchase decision maker The profile of the purchase decision maker is shown in Table 4.2. The table shows that the decision to buy scented rice is taken mostly by wife (47.50%), followed by husband (25%), mother (15%) and father (12.50%). The buying decision makers were grouped age wise. Majority of them (42.50%) belonged to the age group of 41-500 years. It was followed by age group 31-40 years (22.50%), 20-30 years (12.50%) and more than 50 years (22.50%).
  • 34. 22 Sunil Kumar, M Table 4.1. Socio-economic profile of the consumers in Bangalore city Sl. No Category No. of consumers Percentage to the total 1. Age (years) a) 20 to 30 18 45.00 b) 31 to 40 16 40.00 c) 41 to 50 4 10.00 d) More than 50 2 05.00 Total 40 100.00 2. Gender a) Male 33 82.50 b) Female 7 17.50 Total 40 100.00 3. Education a) Primary 1 02.50 b) High school 2 05.00 c) Pre-university 9 22.50 d) Degree 28 70.00 Total 40 100.00 4. Profession a) Professionals 19 47.50 b) Govt. Employee 17 42.50 c) Self employed 4 10.00 Total 40 100.00 5. Family size (number) a) 1 to 2 4 10.00 b) 2 to 5 27 67.50 c) More than 5 9 22.50 Total 40 100.00 6. Monthly income (Rs.) a) 10,000 to 20,000 6 15.00 b) 20,001 to 30,000 7 17.50 c) 30,001 to 50,000 14 35.00 d) More than 50,001 13 32.50 Total 40 100.00 7. Marital status a) Married 30 75.00 b) Unmarried 10 25.00 Total 40 100.00 8. Food habit a) Vegetarian 20 50.00 b) Non-vegetarian 20 50.00 Total 40 100.00
  • 35. A Study on Consumer Preference for Scented Rice in Bangalore City 23 Table 4.2. Profile of buying decision maker in Bangalore city Sl. No Category No. of consumers Percentage to the total 1. Decision maker a) Husband 10 25.00 b) Wife 19 47.50 c) Mother 6 15.00 d) Father 5 12.50 Total 40 100.00 2. Age (years) a) 20 to 30 5 12.50 b) 31 to 40 9 22.50 c) 41 to 50 17 42.50 d) More than 50 9 22.50 Total 40 100.00 3. Education a) Primary 2 5.00 b) High school 10 25.00 c) Pre-university 8 20.00 d) Degree 20 50.00 Total 40 100.00 4. Profession a) Homemaker 20 50.00 b) Professional 18 45.00 c) Retired 2 5.00 Total 40 100.00
  • 36. 24 Sunil Kumar, M The education level of buying decision makers was found that 50 per cent of them were graduates, 25 per cent were high school, 20 per cent of them were pre-university and 5 per cent of them studied up to primary. The profession of the buying decision maker was analysed and found that 50 per cent were homemakers, 18 per cent professionals and 5 per cent were retired. 4.2. Consumers awareness about scented rice in Bangalore city 4.2.1. Consumers awareness about different types of scented rice Consumers’ awareness about different types of scented rice is shown in the Table 4.3. The table revealed that all the sample consumers were aware of Basmati rice. Kalijira rice was known to 27.50 per cent consumers. 7.50 per cent of consumers were aware of Gandhasale and Jasmine rice. Brown rice and Ambemohar were known by 5 per cent and 2.5 per cent of consumers, respectively. 4.2.2. Frequency of consumption of scented rice Frequency of consumption of scented rice is furnished in the Table 4.4. The table revealed that most consumers consumed scented rice monthly once (32.50%) followed by whenever needed (27.50%). The table also showed that consumers used scented rice weekly (17.50%), fortnightly (12.50%) and whenever needed (10%). 4.2.3. Food prepared by consumers using scented rice Different type of food is being prepared by the vegetarian consumers using scented rice is presented in the Table 4.5. The table revealed that most prepared food item was Pulao (35%), followed by plain rice (27.50%), Kheer (10%), Biriyani (5%), Ghee rice (2.50%) and Kesari bath (2.5%). Different type of food prepared by the non-vegetarian consumers using scented rice is presented in the Table 4.6. The table pointed that the most consumers prepared Biriyani and Pulao in equal proportions (40%). Consumers also prepared plain rice (25%), Kheer (20%), and ghee rice (5%). 4.2.4. Consumers purchase pattern of scented rice 4.2.4.1. Quantity purchased by consumer Quantity purchased by the sample consumers were shown in the Table 4.7. The table revealed that most (37.50%) consumers purchased 1 to 2 Kg of scented rice per month, followed by 0.5 to 1 Kg (35%), 2 to 3 Kg (15%), 3 to 4 Kg (7.50%) and 4 to 5 Kg (5.00%).
  • 37. A Study on Consumer Preference for Scented Rice in Bangalore City 25 Table 4.3. Awareness of consumers about different types of scented rice Sl. No Type of scented rice No. of consumers Percentage 1. Basmati 40 100 2. Jasmine 3 7.50 3. Kalijira 11 27.50 4. Gandhasale 3 7.50 5. Ambemohar 1 2.50 6. Brown rice 2 5.00 Table 4.4. Frequency of consumption of scented rice in Bangalore city Sl. No Frequency No. of consumers Percentage to the total 1. Weekly 7 17.50 2. Once in a Fortnight 5 12.50 3. Once in a Month 13 32.50 4. No regular pattern 11 27.50 5. On special occasions 4 10.00 Total 40 100.00
  • 38. 26 Sunil Kumar, M Table 4. 5. Food prepared by vegetarian consumers using scented rice in Bangalore city Sl. No Food Item No. of consumers percentage 1. Plain rice 11 27.50 2. Kheer 4 10.00 3. Biriyani 2 5.00 4. Pulao 14 35.00 5. Ghee rice 1 2.50 6. Kesaribath 1 2.50 Table 4.6. Food prepared by non-vegetarian consumers using scented rice in Bangalore city Sl. No Food Item No. of consumers Percentage 1. Plain rice 10 25.00 2. Kheer 8 20.00 3. Biriyani 16 40.00 4. Pulao 16 40.00 5. Ghee rice 2 5.00
  • 39. A B C D E Fig. 1 Types of scented rice. A. Basmati, B. Brown rice, C. Gandhasale D. Kalijira, E. Jasmine rice
  • 40. A Study on Consumer Preference for Scented Rice in Bangalore City 27 4.2.4.2. Type of store where consumers purchase scented rice The type of store from which consumers purchased scented rice for was found to be Provision stores (22.50%), Convenience stores (12.50%), supermarket (47.50%) and hypermarket (17.50%). 4.2.4.3. Price paid by the consumers for scented rice The price paid for scented rice by consumers is shown in the Table 4.7. It was found that 60 per cent of consumers paid 50-100 Rs. /Kg and 40 per cent consumers paid more than 100 Rs./Kg. Most of the consumers bought branded scented rice (87.50%). Only few consumers bought unbranded scented rice (12.50%). 4.3. Consumer preference for scented rice in Bangalore City The consumer preference level for different attributes of scented rice in Bangalore city is furnished in Table 4.8. The attributes Aroma (0.387), price (0.381), taste (0.375), grade (0.281), cooking time (0.212), brand (0.062), after cooking grain size (0.019) of scented rice were most preferred in the decreasing order of their preference. The attributes impurities (-0.512), texture (-0.356), stickiness (-0.200), broken grain (-0.193), after cooking shelf life (-0.190), age of rice (-0.119), ease of cooking (- 0.075), grain size (-0.056) and colour (-0.051) were the least preferred attributes of scented rice in the increasing order of their preference. 4.4. Factors influencing consumption of scented rice in Bangalore city The rotated factor matrix loadings for identified factors are presented in Table 4.9. This helps in identification of the variables that have large factor loadings on the same factor. That factor interpreted in terms of variables that load high on it. It can be seen from the table that the four factors contained seven, two, three and two variables. Factor 1 represented the effect of publicity on buying behaviour of scented rice consumers. Factors 2 captured the influence of financial status of consumers on buying behaviour of scented rice consumers. Factor 3 is highly related culture’s influence of consumers on buying behaviour. Finally, factor 4 represented the effect of education and availability of scented rice on buying behaviour of scented rice by consumers. The table revealed that in publicity factor retailers (0.780), friends (0.672), advertisements (0.666), nutritive value (0.765), and country of origin (0.796) were the significant variables. Offers (0.493) and marital status (0.491) of the consumers were not significant. In financial status, income (0.931) of consumers and price (0.927) of scented rice were significant. In cultural factor, taste (537), festivals (0.855) and traditions (0.711) were significant. In education factor, availability (0.769) and education (0.640) were significant.
  • 41. 28 Sunil Kumar, M Table 4.7. Consumers’ monthly purchase pattern of scented rice in Bangalore City Sl. No Category No. of consumers Percentage to the total 1. Quantity (Kg) a) 0.5 to 1 14 35.00 b) More than 1 to 2 15 37.50 c) More than 2 to 3 6 15.00 d) More than 3 to 4 3 7.50 e) More than 4 to 5 2 5.00 Total 40 100.00 2. Type of store a) Provision stores 9 22.50 b) Convenience stores 5 12.50 c) Super market 19 47.50 d) Hyper market 7 17.50 Total 40 100.00 3. Price (Rs./Kg) a) 50 to 100 24 60.00 b) More than 100 16 40.00 Total 40 100.00 4. Branded/Unbranded a) Branded 35 87.50 b) Unbranded 5 12.50 Total 40 100.00
  • 42. A Study on Consumer Preference for Scented Rice in Bangalore City 29 Table 4.8. Consumers’ preference for various attributes of scented rice in Bangalore city Sl. No Attributes Best count Worst count Best-worst score Standard score 1. Aroma 81 19 62 0.387 2. Price 80 19 61 0.381 3. Taste 77 17 60 0.375 4. Grade 60 15 45 0.281 5. Cooking time 53 19 34 0.212 6. Brand 58 48 10 0.062 7. After cooking grain size 17 14 3 0.019 8. Colour 32 40 -8 -0.050 9. Grain size 31 40 -9 -0.056 10. Ease of cooking 30 42 -12 -0.075 11. Age of rice 12 31 -19 -0.119 12. After cooking shelf life 22 52 -30 -0.190 13. Broken grain 14 45 -31 -0.193 14. Stickiness 11 43 -32 -0.200 15. Texture 3 60 -3 -0.356 16. Impurities 7 89 -82 -0.512
  • 43. 30 Sunil Kumar, M Table 4.9. Factors influencing buying decision of scented rice by consumers in Bangalore city Sl No Factors Publicity Financial status Culture Availability 1. Taste -0.083 0.131 0.537 0.524 2. Education 0.299 -0.165 0.114 0.640 3. Availability 0.057 0.295 -0.071 0.769 4. Offers 0.493 0.492 -0.296 0.478 5. Retailers 0.780 0.277 -0.266 0.168 6. Friends 0.672 0.165 0.110 0.280 7. Advertisements 0.666 0.378 0.182 -0.277 8. Price 0.136 0.927 0.272 0.068 9. Festivals 0.078 0.189 0.855 0.121 10. Traditions 0.263 0.270 0.711 -0.111 11. Nutritive value 0.765 0.038 0.332 -0.036 12. Marital status 0.491 -0.215 0.348 0.465 13. Country of origin 0.794 -0.039 0.083 0.278 14. Income 0.142 0.931 0.202 0.078
  • 44. Fig 2: Consumer preference for various rice attributes in Bangalore city -0.6 -0.5 -0.4 -0.3 -0.2 -0.1 0 0.1 0.2 0.3 0.4 0.5 Preferencelevel Rice attributes
  • 45. A Study on Consumer Preference for Scented Rice in Bangalore City 31 4.5. Sourcing of scented rice by retailers and hoteliers in Bangalore city In order to document the source of procurement of scented rice, the 20 retailers were interviewed. Among them 10 provision stores, 5 Convenience stores and 5 supermarkets/hypermarkets were selected (Table 4.10). On interviewing the provision store owners, they were procuring scented rice from wholesalers. The owners of convenience stores procured scented rice from distributors/stockists. The supermarket/hypermarket procured scented rice from their respective distribution centres. In order to document the source of scented rice of hoteliers a sample of 20 were selected. In the sample 15 of them were procured scented rice from wholesalers, 2 of them were procured scented rice from distributors and 3 of the hoteliers were not using any scented rice. 4.6. Major brands of scented rice in Bangalore city The major Basmati rice brands India is furnished in Table 4.11. The table indicates that there are ten different companies selling basmati rice with thirteen brands in India. Further, the details of the other scented rices presented in Table 4.12 and they are Kalijira, Jasmine, Gandhasale and Brown rice. Kaliira rice was sold by four companies with four different brands. The Jasmine rice imported from Thaitan Foods International Co. Ltd. and sold by brand name Real Thai. The Gandhasale rice was sold by Pristine Organics Pvt. Ltd with Pristine brand. The brown rice was sold by LT foods with the brand Dawat.
  • 46. 32 Sunil Kumar, M Table 4.10. Procurement of scented rice by retailers in Bangalore city Sl No. Type of store Procured from No of respondents 1. Provision store Wholesalers 10 2. Convenience stores Distributors 5 3. Super markets/hypermarkets Distribution centres of respective retail chain 5 Table 4.11. Major brands of Basmati rice in Bangalore city Sl. No. Company Brands 1. KRBL India Gate, Doon 2. Kohinoor Foods Kohinoor, Charminar 3. LT Foods Daawat, Heritage 4. REI Agro Raindrop 5. Chamanlal Seta Exports Maharani 6. Amira Foods Amira 7. Sunstar Overseas Hello 8. Best International Best 9. Deva Singh Sham Singh 817 elephant 10. Corporate retail chains Store brands Source: Horizon Research Table 4.12. Other brands of scented rice in Bangalore city Sl. No Type of rice Company Brands 1. Kalijira Mother’s Choice Nawab Bigbasket BB Royal Halt Halt Corporate Retail chains Store Brands 2. Jasmine Thaitan Foods International Co. Ltd. Real Thai 3. Gandhasale Pristine Organics Pvt. Ltd Pristine 4. Brown rice LT Foods Dawat
  • 47. Fig. 3 Major brands of Basmati rice available in Bangalore city
  • 48. Fig. 4 Kalijira rice brands available in Bangalore city Fig. 5 Jasmine rice brand Fig. 6 Brown rice brand in Bangalore city in Bangalore city Fig. 7: Gandhasale Rice brand in Bangalore city
  • 49. A Study on Consumer Preference for Scented Rice in Bangalore City 33 V. DISCUSSION Results of investigation presented in the previous chapter were discussed and drawn inferences in this chapter under the following headings. 5.1 Socio economic status of scented rice consumer 5.2 General profile of buying decision maker 5.3 Consumers awareness about scented rice in Bangalore city 5.4 Frequency of consumption and food prepared by consumers 5.5 Consumers’ purchase pattern of scented rice in Bangalore city 5.6 Consumer preference for scented rice 5.7 Factors influencing purchase of scented rice 5.8 Sourcing of scented rice in Bangalore city 5.9 Different types and brands of scented rice 5.1 Socio economic status of scented rice consumer The socio-economic profile of the consumers is presented in Table 4.1. This includes information about the age group, education qualification, family size and monthly income. The age group taken for the study indicates that scented rice is consumed by the age group 20-30 years (45%) followed by 31-40 years (40%). Majority of it is consumed by age group 20-30 years. Based on educational qualification of consumers, it has been observed that the graduates consumed more scented rice. The education also plays an important role in getting informed about different types and brands of scented rice. With respect to the family size 67.50 per cent of the families were consisting of 2 to 5 persons. Small families are the present trend in the modern cities like Bangalore where large number of small families stay. Due to income and information availability small families consume more scented rice. Scented rice is relatively expensive food. Major consumers of scented rice were in the income group of Rs. 30,001 to 50,000 (35%) followed by more than Rs. 50,001 (32.50%).
  • 50. 34 Sunil Kumar, M 5.2 General profile of buying decision maker The general profile of the scented rice buyer is presented in the Table 4.2. This includes information about the relationship with consumer, age, educational qualification and profession of buyer. The relationship status taken for the study revealed that women (Wife, mother) were the main decision makers. The age group of the decision maker showed that they were in the age group of 41 to 50 years (42.50%). The level of education of the decision maker indicates most of them were graduates make them aware of different types and brands of rice. The profession of the decision maker is shown in the Table 4.2. It revealed that most of them were homemakers (50%) followed by professionals (18%). 5.3 Consumer awareness about scented rice in Bangalore city The awareness about scented rice is shown in the Table 4.3. The table revealed that Basmati rice was known by all consumers and followed by Kalijira. The reason for this behaviour is that the basmati rice is branded and advertised. Kalijira is mostly a store brand. 5.4 Frequency of consumption and food prepared by consumers Frequency of consumption of scented rice by consumers is presented in Table 4.4. It revealed that most of them consumed scented rice monthly followed by whenever needed. The possible reasons for this behaviour may be the price of the scented rice and income level of the consumers. Different types of food prepared by consumers using scented rice is given in Table 4.5 and 4.6. It revealed that most of them prepared pulao followed by biriyani using scented rice, as the vegetarian and non-vegetarians are in equal proportion. 5.5. Consumers purchasing pattern of scented rice in Bangalore city It can be derived that most of the consumers bought scented rice ranging from 1 kg to 5 kg. The possible reasons for this behaviour were price of scented rice, family size, and frequency of consumption. If a consumer purchased more than 5 kg of scented rice it is because of the reason that it can be stored and used whenever needed (Table 4.6). In Bangalore city there is a trend of shopping in supermarkets and hypermarkets. Most of consumers purchased scented rice through supermarkets due to availability of different brands at single place, offers and the discounts offered by the supermarkets. Most of the consumers paid Rs.50-100/kg (60%) followed by more than Rs.100/kg(40%).
  • 51. A Study on Consumer Preference for Scented Rice in Bangalore City 35 Most of the consumers purchased branded scented rice because of the reasons that they have proper label, manufactured date, brand label. 5.6 Consumer preference for scented rice The consumer preference for attributes of scented rice is indicated in Table 4.7. From the table it can be interpreted that consumers prefer aroma, taste and price the most. Consumers least preferred the impurities, texture and stickiness in scented rice. It is in accordance with Al-Hassan et al, (2008) that consumers of rice in Accra pay highest premiums for taste, aroma and shape. Consumers also pay some premium for smaller percentage broken and scarcity of a type of rice in the market. The study is also confirms with the investigations carried out by Mhlanga (2010) that consumers pay a premium for grain size, aroma, colour, wholeness and cleanliness of grain and convenience attributes across the different regions studied. 5.7. Factors influencing purchase of scented rice The rotated factor matrix loadings for identified factors are given in Table 4.8. From factor analysis table it can be deduced that factors influencing scented rice consumption were income and price, festivals, country of origin, retailers, availability of scented rice, nutritive value, traditions, friends, advertisements, education and taste were significant in descending order of their significance. Offers and marital status of consumers were not significantly influence the buying of scented rice. The study confirms with studies conducted by Agbogo et al., (2013), Al-Hassan et al., (2008) that household income, education level and price of the rice were significantly influence the buying decision. 5.8 Sourcing of scented rice in Bangalore city The owners of provision stores procured scented rice from wholesalers due to the fact that they procured relatively small quantities. The convenience store owners procured scented rice from distributors as they were having agreement with them The supermarkets and hypermarkets were corporate and they procured scented rice from distribution centers as they were having their own supply chain arrangements. In order to document the source of scented rice of hoteliers a sample of 20 were selected. Out of which 15 of them were procured scented rice from wholesalers, 2 of them were procured scented rice from distributors and 3 of the hoteliers were not using any scented rice.
  • 52. 36 Sunil Kumar, M 5.9 Different types and brands of scented rice Due to cosmopolitan nature people from different parts of the country and the world lives in Bangalore. This makes people’s preference differ. The major Basmati rice brands India is furnished in Table 4.10. The table indicates that there are ten different companies selling basmati rice with thirteen brands in India. Further the details of the other scented rices are Kalijira, Jasmine, Gandhasale and Brown rice shown in Table 4.11. Kaliira rice was sold by four companies with four different brands. The jasmine rice imported from Thaitan Foods International Co. Ltd. and sold by brand Real Thai. The Gandhasale rice was sold by Pristine Organics Pvt. Ltd with Pristine brand. The brown rice was sold by LT foods with the brand Dawat.
  • 53. A Study on Consumer Preference for Scented Rice in Bangalore City 37 VI. SUMMARY AND CONCLUSION Rice (Oryza sativa L.) is the world’s single most important crop and a primary food source for half of the world’s population.Rice that possesses a scent in plant parts and grains are known as scented rice.Scented rice has always had a special place in countries where rice is the staple. Quality rice are characterized by not only aroma but several other traits like grain length and width, elongation after cooking, etc. Scented rice constitute a small but special group of rice which are considered best in quality. These rice have long been popular in the orient, and are now becoming more popular in middle east, Europe and the United States. The domestic consumption of basmati rice is expected to grow at a healthy CAGR of 15 per cent over the medium term, buoyed by the increasing spending power of the middle-income sections of the society. Moreover, the proliferation of the modern retailing format has helped fuel the consumption of a higher quantum of branded products, as Indian consumers are fast embracing the mall culture and organized retail, triggering a shift from unbranded to branded rice and from economy to premium brands. Keeping these issues in mind a study of consumer preference for various types and brands of scented rice in Bangalore city, consumption pattern of scented rice, factors influencing the consumer preference was studied. Besides, sourcing of scented rice by retailers and hoteliers were also studied. The objectives of the study were: i. To examine the consumer awareness about types and brands of scented rice, ii. To analyze the users preference for scented rice, iii. To identify the factors influencing usage of scented rice and iv. To identify the sourcing of scented rice. Methodology The study was based on primary data. The primary data were collected from the consumers, retailers and hoteliers using pre-tested schedule prepared for the purpose through personal interview for evaluating the objectives of the study. The secondary data regarding scented rice was collected from websites and published reports. The study was conducted in Bangalore city because of its cosmopolitan nature which gives a wide scope for studying the consumer preference towards types and brands of scented rice. Purposive sampling method was adopted to select the consumers. The sampling was done in different localities of Bangalore city. A total of 40 consumers, 20 retailers and 20 hoteliers were interviewed. The data was collected by personally interviewing the consumers through pre tested structured
  • 54. 38 Sunil Kumar, M schedule. The data collected was analysed using descriptive statistics, Best-Worst scaling method and factor analysis. Major findings  Forty five per cent of scented rice consumers belonged to the age group of 20 to 30 years followed by 31 to 40 years (40%).  Seventy per cent of consumers had education level up to graduation.  Most of the families among the sample were small size having 2 to 5 family members.  35 per cent of the consumers are in the household income range of Rs. 30,001 to 50,000 per month followed by more than Rs. 50,001 (32.50%).  42.50 per cent of the buying decision makers were women in the age group of 41 to 50 years.  Fifty per cent of buying decision makers were graduates and homemakers.  All the sample consumers were aware about Basmati rice and Kalijira was known to 27.50 per cent consumers.  32.50% of the consumers used scented rice once in a month.  Non vegetarian consumers prepared biriyani and pulao in equal proportions where as vegetarian consumers mostly prepared pulao.  37.50 per cent of the consumers on an average purchased scented rice more than 1 to 2 kg per month.  Sixty per cent of consumers paid in the range of Rs. 50 to 100 per Kg of scented rice.  Majority (87.50%) of consumers bought branded scented rice.  While purchasing scented rice aroma, price, taste, grade, cooking time, brand and after cooking grain size were most preferred characters.  While purchasing scented rice, consumers least preferred the characteristics like impurities, texture, stickiness, broken grain, after cooking shelf life, age of rice, ease of cooking, grain size and colour.
  • 55. A Study on Consumer Preference for Scented Rice in Bangalore City 39  The factors that significantly influenced the buying of scented rice were income, price, festivals, country of origin, retailers, availability of scented rice, nutritive value, traditions, friends, advertisements and taste.  Offers and marital status of the consumers were not significant factors influencing in buying scented rice.  Provision store owners were procuring scented rice from wholesalers. The owners of convenience stores procured scented rice from distributors/stockists. The supermarket/hypermarket procured scented rice from their respective distribution centres.  75 per cent of the sample respondents procured scented rice from wholesalers, ten per cent of them were procured scented rice from distributors and 15 per cent of the hoteliers were not using any scented rice.  There are ten different companies selling basmati rice with thirteen brands in Bangalore city.  Kaliira rice was sold by four companies with four different brands. The jasmine rice imported from Thaitan Foods International Co. Ltd and sold by brand Real Thai. The Gandhasale rice was sold by Pristine Organics Pvt. Ltd with Pristine brand. The brown rice was sold by LT Foods with the brand Dawat. Conclusion From this study it can be concluded that the scented rice is consumed by the people having higher income. All consumers know about Basmati rice. The scented rice consumers preferred aroma, price and taste in the scented rice, and impurities and texture were not preferred by consumers. It shows that consumers are quality and price conscious while buying scented rice. The consumers were largely influenced by household income, price of scented rice and taste of scented rice.
  • 56. A Study on Consumer Preference for Scented Rice in Bangalore City 40 VII. REFERENCES ABDULLAHI FARAH, A., ZAINALABIDIN, M. AND ISMAIL, A. L., 2011, The influence of socio-demographic factors and product attributes on attitudes toward purchasing special rice among Malaysian consumers. International Food Research Journal 18(3):1135-1142. AGBOGO, ELIAS, A., UDOUSO, ANIEDI, B. AND TIKU, EJOR N., 2013, Analysis of Factors Affecting Rice Consumption in Cross River State, Nigeria, Journal of Agriculture and Veterinary Science, 4(2): 29-33. AHUJA, U., AHUJA S, C., THAKRAR, R AND RANI, N. S., 2008.Scented Rices of India.Asian Agri-History, 12(4): 267-283. AJAY MODI, Long in grained wisdom.Business Today.Newspaper22nd December 2013. AL-HASSAN, R. M., AGBEKPORNU, H. G. ANDSARPONG, D. B., 2008, Consumer Preferences for Rice Quality Characteristics in Accra and the Effects of these Preferences on Price, Agricultural and Food Science Journal of Ghana, 7: 575- 591. ANANG, B. T., SIDNEY NII ADJEI ADJETEY AND STANISLAUS ADDY ABIRIWE, 2011, Consumer preferences for rice quality characteristics and the effects on price in the Tamale Metropolis, Northern Region, Ghana. International Journal of Agri Science, 1(2): 67-74. AYACHIT, S. M., 2002, Kashyapiyakrishisukti (A treatise on agriculture by Kashyapa). Agri-history Bulletin No. 4. Asian Agri History Foundation, Secundrabad, India, p. 158. AYINDE IDRIS, KAREEM RASAKI, HODEFE, O.J AND BAKARE HAKEEM, 2013, Consumption Pattern of Ofada Rice among Civil Servants in Abeokuta Metropolis of Ogun State, Nigeria.Journal of Biology, Agriculture and Healthcare, 6(3): 106-112. BALDWIN, K. AND CHILDS, N., 2011, Rice Yearbook (2009/10). USDA, USA. BERTA SCHNETTLER, DANILO RUIZ, ORIANA SEPÚLVEDA, JOSÉ SEPÚLVEDA AND MARIANELA DENEGRI., 2009, Importance of origin in rice purchasing decisions in Talca and Temuco, Chile. Cien.Inv. Agr.36(2):239- 248. CHAUDHARY, D., TRAN, D. V. AND DUFFY, R., 2003.Specialty Rices of the World: Breeding Production and Marketing. FAO books, Roma, p. 358.
  • 57. 41 Sunil Kumar, M DIAKO, C., SAKYI-DAWSON, E., BEDIAKO-AMOA, B., SAALIA, F.K. AND MANFUL, J.T. 2010, Consumer Perceptions, Knowledge and Preferences for Aromatic Rice Types in Ghana. Nature and Science 8(12): 12-19. EMODI, A.I AND MADUKWE, M. C., 2011, Influence of Consumers’ Socio-Economic Characteristics onRice Consumption in South East Nigeria, Libyan Agriculture Research Center Journal International.2 (3): 105-111. FAKAYODE, S. B., OMOTESHO, O. A. and OMONIWA, A. E., 2010, Economic Analysis of Rice Consumption Patterns in Nigeria. Journal of Agricultural Science and Technology, 12(2): 135-144. FAO, 2012.Rice Market Monitor.XV (4): November 37. FINN, A. AND LOUVIERE, J. J., 1992, “Determining the Appropriate Response to Evidence of Public Concerns: the Case of Food Safety”, Journal of Public Policy and Marketing, 11(1): 12-25. GALAWAT, F. AND YABE, M. 2010, Assessing consumer's preference for local rice in Brunei: an application of choice model. Journal of International Society for South-East Asian Agricultural Sciences, 16(2): 104-115. GEORGES GIRAUD, 2013, The World Market of Fragrant Rice, Main Issues and Perspectives. International Food and Agribusiness Management Review, 16(2): 1-20. GIDEON DANSO-ABBEAM MUBARICK ARMED AND FRANCIS BAIDOO, 2014, Determinants of Consumer Preference for Local Rice in Tamale Metropolis, Ghana. International Journal of Education and Social Science, 1(2): 114-122. GURUNG, B., 2013, A Hedonic Pricing Model of Rice for Bhutan.International Journal of Humanities and Management Sciences, 1(2): 170-178. HANISAHMAD, I. A. H., JINAP, S., MAD NASIR, S., ALIAS, R. AND MUHAMMAD SHAHRIM, A. K., 2012, Consumers’ demand and willingness to pay for rice attributes in Malaysia.International Food Research Journal, 19(1): 363-369. HORI, K., PURBOYO, R. B. R. A., AKINAGA, Y., OKITA, T. and ITOH, K., 1992, Knowledge and preference of aromatic rice by consumers in East and South-east Asia.Journalof Consumer Studies & Home Economics, 16: 199–206. HORI, K., JUNKO SONODA, YUKO AKINAGA andHEULWEN HALL, A., 1996, Knowledge and preference for aromatic rice by people in Britain.Journal of Consumer Studies & Home Economics, 20(2): 145-152.