Released Nov.16 2016 - Fundamental Research Corp. eXp World Holdings, Inc. (OTCQB: EXPI): Agent count continues to grow rapidly; Raising valuation
•
1 gostou•422 visualizações

EXPI Fundamental Research Strong buy value .

Recomendados
Recomendados
Mais conteúdo relacionado
Mais procurados
Mais procurados (19)
Semelhante a Released Nov.16 2016 - Fundamental Research Corp. eXp World Holdings, Inc. (OTCQB: EXPI): Agent count continues to grow rapidly; Raising valuation
Semelhante a Released Nov.16 2016 - Fundamental Research Corp. eXp World Holdings, Inc. (OTCQB: EXPI): Agent count continues to grow rapidly; Raising valuation (20)
Mais de Follow me on Twitter @Stockshaman
Mais de Follow me on Twitter @Stockshaman (20)
Último
Último (20)
Released Nov.16 2016 - Fundamental Research Corp. eXp World Holdings, Inc. (OTCQB: EXPI): Agent count continues to grow rapidly; Raising valuation
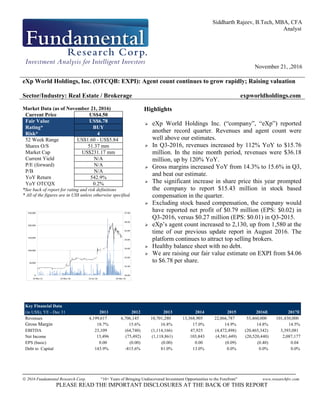
- 1. Siddharth Rajeev, B.Tech, MBA, CFA Analyst November 21, ,2016 2016 Fundamental Research Corp. “10+ Years of Bringing Undiscovered Investment Opportunities to the Forefront” www.researchfrc.com PLEASE READ THE IMPORTANT DISCLOSURES AT THE BACK OF THIS REPORT eXp World Holdings, Inc. (OTCQB: EXPI): Agent count continues to grow rapidly; Raising valuation Sector/Industry: Real Estate / Brokerage expworldholdings.com Market Data (as of November 21, 2016) Current Price US$4.50 Fair Value US$6.78 Rating* BUY Risk* 4 52 Week Range US$1.60 - US$5.84 Shares O/S 51.37 mm Market Cap US$231.17 mm Current Yield N/A P/E (forward) N/A P/B N/A YoY Return 542.9% YoY OTCQX 0.2% *See back of report for rating and risk definitions * All of the figures are in US$ unless otherwise specified. 0 50,000 100,000 150,000 200,000 250,000 16-Nov-15 15-Mar-16 13-Jul-16 10-Nov-16 $0.00 $1.00 $2.00 $3.00 $4.00 $5.00 $6.00 $7.00 Highlights eXp World Holdings Inc. (“company”, “eXp”) reported another record quarter. Revenues and agent count were well above our estimates. In Q3-2016, revenues increased by 112% YoY to $15.76 million. In the nine month period, revenues were $36.18 million, up by 120% YoY. Gross margins increased YoY from 14.3% to 15.6% in Q3, and beat our estimate. The significant increase in share price this year prompted the company to report $15.43 million in stock based compensation in the quarter. Excluding stock based compensation, the company would have reported net profit of $0.79 million (EPS: $0.02) in Q3-2016, versus $0.27 million (EPS: $0.01) in Q3-2015. eXp’s agent count increased to 2,130, up from 1,580 at the time of our previous update report in August 2016. The platform continues to attract top selling brokers. Healthy balance sheet with no debt. We are raising our fair value estimate on EXPI from $4.06 to $6.78 per share. Key Financial Data (in US$); YE - Dec 31 2011 2012 2013 2014 2015 2016E 2017E Revenues 4,199,617 6,706,145 10,701,280 13,368,905 22,866,787 53,460,000 101,430,000 Gross Margin 18.7% 15.6% 16.8% 17.0% 14.9% 14.8% 14.5% EBITDA 23,109 (64,740) (1,114,166) 47,925 (4,472,498) (20,465,342) 3,393,081 Net Income 13,496 (75,492) (1,118,861) 103,843 (4,581,449) (20,520,440) 2,087,177 EPS (basic) 0.00 (0.00) (0.00) 0.00 (0.09) (0.40) 0.04 Debt to Capital 143.9% -815.6% 81.0% 13.0% 0.0% 0.0% 0.0%
- 2. Page 2 2016 Fundamental Research Corp. “10+ Years of Bringing Undiscovered Investment Opportunities to the Forefront” www.researchfrc.com PLEASE READ THE IMPORTANT DISCLOSURES AT THE BACK OF THIS REPORT Membership count rises to 2,130 Financials eXp’s agent count increased to 2,130, from 1,580 at the time of our previous update report in August 2016, reflecting an increase of approximately 200 new agents a month. Note that the platform only had 864 agents at the beginning of the year. Management now expects the agent count to exceed 2,200 by the end of the year, up from their previous estimate of over 2,000. Since our previous report, the company added one more state (Alaska), and currently operates across 41 states the U.S. In September and October, the company announced that several leading independent real estate brokers joined the platform, including ones in Arkansas, Northern California, and South Texas. The company’s ability to attract top selling brokers, we believe, is vital and will allow them to continue to rapidly grow the agent-base. In Q3-2016, revenues grew by 112% YOY to $15.76 million. The company had reported 126% YOY growth in the first half of the year. In the nine month period, revenues were $36.18 million, up by 120% YOY. The following chart shows the growth in revenues and agent count.
- 3. Page 3 2016 Fundamental Research Corp. “10+ Years of Bringing Undiscovered Investment Opportunities to the Forefront” www.researchfrc.com PLEASE READ THE IMPORTANT DISCLOSURES AT THE BACK OF THIS REPORT Management had indicated to us earlier that they intend to start providing detailed breakdowns in the future, such as the total transactions in a quarter, the average transactions per member, and average commission received by members. Our year-end agent forecast is now at 2,400 versus our previous estimate of 2,100. We are also raising the 2017 average agent count, while maintaining the 2017 year-end count at 4,500. We are accordingly raising our revenue forecast for 2016 from $48.94 million to $53.46 million, and for 2017 from $82.50 million to $101.43 million. We are also raising our long-term agent count forecast from 15,000 to 25,000 by 2022. Gross margins increased YoY from 14.3% to 15.6% in Q3. We were pleased with the improvement considering that gross margins had dropped YoY from 15.4% to 14.0% in the first half of the year. Cost of revenues includes costs related to sales agent commissions and revenue sharing. We are raising our gross margin estimate for the entire year from 13.8% to 14.8%, and our 2017 estimate from 14% to 14.5%. Margins Q3-2015 Q3-2016 2015 (9M) 2016 (9M) Gross 14.3% 15.6% 14.9% 14.7% EBITDA 33.5% -83.4% -15.2% -54.5% EBIT 20.4% -93.0% -21.2% -58.8% Net 20.4% -93.0% -21.3% -58.8% Net (adjusted) 3.6% 5.0% 1.4% 4.0%
- 4. Page 4 2016 Fundamental Research Corp. “10+ Years of Bringing Undiscovered Investment Opportunities to the Forefront” www.researchfrc.com PLEASE READ THE IMPORTANT DISCLOSURES AT THE BACK OF THIS REPORT Cash Flows Balance Sheet The company reported $15.43 million of stock based compensation in the quarter versus - $1.25 million in Q3-2015 (the negative expense was because of a drop in share price in Q3- 2015). Excluding stock based compensation, operating expenses were $1.67 million (10.6% of revenues) in Q3-2016, versus $0.80 million (10.7% of revenues) in Q3-2015, and in line with our estimate. eXp reported a net loss of $14.65 million (EPS: -$0.29) in Q3-2016, versus net profit of $1.52 million (EPS: $0.03) in Q3-2015. Excluding stock based compensation, the company would have reported net profit of $0.79 million (EPS: $0.02) versus $0.27 million (EPS: $0.01) in Q3-2015. For the nine month period, net profit (excluding stock based compensation) was $1.44 million (EPS: $0.03) versus $0.24 million (EPS: $0.01) in the comparable period in the previous year. We are revising our 2016 forecast to a net loss of $20.52 million (EPS: -$0.40) from $5.31 million (EPS: -$0.10). We are raising our 2017 forecasts from $1.41 million (EPS: $0.03) to $2.09 million (EPS: $0.04). Excluding stock based compensation, our forecasts for 2016, and 2017, are net profits of $2.19 million (EPS: $0.04) and $5.13 million (EPS: $0.10), respectively. Free cash flows (“FCF”) were $0.36 million in the first nine months of 2016 versus $0.18 million in the comparable period in the previous year. Summary of Cash Flows (US$, mm) 2015 (9M) 2016 (9M) Operating $0.22 $0.64 Investing -$0.04 -$0.28 Financing -$0.06 $0.00 Effects of Exchange Rate -$0.02 $0.02 Net $0.10 $0.37 Free Cash Flows to Firm (FCF) $0.18 $0.36 At the end of Q3-2016, the company had $0.94 million in cash. Working capital and the current ratio were $1.67 million and 2.1x, respectively. The following table shows the company’s cash and liquidity position.
- 5. Page 5 2016 Fundamental Research Corp. “10+ Years of Bringing Undiscovered Investment Opportunities to the Forefront” www.researchfrc.com PLEASE READ THE IMPORTANT DISCLOSURES AT THE BACK OF THIS REPORT Stock Options and Warrants Valuation and Rating Liquidity & Capital Structure 2014 2015 Q3-2016 (US$) Cash 353,374 571,814 944,096 Working Capital 259,077 482,311 1,671,645 Current Ratio 1.5 1.7 2.1 LT Debt - - - Total Debt 61,887 - - LT Debt / Capital 0.0% 0.0% 0.0% Total Debt / Capital 13.0% 0.0% 0.0% EBIT Interest Coverage (excl. stock comp) 282.9 258.9 N/A As of September 30, 2016, there were 6.79 million options with exercise prices between $0.13 and $0.27, with approximately 6.25 years of remaining life. There were also 4.44 million options with exercise prices between $0.30 and $2.18, with approximately 8 to 10 years of remaining life. In October 2016, the company decided to wind down First Cloud’s operations in order to focus on its primary business. First Cloud operated as a mortgage broker with licenses in California, Arizona, New Mexico, and Texas. Our revised Discounted Cash Flow (“DCF”) valuation is $6.78 per share, up from our previous estimate of $4.06 per share. DCF Valuation (US$) 2016E 2017E 2018E 2019E 2020E 2021E 2022E Terminal Funds Flow from Operations $790,333 $5,312,116 $8,860,519 $14,985,337 $23,963,695 $31,920,463 $39,742,904 -increase in w/c $131,518 -$395,405 -$1,432,953 -$1,248,756 -$1,445,962 -$1,626,707 -$1,626,707 Cash Flows from Operations $921,851 $4,916,711 $7,427,566 $13,736,581 $22,517,734 $30,293,756 $38,116,197 -capex -$118,797 -$500,000 -$500,000 -$500,000 -$500,000 -$500,000 -$500,000 Free Cash Flows $803,054 $4,416,711 $6,927,566 $13,236,581 $22,017,734 $29,793,756 $37,616,197 $603,050,694 Present Value $803,054 $4,007,905 $5,704,499 $9,890,791 $14,929,533 $18,332,314 $21,003,193 $336,716,389 Discount Rate 10.2% Terminal Growth 3% Present Value $411,387,677 Cash - Debt $1,477,470 Fair Value $412,865,147 Shares O/S (treasury stock method) 60,935,996 Value per share (US$) $6.78 We reiterate our BUY rating and risk rating of 4.
- 6. Page 6 2016 Fundamental Research Corp. “10+ Years of Bringing Undiscovered Investment Opportunities to the Forefront” www.researchfrc.com PLEASE READ THE IMPORTANT DISCLOSURES AT THE BACK OF THIS REPORT Risks The following risks may cause our estimates to differ from actual results (not exhaustive): The real estate brokerage industry is highly competitive. The company’s ability to adapt to technological advancements will play a vital role in its long-term success. The company’s profitability is highly dependent on the overall health of the real estate market. eXp is in a growth phase and has a relatively short track record. Long-term retention of agents has yet to be proven. As with any real estate brokerage, the company is also susceptible to negative changes to regulatory laws.
- 7. Page 7 2016 Fundamental Research Corp. “10+ Years of Bringing Undiscovered Investment Opportunities to the Forefront” www.researchfrc.com PLEASE READ THE IMPORTANT DISCLOSURES AT THE BACK OF THIS REPORT Appendix STATEMENTS OF OPERATIONS (in US$) - YE Dec 31st 2014 2015 2016E 2017E Net Revenues 13,368,905 22,866,787 53,460,000 101,430,000 COGS 11,099,750 19,456,409 45,555,037 86,722,650 Gross Profit 2,269,155 3,410,378 7,904,963 14,707,350 EXPENSES General and administrative 1,635,555 2,441,089 4,521,352 6,085,800 Stock based compensation 233,098 4,790,568 22,710,608 3,042,900 Professional fees 276,558 439,763 603,745 664,119 Sales and marketing 76,019 211,456 534,600 1,521,450 EBITDA 47,925 (4,472,498) (20,465,342) 3,393,081 Amortization 14,493 26,304 55,098 182,039 EBIT 33,432 (4,498,802) (20,520,440) 3,211,042 Other income 0 23 - - Interest expense -942 -1,127 EBT 32,490 (4,499,906) (20,520,440) 3,211,042 Taxes -71,353 103,069 0 1,123,865 Net Profit (Loss) 103,843 (4,602,975) (20,520,440) 2,087,177 EPS 0.00 -0.09 -0.40 0.04 Non-controlling interests 21,526 - - Net Profit (Loss) to common shareholders 103,843 -4,581,449 -20,520,440 2,087,177 EPS 0.00 -0.09 -0.40 0.04
- 8. Page 8 2016 Fundamental Research Corp. “10+ Years of Bringing Undiscovered Investment Opportunities to the Forefront” www.researchfrc.com PLEASE READ THE IMPORTANT DISCLOSURES AT THE BACK OF THIS REPORT BALANCE SHEETS (in US$) - YE Dec 31st 2014 2015 2016E 2017E ASSETS CURRENT Cash and cash equiv. 353,374 571,814 1,731,546 6,148,257 Restricted cash 141,508 148,613 148,613 148,613 A/R 189,026 341,643 1,550,806 2,942,355 Prepaid 74,673 84,451 186,007 352,912 Total Current Assets 758,581 1,146,521 3,616,972 9,592,137 Fixed assets 79,393 110,195 455,098 773,059 Deferred tax assets 75,196 Total Assets 913,170 1,256,716 4,072,070 10,365,195 LIABILITIES CURRENT A/P 79,389 89,984 198,284 377,471 Customer deposits 141,508 148,613 339,135 643,444 Accrued expenses / interest 216,720 425,613 751,976 1,431,529 Notes payable 61,887 Due to related party Total Current Liabilities 499,504 664,210 1,289,395 2,452,444 Notes payable SHAREHOLDERS EQUITY Share capital 1,824,847 6,612,283 6,612,283 6,612,283 Accumulated deficit / comprehensive loss -1,411,181 -6,000,201 -3,810,033 1,320,044 Non-controlling interests -19,576 -19,576 -19,576 Total shareholders’ equity (deficiency) 413,666 592,506 2,782,674 7,912,751 Total Liabilities and Shareholders Equity 913,170 1,256,716 4,072,070 10,365,195
- 9. Page 9 2016 Fundamental Research Corp. “10+ Years of Bringing Undiscovered Investment Opportunities to the Forefront” www.researchfrc.com PLEASE READ THE IMPORTANT DISCLOSURES AT THE BACK OF THIS REPORT STATEMENTS OF CASH FLOWS (in US$) - YE Dec 31st 2014 2015 2016E 2017E OPERATING ACTIVITIES Net profit for the year 103,843 -4,602,975 -20,520,440 2,087,177 Adjusted for items not involving cash: Depreciation 14,493 26,304 55,098 182,039 Stock compensation / option expense 233,098 4,790,568 22,710,608 3,042,900 Deferred tax asset -75,196 75,196 Funds From Operations 276,238 289,093 2,245,266 5,312,116 Change in working capital A/R -81,186 -152,617 -1,209,163 -1,391,548 Prepaid -34,880 -9,778 -101,556 -166,905 A/P 23,563 10,595 108,300 179,187 Accrued expenses 78,939 208,893 516,885 983,861 Due to related parties -18,232 NET CASH USED IN OPERATING ACTIVITIES 244,442 346,186 1,559,732 4,916,711 INVESTING ACTIVITIES PP&E -49,032 -57,116 -400,000 -500,000 NET CASH USED IN INVESTING ACTIVITIES -49,032 -57,116 -400,000 -500,000 FINANCING ACTIVITIES Equity 59,450 -1,182 Debt -61,877 NET CASH FROM FINANCING ACTIVITIES 59,450 -63,059 0 0 Foreign Exchange / Others -1,542 -7,571 INCREASE IN CASH FOR THE YEAR 253,318 218,440 1,159,732 4,416,711 CASH, BEGINNING OF THE YEAR 100,056 353,374 571,814 1,731,546 CASH, END OF THE YEAR 353,374 571,814 1,731,546 6,148,257
- 10. Page 10 2016 Fundamental Research Corp. “10+ Years of Bringing Undiscovered Investment Opportunities to the Forefront” www.researchfrc.com PLEASE READ THE IMPORTANT DISCLOSURES AT THE BACK OF THIS REPORT Fundamental Research Corp. Equity Rating Scale: Buy – Annual expected rate of return exceeds 12% or the expected return is commensurate with risk Hold – Annual expected rate of return is between 5% and 12% Sell – Annual expected rate of return is below 5% or the expected return is not commensurate with risk Suspended or Rating N/A— Coverage and ratings suspended until more information can be obtained from the company regarding recent events. Fundamental Research Corp. Risk Rating Scale: 1 (Low Risk) - The company operates in an industry where it has a strong position (for example a monopoly, high market share etc.) or operates in a regulated industry. The future outlook is stable or positive for the industry. The company generates positive free cash flow and has a history of profitability. The capital structure is conservative with little or no debt. 2 (Below Average Risk) - The company operates in an industry where the fundamentals and outlook are positive. The industry and company are relatively less sensitive to systematic risk than companies with a Risk Rating of 3. The company has a history of profitability and has demonstrated its ability to generate positive free cash flows (though current free cash flow may be negative due to capital investment). The company’s capital structure is conservative with little to modest use of debt. 3 (Average Risk) - The company operates in an industry that has average sensitivity to systematic risk. The industry may be cyclical. Profits and cash flow are sensitive to economic factors although the company has demonstrated its ability to generate positive earnings and cash flow. Debt use is in line with industry averages, and coverage ratios are sufficient. 4 (Speculative) - The company has little or no history of generating earnings or cash flow. Debt use is higher. These companies may be in start-up mode or in a turnaround situation. These companies should be considered speculative. 5 (Highly Speculative) - The company has no history of generating earnings or cash flow. They may operate in a new industry with new, and unproven products. Products may be at the development stage, testing, or seeking regulatory approval. These companies may run into liquidity issues, and may rely on external funding. These stocks are considered highly speculative. Disclaimers and Disclosure The opinions expressed in this report are the true opinions of the analyst about this company and industry. Any “forward looking statements” are our best estimates and opinions based upon information that is publicly available and that we believe to be correct, but we have not independently verified with respect to truth or correctness. There is no guarantee that our forecasts will materialize. Actual results will likely vary. The analyst and Fundamental Research Corp. “FRC” does not own any shares of the subject company, does not make a market or offer shares for sale of the subject company, and does not have any investment banking business with the subject company. Fees were paid by eXp to FRC. The purpose of the fee is to subsidize the high costs of research and monitoring. FRC takes steps to ensure independence including setting fees in advance and utilizing analysts who must abide by CFA Institute Code of Ethics and Standards of Professional Conduct. Additionally, analysts may not trade in any security under coverage. Our full editorial control of all research, timing of release of the reports, and release of liability for negative reports are protected contractually. To further ensure independence, eXp has agreed to a minimum coverage term including four updates. Coverage can not be unilaterally terminated. Distribution procedure: our reports are distributed first to our web-based subscribers on the date shown on this report then made available to delayed access users through various other channels for a limited time. The distribution of FRC’s ratings are as follows: BUY (70%), HOLD (8%), SELL (5%), SUSPEND (17%). To subscribe for real-time access to research, visit http://www.researchfrc.com/subscription.htm for subscription options. This report contains "forward looking" statements. Forward-looking statements regarding the Company and/or stock’s performance inherently involve risks and uncertainties that could cause actual results to differ from such forward-looking statements. Factors that would cause or contribute to such differences include, but are not limited to, continued acceptance of the Company's products/services in the marketplace; acceptance in the marketplace of the Company's new product lines/services; competitive factors; new product/service introductions by others; technological changes; dependence on suppliers; systematic market risks and other risks discussed in the Company's periodic report filings, including interim reports, annual reports, and annual information forms filed with the various securities regulators. By making these forward looking statements, Fundamental Research Corp. and the analyst/author of this report undertakes no obligation to update these statements for revisions or changes after the date of this report. A report initiating coverage will most often be updated quarterly while a report issuing a rating may have no further or less frequent updates because the subject company is likely to be in earlier stages where nothing material may occur quarter to quarter. Fundamental Research Corp DOES NOT MAKE ANY WARRANTIES, EXPRESSED OR IMPLIED, AS TO RESULTS TO BE OBTAINED FROM USING THIS INFORMATION AND MAKES NO EXPRESS OR IMPLIED WARRANTIES OR FITNESS FOR A PARTICULAR USE. ANYONE USING THIS REPORT ASSUMES FULL RESPONSIBILITY FOR WHATEVER RESULTS THEY OBTAIN FROM WHATEVER USE THE INFORMATION WAS PUT TO. ALWAYS TALK TO YOUR FINANCIAL ADVISOR BEFORE YOU INVEST. WHETHER A STOCK SHOULD BE INCLUDED IN A PORTFOLIO DEPENDS ON ONE’S RISK TOLERANCE, OBJECTIVES, SITUATION, RETURN ON OTHER ASSETS, ETC. ONLY YOUR INVESTMENT ADVISOR WHO KNOWS YOUR UNIQUE CIRCUMSTANCES CAN MAKE A PROPER RECOMMENDATION AS TO THE MERIT OF ANY PARTICULAR SECURITY FOR INCLUSION IN YOUR PORTFOLIO. This REPORT is solely for informative purposes and is not a solicitation or an offer to buy or sell any security. It is not intended as being a complete description of the company, industry, securities or developments referred to in the material. Any forecasts contained in this report were independently prepared unless otherwise stated, and HAVE NOT BEEN endorsed by the Management of the company which is the subject of this report. Additional information is available upon request. THIS REPORT IS COPYRIGHT. YOU MAY NOT REDISTRIBUTE THIS REPORT WITHOUT OUR PERMISSION. Please give proper credit, including citing Fundamental Research Corp and/or the analyst, when quoting information from this report. The information contained in this report is intended to be viewed only in jurisdictions where it may be legally viewed and is not intended for use by any person or entity in any jurisdiction where such use would be contrary to local regulations or which would require any registration requirement within such jurisdiction.