SlideShare uma empresa Scribd logo
1 de 10
Baixar para ler offline
Two-photon deep imaging through skin and skull of Zebra
   finches : Preliminary studies for in vivo brain metabolism
                          monitoring
              D. Abi-Haidara , T. Oliviera , S. Mottina , C. Vignalb and N. Mathevonb
    a Laboratoire                                                                  ´
                  Hubert Curien (ex-LTSI), UMR5516 CNRS & University of Saint-Etienne,
                                          ´
                                    Saint-Etienne, France;
                                                         ´              ´
         b Laboratoire ENES, EA3988, University of Saint-Etienne, Saint-Etienne, France


                                                  ABSTRACT
Zebra Finches are songbirds which constitute a model for neuro-ethologists to study the neuro-mechanisms of
vocal recognition. For this purpose, in vivo and non invasive monitoring of brain activity is required during
acoustical stimulation. MRI (Magnetic Resonance Imaging) or NIRS (Near InfraRed Spectroscopy) are suitable
methods for these measurements, even though MRI is difficult to link quantitatively with neural activity and
NIRS suffers from a poor resolution. In the particular case of songbirds (whose skin is thin and quite transparent
and whose skull structure is hollow), two-photon microscopy enables a quite deep penetration in tissues and
could be an alternative. We present here preliminary studies on the feasability of two-photon microscopy in
these conditions. To do so, we chose to image hollow fibers, filled with Rhodamine B, through the skin of Zebra
finches in order to evaluate the spatial resolution we may expect in future in vivo experiments. Moreover, we used
the reflectance-mode confocal configuration to evaluate the exponential decrease of backreflected light in skin
and in skull samples. Following this procedure recently proposed by S.L. Jacques and co-workers, we planned
to determine the scattering coefficient µs and the anisotropy g of these tissues and make a comparison between
fixed and fresh skin and skull samples for future Monte Carlo simulations of the scattering in our particular
multi-layered structure.
Keywords: two-photon fluorescence, microscopy, neuro-imaging, scattering media, songbird

                                            1. INTRODUCTION
In order to understand vocal recognition and social behaviors of animals, it is quite obvious that in vivo ex-
periments are crucial. Moreover, analyses of the neuro-mechanisms underlying vocal recognition created a need
for reliable and non invasive tools to probe activations of brain area involved in vocal processes. Amongst all
animals, songbirds, and particularly Zebra Finches (Taeniopygia guttata) are interesting to study because they
happen to be specialists in vocal emission and recognition, which are deeply involved in their social interactions.1
In order to monitor neuro-activations, functional MRI and NIRS (Near Infra-Red Spectroscopy) have been used
and have demonstrated their efficiency.2–4 Unfortunately, the BOLD (Blood Oxygen Level Dependent) signal
measured in fMRI experiments remains difficult to link quantitatively with parameters expressing neural activ-
ity. On the contrary, NIRS gives quantitative information about cerebral blood volume (CBV) and hemoglobin
oxygen saturation level which reflects cerebral activity, but it is not an imaging method and it suffers from a
poor millimetric resolution. In other terms, we have to admit that the study of neuro-mechanisms requires the
use of different and complementary monitoring methods.
    For more than ten years now, two-photon microscopy has been widely adopted for in vivo imaging because
of its ability to keep a good resolution (a few micrometers), even in the depth (1mm) of scattering biological
samples.5–7 In more recent years, two-photon microscopy has been used for in vivo brain monitoring.8–13 Many
of the studies have been performed on rats or mice and proved very efficient. Unfortunately, the thickness (1.6-
2.2mm) and the highly scattering properties of rats and mice skull requires to remove a part of the skull and
   Further author information: (Send correspondence to T.O.)
T.O.: E-mail: thomas.olivier@univ-st-etienne.fr, Telephone: +33 (0)4 77 91 58 20
replace it with a glass window. Other approaches tend to reduce many problems associated with craniotomy
by reducing the thickness of the skull9 to about 200-250µm. Miniature head-mounted elements and optical
fibers have been successfully also employed on freely moving rats, but still requires craniotomy.8 More recently,
two-photon micro-endoscopy experiments have been tested with very thin gradient index lenses, allowing to keep
micrometer resolutions, even 1.5mm deep inside the brain.11, 12 In most of these various multiphoton in vivo brain
studies, the monitoring relies on the study of the dynamics of red blood cells in brain capillaries.10 This gives
a reliable information about neural activations in quite small brain areas. By staining the plasma with various
fluorophores, contrast can be obtained between the fluorescent plasma and the absorbing blood cells. These
studies, based on red blood cells counting seem to require quite a good resolution which necessitates craniotomy.
However, the feasability of such a measurement has been demonstrated through 250µm thinned skull. Another
way to monitor brain activity can be the use of endogenous fluorescence of NAD(P)H or flavoproteins involved
in the energy metabolism of neurons.14 Even if this endogenous fluorescence is quite weak, it seems to be an
interesting way as it does not seem to require as much resolution as the counting of red blood cells.
    In the case of songbirds like Zebra Finches, craniotomy is problematic as the birds are quite fragile. Moreover,
Zebra Finches have a pneumatic skull structure composed of 25µm-thick internal and external cortical bones
linked by approximately 250µm-high trabeculae. Indeed, the skull of Zebra Finches is much thinner than the
skull or rats or mice, and mainly composed of air. Our goal is to evaluate the possibility to perform two-photon
imaging in vivo through the skull, and maybe the skin, of Zebra Finches. Particularly, the brain area we would
like to investigate is the NCM (caudomedial neostriatum) which is highly involved in song processing. This brain
area is located between the caudal and the dorsal part of the bird’s head and 1.2mm to 2.7mm below the external
surface of the head. The hippocampus could also be an area of interest and is located above the NCM, between
0.6 and 1mm below the surface of the head.
    At first sight, this particular skull structure is more transparent than the skull structure of small mammalians,
however, as the refractive index and scattering properties are very heterogeneous in all directions, it is important
to evaluate the effect of this structure on the image quality and the axial and lateral resolutions of multiphoton
microscopy. This heterogeneous structure is likely to distort the image. As a first step before setting up in
vivo procedures and experiments we decided to work on a simplified structure (i.e. only on fixed skull samples)
and to image a clearly identified object. The object we chose to image is a 10µm-hollow core fiber filled with
Rhodamine B, which possesses a high two-photon absorption cross section. In this work, we will present various
images and processed XYZ stacks performed on fixed skull samples, and particularly we will try to quantify the
distorsion and loss of resolution induced by the scattering of the incident beam while passing through the skull
sample.
    Besides, it could be interesting to use simulations of light scattering inside the skin and skull of Zebra Finches
in order to better evaluate the feasability of in vivo monitoring of the neuro-activations. This requires accurate
knowledge of the scattering coefficients of fresh skin and skull samples. We used the recent experimental procedure
described by S. L. Jacques et al.,15, 16 based on reflectance-mode confocal measurements of the exponential decay
of reflectivity as the focus is moved along the optical axis inside the scattering sample. This measurement
allows the determination of both the scattering coefficient µs and the anisotropy g from the parameters ρ and µ
describing the exponential decay of reflectivity. This determination requires the performing of Monte Carlo
simulations that we have not performed yet. However, comparisons between the exponential decay coefficients ρ
and µ of fresh and fixed samples are presented, allowing us to evaluate the effect of fixing tissues to perform
more convenient experiments.

                                   2. MATERIALS AND METHODS
In order to perform two-photon imaging as well as reflectance mode confocal imaging of skin or skull samples,
we used a TCS-SP2 confocal microscope from LEICA Microsystems. The laser system was a Ti:Sapphire MIRA
900 oscillator from COHERENT pumped with a 5W VERDI Nd:YAG laser at 532nm. The laser system delivers
typically 800mW, 200fs pulses with a 76MHz repetition rate. The wavelength can be adjusted between 710 and
900nm with a maximum power around 800nm. The experimental setup is represented on Figure 1. Only the
elements that were relevant during our experiments are represented.
2.1. Two-photon imaging experiments
In the first set of experiments, i.e. for two-photon imaging, two-photon fluorescence is collected just after the
microscope objective via a dichroic beam splitter which is transparent to wavelengths greater than 715nm. The
collected visible radiation spectrum is split by another dichroic beamsplitter in two channels (non-descanned pho-
tomultipliers), one collecting blue/green radiations up to 550nm and the other one collecting yellow/orange/red
radiations starting from 550nm. As the confocal pinhole is useless for two-photon microscopy, the use of such
non-descanned detectors enables to collect the maximum fraction of fluorescence from the focus. Microscope
objectives that were used are long working distance water-immersion LEICA objectives (HCX APO L U-V-I
20× NA-0.5 and HCX APO L U-V-I 40× NA-0.8). An electro-optical modulator (EOM) was used to adjust the
laser power at the entrance of the confocal system. This was particularly useful to automatically compensate for
energy losses due to scattering as the focus moves inside the samples.


                                         (a)                                  (b)


Figure 1. Schematic representation of the microscopy configurations used in this work. (a) Main elements of the LEICA
TCS-SP2 microscopy system used in this work for confocal reflectance mode measurements of the diffusion coefficients or
two-photon imaging of the hollow fiber filled with Rhodamine B. For two-photon imaging: BS: dichroic mirror transparent
to visible radiations, DBS1: dichroic beam splitter transparent to NIR radiations starting from 715nm, DBS2: dichroic
beam splitter separating the visible radiation reflected by DBS1 into two channels (λ > 550nm and λ < 550nm), NDD1
and NDD2: non-descanned detectors (photomultipliers). (b) Details of the sample used in two-photon imaging: IM:
immersion medium, Sk: skull, HF: hollow fiber, RhB: Rhodamine B, St: stand. For confocal reflectance mode: BS: 30/70
beam splitter, Sc: XY-scanner, MO: microscope objective, S: sample, TS: translation stage, P: confocal pinhole, PMT1:
photomultiplier.

    The hollow fibre we used had a 120µm total diameter and a 10µm hollow core, which simulates a single
rectilinear blood capillary. We used roughly 2cm-long fibers, the core of which was filled with Rhodamine
by capillarity and sealed with glue at both extremities. In order to have a maximum fluorescence, without
any quenching problems, various tests were performed with Rhodamine 6G and Rhodamine B in ethanol with
concentration varying from 10−5 to 10−1 mol/l. The highest fluorescence was recorded with Rhodamine B
for 10−2 mol/l and for a wavelength equal to 850nm. This concentration and wavelength were kept for all the
two-photons experiments presented in this work.
    A couple of Zebra Finches with an average weight of 12g were sacrificed with a lethal intra-muscular injection
of pentobarbital. Their head were plucked a couple of days days before the death. The blood was removed from
the vascular system by cutting aorta just after the death of the animal in order to avoid staining of the bone
or skin tissues with blood during the dissection. Approximately 4mm×4mm pieces of skull were taken between
the dorsal and the caudal parts of the bird’s head and along the sagittal suture. These skull samples were fixed
with a 4% paraformaldehyde solution.
    As described on figure 1-(b), the fiber was set on a 100µm deep rectilinear furrow carved on a plexiglas
half-cylinder whose curvature radius is equal to 7mm, which is the average curvature of the Zebra Finches head.
In order to prevent the filling of the skull’s pneumatic cavity with water, the immersion medium we used for the
microscope objective was a transparent gel, mainly composed of water (echography gel). This gel also held the
skull sample and prevented it from sliding during the recording of the image stacks.

2.2. Reflectance mode confocal experiments
In the second set of experiments, i.e. for reflectance mode confocal measurements, the dichroic beam splitter
DBS1 is removed and the BS beam splitter is replaced with a 30/70 beam splitter (30% of reflection and
70% of transmission). The microscope objective that was used is a long working distance water-immersion
LEICA objective (HCX APO L U-V-I 40× NA-0.8). The pinhole was set to 21.27µm which corresponds to
the 40× magnified size of the inner Airy pattern at the focus. In these conditions, the light collected by the
PMT1 photomultiplier is proportionnal to the light backreflected by the sample. For safety reasons, our LEICA
confocal system is designed to prevent NIR radiations from entering the photomultipliers of the confocal head.
Thus, these experiments were performed with a wavelength of 710nm in order to be as close as possible to the
two-photon experimental conditions described in part 2.1.
    In reflectance mode confocal configuration, the amount of reflected light collected by the microscope objective
mainly comes from the focus and is linked to the backscattering properties of a thin slice in the sample. This
reflectivity decreases exponentially as the focus penetrates inside a scattering samples.15 The reflectivity decrease
as a function of depth inside the sample can be represented by the following equation:

                                               R(z) = ρ exp(−µz)                                               (1)

    where R(z) represents the reflectivity of the sample at a distance z from the sample surface. ρ represents
then the reflectivity on the surface of the sample and µ the attenuation coefficient. These coefficients are
linked to the scattering coefficient µs and the anisotropy g, which would then lead to the reduced scattering
coefficient µ′ = µs (1 − g). The coefficients ρ and µ are not independently linked to the scattering coefficients µs
            s
and g. Indeed, for example, when the anisotropy g decreases, there is less light that is backscattered, which
reduces ρ, as well as the attenuation coefficient µ. Monte Carlo simulations of the scattering of light inside
the sample are needed to find the couple (µs , g) corresponding to a couple (ρ, µ). We have not performed such
simulations for the moment. However, as a first step, our goal here is to compare the reflectivity and attenuation
coefficient of fresh tissues with the paraformaldehyde-fixed tissues we used in the previous experiments with
Rhodamine B filled hollow fiber.
    We realized 512×512×100 image stacks. The total transversal field was 750×750µm-wide and the height of
a stack varied between 100 and 400µm depending on the sample roughness. We then plotted as a function of z
(depth in the sample) the average reflectivity in a 20×20µm region of interest (ROI), which corresponds roughly
to an average on 14×14 pixels. The typical z-profiles that were obtained are represented on Figure 2 for various
ROI sizes. This figure shows the profile we obtained on two different parts of the sample (A and B) and with
ROI sizes varying from 10×10µm to 40×40µm. As it can be seen on B, the decrease can be dependent on the
ROI size. This was observed when the sample is locally not perpendicular to the optical axis. The reflectivity
variations are then smoothed and the maximum reflectivity is not representative of the theoretical exponential
decay. For this reason, the ROI were selected on part of the stacks where the sample was quite perpendicular to
the optical axis. According to these measurements, the 20×20µm size of the ROI was chosen as it seemed to be
the best compromise to have a representative position of the reflectivity maximum as well as enough pixels to
make a significant averaging that prevents the experimental curves from oscillating to much.
    These measurements and exploitations were performed on skull and skin samples. A first set of measurement
were carried out on samples freshly taken just after the death of the animal (see procedure in 2.1) and kept in a
petri dish filled with a Phosphate Buffer Saline (PBS) solution, which was then used as the immersion medium
for the microscope objective. In these conditions, five image stacks were recorded on various parts of one sample
 £
                                                                              &% ¥
                                       $        '               (
                                     "#                                       &%   ¡
                                   ¢ "!                                       &%   ¦
                                                                            %   ¢


                                   ¡ 


                                        ¤              ¥¤               ¡¤          ¦¤ 
                                                              ©©¨ §


Figure 2. Reflectivity variations as a function of depth z in the sample. A and B sets represent the exponential decay on
two different parts of the sample. Each curve represents an average on squared parts of the image. Various sizes of these
parts have been tested in order to determine the best compromise between averaging and smoothing of the maximum (see
text for details).


(skin or skull) and 10 different ROI were considered. Immediately after that, each sample was rinsed with PBS
and kept overnight in a 4% paraformaldehyde solution. Five images stacks were then recorded on the fixed
samples and 10 ROI were considered on each stack. Hence, we worked on one fresh (and then fixed) skull sample
and one fresh (and then fixed) skin sample. On each sample, 5 different stacks were performed and 10 ROI were
considered on each stack, which represents 50 exponential decay measurements per sample.
    Finally, it was necessary to calibrate the system to provide a true value of the reflectivity. In order to do
that, all the settings of the microscope system were kept equal during all the experiments and a calibration stack
was performed on a glass plate of known refractive index. Only the power of the laser were changed from one
stack to another and taken into account in the calibration of the curves.

                                     3. RESULTS AND DISCUSSION
3.1. Two-photon imaging experiments
Firstly, several stacks were recorded on skull samples, using the endogenous two-photon fluorescence of the
samples. This was carried out to characterize the skull structure and is represented on Figure 3. Thanks to these
images, we found that the average radius of trabeculae is 50µm and there is about 12 trabeculae per squared
millimeter. Seen from above, this means that 10% of the skull area is occupied by trabeculae. Previous histology
studies performed in ENES laboratory indicates that the overall thickness of the skull lies between 250 and 350µm
in this part of the skull, and the thickness of the internal and external cortical bones lies between 25µm and 50µm.
   Secondly, stacks were recorded with the hollow core fiber filled with Rhodamine B. An image sequence taken
from a stack is represented on Figure 4. On this sequence the endogenous fluorescence of the external cortical
bone and trabeculae is first observed, then, a distorted and enlarged image of the Rhodamine B filled core
can be observed as the focus is moved inside the sample. Thanks to the electro-optical modulator, intensity
compensation was used as the focus penetrates the medium in order to compensate for the intensity decrease of
the excitation beam due to scattering.
   Four different skull samples were used to carry out two-photon imaging of the hollow-core fiber through
the skull. The average z-projections of the stacks are represented on Figure 5. For each sample, both the
red/orange/yellow fluorescence image (λ  550nm) and the blue/green fluorescence image (λ  550nm) are
presented. As it can be seen, the fluorescence of Rhodamine B can be easily distinguished from the endogenous
fluorescence of the bone because the fluorescence of Rhodamine B is located in the yellow/orange/red part of the
spectrum, with a maximum around 575nm, while the endogenous fluorescence of the bone seems to be extending
uniformly from blue to red parts of the spectrum. (a) and (b) experiments were performed with skull samples
Figure 3. Two-photon images of Zebra Finch skull (projected stacks). On the left: 1mm slice seen from the side. On
the right: projected stack seen from above. In both images trabeculae repartition and dimensions can be observed.


Figure 4. Two-photon fluorescence image sequence taken from one stack. First, the endogenous fluorescence of the
external cortical bone surface and the trabeculae is observed and then the fluorescence coming from the Rhodamine B
filled hollow fiber is observed, giving a distorted and enlarged image of the fiber core due to scattering in cortical bones
and trabeculae.

as described previously while (c) and (d) experiments were performed with thinner skull samples with only one
cortical layer, roughly 100µm-thick, that were taken from younger birds. In (a), (b) and (c), the ×20 objective
was used, while the ×40 objective was used in (d).
    In order to evaluate the lateral and axial extent of the fiber image, x-projections of the previous stacks are
presented on Figure 6 (x represents then the axial direction of the fiber). Each of these stacks was obtained by
selecting only 200µm-thick slices along the x axis. These slices were selected in particular parts of the image
where the fiber image was not too distorted by the scattering in trabeculae.
   Lateral and axial profiles of the fluorescence radiated from the Rhodamine B filled hollow core of the fiber
are represented on Figure 7. As it can be seen, the image of the fiber core is enlarged by the scattering. The
axial and lateral full width at half maximum (FWHM) of the fluorescence spatial repartition is summed up in
table 1, as well as the position of the maximum of fluorescence from the skull external cortical part.
    As a conclusion, these two-photon imaging studies indicate that it is possible to collect fluorescence at depths
close to 1mm through the skull of Zebra Finches. However, from experiments (a) and (b), it is clear that this
fluorescence was collected mainly between trabeculae. As these trabeculae cover only 10% of the skull area
(seen from above), it remains possible to collect an important part of the fluorescence. The distorsion and the
enlargement of the image of the fiber remains problematic, especially in the axial direction of the beam, with
(a)                   (b)                   (c)                   (d)


Figure 5. Two-photon images of the hollow core fiber through various skull samples. Each image is an average z-
projection of the stack. The first line contains the images obtained with red/orange/yellow fluorescence (λ  550nm)
while the second line represents the images obtained with blue/green fluorescence (λ  550nm). As it can be seen, (c) and
(d) stacks were performed with skull samples having very few or no trabeculae. These samples were taken from younger
birds and were approximately 100µm-thick and only composed of one single cortical bone.


      Figure 6. x-projected stacks of the previously presented stacks (where x is the axial direction of the fiber).


an axial FWHM of the fluorescence repartition greater than 1mm in case of experiment (a). As it can be seen
from experiment (c) and (d), a more moderate enlargement of 50-70µm in the lateral direction and 400µm in
the axial direction can be achieved at depths greater than 700µm if working with younger Zebra Finches.
1.0                                                           (a)
        Normalized Fluorescence                                                                 (b)                                                                                        (a)


                                                                                                               Normalized Fluorescence
                                                                                                (c)                                      1.0                                               (b)
                                                                                                                                                                                           (c)
                                                                                                (d)
                                                                                                                                                                                           (d)


                                  0.5
                                                                                                                                         0.5


                                                                                                                                         0.0
                                  0.0
                                        −0.3   −0.2   −0.1       0.0         0.1          0.2         0.3                                      0.0               0.5                 1.0         1.5

                                                              y (mm)                                                                                                        z (mm)


Figure 7. Lateral (left) and axial (right) profiles of the fluorescence radiated by the Rhodamine B filled hollow core fiber.

Table 1. Summary of the data extracted from the x-projection represented on Figure 6 (The position column is the
position of the maximum from the skull surface).

                                                       Experiment              Lateral FWHM                                              Axial FWHM              Position
                                                          (a)                      141µm                                                    1.2mm                0.71mm
                                                          (b)                      205µm                                                   0.98mm                0.36mm
                                                          (c)                       53µm                                                   0.41mm                0.74mm
                                                          (d)                       76µm                                                   0.36mm                0.78mm


3.2. Reflectance mode confocal measurements
As described in section 2.2, reflectance mode confocal measurements were performed on fresh and fixed skull and
skin samples. Each reflectivity curve has been fitted with the theoretical expression R(z) = ρ exp(−µz). The
least squared fitting method was used to find the values of ρ and µ. Figure 8 represents the experimental curves
and the theoretical fits for ten ROI taken from one stack recorded on a fixed skin sample. All the points were
taken into account for the fit, starting from the maximum of the reflectivity curves.

                                                             rho = 0.00315         rho = 0.00290       rho = 0.00283                             rho = 0.00178   rho = 0.00255
                                                             mu = 73.8             mu = 49.9           mu = 56.4                                 mu = 49.4       mu = 49.9
                                                             R² = 0.998            R² = 0.99           R² = 0.997                                R² = 0.997      R² = 0.996


                                                             rho = 0.00209         rho = 0.00314       rho = 0.00377                             rho = 0.0025    rho = 0.0029
                                                             mu = 51.5             mu = 56.6           mu = 55.6                                 mu = 50.6       mu = 58.1
                                                             R² = 0.997            R² = 0.996          R² = 0.995                                R² = 0.996      R² = 0.997


Figure 8. Reflectivity curves measured as a function of the depth in a fixed skin sample. We present here 10 measurements
carried out on 20×20µm zones spread on various parts of one 512×512×100-stack. Experimental points (circles) are fitted
with the theoretical reflectivity function R(z) = ρ exp(−µz) (lines). The fitted values of ρ and µ (in mm−1 ) are given
here as well as the correlation coefficient R2 .

   All the fitted values of ρ and µ were compiled and the result can be observed in Figure 9. This figure
represents the box and whiskers plots for the four types of sample (fixed and fresh skull and skin samples). As it
can be seen, the coefficients for fresh and fixed skull samples are obviously significantly different. As this is less
obvious for the skin samples, a Mann-Whitney test was carried out, indicating that the data are significantly
different with a probability of equality inferior to 10−6 and 10−11 (see Figure 9). According to these data, no
conclusion can be made concerning the value of the scattering coefficient µs and the anisotropy g, because this
requires Monte Carlo simulations that are still in process. However, it is clear that the attenuation coefficients µ
and reflectivity on surface ρ are different for fixed and fresh samples. These results will be very useful as we are
going to perform simulations of the diffusion in our situation and try to optimize our measurements for in vivo
studies.

                                  Coefficients for skull samples                                 Coefficients for skin samples


                                                                                                                        Mann−Whitney: P = 1e−06
                 fixed                                                           fixed

                 fresh                                                           fresh


                         0.0000           0.0005         0.0010         0.0015           0.000       0.005     0.010        0.015         0.020

                                                   ρ                                                                ρ

                                                                                                                        Mann−Whitney: P = 6e−12
                 fixed                                                           fixed

                 fresh                                                           fresh


                           0         50      100       150        200   250               0          50       100        150        200

                                              µ − mm−1                                                       µ − mm−1


Figure 9. Box and whiskers plots of the coefficients ρ and µ measured on skin and skull samples. The fresh samples were
kept few minutes to several hours after the death of the bird in PBS(Phosphate Buffer Saline) solution, while the other
ones were paraformaldehyde-fixed samples.


                                           4. CONCLUSION  PERSPECTIVES
Monitoring the brain activation on small songbirds is crucial to understand the neuro-mechanisms that underlie
vocal recognition, emission and learning. The understanding of these complex mechanisms requires a multilevel
approach as well as the use of various complementary monitoring methods. Two-photon imaging has been recently
used for various in vivo studies, demonstrating its potential for brain activation monitoring, unless craniotomy
or thinning of the skull is required. In the particular case of fragile songbirds, craniotomy should be avoided.
Fortunately, we have seen that the skull structure of birds is mostly composed of air and of two thin cortical
bone layers that are quite transparent. The skin itself is quite thin (around 100µm-thick). All these conditions
can also be enhanced by the use of younger birds. In this work, we have showed that the fluorescence of a thin
fiber filled with Rhodamine B can be clearly seen through the skull with a conventional multiphoton microscopy
system. Unfortunately the enlargement of the incident beam is quite important, reaching 200µm in lateral
direction and roughly 1mm in the axial direction. Moreover, the skin and other intracranial tissues were not
present in our simple configuration. Solutions could be found with the use of younger birds, because in this case,
we have seen that the resolution can be kept to a reasonable value of 50µm in the lateral direction and 400µm in
the axial direction. New fluorophores optimized for two-photon absorption17 could be used, as their two-photon
absorption cross section can reach 2000GM, which is ten times the cross section of Rhodamine B.18 As it has
been previoulsy demonstrated,7, 19 the use of a regenerative amplifier is an interesting way to increase the imaging
depth in biological samples. It remains obvious that a compromise has to be found between the resolution and the
imaging depth we require. In our case, simulations of the scattering as well as further experiments are necessary
to investigate if the quite peculiar structure of the bird’s skull will not affect too much our resolution and to find
experimental conditions and approaches that would be likely to enhance this resolution, especially the axial one.
That was the reason why complementary works were presented here as well, concerning the measurement of the
scattering coefficients of the skull and skin, which will be useful for future simulations. Particularly, it has been
showed that the exponential decay of backreflected light is different for fresh and for fixed sample, and this fact
must be taken into account before attempting in vivo experiments.
ACKNOWLEDGMENTS
The authors would like to thank the French national agency for research (ANR) for financial support and
Sabine Palle, technical director of the confocal microscopy platform of University Jean-Monnet (PPF microscopie
confocale multiphotonique).

                                             REFERENCES
 1. C. Vignal, N. Mathevon, and S. Mottin, “Audience drives male songbird response to partner’s voice,”
    Nature 430, pp. 448–451, 2004.
 2. A. Van der Linden, M. Verhoye, V. Van Meir, I. Tindemans, M. Eens, P. Aabsi, and J. Balthazart, “In
    vivo manganese-enhanced magnetic resonance imaging reveals connections and functional properties of the
    songbird vocal control system,” Neuroscience 112, pp. 467–474, 2002.
 3. N. Plesnila, C. Putz, M. Rinecker, J. Wiezorreck, L. Schleinkofer, A. Goetz, and W. Kuebler, “Measurement
    of absolute values of hemoglobin oxygenation in the brain of small rodents by near infrared reflection
    spectrophotometry,” J. Neurosci. Methods 114, pp. 107–117, 2002.
 4. J. Culver, T. Durduran, D. Furuya, C. Cheung, J. Greenberg, and G. Yodh, “Diffuse optical tomography
    of cerebral blood flow oxygenation and metabolism in rat during focal ischemia,” J. Cereb. Blood Flow
    Metab. 23, pp. 911–924, 2003.
 5. F. Helmchen and W. Denk, “Deep tissue two-photon microscopy,” Nature Methods 12, pp. 932–940, 2005.
 6. M. Oheim, E. Beaurepaire, E. Chaigneau, J. Mertz, and S. Charpak, “Two-photon microscopy in brain
    tissue: parameters influencing the imaging depth,” Journal of Neuroscience Methods 111, pp. 29–37, 2001.
 7. P. Theer, M. Hasan, and W. Denk, “Two-photon imaging to a depth of 1000m in living brains by use of
    ti:al2o3 regenerative amplifier,” Optics Letters 28, pp. 1022–1024, 2003.
 8. F. Helmchen, M. Fee, D. Tank, and W. Denk, “A miniature head-mounted two-photon microscope: High
    resolution brain imaging in freely moving animals,” Neuron 31, pp. 903–912, 2001.
 9. E. Yoder, “In vivo microscopy of the mouse brain using multiphoton laser scanning techniques,” in Proceed-
    ings of SPIE, A. Periasamy and P. T. So, eds., Multiphoton Microscopy in the Biomedical Sciences II 4620,
    2002.
10. E. Chaigneau, M. Oheim, E. Audinat, and S. Charpak, “Two-photon imaging of capillary blood flow in
    olfactory bulb glomeruli,” PNAS 100, pp. 13081–13086, 2003.
11. M. Levene, D. Dombeck, K. Kasischke, R. Molloy, and W. Webb, “In vivo multiphoton microscopy of deep
    brain tissue,” J. Neurophysiol. 91, pp. 1908–1912, 2004.
12. J. Jung, A. Mehta, R. Stepnoski, and M. Schnitzer, “In vivo mammalian brain imaging using one and
    two-photon fluorescence microscopy,” J. Neurophysiol. 92, pp. 3121–3133, 2004.
13. G. Nase, P. Helm, T. Reppen, and O. Ottersen, “A multiphoton laser scanning microscope setup for tran-
    scranial in vivo brain imaging on mice,” Review of scientific instruments 76, pp. 123702–1–123702–5, 2005.
14. K. Takahashi, R. Hishida, Y. Kubota, M. Kudoh, S. Takahashi, and K. Shibuki, “Transcranial fluorescence
    imaging of auditory cortical plasticity regulated by acoustic environments in mice,” European Journal of
    Neuroscience 23, pp. 1365–1376, 2006.
15. S. Jacques and D. Gareau, “Confocal microscopy measures tissue optical preoperties,” in Saratov Internet
    Conference, 2005.
16. S. Jacques and R. Samathan, “Optical properties of mutant vs wildtype mouse skin measured by reflectance-
    mode confocal scanning laser microscopy,” in Saratov Internet Conference, 2006.
17. C. L. Droumaguet, O. Mongin, M. Werts, and M. Blanchard-Desce, “Towards ”smart” multiphoton flu-
    orophores: strongly solvatochromic probes for two-photon sensing of micropolarity,” Chem. Commun. ,
    pp. 2802–2804, 2005.
18. C. Xu and W. W. Webb, “Measurement of two-photon excitation cross sections of molecular fluorophores
    with data from 690 to 1050nm,” J. Opt. Soc. Am. B 13, pp. 481–491, 1996.
19. E. Beaurepaire, M. Oheim, and J. Mertz, “Ultra-deep two-photon fluorescence excitation in turbid media,”
    Optics Communications 188, pp. 25–29, 2001.

Mais conteúdo relacionado

Mais procurados

Positioning system in the brain the brain’s navigational place [autosaved]
Positioning system in the brain the brain’s navigational place [autosaved]Positioning system in the brain the brain’s navigational place [autosaved]
Positioning system in the brain the brain’s navigational place [autosaved]adityadayana
 
Hippocampal Place Cells in Echolocating Bats
Hippocampal Place Cells in Echolocating Bats Hippocampal Place Cells in Echolocating Bats
Hippocampal Place Cells in Echolocating Bats stanfordneuro
 
Positionig system of the brain(noble prize in medicine 2014)
Positionig system of the brain(noble prize in medicine 2014) Positionig system of the brain(noble prize in medicine 2014)
Positionig system of the brain(noble prize in medicine 2014) amir mahmodzadeh
 
Measuring visual acuity and contrast sensitivity by optomotor reflex in rodents
Measuring visual acuity and contrast sensitivity by optomotor reflex in rodentsMeasuring visual acuity and contrast sensitivity by optomotor reflex in rodents
Measuring visual acuity and contrast sensitivity by optomotor reflex in rodentsInsideScientific
 
Night vision
Night visionNight vision
Night visionsowmimano
 
BAAI Conference 2021: The Thousand Brains Theory - A Roadmap for Creating Mac...
BAAI Conference 2021: The Thousand Brains Theory - A Roadmap for Creating Mac...BAAI Conference 2021: The Thousand Brains Theory - A Roadmap for Creating Mac...
BAAI Conference 2021: The Thousand Brains Theory - A Roadmap for Creating Mac...Numenta
 
Cnshubelandwiesel
CnshubelandwieselCnshubelandwiesel
Cnshubelandwieselstarfish57
 
Can we extract a mind from a plastic-embedded brain? - Kenneth Hayworth - H+ ...
Can we extract a mind from a plastic-embedded brain? - Kenneth Hayworth - H+ ...Can we extract a mind from a plastic-embedded brain? - Kenneth Hayworth - H+ ...
Can we extract a mind from a plastic-embedded brain? - Kenneth Hayworth - H+ ...Humanity Plus
 
Art of Neuroscience 2017 - Selected Submissions
Art of Neuroscience 2017 - Selected SubmissionsArt of Neuroscience 2017 - Selected Submissions
Art of Neuroscience 2017 - Selected SubmissionsArt of Neuroscience
 
Mounika seminar doc
Mounika seminar docMounika seminar doc
Mounika seminar docsrikruthi9
 
Trauma management during tragic years of lebanon part ii
Trauma management during tragic years of lebanon part iiTrauma management during tragic years of lebanon part ii
Trauma management during tragic years of lebanon part iiAnis Baraka
 
Technological advancements in sci vis
Technological advancements in sci visTechnological advancements in sci vis
Technological advancements in sci visCharles Flynt
 
Art of Neuroscience 2017 - Team Favorites
Art of Neuroscience 2017 - Team FavoritesArt of Neuroscience 2017 - Team Favorites
Art of Neuroscience 2017 - Team FavoritesArt of Neuroscience
 
Vicarious Systems at Singularity Summit 2011
Vicarious Systems at Singularity Summit 2011Vicarious Systems at Singularity Summit 2011
Vicarious Systems at Singularity Summit 2011Scott Brown
 
Integrated Optofluidic device to study Interaction of particle or solution wi...
Integrated Optofluidic device to study Interaction of particle or solution wi...Integrated Optofluidic device to study Interaction of particle or solution wi...
Integrated Optofluidic device to study Interaction of particle or solution wi...prathul Nath
 

Mais procurados (20)

Positioning system in the brain the brain’s navigational place [autosaved]
Positioning system in the brain the brain’s navigational place [autosaved]Positioning system in the brain the brain’s navigational place [autosaved]
Positioning system in the brain the brain’s navigational place [autosaved]
 
Hippocampal Place Cells in Echolocating Bats
Hippocampal Place Cells in Echolocating Bats Hippocampal Place Cells in Echolocating Bats
Hippocampal Place Cells in Echolocating Bats
 
AP BIO CH. 6.1-6.2
AP BIO CH. 6.1-6.2AP BIO CH. 6.1-6.2
AP BIO CH. 6.1-6.2
 
Positionig system of the brain(noble prize in medicine 2014)
Positionig system of the brain(noble prize in medicine 2014) Positionig system of the brain(noble prize in medicine 2014)
Positionig system of the brain(noble prize in medicine 2014)
 
Measuring visual acuity and contrast sensitivity by optomotor reflex in rodents
Measuring visual acuity and contrast sensitivity by optomotor reflex in rodentsMeasuring visual acuity and contrast sensitivity by optomotor reflex in rodents
Measuring visual acuity and contrast sensitivity by optomotor reflex in rodents
 
Night vision
Night visionNight vision
Night vision
 
BAAI Conference 2021: The Thousand Brains Theory - A Roadmap for Creating Mac...
BAAI Conference 2021: The Thousand Brains Theory - A Roadmap for Creating Mac...BAAI Conference 2021: The Thousand Brains Theory - A Roadmap for Creating Mac...
BAAI Conference 2021: The Thousand Brains Theory - A Roadmap for Creating Mac...
 
Bernroider
BernroiderBernroider
Bernroider
 
Cnshubelandwiesel
CnshubelandwieselCnshubelandwiesel
Cnshubelandwiesel
 
K0966468
K0966468K0966468
K0966468
 
Can we extract a mind from a plastic-embedded brain? - Kenneth Hayworth - H+ ...
Can we extract a mind from a plastic-embedded brain? - Kenneth Hayworth - H+ ...Can we extract a mind from a plastic-embedded brain? - Kenneth Hayworth - H+ ...
Can we extract a mind from a plastic-embedded brain? - Kenneth Hayworth - H+ ...
 
Art of Neuroscience 2017 - Selected Submissions
Art of Neuroscience 2017 - Selected SubmissionsArt of Neuroscience 2017 - Selected Submissions
Art of Neuroscience 2017 - Selected Submissions
 
Nrgastro.2011.167
Nrgastro.2011.167Nrgastro.2011.167
Nrgastro.2011.167
 
Night vision
Night visionNight vision
Night vision
 
Mounika seminar doc
Mounika seminar docMounika seminar doc
Mounika seminar doc
 
Trauma management during tragic years of lebanon part ii
Trauma management during tragic years of lebanon part iiTrauma management during tragic years of lebanon part ii
Trauma management during tragic years of lebanon part ii
 
Technological advancements in sci vis
Technological advancements in sci visTechnological advancements in sci vis
Technological advancements in sci vis
 
Art of Neuroscience 2017 - Team Favorites
Art of Neuroscience 2017 - Team FavoritesArt of Neuroscience 2017 - Team Favorites
Art of Neuroscience 2017 - Team Favorites
 
Vicarious Systems at Singularity Summit 2011
Vicarious Systems at Singularity Summit 2011Vicarious Systems at Singularity Summit 2011
Vicarious Systems at Singularity Summit 2011
 
Integrated Optofluidic device to study Interaction of particle or solution wi...
Integrated Optofluidic device to study Interaction of particle or solution wi...Integrated Optofluidic device to study Interaction of particle or solution wi...
Integrated Optofluidic device to study Interaction of particle or solution wi...
 

Destaque

mottin-2011-Jcbfm-nature-publishing
mottin-2011-Jcbfm-nature-publishingmottin-2011-Jcbfm-nature-publishing
mottin-2011-Jcbfm-nature-publishingStéphane MOTTIN
 
Mottin-jouvet-1997-neuroscience
Mottin-jouvet-1997-neuroscienceMottin-jouvet-1997-neuroscience
Mottin-jouvet-1997-neuroscienceStéphane MOTTIN
 
sturdy-Vignal-mathevon-mottin-2004 nature newsandviews
sturdy-Vignal-mathevon-mottin-2004 nature newsandviewssturdy-Vignal-mathevon-mottin-2004 nature newsandviews
sturdy-Vignal-mathevon-mottin-2004 nature newsandviewsStéphane MOTTIN
 
Vignal-mottin-2008, phys medbiol-highlights 2008
Vignal-mottin-2008, phys medbiol-highlights 2008Vignal-mottin-2008, phys medbiol-highlights 2008
Vignal-mottin-2008, phys medbiol-highlights 2008Stéphane MOTTIN
 
Mottin panasenko-2011-journal plos-one_0014350
Mottin panasenko-2011-journal plos-one_0014350Mottin panasenko-2011-journal plos-one_0014350
Mottin panasenko-2011-journal plos-one_0014350Stéphane MOTTIN
 
Lawrence pozzetto-mottin virology-2009
Lawrence pozzetto-mottin virology-2009Lawrence pozzetto-mottin virology-2009
Lawrence pozzetto-mottin virology-2009Stéphane MOTTIN
 
Mottin laporte-cespuglio-2003
Mottin laporte-cespuglio-2003Mottin laporte-cespuglio-2003
Mottin laporte-cespuglio-2003Stéphane MOTTIN
 
Guillet mottin 2005 spie_ 5964
Guillet mottin 2005 spie_ 5964Guillet mottin 2005 spie_ 5964
Guillet mottin 2005 spie_ 5964Stéphane MOTTIN
 

Destaque (8)

mottin-2011-Jcbfm-nature-publishing
mottin-2011-Jcbfm-nature-publishingmottin-2011-Jcbfm-nature-publishing
mottin-2011-Jcbfm-nature-publishing
 
Mottin-jouvet-1997-neuroscience
Mottin-jouvet-1997-neuroscienceMottin-jouvet-1997-neuroscience
Mottin-jouvet-1997-neuroscience
 
sturdy-Vignal-mathevon-mottin-2004 nature newsandviews
sturdy-Vignal-mathevon-mottin-2004 nature newsandviewssturdy-Vignal-mathevon-mottin-2004 nature newsandviews
sturdy-Vignal-mathevon-mottin-2004 nature newsandviews
 
Vignal-mottin-2008, phys medbiol-highlights 2008
Vignal-mottin-2008, phys medbiol-highlights 2008Vignal-mottin-2008, phys medbiol-highlights 2008
Vignal-mottin-2008, phys medbiol-highlights 2008
 
Mottin panasenko-2011-journal plos-one_0014350
Mottin panasenko-2011-journal plos-one_0014350Mottin panasenko-2011-journal plos-one_0014350
Mottin panasenko-2011-journal plos-one_0014350
 
Lawrence pozzetto-mottin virology-2009
Lawrence pozzetto-mottin virology-2009Lawrence pozzetto-mottin virology-2009
Lawrence pozzetto-mottin virology-2009
 
Mottin laporte-cespuglio-2003
Mottin laporte-cespuglio-2003Mottin laporte-cespuglio-2003
Mottin laporte-cespuglio-2003
 
Guillet mottin 2005 spie_ 5964
Guillet mottin 2005 spie_ 5964Guillet mottin 2005 spie_ 5964
Guillet mottin 2005 spie_ 5964
 

Semelhante a Darine mottin 2007_6442-57_spie bios

White Paper: In vivo Fiberoptic Fluorescence Microscopy in freely behaving mice
White Paper: In vivo Fiberoptic Fluorescence Microscopy in freely behaving miceWhite Paper: In vivo Fiberoptic Fluorescence Microscopy in freely behaving mice
White Paper: In vivo Fiberoptic Fluorescence Microscopy in freely behaving miceFUJIFILM VisualSonics Inc.
 
A monkey model of auditory scene analysis
A monkey model of auditory scene analysisA monkey model of auditory scene analysis
A monkey model of auditory scene analysisPradeepD32
 
Optical propagation of blue LED light in brain tissue and Parylene-C used in ...
Optical propagation of blue LED light in brain tissue and Parylene-C used in ...Optical propagation of blue LED light in brain tissue and Parylene-C used in ...
Optical propagation of blue LED light in brain tissue and Parylene-C used in ...Manjunath Pujar
 
Cellvizio® LAB Fibered Fluorescence Microscope and Microdialysis Research
Cellvizio®  LAB Fibered Fluorescence Microscope and  Microdialysis Research Cellvizio®  LAB Fibered Fluorescence Microscope and  Microdialysis Research
Cellvizio® LAB Fibered Fluorescence Microscope and Microdialysis Research FUJIFILM VisualSonics Inc.
 
OCT cornea dogs and cats
OCT cornea dogs and catsOCT cornea dogs and cats
OCT cornea dogs and catsFrank FAMOSE
 
Blue brain seminar report
Blue brain seminar reportBlue brain seminar report
Blue brain seminar reportSuryoday Nth
 
Micromanipulation
Micromanipulation Micromanipulation
Micromanipulation Akshay More
 
Acquiring Practical Population Estimates of Neurons Through Design-Based Ster...
Acquiring Practical Population Estimates of Neurons Through Design-Based Ster...Acquiring Practical Population Estimates of Neurons Through Design-Based Ster...
Acquiring Practical Population Estimates of Neurons Through Design-Based Ster...EPL, Inc.
 
Brain machine-interface
Brain machine-interfaceBrain machine-interface
Brain machine-interfaceVysakh Sharma
 
Large scalespikingnetworkanalysis
Large scalespikingnetworkanalysisLarge scalespikingnetworkanalysis
Large scalespikingnetworkanalysisHassan Nasser
 
Leiwe_et_al2016_MouseLGN
Leiwe_et_al2016_MouseLGNLeiwe_et_al2016_MouseLGN
Leiwe_et_al2016_MouseLGNMarcus Leiwe
 
Functional Ultrasound (fUS) Imaging in the Brain of Awake Behaving Mice
Functional Ultrasound (fUS) Imaging in the Brain of Awake Behaving MiceFunctional Ultrasound (fUS) Imaging in the Brain of Awake Behaving Mice
Functional Ultrasound (fUS) Imaging in the Brain of Awake Behaving MiceInsideScientific
 

Semelhante a Darine mottin 2007_6442-57_spie bios (20)

White Paper: In vivo Fiberoptic Fluorescence Microscopy in freely behaving mice
White Paper: In vivo Fiberoptic Fluorescence Microscopy in freely behaving miceWhite Paper: In vivo Fiberoptic Fluorescence Microscopy in freely behaving mice
White Paper: In vivo Fiberoptic Fluorescence Microscopy in freely behaving mice
 
A monkey model of auditory scene analysis
A monkey model of auditory scene analysisA monkey model of auditory scene analysis
A monkey model of auditory scene analysis
 
Optical propagation of blue LED light in brain tissue and Parylene-C used in ...
Optical propagation of blue LED light in brain tissue and Parylene-C used in ...Optical propagation of blue LED light in brain tissue and Parylene-C used in ...
Optical propagation of blue LED light in brain tissue and Parylene-C used in ...
 
Cellvizio® LAB Fibered Fluorescence Microscope and Microdialysis Research
Cellvizio®  LAB Fibered Fluorescence Microscope and  Microdialysis Research Cellvizio®  LAB Fibered Fluorescence Microscope and  Microdialysis Research
Cellvizio® LAB Fibered Fluorescence Microscope and Microdialysis Research
 
Nencki321 day2
Nencki321 day2Nencki321 day2
Nencki321 day2
 
Whole brain optical imaging
Whole brain optical imagingWhole brain optical imaging
Whole brain optical imaging
 
OPTOGENETICS
OPTOGENETICSOPTOGENETICS
OPTOGENETICS
 
OCT cornea dogs and cats
OCT cornea dogs and catsOCT cornea dogs and cats
OCT cornea dogs and cats
 
Blue brain seminar report
Blue brain seminar reportBlue brain seminar report
Blue brain seminar report
 
Neuroprosthetics
NeuroprostheticsNeuroprosthetics
Neuroprosthetics
 
blue brain
blue brainblue brain
blue brain
 
OCT in Ophthalmology
OCT in OphthalmologyOCT in Ophthalmology
OCT in Ophthalmology
 
Micromanipulation
Micromanipulation Micromanipulation
Micromanipulation
 
Optogenetics
OptogeneticsOptogenetics
Optogenetics
 
Acquiring Practical Population Estimates of Neurons Through Design-Based Ster...
Acquiring Practical Population Estimates of Neurons Through Design-Based Ster...Acquiring Practical Population Estimates of Neurons Through Design-Based Ster...
Acquiring Practical Population Estimates of Neurons Through Design-Based Ster...
 
Brain machine-interface
Brain machine-interfaceBrain machine-interface
Brain machine-interface
 
Large scalespikingnetworkanalysis
Large scalespikingnetworkanalysisLarge scalespikingnetworkanalysis
Large scalespikingnetworkanalysis
 
Blue Brain
Blue BrainBlue Brain
Blue Brain
 
Leiwe_et_al2016_MouseLGN
Leiwe_et_al2016_MouseLGNLeiwe_et_al2016_MouseLGN
Leiwe_et_al2016_MouseLGN
 
Functional Ultrasound (fUS) Imaging in the Brain of Awake Behaving Mice
Functional Ultrasound (fUS) Imaging in the Brain of Awake Behaving MiceFunctional Ultrasound (fUS) Imaging in the Brain of Awake Behaving Mice
Functional Ultrasound (fUS) Imaging in the Brain of Awake Behaving Mice
 

Último

Unit 3 Emotional Intelligence and Spiritual Intelligence.pdf
Unit 3 Emotional Intelligence and Spiritual Intelligence.pdfUnit 3 Emotional Intelligence and Spiritual Intelligence.pdf
Unit 3 Emotional Intelligence and Spiritual Intelligence.pdfDr Vijay Vishwakarma
 
How to Create and Manage Wizard in Odoo 17
How to Create and Manage Wizard in Odoo 17How to Create and Manage Wizard in Odoo 17
How to Create and Manage Wizard in Odoo 17Celine George
 
ICT role in 21st century education and it's challenges.
ICT role in 21st century education and it's challenges.ICT role in 21st century education and it's challenges.
ICT role in 21st century education and it's challenges.MaryamAhmad92
 
HMCS Vancouver Pre-Deployment Brief - May 2024 (Web Version).pptx
HMCS Vancouver Pre-Deployment Brief - May 2024 (Web Version).pptxHMCS Vancouver Pre-Deployment Brief - May 2024 (Web Version).pptx
HMCS Vancouver Pre-Deployment Brief - May 2024 (Web Version).pptxmarlenawright1
 
Beyond_Borders_Understanding_Anime_and_Manga_Fandom_A_Comprehensive_Audience_...
Beyond_Borders_Understanding_Anime_and_Manga_Fandom_A_Comprehensive_Audience_...Beyond_Borders_Understanding_Anime_and_Manga_Fandom_A_Comprehensive_Audience_...
Beyond_Borders_Understanding_Anime_and_Manga_Fandom_A_Comprehensive_Audience_...Pooja Bhuva
 
Interdisciplinary_Insights_Data_Collection_Methods.pptx
Interdisciplinary_Insights_Data_Collection_Methods.pptxInterdisciplinary_Insights_Data_Collection_Methods.pptx
Interdisciplinary_Insights_Data_Collection_Methods.pptxPooja Bhuva
 
Exploring_the_Narrative_Style_of_Amitav_Ghoshs_Gun_Island.pptx
Exploring_the_Narrative_Style_of_Amitav_Ghoshs_Gun_Island.pptxExploring_the_Narrative_Style_of_Amitav_Ghoshs_Gun_Island.pptx
Exploring_the_Narrative_Style_of_Amitav_Ghoshs_Gun_Island.pptxPooja Bhuva
 
Fostering Friendships - Enhancing Social Bonds in the Classroom
Fostering Friendships - Enhancing Social Bonds  in the ClassroomFostering Friendships - Enhancing Social Bonds  in the Classroom
Fostering Friendships - Enhancing Social Bonds in the ClassroomPooky Knightsmith
 
ICT Role in 21st Century Education & its Challenges.pptx
ICT Role in 21st Century Education & its Challenges.pptxICT Role in 21st Century Education & its Challenges.pptx
ICT Role in 21st Century Education & its Challenges.pptxAreebaZafar22
 
Jual Obat Aborsi Hongkong ( Asli No.1 ) 085657271886 Obat Penggugur Kandungan...
Jual Obat Aborsi Hongkong ( Asli No.1 ) 085657271886 Obat Penggugur Kandungan...Jual Obat Aborsi Hongkong ( Asli No.1 ) 085657271886 Obat Penggugur Kandungan...
Jual Obat Aborsi Hongkong ( Asli No.1 ) 085657271886 Obat Penggugur Kandungan...ZurliaSoop
 
Basic Civil Engineering first year Notes- Chapter 4 Building.pptx
Basic Civil Engineering first year Notes- Chapter 4 Building.pptxBasic Civil Engineering first year Notes- Chapter 4 Building.pptx
Basic Civil Engineering first year Notes- Chapter 4 Building.pptxDenish Jangid
 
Kodo Millet PPT made by Ghanshyam bairwa college of Agriculture kumher bhara...
Kodo Millet  PPT made by Ghanshyam bairwa college of Agriculture kumher bhara...Kodo Millet  PPT made by Ghanshyam bairwa college of Agriculture kumher bhara...
Kodo Millet PPT made by Ghanshyam bairwa college of Agriculture kumher bhara...pradhanghanshyam7136
 
Graduate Outcomes Presentation Slides - English
Graduate Outcomes Presentation Slides - EnglishGraduate Outcomes Presentation Slides - English
Graduate Outcomes Presentation Slides - Englishneillewis46
 
Sociology 101 Demonstration of Learning Exhibit
Sociology 101 Demonstration of Learning ExhibitSociology 101 Demonstration of Learning Exhibit
Sociology 101 Demonstration of Learning Exhibitjbellavia9
 
Salient Features of India constitution especially power and functions
Salient Features of India constitution especially power and functionsSalient Features of India constitution especially power and functions
Salient Features of India constitution especially power and functionsKarakKing
 
Holdier Curriculum Vitae (April 2024).pdf
Holdier Curriculum Vitae (April 2024).pdfHoldier Curriculum Vitae (April 2024).pdf
Holdier Curriculum Vitae (April 2024).pdfagholdier
 
Understanding Accommodations and Modifications
Understanding  Accommodations and ModificationsUnderstanding  Accommodations and Modifications
Understanding Accommodations and ModificationsMJDuyan
 
Single or Multiple melodic lines structure
Single or Multiple melodic lines structureSingle or Multiple melodic lines structure
Single or Multiple melodic lines structuredhanjurrannsibayan2
 
COMMUNICATING NEGATIVE NEWS - APPROACHES .pptx
COMMUNICATING NEGATIVE NEWS - APPROACHES .pptxCOMMUNICATING NEGATIVE NEWS - APPROACHES .pptx
COMMUNICATING NEGATIVE NEWS - APPROACHES .pptxannathomasp01
 
This PowerPoint helps students to consider the concept of infinity.
This PowerPoint helps students to consider the concept of infinity.This PowerPoint helps students to consider the concept of infinity.
This PowerPoint helps students to consider the concept of infinity.christianmathematics
 

Último (20)

Unit 3 Emotional Intelligence and Spiritual Intelligence.pdf
Unit 3 Emotional Intelligence and Spiritual Intelligence.pdfUnit 3 Emotional Intelligence and Spiritual Intelligence.pdf
Unit 3 Emotional Intelligence and Spiritual Intelligence.pdf
 
How to Create and Manage Wizard in Odoo 17
How to Create and Manage Wizard in Odoo 17How to Create and Manage Wizard in Odoo 17
How to Create and Manage Wizard in Odoo 17
 
ICT role in 21st century education and it's challenges.
ICT role in 21st century education and it's challenges.ICT role in 21st century education and it's challenges.
ICT role in 21st century education and it's challenges.
 
HMCS Vancouver Pre-Deployment Brief - May 2024 (Web Version).pptx
HMCS Vancouver Pre-Deployment Brief - May 2024 (Web Version).pptxHMCS Vancouver Pre-Deployment Brief - May 2024 (Web Version).pptx
HMCS Vancouver Pre-Deployment Brief - May 2024 (Web Version).pptx
 
Beyond_Borders_Understanding_Anime_and_Manga_Fandom_A_Comprehensive_Audience_...
Beyond_Borders_Understanding_Anime_and_Manga_Fandom_A_Comprehensive_Audience_...Beyond_Borders_Understanding_Anime_and_Manga_Fandom_A_Comprehensive_Audience_...
Beyond_Borders_Understanding_Anime_and_Manga_Fandom_A_Comprehensive_Audience_...
 
Interdisciplinary_Insights_Data_Collection_Methods.pptx
Interdisciplinary_Insights_Data_Collection_Methods.pptxInterdisciplinary_Insights_Data_Collection_Methods.pptx
Interdisciplinary_Insights_Data_Collection_Methods.pptx
 
Exploring_the_Narrative_Style_of_Amitav_Ghoshs_Gun_Island.pptx
Exploring_the_Narrative_Style_of_Amitav_Ghoshs_Gun_Island.pptxExploring_the_Narrative_Style_of_Amitav_Ghoshs_Gun_Island.pptx
Exploring_the_Narrative_Style_of_Amitav_Ghoshs_Gun_Island.pptx
 
Fostering Friendships - Enhancing Social Bonds in the Classroom
Fostering Friendships - Enhancing Social Bonds  in the ClassroomFostering Friendships - Enhancing Social Bonds  in the Classroom
Fostering Friendships - Enhancing Social Bonds in the Classroom
 
ICT Role in 21st Century Education & its Challenges.pptx
ICT Role in 21st Century Education & its Challenges.pptxICT Role in 21st Century Education & its Challenges.pptx
ICT Role in 21st Century Education & its Challenges.pptx
 
Jual Obat Aborsi Hongkong ( Asli No.1 ) 085657271886 Obat Penggugur Kandungan...
Jual Obat Aborsi Hongkong ( Asli No.1 ) 085657271886 Obat Penggugur Kandungan...Jual Obat Aborsi Hongkong ( Asli No.1 ) 085657271886 Obat Penggugur Kandungan...
Jual Obat Aborsi Hongkong ( Asli No.1 ) 085657271886 Obat Penggugur Kandungan...
 
Basic Civil Engineering first year Notes- Chapter 4 Building.pptx
Basic Civil Engineering first year Notes- Chapter 4 Building.pptxBasic Civil Engineering first year Notes- Chapter 4 Building.pptx
Basic Civil Engineering first year Notes- Chapter 4 Building.pptx
 
Kodo Millet PPT made by Ghanshyam bairwa college of Agriculture kumher bhara...
Kodo Millet  PPT made by Ghanshyam bairwa college of Agriculture kumher bhara...Kodo Millet  PPT made by Ghanshyam bairwa college of Agriculture kumher bhara...
Kodo Millet PPT made by Ghanshyam bairwa college of Agriculture kumher bhara...
 
Graduate Outcomes Presentation Slides - English
Graduate Outcomes Presentation Slides - EnglishGraduate Outcomes Presentation Slides - English
Graduate Outcomes Presentation Slides - English
 
Sociology 101 Demonstration of Learning Exhibit
Sociology 101 Demonstration of Learning ExhibitSociology 101 Demonstration of Learning Exhibit
Sociology 101 Demonstration of Learning Exhibit
 
Salient Features of India constitution especially power and functions
Salient Features of India constitution especially power and functionsSalient Features of India constitution especially power and functions
Salient Features of India constitution especially power and functions
 
Holdier Curriculum Vitae (April 2024).pdf
Holdier Curriculum Vitae (April 2024).pdfHoldier Curriculum Vitae (April 2024).pdf
Holdier Curriculum Vitae (April 2024).pdf
 
Understanding Accommodations and Modifications
Understanding  Accommodations and ModificationsUnderstanding  Accommodations and Modifications
Understanding Accommodations and Modifications
 
Single or Multiple melodic lines structure
Single or Multiple melodic lines structureSingle or Multiple melodic lines structure
Single or Multiple melodic lines structure
 
COMMUNICATING NEGATIVE NEWS - APPROACHES .pptx
COMMUNICATING NEGATIVE NEWS - APPROACHES .pptxCOMMUNICATING NEGATIVE NEWS - APPROACHES .pptx
COMMUNICATING NEGATIVE NEWS - APPROACHES .pptx
 
This PowerPoint helps students to consider the concept of infinity.
This PowerPoint helps students to consider the concept of infinity.This PowerPoint helps students to consider the concept of infinity.
This PowerPoint helps students to consider the concept of infinity.
 

Darine mottin 2007_6442-57_spie bios

  • 1. Two-photon deep imaging through skin and skull of Zebra finches : Preliminary studies for in vivo brain metabolism monitoring D. Abi-Haidara , T. Oliviera , S. Mottina , C. Vignalb and N. Mathevonb a Laboratoire ´ Hubert Curien (ex-LTSI), UMR5516 CNRS & University of Saint-Etienne, ´ Saint-Etienne, France; ´ ´ b Laboratoire ENES, EA3988, University of Saint-Etienne, Saint-Etienne, France ABSTRACT Zebra Finches are songbirds which constitute a model for neuro-ethologists to study the neuro-mechanisms of vocal recognition. For this purpose, in vivo and non invasive monitoring of brain activity is required during acoustical stimulation. MRI (Magnetic Resonance Imaging) or NIRS (Near InfraRed Spectroscopy) are suitable methods for these measurements, even though MRI is difficult to link quantitatively with neural activity and NIRS suffers from a poor resolution. In the particular case of songbirds (whose skin is thin and quite transparent and whose skull structure is hollow), two-photon microscopy enables a quite deep penetration in tissues and could be an alternative. We present here preliminary studies on the feasability of two-photon microscopy in these conditions. To do so, we chose to image hollow fibers, filled with Rhodamine B, through the skin of Zebra finches in order to evaluate the spatial resolution we may expect in future in vivo experiments. Moreover, we used the reflectance-mode confocal configuration to evaluate the exponential decrease of backreflected light in skin and in skull samples. Following this procedure recently proposed by S.L. Jacques and co-workers, we planned to determine the scattering coefficient µs and the anisotropy g of these tissues and make a comparison between fixed and fresh skin and skull samples for future Monte Carlo simulations of the scattering in our particular multi-layered structure. Keywords: two-photon fluorescence, microscopy, neuro-imaging, scattering media, songbird 1. INTRODUCTION In order to understand vocal recognition and social behaviors of animals, it is quite obvious that in vivo ex- periments are crucial. Moreover, analyses of the neuro-mechanisms underlying vocal recognition created a need for reliable and non invasive tools to probe activations of brain area involved in vocal processes. Amongst all animals, songbirds, and particularly Zebra Finches (Taeniopygia guttata) are interesting to study because they happen to be specialists in vocal emission and recognition, which are deeply involved in their social interactions.1 In order to monitor neuro-activations, functional MRI and NIRS (Near Infra-Red Spectroscopy) have been used and have demonstrated their efficiency.2–4 Unfortunately, the BOLD (Blood Oxygen Level Dependent) signal measured in fMRI experiments remains difficult to link quantitatively with parameters expressing neural activ- ity. On the contrary, NIRS gives quantitative information about cerebral blood volume (CBV) and hemoglobin oxygen saturation level which reflects cerebral activity, but it is not an imaging method and it suffers from a poor millimetric resolution. In other terms, we have to admit that the study of neuro-mechanisms requires the use of different and complementary monitoring methods. For more than ten years now, two-photon microscopy has been widely adopted for in vivo imaging because of its ability to keep a good resolution (a few micrometers), even in the depth (1mm) of scattering biological samples.5–7 In more recent years, two-photon microscopy has been used for in vivo brain monitoring.8–13 Many of the studies have been performed on rats or mice and proved very efficient. Unfortunately, the thickness (1.6- 2.2mm) and the highly scattering properties of rats and mice skull requires to remove a part of the skull and Further author information: (Send correspondence to T.O.) T.O.: E-mail: thomas.olivier@univ-st-etienne.fr, Telephone: +33 (0)4 77 91 58 20
  • 2. replace it with a glass window. Other approaches tend to reduce many problems associated with craniotomy by reducing the thickness of the skull9 to about 200-250µm. Miniature head-mounted elements and optical fibers have been successfully also employed on freely moving rats, but still requires craniotomy.8 More recently, two-photon micro-endoscopy experiments have been tested with very thin gradient index lenses, allowing to keep micrometer resolutions, even 1.5mm deep inside the brain.11, 12 In most of these various multiphoton in vivo brain studies, the monitoring relies on the study of the dynamics of red blood cells in brain capillaries.10 This gives a reliable information about neural activations in quite small brain areas. By staining the plasma with various fluorophores, contrast can be obtained between the fluorescent plasma and the absorbing blood cells. These studies, based on red blood cells counting seem to require quite a good resolution which necessitates craniotomy. However, the feasability of such a measurement has been demonstrated through 250µm thinned skull. Another way to monitor brain activity can be the use of endogenous fluorescence of NAD(P)H or flavoproteins involved in the energy metabolism of neurons.14 Even if this endogenous fluorescence is quite weak, it seems to be an interesting way as it does not seem to require as much resolution as the counting of red blood cells. In the case of songbirds like Zebra Finches, craniotomy is problematic as the birds are quite fragile. Moreover, Zebra Finches have a pneumatic skull structure composed of 25µm-thick internal and external cortical bones linked by approximately 250µm-high trabeculae. Indeed, the skull of Zebra Finches is much thinner than the skull or rats or mice, and mainly composed of air. Our goal is to evaluate the possibility to perform two-photon imaging in vivo through the skull, and maybe the skin, of Zebra Finches. Particularly, the brain area we would like to investigate is the NCM (caudomedial neostriatum) which is highly involved in song processing. This brain area is located between the caudal and the dorsal part of the bird’s head and 1.2mm to 2.7mm below the external surface of the head. The hippocampus could also be an area of interest and is located above the NCM, between 0.6 and 1mm below the surface of the head. At first sight, this particular skull structure is more transparent than the skull structure of small mammalians, however, as the refractive index and scattering properties are very heterogeneous in all directions, it is important to evaluate the effect of this structure on the image quality and the axial and lateral resolutions of multiphoton microscopy. This heterogeneous structure is likely to distort the image. As a first step before setting up in vivo procedures and experiments we decided to work on a simplified structure (i.e. only on fixed skull samples) and to image a clearly identified object. The object we chose to image is a 10µm-hollow core fiber filled with Rhodamine B, which possesses a high two-photon absorption cross section. In this work, we will present various images and processed XYZ stacks performed on fixed skull samples, and particularly we will try to quantify the distorsion and loss of resolution induced by the scattering of the incident beam while passing through the skull sample. Besides, it could be interesting to use simulations of light scattering inside the skin and skull of Zebra Finches in order to better evaluate the feasability of in vivo monitoring of the neuro-activations. This requires accurate knowledge of the scattering coefficients of fresh skin and skull samples. We used the recent experimental procedure described by S. L. Jacques et al.,15, 16 based on reflectance-mode confocal measurements of the exponential decay of reflectivity as the focus is moved along the optical axis inside the scattering sample. This measurement allows the determination of both the scattering coefficient µs and the anisotropy g from the parameters ρ and µ describing the exponential decay of reflectivity. This determination requires the performing of Monte Carlo simulations that we have not performed yet. However, comparisons between the exponential decay coefficients ρ and µ of fresh and fixed samples are presented, allowing us to evaluate the effect of fixing tissues to perform more convenient experiments. 2. MATERIALS AND METHODS In order to perform two-photon imaging as well as reflectance mode confocal imaging of skin or skull samples, we used a TCS-SP2 confocal microscope from LEICA Microsystems. The laser system was a Ti:Sapphire MIRA 900 oscillator from COHERENT pumped with a 5W VERDI Nd:YAG laser at 532nm. The laser system delivers typically 800mW, 200fs pulses with a 76MHz repetition rate. The wavelength can be adjusted between 710 and 900nm with a maximum power around 800nm. The experimental setup is represented on Figure 1. Only the elements that were relevant during our experiments are represented.
  • 3. 2.1. Two-photon imaging experiments In the first set of experiments, i.e. for two-photon imaging, two-photon fluorescence is collected just after the microscope objective via a dichroic beam splitter which is transparent to wavelengths greater than 715nm. The collected visible radiation spectrum is split by another dichroic beamsplitter in two channels (non-descanned pho- tomultipliers), one collecting blue/green radiations up to 550nm and the other one collecting yellow/orange/red radiations starting from 550nm. As the confocal pinhole is useless for two-photon microscopy, the use of such non-descanned detectors enables to collect the maximum fraction of fluorescence from the focus. Microscope objectives that were used are long working distance water-immersion LEICA objectives (HCX APO L U-V-I 20× NA-0.5 and HCX APO L U-V-I 40× NA-0.8). An electro-optical modulator (EOM) was used to adjust the laser power at the entrance of the confocal system. This was particularly useful to automatically compensate for energy losses due to scattering as the focus moves inside the samples. (a) (b) Figure 1. Schematic representation of the microscopy configurations used in this work. (a) Main elements of the LEICA TCS-SP2 microscopy system used in this work for confocal reflectance mode measurements of the diffusion coefficients or two-photon imaging of the hollow fiber filled with Rhodamine B. For two-photon imaging: BS: dichroic mirror transparent to visible radiations, DBS1: dichroic beam splitter transparent to NIR radiations starting from 715nm, DBS2: dichroic beam splitter separating the visible radiation reflected by DBS1 into two channels (λ > 550nm and λ < 550nm), NDD1 and NDD2: non-descanned detectors (photomultipliers). (b) Details of the sample used in two-photon imaging: IM: immersion medium, Sk: skull, HF: hollow fiber, RhB: Rhodamine B, St: stand. For confocal reflectance mode: BS: 30/70 beam splitter, Sc: XY-scanner, MO: microscope objective, S: sample, TS: translation stage, P: confocal pinhole, PMT1: photomultiplier. The hollow fibre we used had a 120µm total diameter and a 10µm hollow core, which simulates a single rectilinear blood capillary. We used roughly 2cm-long fibers, the core of which was filled with Rhodamine by capillarity and sealed with glue at both extremities. In order to have a maximum fluorescence, without any quenching problems, various tests were performed with Rhodamine 6G and Rhodamine B in ethanol with concentration varying from 10−5 to 10−1 mol/l. The highest fluorescence was recorded with Rhodamine B for 10−2 mol/l and for a wavelength equal to 850nm. This concentration and wavelength were kept for all the two-photons experiments presented in this work. A couple of Zebra Finches with an average weight of 12g were sacrificed with a lethal intra-muscular injection of pentobarbital. Their head were plucked a couple of days days before the death. The blood was removed from the vascular system by cutting aorta just after the death of the animal in order to avoid staining of the bone or skin tissues with blood during the dissection. Approximately 4mm×4mm pieces of skull were taken between
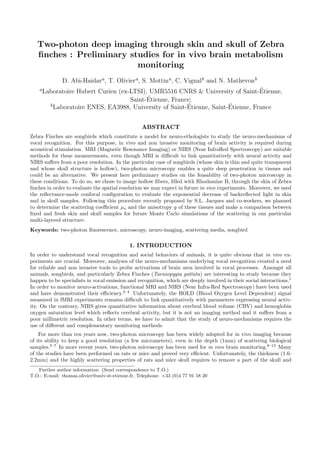
  • 4. the dorsal and the caudal parts of the bird’s head and along the sagittal suture. These skull samples were fixed with a 4% paraformaldehyde solution. As described on figure 1-(b), the fiber was set on a 100µm deep rectilinear furrow carved on a plexiglas half-cylinder whose curvature radius is equal to 7mm, which is the average curvature of the Zebra Finches head. In order to prevent the filling of the skull’s pneumatic cavity with water, the immersion medium we used for the microscope objective was a transparent gel, mainly composed of water (echography gel). This gel also held the skull sample and prevented it from sliding during the recording of the image stacks. 2.2. Reflectance mode confocal experiments In the second set of experiments, i.e. for reflectance mode confocal measurements, the dichroic beam splitter DBS1 is removed and the BS beam splitter is replaced with a 30/70 beam splitter (30% of reflection and 70% of transmission). The microscope objective that was used is a long working distance water-immersion LEICA objective (HCX APO L U-V-I 40× NA-0.8). The pinhole was set to 21.27µm which corresponds to the 40× magnified size of the inner Airy pattern at the focus. In these conditions, the light collected by the PMT1 photomultiplier is proportionnal to the light backreflected by the sample. For safety reasons, our LEICA confocal system is designed to prevent NIR radiations from entering the photomultipliers of the confocal head. Thus, these experiments were performed with a wavelength of 710nm in order to be as close as possible to the two-photon experimental conditions described in part 2.1. In reflectance mode confocal configuration, the amount of reflected light collected by the microscope objective mainly comes from the focus and is linked to the backscattering properties of a thin slice in the sample. This reflectivity decreases exponentially as the focus penetrates inside a scattering samples.15 The reflectivity decrease as a function of depth inside the sample can be represented by the following equation: R(z) = ρ exp(−µz) (1) where R(z) represents the reflectivity of the sample at a distance z from the sample surface. ρ represents then the reflectivity on the surface of the sample and µ the attenuation coefficient. These coefficients are linked to the scattering coefficient µs and the anisotropy g, which would then lead to the reduced scattering coefficient µ′ = µs (1 − g). The coefficients ρ and µ are not independently linked to the scattering coefficients µs s and g. Indeed, for example, when the anisotropy g decreases, there is less light that is backscattered, which reduces ρ, as well as the attenuation coefficient µ. Monte Carlo simulations of the scattering of light inside the sample are needed to find the couple (µs , g) corresponding to a couple (ρ, µ). We have not performed such simulations for the moment. However, as a first step, our goal here is to compare the reflectivity and attenuation coefficient of fresh tissues with the paraformaldehyde-fixed tissues we used in the previous experiments with Rhodamine B filled hollow fiber. We realized 512×512×100 image stacks. The total transversal field was 750×750µm-wide and the height of a stack varied between 100 and 400µm depending on the sample roughness. We then plotted as a function of z (depth in the sample) the average reflectivity in a 20×20µm region of interest (ROI), which corresponds roughly to an average on 14×14 pixels. The typical z-profiles that were obtained are represented on Figure 2 for various ROI sizes. This figure shows the profile we obtained on two different parts of the sample (A and B) and with ROI sizes varying from 10×10µm to 40×40µm. As it can be seen on B, the decrease can be dependent on the ROI size. This was observed when the sample is locally not perpendicular to the optical axis. The reflectivity variations are then smoothed and the maximum reflectivity is not representative of the theoretical exponential decay. For this reason, the ROI were selected on part of the stacks where the sample was quite perpendicular to the optical axis. According to these measurements, the 20×20µm size of the ROI was chosen as it seemed to be the best compromise to have a representative position of the reflectivity maximum as well as enough pixels to make a significant averaging that prevents the experimental curves from oscillating to much. These measurements and exploitations were performed on skull and skin samples. A first set of measurement were carried out on samples freshly taken just after the death of the animal (see procedure in 2.1) and kept in a petri dish filled with a Phosphate Buffer Saline (PBS) solution, which was then used as the immersion medium for the microscope objective. In these conditions, five image stacks were recorded on various parts of one sample
  • 5.  £ &% ¥ $ ' ( "# &%   ¡  ¢ "! &%   ¦ %   ¢  ¡     ¤    ¥¤    ¡¤   ¦¤  ©©¨ § Figure 2. Reflectivity variations as a function of depth z in the sample. A and B sets represent the exponential decay on two different parts of the sample. Each curve represents an average on squared parts of the image. Various sizes of these parts have been tested in order to determine the best compromise between averaging and smoothing of the maximum (see text for details). (skin or skull) and 10 different ROI were considered. Immediately after that, each sample was rinsed with PBS and kept overnight in a 4% paraformaldehyde solution. Five images stacks were then recorded on the fixed samples and 10 ROI were considered on each stack. Hence, we worked on one fresh (and then fixed) skull sample and one fresh (and then fixed) skin sample. On each sample, 5 different stacks were performed and 10 ROI were considered on each stack, which represents 50 exponential decay measurements per sample. Finally, it was necessary to calibrate the system to provide a true value of the reflectivity. In order to do that, all the settings of the microscope system were kept equal during all the experiments and a calibration stack was performed on a glass plate of known refractive index. Only the power of the laser were changed from one stack to another and taken into account in the calibration of the curves. 3. RESULTS AND DISCUSSION 3.1. Two-photon imaging experiments Firstly, several stacks were recorded on skull samples, using the endogenous two-photon fluorescence of the samples. This was carried out to characterize the skull structure and is represented on Figure 3. Thanks to these images, we found that the average radius of trabeculae is 50µm and there is about 12 trabeculae per squared millimeter. Seen from above, this means that 10% of the skull area is occupied by trabeculae. Previous histology studies performed in ENES laboratory indicates that the overall thickness of the skull lies between 250 and 350µm in this part of the skull, and the thickness of the internal and external cortical bones lies between 25µm and 50µm. Secondly, stacks were recorded with the hollow core fiber filled with Rhodamine B. An image sequence taken from a stack is represented on Figure 4. On this sequence the endogenous fluorescence of the external cortical bone and trabeculae is first observed, then, a distorted and enlarged image of the Rhodamine B filled core can be observed as the focus is moved inside the sample. Thanks to the electro-optical modulator, intensity compensation was used as the focus penetrates the medium in order to compensate for the intensity decrease of the excitation beam due to scattering. Four different skull samples were used to carry out two-photon imaging of the hollow-core fiber through the skull. The average z-projections of the stacks are represented on Figure 5. For each sample, both the red/orange/yellow fluorescence image (λ 550nm) and the blue/green fluorescence image (λ 550nm) are presented. As it can be seen, the fluorescence of Rhodamine B can be easily distinguished from the endogenous fluorescence of the bone because the fluorescence of Rhodamine B is located in the yellow/orange/red part of the spectrum, with a maximum around 575nm, while the endogenous fluorescence of the bone seems to be extending uniformly from blue to red parts of the spectrum. (a) and (b) experiments were performed with skull samples
  • 6. Figure 3. Two-photon images of Zebra Finch skull (projected stacks). On the left: 1mm slice seen from the side. On the right: projected stack seen from above. In both images trabeculae repartition and dimensions can be observed. Figure 4. Two-photon fluorescence image sequence taken from one stack. First, the endogenous fluorescence of the external cortical bone surface and the trabeculae is observed and then the fluorescence coming from the Rhodamine B filled hollow fiber is observed, giving a distorted and enlarged image of the fiber core due to scattering in cortical bones and trabeculae. as described previously while (c) and (d) experiments were performed with thinner skull samples with only one cortical layer, roughly 100µm-thick, that were taken from younger birds. In (a), (b) and (c), the ×20 objective was used, while the ×40 objective was used in (d). In order to evaluate the lateral and axial extent of the fiber image, x-projections of the previous stacks are presented on Figure 6 (x represents then the axial direction of the fiber). Each of these stacks was obtained by selecting only 200µm-thick slices along the x axis. These slices were selected in particular parts of the image where the fiber image was not too distorted by the scattering in trabeculae. Lateral and axial profiles of the fluorescence radiated from the Rhodamine B filled hollow core of the fiber are represented on Figure 7. As it can be seen, the image of the fiber core is enlarged by the scattering. The axial and lateral full width at half maximum (FWHM) of the fluorescence spatial repartition is summed up in table 1, as well as the position of the maximum of fluorescence from the skull external cortical part. As a conclusion, these two-photon imaging studies indicate that it is possible to collect fluorescence at depths close to 1mm through the skull of Zebra Finches. However, from experiments (a) and (b), it is clear that this fluorescence was collected mainly between trabeculae. As these trabeculae cover only 10% of the skull area (seen from above), it remains possible to collect an important part of the fluorescence. The distorsion and the enlargement of the image of the fiber remains problematic, especially in the axial direction of the beam, with
  • 7. (a) (b) (c) (d) Figure 5. Two-photon images of the hollow core fiber through various skull samples. Each image is an average z- projection of the stack. The first line contains the images obtained with red/orange/yellow fluorescence (λ 550nm) while the second line represents the images obtained with blue/green fluorescence (λ 550nm). As it can be seen, (c) and (d) stacks were performed with skull samples having very few or no trabeculae. These samples were taken from younger birds and were approximately 100µm-thick and only composed of one single cortical bone. Figure 6. x-projected stacks of the previously presented stacks (where x is the axial direction of the fiber). an axial FWHM of the fluorescence repartition greater than 1mm in case of experiment (a). As it can be seen from experiment (c) and (d), a more moderate enlargement of 50-70µm in the lateral direction and 400µm in the axial direction can be achieved at depths greater than 700µm if working with younger Zebra Finches.
  • 8. 1.0 (a) Normalized Fluorescence (b) (a) Normalized Fluorescence (c) 1.0 (b) (c) (d) (d) 0.5 0.5 0.0 0.0 −0.3 −0.2 −0.1 0.0 0.1 0.2 0.3 0.0 0.5 1.0 1.5 y (mm) z (mm) Figure 7. Lateral (left) and axial (right) profiles of the fluorescence radiated by the Rhodamine B filled hollow core fiber. Table 1. Summary of the data extracted from the x-projection represented on Figure 6 (The position column is the position of the maximum from the skull surface). Experiment Lateral FWHM Axial FWHM Position (a) 141µm 1.2mm 0.71mm (b) 205µm 0.98mm 0.36mm (c) 53µm 0.41mm 0.74mm (d) 76µm 0.36mm 0.78mm 3.2. Reflectance mode confocal measurements As described in section 2.2, reflectance mode confocal measurements were performed on fresh and fixed skull and skin samples. Each reflectivity curve has been fitted with the theoretical expression R(z) = ρ exp(−µz). The least squared fitting method was used to find the values of ρ and µ. Figure 8 represents the experimental curves and the theoretical fits for ten ROI taken from one stack recorded on a fixed skin sample. All the points were taken into account for the fit, starting from the maximum of the reflectivity curves. rho = 0.00315 rho = 0.00290 rho = 0.00283 rho = 0.00178 rho = 0.00255 mu = 73.8 mu = 49.9 mu = 56.4 mu = 49.4 mu = 49.9 R² = 0.998 R² = 0.99 R² = 0.997 R² = 0.997 R² = 0.996 rho = 0.00209 rho = 0.00314 rho = 0.00377 rho = 0.0025 rho = 0.0029 mu = 51.5 mu = 56.6 mu = 55.6 mu = 50.6 mu = 58.1 R² = 0.997 R² = 0.996 R² = 0.995 R² = 0.996 R² = 0.997 Figure 8. Reflectivity curves measured as a function of the depth in a fixed skin sample. We present here 10 measurements carried out on 20×20µm zones spread on various parts of one 512×512×100-stack. Experimental points (circles) are fitted with the theoretical reflectivity function R(z) = ρ exp(−µz) (lines). The fitted values of ρ and µ (in mm−1 ) are given here as well as the correlation coefficient R2 . All the fitted values of ρ and µ were compiled and the result can be observed in Figure 9. This figure represents the box and whiskers plots for the four types of sample (fixed and fresh skull and skin samples). As it can be seen, the coefficients for fresh and fixed skull samples are obviously significantly different. As this is less obvious for the skin samples, a Mann-Whitney test was carried out, indicating that the data are significantly
  • 9. different with a probability of equality inferior to 10−6 and 10−11 (see Figure 9). According to these data, no conclusion can be made concerning the value of the scattering coefficient µs and the anisotropy g, because this requires Monte Carlo simulations that are still in process. However, it is clear that the attenuation coefficients µ and reflectivity on surface ρ are different for fixed and fresh samples. These results will be very useful as we are going to perform simulations of the diffusion in our situation and try to optimize our measurements for in vivo studies. Coefficients for skull samples Coefficients for skin samples Mann−Whitney: P = 1e−06 fixed fixed fresh fresh 0.0000 0.0005 0.0010 0.0015 0.000 0.005 0.010 0.015 0.020 ρ ρ Mann−Whitney: P = 6e−12 fixed fixed fresh fresh 0 50 100 150 200 250 0 50 100 150 200 µ − mm−1 µ − mm−1 Figure 9. Box and whiskers plots of the coefficients ρ and µ measured on skin and skull samples. The fresh samples were kept few minutes to several hours after the death of the bird in PBS(Phosphate Buffer Saline) solution, while the other ones were paraformaldehyde-fixed samples. 4. CONCLUSION PERSPECTIVES Monitoring the brain activation on small songbirds is crucial to understand the neuro-mechanisms that underlie vocal recognition, emission and learning. The understanding of these complex mechanisms requires a multilevel approach as well as the use of various complementary monitoring methods. Two-photon imaging has been recently used for various in vivo studies, demonstrating its potential for brain activation monitoring, unless craniotomy or thinning of the skull is required. In the particular case of fragile songbirds, craniotomy should be avoided. Fortunately, we have seen that the skull structure of birds is mostly composed of air and of two thin cortical bone layers that are quite transparent. The skin itself is quite thin (around 100µm-thick). All these conditions can also be enhanced by the use of younger birds. In this work, we have showed that the fluorescence of a thin fiber filled with Rhodamine B can be clearly seen through the skull with a conventional multiphoton microscopy system. Unfortunately the enlargement of the incident beam is quite important, reaching 200µm in lateral direction and roughly 1mm in the axial direction. Moreover, the skin and other intracranial tissues were not present in our simple configuration. Solutions could be found with the use of younger birds, because in this case, we have seen that the resolution can be kept to a reasonable value of 50µm in the lateral direction and 400µm in the axial direction. New fluorophores optimized for two-photon absorption17 could be used, as their two-photon absorption cross section can reach 2000GM, which is ten times the cross section of Rhodamine B.18 As it has been previoulsy demonstrated,7, 19 the use of a regenerative amplifier is an interesting way to increase the imaging depth in biological samples. It remains obvious that a compromise has to be found between the resolution and the imaging depth we require. In our case, simulations of the scattering as well as further experiments are necessary to investigate if the quite peculiar structure of the bird’s skull will not affect too much our resolution and to find experimental conditions and approaches that would be likely to enhance this resolution, especially the axial one. That was the reason why complementary works were presented here as well, concerning the measurement of the scattering coefficients of the skull and skin, which will be useful for future simulations. Particularly, it has been showed that the exponential decay of backreflected light is different for fresh and for fixed sample, and this fact must be taken into account before attempting in vivo experiments.
  • 10. ACKNOWLEDGMENTS The authors would like to thank the French national agency for research (ANR) for financial support and Sabine Palle, technical director of the confocal microscopy platform of University Jean-Monnet (PPF microscopie confocale multiphotonique). REFERENCES 1. C. Vignal, N. Mathevon, and S. Mottin, “Audience drives male songbird response to partner’s voice,” Nature 430, pp. 448–451, 2004. 2. A. Van der Linden, M. Verhoye, V. Van Meir, I. Tindemans, M. Eens, P. Aabsi, and J. Balthazart, “In vivo manganese-enhanced magnetic resonance imaging reveals connections and functional properties of the songbird vocal control system,” Neuroscience 112, pp. 467–474, 2002. 3. N. Plesnila, C. Putz, M. Rinecker, J. Wiezorreck, L. Schleinkofer, A. Goetz, and W. Kuebler, “Measurement of absolute values of hemoglobin oxygenation in the brain of small rodents by near infrared reflection spectrophotometry,” J. Neurosci. Methods 114, pp. 107–117, 2002. 4. J. Culver, T. Durduran, D. Furuya, C. Cheung, J. Greenberg, and G. Yodh, “Diffuse optical tomography of cerebral blood flow oxygenation and metabolism in rat during focal ischemia,” J. Cereb. Blood Flow Metab. 23, pp. 911–924, 2003. 5. F. Helmchen and W. Denk, “Deep tissue two-photon microscopy,” Nature Methods 12, pp. 932–940, 2005. 6. M. Oheim, E. Beaurepaire, E. Chaigneau, J. Mertz, and S. Charpak, “Two-photon microscopy in brain tissue: parameters influencing the imaging depth,” Journal of Neuroscience Methods 111, pp. 29–37, 2001. 7. P. Theer, M. Hasan, and W. Denk, “Two-photon imaging to a depth of 1000m in living brains by use of ti:al2o3 regenerative amplifier,” Optics Letters 28, pp. 1022–1024, 2003. 8. F. Helmchen, M. Fee, D. Tank, and W. Denk, “A miniature head-mounted two-photon microscope: High resolution brain imaging in freely moving animals,” Neuron 31, pp. 903–912, 2001. 9. E. Yoder, “In vivo microscopy of the mouse brain using multiphoton laser scanning techniques,” in Proceed- ings of SPIE, A. Periasamy and P. T. So, eds., Multiphoton Microscopy in the Biomedical Sciences II 4620, 2002. 10. E. Chaigneau, M. Oheim, E. Audinat, and S. Charpak, “Two-photon imaging of capillary blood flow in olfactory bulb glomeruli,” PNAS 100, pp. 13081–13086, 2003. 11. M. Levene, D. Dombeck, K. Kasischke, R. Molloy, and W. Webb, “In vivo multiphoton microscopy of deep brain tissue,” J. Neurophysiol. 91, pp. 1908–1912, 2004. 12. J. Jung, A. Mehta, R. Stepnoski, and M. Schnitzer, “In vivo mammalian brain imaging using one and two-photon fluorescence microscopy,” J. Neurophysiol. 92, pp. 3121–3133, 2004. 13. G. Nase, P. Helm, T. Reppen, and O. Ottersen, “A multiphoton laser scanning microscope setup for tran- scranial in vivo brain imaging on mice,” Review of scientific instruments 76, pp. 123702–1–123702–5, 2005. 14. K. Takahashi, R. Hishida, Y. Kubota, M. Kudoh, S. Takahashi, and K. Shibuki, “Transcranial fluorescence imaging of auditory cortical plasticity regulated by acoustic environments in mice,” European Journal of Neuroscience 23, pp. 1365–1376, 2006. 15. S. Jacques and D. Gareau, “Confocal microscopy measures tissue optical preoperties,” in Saratov Internet Conference, 2005. 16. S. Jacques and R. Samathan, “Optical properties of mutant vs wildtype mouse skin measured by reflectance- mode confocal scanning laser microscopy,” in Saratov Internet Conference, 2006. 17. C. L. Droumaguet, O. Mongin, M. Werts, and M. Blanchard-Desce, “Towards ”smart” multiphoton flu- orophores: strongly solvatochromic probes for two-photon sensing of micropolarity,” Chem. Commun. , pp. 2802–2804, 2005. 18. C. Xu and W. W. Webb, “Measurement of two-photon excitation cross sections of molecular fluorophores with data from 690 to 1050nm,” J. Opt. Soc. Am. B 13, pp. 481–491, 1996. 19. E. Beaurepaire, M. Oheim, and J. Mertz, “Ultra-deep two-photon fluorescence excitation in turbid media,” Optics Communications 188, pp. 25–29, 2001.