SlideShare uma empresa Scribd logo
1 de 8
Baixar para ler offline
U
N
C
O
R
R
E
C
T
E
D
P
R
O
O
F
Food Chemistry xxx (xxxx) xxx-xxx
Contents lists available at ScienceDirect
Food Chemistry
journal homepage: http://ees.elsevier.com
Simultaneously and quantitatively analyze the heavy metals in Sargassum fusiforme by
laser-induced breakdown spectroscopy
LaijinSua,b
, WenShic,⁎
, XiaojingChenc,⁎
, LiuweiMengc
, LeimingYuanc
, XiChenc
, GuangzaoHuangc
a
Wenzhou Academy of Agricultural Sciences, Wenzhou 325006, PR China
b
Wenzhou Characteristic Food Resources Engineering and Technology Research Center, Wenzhou 325006, PR China
c
College of Electrical and Electronic Engineering, Wenzhou University, Wenzhou 325035, PR China
A R T I C L E I N F O
Keywords
Sargassum fusiforme
Laser-induced breakdown spectroscopy
Heavy metal
Qualitative analysis
Threshold variables method
Variable selection method
A B S T R A C T
As a nutritious and popular seafood among consumers, Sargassum fusiforme is susceptible to the toxic heavy met-
als because of its strong adsorption properties. In this study, laser-induced breakdown spectroscopy (LIBS) cou-
pled with a simple framework (only remove some noise and low-intensity variables, and then combine with PLS
algorithm) was used to establish the detection models to simultaneously and quantitatively analyze the content
of heavy metals arsenic (As), chromium (Cd), cadmium (Cr), copper (Cu), mercury (Hg), lead (Pb) and zinc (Zn)
in Sargassum fusiforme. As comparisons, three classic variable methods of successive projections algorithm (SPA),
uninformative variable elimination (UVE) and variable importance in projection (VIP) were adopted. The final
results showed that six of seven heavy metal models from the TV-PLSR model were optimal. These results demon-
strate that the TV-PLSR framework combined with LIBS technique is an effective framework for quantitatively
analyzing the heavy metals in Sargassum fusiforme.
1. Introduction
Sargassum fusiforme belonging to the Sargassaceae family is a kind
of algae that is widely distributed along the coast of Asia (Cong et
al., 2016). Due to its rich nutrient components, such as minerals, di-
etary fiber, polysaccharides, protein, and vitamins, Sargassum fusiforme
has been a popular health seafood among consumers, especially in Chi-
nese market (Yang et al., 2019). Furthermore, it also has the ef-
fects of scavenging free radicals, anti-oxidation and enhancing immu-
nity. Therefore, Sargassum fusiforme is also a medicinal seafood (Ye et
al., 2018). Over the past several decades, the rapid development of
industry has produced a tremendous amount of pollution, which has
led to many cultural coastal zones being at high risk of exposure to
industrial pollutions (Wang & Yang, 2016). Consequently, many nu-
trient metals in Sargassum fusiforme, such as copper (Cu), chromium
(Cr) and zinc (Zn) become toxic heavy metals with the increases of
concentration level. As one of the most important pollutants, toxic
heavy metals have become a serious environmen
tal issue due to their significant toxic impacts on living organisms (Mo-
han et al., 2014). Since these toxic heavy metals cannot be degraded
by biological systems, they ultimately bioaccumulate in living organ-
isms through the food chain (Sankhla, Kumari, Nandan, Kumar, &
Agrawal, 2016). According to relevant studies, Sargassum fusiforme has
a strong adsorption capacity for heavy metal and is susceptible to heavy
metal pollution (Poo et al., 2018). Therefore, Sargassum fusiforme is
likely to contain excessive amounts of toxic heavy metals when exposed
to heavy metal pollution. Toxic heavy metals have a highly toxic effect
on public health even at trace levels (Roleda et al., 2019). In addi-
tion, consumers are increasingly paying attention to food safety with
the improvement of living standards. Thus, it is essential to develop a
rapid and accurate detection model for several heavy metals to ensure
the quality and safety of Sargassum fusiforme.
There are various commonly used heavy metal detection methods,
such as atomic absorption spectroscopy (De, De, Dos, & Quináia,
2018), flame or atomic emission spectroscopy (Wang, Tang, Zheng,
& Xiang, 2017), inductively
⁎
Corresponding authors.
E-mail addresses: shiwen@wzu.edu.cn (W. Shi); chenxj@wzu.edu.cn (X. Chen)
https://doi.org/10.1016/j.foodchem.2020.127797
Received 5 November 2019; Received in revised form 13 July 2020; Accepted 6 August 2020
Available online xxx
0308-8146/© 2020.
U
N
C
O
R
R
E
C
T
E
D
P
R
O
O
F
L. Su et al. Food Chemistry xxx (xxxx) xxx-xxx
coupled plasma optimal emission and mass spectroscopy (Hwang et
al., 2018). Although these methods can obtain sensitive and accurate
results, the complex preprocessing and the use of toxic and expensive
chemical reagents make these methods unable to meet the requirements
of non-destruction and green detection, such as the detection of some
precious and rare sample. (Gałuszka, Migaszewski, & Namieśnik,
2013). In addition, infrared spectroscopy was also tried to detect the
metal heavy metal in seafood (Chen, Liu, Cai, Zhu, & Chen, 2015).
However, this method can only qualitatively identify heavy metal pol-
lution and cannot meet the requirements of quantitative detection. As
for the issue, laser-induced breakdown spectroscopy (LIBS), a kind of
atomic emission spectroscopy technique, has been used to analyze many
mineral elements for gas, solid and liquid samples (Bilge, Sezer, Boy-
aci, Eseller, & Berberoğlu, 2018). The main principle of LIBS is to
use a high power pulsed laser beam which focus onto the sample sur-
face to create the high temperature plasma containing atoms and ions.
Then, the emission lines were released in the cooling of plasma in which
the atoms and ions return to the fundamental state with the plasma
cooling. (Fortes, Moros, Lucena, Cabalin, & Laserna, 2013). Af-
terwards, these emission lines that can provide spectral signature were
detected by a spectrometer. Consequently, the type of element present
in plasma can be identified based on the emission line position of tar-
geted element and multiple elements of the sample can be qualitatively
and quantitatively analyzed according to the position and intensity of
the emission lines (Anderson et al., 2017). In addition to being able
to analyze multiple elements simultaneously, LIBS has many other ad-
vantages, such as being non-destructive or causing only microlosses of
the sample, offering real-time fast online detection and having no need
for chemical reagents (Peña-Icart et al., 2017). Hence, LIBS has been
widely used in food (Markiewicz-Keszycka et al., 2017), agriculture
(Senesi & Senesi, 2016), energy (Phuoc, Wang, & McIntyre, 2016)
and other fields in recent years. Although each element of sample has
its own unique LIBS excitation lines whose intensity information can
be used to quantitatively analyze the content or concentration of tar-
get elements in samples, the universal analysis method can not accu-
rately quantify the concentrations between the emission line intensity
and element content in sample. To address this issue, multivariate cal-
ibration method were usually used to establish the quantitative analy-
sis model. Nowadays, many studies have been conducted on the quan-
titative analysis of LIBS data and great progress has been made. For in-
stance, yan et al proposed an image feature method for the quantita-
tive analysis of LIBS data and content of nickel (Ni) in alloy steel was
determined. Good results with the coefficient of determination (R2) of
0.9996 was obtained. Which demonstrated the potential of LIBS tech-
nique in elemental quantitative analysis element (Yan et al., 2019).
It is well known that LIBS data usually contain thousands of variables,
but many variables are uninformative. At present, there are two com-
monly used strategies to analyze LIBS data. One method uses the emis-
sion lines of the target element to quantitatively analyze the sample, but
this method usually cannot obtain satisfactory results. Therefore, a mul-
tivariate analysis strategy is usually adopted to establish the quantita-
tive model for the target element (Hernández-García et al., 2017).
Before establishing the multivariate model, variable selection algorithms
are usually recommended for selecting the optimal variables. Currently,
several classic variable selection methods, such as the successive pro-
jections algorithm (SPA) (Araújo et al., 2001), uninformative vari-
able elimination (UVE) (Han, Wu, Cai, Xu, & Yu, 2008), variable
importance in projection (VIP) (Farrés, Platikanov, Tsakovski, &
Tauler, 2015) and competitive adaptive reweighted sampling (CARS)
(Li, Liang, Xu, & Cao, 2009), are usually performed to select the in-
formative variables. However, these methods are complicated to use and
the algorithm code must be programmed by professional programmers.
On the other hand, univariate model based on the target line was usu-
ally used to try to establish the detection model in the past research,
but the prediction results usually can’t meet the accuracy requirements
of practical application due to the self-absorption effect, matrix effect
and changes in environmental factors during detection. In addition to
univariate model, many other different strategies were also tried to ana-
lyze the LIBS data, such as combination with other analytical instrument
(de Oliveira, Fontes, & Pasquini, 2019), correction of self-absorp-
tion (Tianqi, Hou, Jianlong, & Zhe, 2019) and novel feature selec-
tion strategies (Yan et al., 2019). Although high accuracy can be ob-
tained under the condition of these strategies, they are too complex for
non-professionals and only suitable for specific analysis object. There-
fore, a simple, efficient and widely adaptable method needs to be de-
veloped for LIBS data. To this end, a novel variable selection method,
the threshold variables (TV) method was proposed to eliminate the re-
dundant variables and establish the quantitative detection model. The
principle is to set a threshold value by observing the LIBS curve in or-
der to eliminate the variables of which the intensity are less than the set
threshold value. Therefore, the purpose of TV is to search the optimal
threshold value for each analysis element. After eliminating the noise
and redundant variables, the remaining variables are used as the input
variables for the multivariate model. To the best of our knowledge, this
is the first time to detect heavy metals of Sargassum fusiforme by com-
bining TV-PLS model and LIBS technique.
According to the above analysis, LIBS technique coupled with newly
proposed framework was used to quantitatively detect the content of
seven heavy metals in Sargassum fusiforme. To obtain the experimental
samples, Sargassum fusiforme were manually contaminated with arsenic
(As), chromium (Cd), cadmium (Cr), copper (Cu), mercury (Hg), lead
(Pb) and zinc (Zn). At the same time, three conventional variable selec-
tion methods SPA, UVE and VIP were adopted to verify the effectiveness
of the TV method by comparing model performances each other. More
concretely, the sub-objectives were as follows: (1) collecting the LIBS
spectral data of Sargassum fusiforme, (2) identifying the useful LIBS vari-
ables using the proposed TV method, (3) trying to establish the quan-
titative analysis model for several heavy metals based on full variables
and extracted useful variables, (4) verifying the effectiveness of the TV
method by comparing it with the full variable model and several vari-
able selection method models, and (5) simultaneously determining the
contents of multiple heavy metal elements in sargassum fusiforme.
2. Materials and methods
2.1. Sample collection and preparation
Sargassum fusiforme samples were cultured and harvested from an
aquaculture site (Dongtou Area, Wenzhou city,
2
U
N
C
O
R
R
E
C
T
E
D
P
R
O
O
F
L. Su et al. Food Chemistry xxx (xxxx) xxx-xxx
China) in April 2019. The standard solution of arsenic (As), cadmium
(Cd), chromium (Cr), copper (Cu), mercury (Hg), lead (Pb), and zinc
(Zn) in a concentration of 1000 ug/ml (provided by National Standards
Material Network-Beijing Century Aoke Biotechnology Co., Ltd.., Beijing
City, China) were diluted to a concentration of 20 ug/L for As, Cd, Cr,
Cu, and Hg and 50 ug/L for Pb, and Zn in seawater to artificially cont-
aminate the Sargassum fusiforme samples simultaneously. Samples were
reared for different number of days (up to 15 days) to accumulate the
elements As, Cd, Cr, Cu, Hg, Pb, and Zn. The heavy metals-contaminated
Sargassum fusiforme samples were collected every three days from the
manual containers. Finally, five stages of Sargassum fusiforme samples
were collected in five stages under seven heavy metal condition for fur-
ther analysis.
After the Sargassum fusiforme samples were collected, they were first
washed using the running distilled water sufficiently to remove the salt
and surface residual heavy metals, and then dried in an oven at 50 °C
for five hours until the sample was at a constant weight (the difference
between the two quality measurements is less than 0.0002 g). After dry-
ing, each prepared sample was ground and passed through a 100 mesh
screen to obtain approximately 0.3 g sample powder, and then the pow-
der was pressed at 20 MPa for one minute using a tableting machine.
Finally, a total of 100 pellets with a diameter of 14 mm and a thickness
of approximately 0.2 mm were prepared for the subsequent acquisition
of LIBS data.
2.2. Acquisition of LIBS data
The LIBS setup used in this work was a self-assembled developed
system, and a schematic diagram of the LIBS system was shown in
Fig. 1. It includes a spectrometer (Model: Aryelle 150, LTB Lasertech-
nik Berlin Ltd., Germany) for acquiring LIBS data, a Nd:YAG laser with
Q-switched function (Model: Nano SG150-10, Litron Ltd., UK) for emit-
ting plasma, and a 3D sample stage (Model: SC300-1A, Beijing Zolix
Lid., China). In addition, a digital delay generator (model: DG645, Stan-
ford Research Systems Inc. USA) was used to control the time delay of
the laser pulse during the scanning process. The parameters of the de-
vice units were controlled by a desktop computer to optimize the perfor
mance of the laser’s emission, and to transform the optics signal and
data processes.
The laser light featuring a short pulse and high energy was emit-
ted from the Nd:YAG laser source, and was projected onto the beam
splitter after deflection by the reflection mirror. A beam was transferred
onto the pellet sample after the convergence of laser light by a convex
lens. The excited plasma emitted from the pellet’s surface was collected
through a light collector accessory and digitalized by an ICCD spectrom-
eter. The parameters of the laser source were tested in preliminary trials,
and the optimized parameters were set for samples: 1064 nm @150 mJ
pulse energy, repetition rate of 5 Hz, and duration time of 6 ns. The
LIBS data feature a wavelength range of 217–800 nm with 30,267 wave-
bands. Spectral acquisition was performed on five points for each sam-
ple, and five spectra were acquired at each point, therefore, so that 25
spectra were obtained for each sample. The 25 spectra were averaged to
obtain LIBS spectra for each sample. Finally, the LIBS data matrix with
100 rows (sample number) and 30,267 columns (variable number) was
obtained.
2.3. Measurements of heavy metals
After collecting the LIBS data, the contents of seven heavy met-
als in Sargassum fusiforme were determined by inductively coupled
plasma-mass spectrometry (ICP-MS) according to the approach national
standards of People's Republic of China (GB 5009.268–2016). Before de-
tecting the concentration of the heavy metals, the quality control analy-
sis for ICP-MS was performed using 100 ug/ml of As, Cd, Cr, Cu, Hg,
Pb, and Zn standard solutions to calculate the recovery rate of each ele-
ment of this study. The main analysis procedures include sample diges-
tion, filtration and purification of the digestion solution, and digestion
solution detection using ICP-MS (ELAN DRC-e, Perkin Elmer, USA). All
of these steps were carried out by experimental technicians at the Zhe-
jiang Mariculture Research Institute. As a preliminary attempt to detect
multiple heavy metals in Sargassum fusiforme using the LIBS technique.
Only five concentrations for each heavy metal were detected. That is,
the heavy metal content in Sargassum fusiforme was determined at each
of the five harvest stages. The calculated recoveries rate of the seven
elements were in the range of 87.4%-102.2% and the relative standard
Fig. 1. Schematic diagram of LIBS setup.
3
U
N
C
O
R
R
E
C
T
E
D
P
R
O
O
F
L. Su et al. Food Chemistry xxx (xxxx) xxx-xxx
deviations were in the rage of 0.455–3.34%, which indicate the detec-
tion result is accurate and realistic. In addition, the statistical results of
the heavy metals concentration are shown in Table 1. It can be seen
that all of the elements have a large concentration range, which will be
beneficial to establish the stable regression model.
2.4. Multivariate data analysis
2.4.1. Calibration model
Partial least squares (PLS) was introduced approximately 30 years
ago by WOLD et al. (2001). Partial least squares–discriminant analysis
(PLS-DA) was also developed based on the PLS algorithm. Which have
the similar idea in constructing the calibration model (Xiaojing Chen
et al., 2020). In PLS, several orthogonal bases of latent variables are
constructed one by one so that they are oriented along directions of max-
imal covariance between the spectral matrix X and the response vector
Y. In this way, the latent variables are ordered according to their rele-
vance for predicting the Y variable. Then, the relationship (the regres-
sion model) between X and Y is established using several latent variables
(LVs). The method performs particularly well when the various X vari-
ables express common information, i.e., when there is a large amount of
correlation, or even collinearity, which is the case for spectral data of
intact biological material. More detailed information about PLSR can be
found in the literature (Geladi & Kowalski, 1985).
2.4.2. Variable selection methods
LIBS data usually contain thousands of variables, but most of them
are uninformative, redundant and noise variables. Therefore, variable
selection and elimination methods are recommended to select the op-
timal variable. In this study, a noise elimination method and three
classic variable selection methods were applied to simplify the calcu-
lation process and improve the model performance. The noise elimi-
nation method was named the threshold variables (TV) method. It is
generally acknowledged that LIBS spectra contain many low-intensity
noise variables that usually lead to the poor performance of quanti-
tative models. Therefore, TV was developed to eliminate these vari-
ables. There are four key steps in the TV method. First, the range
of the intensity for noise variables is determined based on the LIBS
curve. In this paper, the range of the intensity of elimination vari-
ables is from 5 to 30. Then, the interval elimination value was set
to 5, and the noise variables were deleted at the variables intensity
level of 5. Next in importance, the PLSR quantitative
Table 1
Statistics of the content of heavy metals in the Sargassum fusiforme samples (mg kg −1).
Elements Min Max Mean Standard Deviation
Arsenic (As) 0.011 45 10.047 17.680
Cadmium (Cd) 0.180 1.200 0.724 0.382
Chromium (Cr) 0.160 3.240 1.312 1.044
Copper (Cu) 3.90 13.500 7.000 3.434
Mercury (Hg) 0.024 0.082 0.048 0.023
Lead (Pd) 0.030 0.520 0.193 0.178
Zinc (Zn) 4.800 25.900 10.920 7.678
model was established based on the set of variables after the noise vari-
ables were eliminated. Finally, the prediction performance of the model
was compared to determine the optimal threshold for each heavy metal.
In addition to the TV method, three commonly used variables selec-
tion methods, SPA, UVE and VIP, were also adopted to select the in-
formative variables and build the comparison models. SPA extracts use-
ful variables by eliminating redundant and collinear variables. UVE ob-
tains the informative variables set based on the stability analysis of the
PLS regression coefficient. VIP evaluates the importance of each variable
based on the PLSR algorithm to identify the optimal variables. More de-
tailed information about SPA, UVE and VIP can be found in the litera-
ture (Araújo et al., 2001; Farrés et al., 2015; Han et al., 2008).
After the optimal variables were selected, the PLSR model was built
to comprehensively compare the performance of each prediction model
and quantitatively analyze the heavy metals in Sargassum fusiforme.
2.4.3. Model evaluation and calculation
When the calibration model was established, several evaluation in-
dices were calculated to evaluate the performance of the PLSR model.
In this study, root mean square error of calibration (RMSEC), root mean
square error of prediction (RMSEP), coefficients of determination of cal-
ibration (Rc2) and prediction (Rp2) and residual predictive deviation
(RPD) were calculated based on the predicted results to determine the
accuracy of the model. Additionally, the absolute difference between
RMSEC and RMSEP (ABS) was also considered to evaluate the model
robustness and stability. Briefly, an excellent calibration model should
have small RMSEC, RMSEP and ABS values and large Rc2, Rp2, and RPD
values. It was noted that all calculations in this study were performed in
the MATLAB 2015b environment (The Math Works, Natick, USA).
2.5. Heavy metal detection process using LIBS coupled with the newly
proposed framework
When the LIBS data was collected, the detection model will be con-
structed using multivariate model. As explained in the introduction, the
spectral dimension of LIBS data needs to be reduced. That is, the op-
timal variables need to be identified to simplify model calculation and
improve model performance. As shown in Fig. 2, when the information
of heavy metal elements contained in the LIBS spectra was collected by
LIBS setup. The newly proposed variables selection method of TV was
carried out to eliminate the noise variables whose intensity is lower than
the threshold value. Based on the principle of TV method (described in
Section 2.4.2), the intensity range of noise variables was determined
to be between 5 and 30 by directly observing the LIBS spectral curve
with the naked eye. And then the optimal threshold value was identified
by building calibration model by using variables with an intensity above
the threshold and determine the optimal threshold based on the model
performance. At last, the threshold value was identified and the use-
ful variables are retained while removing noise variables. At the same
time, other several variables selection methods SPA, UVE and VIP were
also adopted to select the optimal variables and build the regression
models. Finally, the performance of the prediction model was compared
with TV model, the effectiveness of the newly proposed framework is
4
U
N
C
O
R
R
E
C
T
E
D
P
R
O
O
F
L. Su et al. Food Chemistry xxx (xxxx) xxx-xxx
Fig. 2. Schematic illustration of heavy metal detection using LIBS coupled with the newly proposed framework.
verified, and the best detection model for several toxic heavy metal ele-
ments in Sargassum fusiforme was determined.
3. Results and discussion
3.1. Analysis of the LIBS curve
Fig. 3 shows the average LIBS spectral curve of Sargassum fusiforme
in the range of 217–800 nm. The characteristic lines of As, Cd, Cr, Cu,
Pb, Hg and Zn were identified on the basis of the databases of the Na-
tional Institute of Standards and Technology (NIST National Institute
of Standard and Technology USA. Electronic database). In addi-
tion, many other emission lines from mineral elements in Sargassum
fusiforme such as K, Na, Ca, and Fe were also identified. However, be-
cause the purpose of this study is to quantitatively analyze the above
seven heavy metals and the space limitations in Fig. 3, these elements
are not included in detail. Since the LIBS spectra from different harvest
periods have similar curves, it is difficult to simultaneously and quanti-
tatively analyze the heavy metal content for Sargassum fusiforme observ-
ing the LIBS spectra. Therefore, it is necessary to adopt the appropriate
chemometric methods to further analyze the LIBS data.
3.2. PLS regression based on full variables and threshold variables
Before creating the regression models, LIBS data were randomly
divided into a calibration set and a prediction set at a ratio of 2:1.
Consequently, 67 and 33 samples were contained in the calibration
and prediction sets, respectively.
Fig. 3. Average LIBS spectral profile of Sargassum fusiforme.
Then quantitative analysis models for heavy metals in Sargassum
fusiforme were conducted using the PLSR algorithm. Notably, the latent
variables (LVs) were determined by using the Monte Carlo cross-valida-
tion method in calibration set. A total of 30,267 variables were collected
using the LIBS system in this experiment. The PLSR model was first
established based on the full variables. The corresponding results are
shown in Table 2. Excellent performance were obtained for the heavy
metals Cr, Cu, Pb and Zn, which have Rp2 values of 0.968, 0.890, 0.924
and 0.950, respectively. For the heavy metals Cd and Hg, a satisfactory
prediction result was also obtained by the PLSR model, and the values of
Rp2 are 0.739 and 0.822, respectively. However, the performance of the
PLSR model for As is poor, with Rp2 value of 0.496, and the Rc2 is 0.998.
This finding indicates that the PLSR model with full variables for As has
poor predictive power and robustness compared with other elemental
models. Although good performances for most heavy metals can be ob-
tained using LIBS full variables, the calculation process of establishing
the PLSR model is too complex and time-consuming. Therefore, suitable
variable elimination or selection methods are suggested to simplify the
calculation process and further improve the model performance. To this
end, the TV method was carried out to eliminate the low-intensity noise
variables, and Table 2shows the calculated results. The number of vari-
ables was greatly reduced using the TV method, and most of the elim-
inated variables were noise variables of which the intensity was lower
than 30 counts. In addition, much better prediction results for all heavy
metals were obtained when comparing the performance of the thresh-
old value PLSR model (TV- PLSR) with that of the full variables PLSR
model (F-PLSR). Clearly, all of the PLSR models have Rp2 values larger
than 0.700, and the average Rp2 value is 0.900. This means the TV-PLSR
model established based on those selected variables using TV can quanti-
tatively and simultaneously analyze the heavy metal contents in Sargas-
sum fusiforme with accuracy. Nevertheless, it is worth noting that these
quantitative calibration models have a slight overfitting, which may be
caused by the phenomenon of shot-to-shot fluctuation (Stehrer, Pra-
her, Viskup, Jasik, & Pedarnig, 2009) and the problem of small sam-
ples and large variables (Subramanian & Simon, 2013). Generally, the
quantitative PLSR model’s results for heavy metals are acceptable. To
further verify the effectiveness of the TV method, optimal variables were
selected by adopting three classic variables selection methods and were
used to establish the PLSR models for seven heavy metals in Sargassum
fusiforme. The corresponding results were summarized and discussed in
Section 3.3.
5
U
N
C
O
R
R
E
C
T
E
D
P
R
O
O
F
L. Su et al. Food Chemistry xxx (xxxx) xxx-xxx
Table 2
Results of the PLSR model based on the full variables and threshold variables using TV.
Elements Methods LVs No. Calibration set Prediction set ABS
Rc 2
RMSEC Rp 2
RMSEP RPD
As No 18 30,267 0.998 0.760 0.496 12.172 1.408 11.412
TV 20 8212 0.993 1.484 0.743 8.689 2.107 7.205
Cd No 15 30,267 0.993 0.030 0.739 0.201 2.005 0.171
TV 17 10,998 0.989 0.040 0.843 0.147 2.755 0.107
Cr No 13 30,267 0.994 0.077 0.968 0.197 5.624 0.120
TV 17 17,533 0.999 0.027 0.977 0.167 6.623 0.140
Cu No 14 30,267 0.921 0.960 0.890 1.134 3.022 0.174
TV 20 13,737 1.000 0.046 0.961 0.814 5.486 0.768
Hg No 18 30,267 0.999 0.001 0.822 0.010 2.407 0.009
TV 18 15,853 0.997 0.001 0.871 0.009 2.924 0.007
Pb No 18 30,267 1.000 0.003 0.924 0.052 3.725 0.050
TV 20 8212 0.999 0.005 0.949 0.042 5.484 0.037
Zn No 17 30,267 1.000 0.162 0.950 1.811 4.606 1.648
TV 18 15,853 1.000 0.138 0.956 1.567 4.746 1.429
Methods: variables selection method; LVs: number of latent variables; No.: number of variables.
3.3. PLSR results based on the selected variables
By comparing the performance levels of the F-PLSR and TV-PLSR
models, it can be concluded that the low-intensity noise variables have
an adverse effect on the model accuracy and robustness. To avoid
selecting these low-intensity LIBS variables, three variables selection
methods SPA, UVE and VIP were performed on the remaining high-in-
tensity variables. Then, three PLSR prediction models were created
based on these selected optimal variables for each heavy metal ele-
ment in Sargassum fusiforme. The corresponding calculated results are
presented in Table 3. It can be clearly found that the number of
selected variables by SPA, UVE and
VIP is increased in turn and the number of the variable was greatly re-
duced (the least reduction from As is 88.21% from 8212 to 968). This
means that the calculation process for the calibration and prediction
model will be much faster and simper. However, the accuracy of the
prediction model was reduced. It can be seen from Table 3 that the
accuracy of the almost all of the PLSR model was lower than that of
TV-PLSR models. The best regression model for heavy metal As is the
SPA-PLSR model with the Rp2 value of 0.244. Therefore, it is impos-
sible to quantitatively analyze the As content for Sargassum fusiforme.
In contrast, the accuracy of the PLSR model for Zn was improved com-
pared with that of the TV-PLSR model (the Rp2 value of 0.956 vs. 0.967)
when the variable selection method of VIP was performed to estab
Table 3
Results of PLSR based on the selected variables using the SPA, UVE and VIP methods.
Elements Methods LVs No. Calibration set Prediction set ABS
Rc 2
RMSEC Rp 2
RMSEP RPD
As SPA 9 9 0.746 8.717 0.244 15.772 1.164 7.055
UVE 9 338 0.851 6.743 0.179 16.186 1.121 9.443
VIP 3 968 0.220 17.273 −0.350 12.316 0.888 4.957
Cd SPA 10 11 0.907 0.122 0.567 0.222 1.519 0.100
UVE 15 353 0.987 0.044 0.794 0.164 2.324 0.120
VIP 17 813 0.971 0.064 0.723 0.205 1.908 0.140
Cr SPA 5 5 0.966 0.192 0.953 0.221 4.682 0.029
UVE 15 428 0.999 0.038 0.959 0.226 5.217 0.189
VIP 20 1151 0.999 0.032 0.943 0.260 4.320 0.228
Cu SPA 7 7 0.944 0.760 0.920 1.037 3.583 0.276
UVE 8 855 0.970 0.602 0.855 1.262 2.713 0.660
VIP 8 965 0.943 0.744 0.842 1.485 2.524 0.741
Hg SPA 5 8 0.827 0.009 0.597 0.015 1.627 0.006
UVE 19 454 1.000 0.000 0.807 0.010 2.430 0.010
VIP 14 1033 0.950 0.005 0.475 0.015 1.449 0.010
Pb SPA 12 12 0.948 0.041 0.894 0.054 3.341 0.013
UVE 12 263 0.984 0.022 0.943 0.046 4.232 0.024
VIP 4 870 0.898 0.056 0.882 0.061 3.072 0.005
Zn SPA 8 8 0.958 1.449 0.937 2.130 3.985 0.682
UVE 19 254 1.000 0.107 0.941 1.936 4.125 1.829
VIP 5 1132 0.931 2.001 0.967 1.390 5.574 0.611
Methods: variables selection method; LVs: number of latent variables; No.: number of variables.
6
U
N
C
O
R
R
E
C
T
E
D
P
R
O
O
F
L. Su et al. Food Chemistry xxx (xxxx) xxx-xxx
lish the calibration model. Generally, the prediction accuracy was re-
duced after the variable selection methods were carried out, and the pre-
diction accuracy of the optimal regression model for each heavy metal is
also acceptable. The results indicate that it is a good strategy to conduct
variable selection when TV-PLSR models have high accuracy, which will
help to further simplify the calculation process. However, the framework
is the best choice to analyze the heavy metal in Sargassum fusiforme
when the prediction accuracy is the most important index. Therefore,
whether to adopt the variable selection algorithm should be analyzed
according to the specific situation.
3.4. Discussion
In this study, Sargassum fusiforme, which is popular with consumers
and has huge consumption, was chosen as the research object to col-
lect LIBS data and determine seven heavy metal contents (Milledge,
Nielsen, & Bailey, 2016). When the heavy metal content of Sargas-
sum fusiforme exceeds the standard, it will pose great harm to human
health. Moreover, sargassum fusiforme has a strong adsorption capac-
ity for heavy metals, which easily leads to excessive levels of heavy
metals in Sargassum fusiforme (Poo et al., 2018). But there is still a
lack of rapid and effective techniques and methods for the detection of
heavy metals Sargassum fusiforme. Therefore, developing a rapid detec-
tion method for heavy metal of Sargassum fusiforme is highly important
to consumers and the sargassum industry. Considering the above reasons
and the advantages of the LIBS technique, LIBS technique was applied to
simultaneously and quantitatively analyze the contents of seven heavy
metals in Sargassum fusiforme in this study. However, LIBS data usu-
ally contain a high-dimensional variables. Although some studies focus-
ing on the selection of the optimal variables have been conducted, these
methods usually contain complex concepts and calculation processes,
and many of them can only be used on a specific target sample. To solve
the problem, the TV method was proposed and used in this study. And
the performance of the TV-PLSR model was compared with full variable
and optimal variable PLSR models in the detection of seven heavy met-
als. Based on the evaluation criteria (Mouazen & Al-Walaan, 2014),
an RPD value between 2.5 and 3 or above corresponds to good and ex-
cellent prediction accuracy. According to the results in Tables 2 and
3, excellent quantitative prediction results were obtained for Cr, Cu,
Pb and Zn because their optimal models all have RPD values greater
than 3, a good quantitative model can be established for Cd and Hg,
and coarse quantitative analysis can be performed for As in Sargassum
fusiforme. Therefore, LIBS technique coupled with TV-PLS model can
be used to simultaneously analyze seven heavy metal contents in Sar-
gassum fusiforme. Moreover, when the establishment of rapid detection
model was finished, the simple and effective TV-PLS model can be em-
bedded in LIBS instrument to replace the traditional and complex wet
chemical detection method for the detection of quality and heavy metal
content of sargassum fusiforme.
4. Conclusion
A simple framework consisting of the TV method and PLSR model
was developed and combined with LIBS technique to simultaneously
and qualitatively analyze seven heavy metal contents in Sargassum
fusiforme. A total of five PLSR models were established for each heavy
metal based on
the full variables, threshold variables and three optimal variables set,
and their performances were compared. The calculated results show that
four best PLSR models analyzing the content of heavy metals Cr, Cu, Pb
and Zn had RPD values greater than 3, the two best PLSR models cor-
responding to the heavy metals Cd and Hg had RPD values in the range
of 2.5 to 3, and the optimal PLSR model for As had an RPD value of
2.107. Notably, six best PLSR models in seven models are from TV-PLSR
model. Which demonstrates the effectiveness and feasibility of the pro-
posed TV-PLSR framework coupled with the LIBS technique for simulta-
neously and quantitatively analyzing several heavy metals in Sargassum
fusiforme. This study provides an alternative method for rapid detection
of heavy metal in Sargassum fusiforme.
CRediT authorship contribution statement
Laijin Su: Data curation, Funding acquisition, Writing - original
draft. Wen Shi: Formal analysis, Writing - original draft, Writing - re-
view & editing. Xiaojing Chen: Formal analysis, Funding acquisi-
tion, Writing - review & editing. Liuwei Meng: Data curation, Method-
ology, Software. Leiming Yuan: Methodology. Xi Chen: Investiga-
tion. Guangzao Huang: Methodology, Software.
Declaration of Competing Interest
The authors declare that they have no known competing financial in-
terests or personal relationships that could have appeared to influence
the work reported in this paper.
Acknowledgements
This work was supported by National Natural Science Foundation of
China [31571920]; Zhejiang Province Public Welfare Technology Appli-
cation Research Project [2017C32098]; Wenzhou Science and Technol-
ogy Commissioner Special Project [X20170033]; Wenzhou Basic Pub-
lic Welfare Project [N20180014]; Wenzhou City's major scientific and
technological innovation project, research and application of Wenzhou's
main marine fish frozen storage quality control technology
[ZS2019001]; and Construction Project of Wenzhou Key Laboratory (En-
gineering Center) [ZD202003].
References
Anderson, D E, Ehlmann, B L, Forni, O, Clegg, S M, Cousin, A, Thomas, N H, … Gasnault,
O (2017). Characterization of LIBS emission lines for the identification of chlorides,
carbonates, and sulfates in salt/basalt mixtures for the application to MSL ChemCam
data. Journal of Geophysical Research, 122(4), 744–770.
Araújo, M C U, Saldanha, T C B, Galvão, R K H, Yoneyama, T, Chame, H C, & Visani,
V (2001). The successive projections algorithm for variable selection in spectroscopic
multicomponent analysis. Chemometrics & Intelligent Laboratory Systems, 57(2),
65–73.
Bilge, G., Sezer, B., Boyaci, I. H., Eseller, K. E., & Berberoğlu, H. (2018). Performance
evaluation of laser induced breakdown spectroscopy in the measurement of liq-
uid and solid samples. Spectrochimica Acta Part B Atomic Spectroscopy, 145,
S0584854717303324.
Chen, X, Liu, K, Cai, J, Zhu, D, & Chen, H (2015). Identification of heavy
metal-contaminated Tegillarca granosa using infrared spectroscopy. Analytical
Methods, 7(5), 2172–2181.
Cong, Q, Chen, H, Liao, W, Xiao, F, Wang, P, Qin, Y, … Ding, K (2016). Structural
characterization and effect on anti-angiogenic activity of a fucoidan from Sargassum
fusiforme. Carbohydrate Polymers, 136, 899–907.
7
U
N
C
O
R
R
E
C
T
E
D
P
R
O
O
F
L. Su et al. Food Chemistry xxx (xxxx) xxx-xxx
De, C A, De, P B, Dos, V A, & Quináia, S P (2018). Determination of Cu, Cd, Pb and Cr
in yogurt by slurry sampling electrothermal atomic absorption spectrometry: A case
study for Brazilian yogurt. Food Chemistry, 240, 268.
de Oliveira, D M, Fontes, L M, & Pasquini, C (2019). Comparing laser induced breakdown
spectroscopy, near infrared spectroscopy, and their integration for simultaneous
multi-elemental determination of micro- and macronutrients in vegetable samples.
Analytica Chimica Acta.
Farrés, M, Platikanov, S, Tsakovski, S, & Tauler, R (2015). Comparison of the variable
importance in projection (VIP) and of the selectivity ratio (SR) methods for variable
selection and interpretation. Journal of Chemometrics, 29(10), 528–536.
Fortes, F J, Moros, J, Lucena, P, Cabalin, L M, & Laserna, J J (2013). Laser-Induced
Breakdown Spectroscopy. Analytical Chemistry, 85(2), 640–669.
Gałuszka, A, Migaszewski, Z, & Namieśnik, J (2013). The 12 principles of green analytical
chemistry and the SIGNIFICANCE mnemonic of green analytical practices. TRAC
Trends in Analytical Chemistry, 50, 78–84.
Geladi, P, & Kowalski, B R (1985). Partial least-squares regression: A tutorial. Analytica
Chimica Acta, 185(86), 1–17.
Han, Q J, Wu, H L, Cai, C B, Xu, L, & Yu, R Q (2008). An ensemble of Monte Carlo
uninformative variable elimination for wavelength selection. Analytica Chimica Acta,
612(2), 121–125.
Hernández-García, R, Villanueva-Tagle, M E, Calderón-Piñar, F, Durruthy-Rodríguez, M
D, Aquino, F W B, Pereira-Filho, E R, & Pomares-Alfonso, M S (2017). Quantitative
analysis of Lead Zirconate Titanate (PZT) ceramics by laser-induced breakdown
spectroscopy (LIBS) in combination with multivariate calibration. Microchemical
Journal, 130, 21–26.
Hwang, I M, Moon, E W, Lee, H W, Jamila, N, Kim, K S, Ha, J H, & Kim, S H (2018).
Discrimination of chili powder origin using inductively coupled plasma-mass
spectrometry (ICP-MS), inductively coupled plasma-optical emission spectroscopy
(ICP-OES), and near infrared (NIR) spectroscopy. Analytical Letters, 52(6), 1–16.
Li, H, Liang, Y, Xu, Q, & Cao, D (2009). Key wavelengths screening using competitive
adaptive reweighted sampling method for multivariate calibration. Analytica Chimica
Acta, 648(1), 77–84.
Markiewicz-Keszycka, M, Cama-Moncunill, X, Casado-Gavalda, M P, Dixit, Y,
Cama-Moncunill, R, Cullen, P J, & Sullivan, C (2017). Laser-induced breakdown
spectroscopy (LIBS) for food analysis: A review. Trends in Food Science & Technology,
65, 80–93.
Milledge, J J, Nielsen, B V, & Bailey, D (2016). High-value products from macroalgae:
The potential uses of the invasive brown seaweed, Sargassum muticum. Reviews in
Environmental Science and Bio/Technology, 15(1), 67–88.
Mouazen, A M, & Al-Walaan, N (2014). Glucose adulteration in Saudi honey with visible
and near infrared spectroscopy. International Journal of Food Properties, 17(10),
2263–2274.
NIST National Institute of Standard and Technology USA. Electronic database. In.).
Peña-Icart, M, Pomares-Alfonso, M S, de Aquino, F W B, Alonso-Hernandez, C,
Bolaños-Alvarez, Y, & Pereira-Filho, E R (2017). Fast and direct detection of metal
accumulation in marine sediments using laser-induced breakdown spectroscopy
(LIBS): A case study from the Bay of Cienfuegos, Cuba. Analytical Methods, 9(24),
3713–3719.
Phuoc, T X, Wang, P, & McIntyre, D (2016). Detection of rare earth elements in Powder
River Basin sub-bituminous
coal ash using laser-induced breakdown spectroscopy (LIBS). Fuel, 163, 129–132.
Poo, K-M, Son, E-B, Chang, J-S, Ren, X, Choi, Y-J, & Chae, K-J (2018). Biochars derived
from wasted marine macro-algae (Saccharina japonica and Sargassum fusiforme) and
their potential for heavy metal removal in aqueous solution. Journal of Environmental
Management, 206, 364–372.
Roleda, M Y, Hélène, M, Natasa, D, Rósa, J, Jorunn, S, Céline, R, & Udo, N (2019).
Variations in polyphenol and heavy metal contents of wild-harvested and cultivated
seaweed bulk biomass: Health risk assessment and implication for food applications.
Food Control, 95, 121–134.
Sankhla, M S, Kumari, M, Nandan, M, Kumar, R, & Agrawal, P (2016). Heavy metals
contamination in water and their hazardous effect on human health—a review.
International Journal of Current Microbiology and Applied Sciences, 5(10), 759–766.
Senesi, G S, & Senesi, N (2016). Laser-induced breakdown spectroscopy (LIBS) to measure
quantitatively soil carbon with emphasis on soil organic carbon. A review. Analytica
Chimica Acta, 938, 7–17.
Stehrer, T, Praher, B, Viskup, R, Jasik, J, & Pedarnig, J D (2009). Laser-induced breakdown
spectroscopy of iron oxide powder. Journal of Analytical Atomic Spectrometry, 24(7),
973–978.
Subramanian, J, & Simon, R (2013). Overfitting in prediction models–is it a problem only
in high dimensions? Contemporary clinical trials, 36(2), 636–641.
Tianqi, Zongyu, Hou, Yangting, Jianlong, Weilun, Zhe, & Wang. (2019). Correction of
self-absorption effect in calibration-free laser-induced breakdown spectroscopy
(CF-LIBS) with blackbody radiation reference. Analytica Chimica Acta.
Wang, J, Tang, P, Zheng, P, & Xiang, Z (2017). Analysis of metal elements by solution
cathode glow discharge-atomic emission spectrometry with a modified pulsation
damper. Journal of Analytical Atomic Spectrometry, 32(10).
Wang, Q, & Yang, Z (2016). Industrial water pollution, water environment treatment, and
health risks in China. Environmental Pollution, 218, 358–365.
WOLD, Svante, SJÖSTRÖM, Michael, ERIKSSON, & Lennart (2001). PLS-regression: A
basic tool of chemometrics. Chemometrics & Intelligent Laboratory Systems, 58(2),
109–130.
Xiaojing Chen, Y X, Meng, L, Chen, X, Yuan, L, Cai, Q, Shi, W, & Huang, G (2020).
Non-parametric partial least squares–discriminant analysis model based on sum of
ranking difference algorithm for tea grade identification using electronic tongue data.
Sensors and Actuators B Chemical, 311.
Yan, C, Liang, J, Zhao, M, Zhang, X, Zhang, T, & Li, H (2019). A novel hybrid feature
selection strategy in quantitative analysis of laser-induced breakdown spectroscopy.
Analytica Chimica Acta, 1080, 35–42. doi:10.1016/j.aca.2019.07.012.
Yan, J, Hao, Z, Zhou, R, Tang, Y, Yang, P, Liu, K, … Zeng, X (2019). A quantitative
analysis method assisted by image features in laser-induced breakdown spectroscopy.
Analytica Chimica Acta.
Yang, J, Liu, C, Cai, H, Gu, D, Ji, Z, Guo, X, … Yang, Y (2019). Identification and
theoretical explanation of chemical composition against α-amylase in the n-hexane
extract from Sargassum fusiforme. Algal Research, 43, 101642.
Ye, Y, Ji, D, You, L, Zhou, L, Zhao, Z, & Brennan, C (2018). Structural properties
and protective effect of Sargassum fusiforme polysaccharides against ultraviolet B
radiation in hairless Kun Ming mice. Journal of Functional Foods, 43, 8–16.
8

Mais conteúdo relacionado

Semelhante a 代表性论文电子版文件1.pdf

Propensity of salicylamide and ethenzamide cocrystallization with aromatic ca...
Propensity of salicylamide and ethenzamide cocrystallization with aromatic ca...Propensity of salicylamide and ethenzamide cocrystallization with aromatic ca...
Propensity of salicylamide and ethenzamide cocrystallization with aromatic ca...Maciej Przybyłek
 
Identification of physical origin behind disorder, heterogeneity, and reconst...
Identification of physical origin behind disorder, heterogeneity, and reconst...Identification of physical origin behind disorder, heterogeneity, and reconst...
Identification of physical origin behind disorder, heterogeneity, and reconst...Taame Abraha Berhe
 
IRJET-A Review on Fungus Mediated Nanoparticles in the Control of Dengue Vect...
IRJET-A Review on Fungus Mediated Nanoparticles in the Control of Dengue Vect...IRJET-A Review on Fungus Mediated Nanoparticles in the Control of Dengue Vect...
IRJET-A Review on Fungus Mediated Nanoparticles in the Control of Dengue Vect...IRJET Journal
 
Final Version Faridi (12okt)
Final Version Faridi (12okt)Final Version Faridi (12okt)
Final Version Faridi (12okt)Faridi Purperhart
 
Assessment of environmental impact of manufacturing steel considering
Assessment of environmental impact of manufacturing steel consideringAssessment of environmental impact of manufacturing steel considering
Assessment of environmental impact of manufacturing steel consideringamaniaaa
 
Near and mid-infrared spectroscopic determination of algal composition
Near  and mid-infrared spectroscopic determination of algal compositionNear  and mid-infrared spectroscopic determination of algal composition
Near and mid-infrared spectroscopic determination of algal compositionzhenhua82
 
KINETIC STUDY OF CHROMIUM (III) – PVP COMPLEX BY USING RADIO-TRACER TECHNIQUE
KINETIC STUDY OF CHROMIUM (III) – PVP COMPLEX BY USING RADIO-TRACER TECHNIQUEKINETIC STUDY OF CHROMIUM (III) – PVP COMPLEX BY USING RADIO-TRACER TECHNIQUE
KINETIC STUDY OF CHROMIUM (III) – PVP COMPLEX BY USING RADIO-TRACER TECHNIQUEcscpconf
 
Concentrations of Heavy Metals in Hair of Sudanese Exploration Mining Gold Wo...
Concentrations of Heavy Metals in Hair of Sudanese Exploration Mining Gold Wo...Concentrations of Heavy Metals in Hair of Sudanese Exploration Mining Gold Wo...
Concentrations of Heavy Metals in Hair of Sudanese Exploration Mining Gold Wo...ijtsrd
 
Emilia Suomalainen - Dynamic modelling of material flows and sustainable reso...
Emilia Suomalainen - Dynamic modelling of material flows and sustainable reso...Emilia Suomalainen - Dynamic modelling of material flows and sustainable reso...
Emilia Suomalainen - Dynamic modelling of material flows and sustainable reso...Emilia Suomalainen
 
Green Synthesis of Silver Nanoparticles and their applications
Green Synthesis of Silver Nanoparticles and their applicationsGreen Synthesis of Silver Nanoparticles and their applications
Green Synthesis of Silver Nanoparticles and their applicationsJagpreet Singh
 
1 s2.0-s0892687519302365-main
1 s2.0-s0892687519302365-main1 s2.0-s0892687519302365-main
1 s2.0-s0892687519302365-mainShadaMamatha
 

Semelhante a 代表性论文电子版文件1.pdf (20)

Propensity of salicylamide and ethenzamide cocrystallization with aromatic ca...
Propensity of salicylamide and ethenzamide cocrystallization with aromatic ca...Propensity of salicylamide and ethenzamide cocrystallization with aromatic ca...
Propensity of salicylamide and ethenzamide cocrystallization with aromatic ca...
 
Dr.C.Kavitha (1).pdf
Dr.C.Kavitha (1).pdfDr.C.Kavitha (1).pdf
Dr.C.Kavitha (1).pdf
 
Dr.C.Kavitha.pdf
Dr.C.Kavitha.pdfDr.C.Kavitha.pdf
Dr.C.Kavitha.pdf
 
Dr.P.Vijayasarathi.pdf
Dr.P.Vijayasarathi.pdfDr.P.Vijayasarathi.pdf
Dr.P.Vijayasarathi.pdf
 
Identification of physical origin behind disorder, heterogeneity, and reconst...
Identification of physical origin behind disorder, heterogeneity, and reconst...Identification of physical origin behind disorder, heterogeneity, and reconst...
Identification of physical origin behind disorder, heterogeneity, and reconst...
 
Nanotechnology15
Nanotechnology15Nanotechnology15
Nanotechnology15
 
IRJET-A Review on Fungus Mediated Nanoparticles in the Control of Dengue Vect...
IRJET-A Review on Fungus Mediated Nanoparticles in the Control of Dengue Vect...IRJET-A Review on Fungus Mediated Nanoparticles in the Control of Dengue Vect...
IRJET-A Review on Fungus Mediated Nanoparticles in the Control of Dengue Vect...
 
Final Version Faridi (12okt)
Final Version Faridi (12okt)Final Version Faridi (12okt)
Final Version Faridi (12okt)
 
LC MS
LC MS LC MS
LC MS
 
Assessment of environmental impact of manufacturing steel considering
Assessment of environmental impact of manufacturing steel consideringAssessment of environmental impact of manufacturing steel considering
Assessment of environmental impact of manufacturing steel considering
 
Near and mid-infrared spectroscopic determination of algal composition
Near  and mid-infrared spectroscopic determination of algal compositionNear  and mid-infrared spectroscopic determination of algal composition
Near and mid-infrared spectroscopic determination of algal composition
 
Mass Spectrometry in Pharmacognosy
Mass Spectrometry in PharmacognosyMass Spectrometry in Pharmacognosy
Mass Spectrometry in Pharmacognosy
 
KINETIC STUDY OF CHROMIUM (III) – PVP COMPLEX BY USING RADIO-TRACER TECHNIQUE
KINETIC STUDY OF CHROMIUM (III) – PVP COMPLEX BY USING RADIO-TRACER TECHNIQUEKINETIC STUDY OF CHROMIUM (III) – PVP COMPLEX BY USING RADIO-TRACER TECHNIQUE
KINETIC STUDY OF CHROMIUM (III) – PVP COMPLEX BY USING RADIO-TRACER TECHNIQUE
 
Concentrations of Heavy Metals in Hair of Sudanese Exploration Mining Gold Wo...
Concentrations of Heavy Metals in Hair of Sudanese Exploration Mining Gold Wo...Concentrations of Heavy Metals in Hair of Sudanese Exploration Mining Gold Wo...
Concentrations of Heavy Metals in Hair of Sudanese Exploration Mining Gold Wo...
 
Sample_MRSchiller
Sample_MRSchillerSample_MRSchiller
Sample_MRSchiller
 
Emilia Suomalainen - Dynamic modelling of material flows and sustainable reso...
Emilia Suomalainen - Dynamic modelling of material flows and sustainable reso...Emilia Suomalainen - Dynamic modelling of material flows and sustainable reso...
Emilia Suomalainen - Dynamic modelling of material flows and sustainable reso...
 
Teng et al, (2015)-G3
Teng et al, (2015)-G3Teng et al, (2015)-G3
Teng et al, (2015)-G3
 
Senior Thesis
Senior ThesisSenior Thesis
Senior Thesis
 
Green Synthesis of Silver Nanoparticles and their applications
Green Synthesis of Silver Nanoparticles and their applicationsGreen Synthesis of Silver Nanoparticles and their applications
Green Synthesis of Silver Nanoparticles and their applications
 
1 s2.0-s0892687519302365-main
1 s2.0-s0892687519302365-main1 s2.0-s0892687519302365-main
1 s2.0-s0892687519302365-main
 

Último

Advanced Machine Learning for Business Professionals
Advanced Machine Learning for Business ProfessionalsAdvanced Machine Learning for Business Professionals
Advanced Machine Learning for Business ProfessionalsVICTOR MAESTRE RAMIREZ
 
Student Profile Sample report on improving academic performance by uniting gr...
Student Profile Sample report on improving academic performance by uniting gr...Student Profile Sample report on improving academic performance by uniting gr...
Student Profile Sample report on improving academic performance by uniting gr...Seán Kennedy
 
2006_GasProcessing_HB (1).pdf HYDROCARBON PROCESSING
2006_GasProcessing_HB (1).pdf HYDROCARBON PROCESSING2006_GasProcessing_HB (1).pdf HYDROCARBON PROCESSING
2006_GasProcessing_HB (1).pdf HYDROCARBON PROCESSINGmarianagonzalez07
 
INTERNSHIP ON PURBASHA COMPOSITE TEX LTD
INTERNSHIP ON PURBASHA COMPOSITE TEX LTDINTERNSHIP ON PURBASHA COMPOSITE TEX LTD
INTERNSHIP ON PURBASHA COMPOSITE TEX LTDRafezzaman
 
Biometric Authentication: The Evolution, Applications, Benefits and Challenge...
Biometric Authentication: The Evolution, Applications, Benefits and Challenge...Biometric Authentication: The Evolution, Applications, Benefits and Challenge...
Biometric Authentication: The Evolution, Applications, Benefits and Challenge...GQ Research
 
While-For-loop in python used in college
While-For-loop in python used in collegeWhile-For-loop in python used in college
While-For-loop in python used in collegessuser7a7cd61
 
Effects of Smartphone Addiction on the Academic Performances of Grades 9 to 1...
Effects of Smartphone Addiction on the Academic Performances of Grades 9 to 1...Effects of Smartphone Addiction on the Academic Performances of Grades 9 to 1...
Effects of Smartphone Addiction on the Academic Performances of Grades 9 to 1...limedy534
 
NLP Data Science Project Presentation:Predicting Heart Disease with NLP Data ...
NLP Data Science Project Presentation:Predicting Heart Disease with NLP Data ...NLP Data Science Project Presentation:Predicting Heart Disease with NLP Data ...
NLP Data Science Project Presentation:Predicting Heart Disease with NLP Data ...Boston Institute of Analytics
 
Multiple time frame trading analysis -brianshannon.pdf
Multiple time frame trading analysis -brianshannon.pdfMultiple time frame trading analysis -brianshannon.pdf
Multiple time frame trading analysis -brianshannon.pdfchwongval
 
办理学位证纽约大学毕业证(NYU毕业证书)原版一比一
办理学位证纽约大学毕业证(NYU毕业证书)原版一比一办理学位证纽约大学毕业证(NYU毕业证书)原版一比一
办理学位证纽约大学毕业证(NYU毕业证书)原版一比一fhwihughh
 
RABBIT: A CLI tool for identifying bots based on their GitHub events.
RABBIT: A CLI tool for identifying bots based on their GitHub events.RABBIT: A CLI tool for identifying bots based on their GitHub events.
RABBIT: A CLI tool for identifying bots based on their GitHub events.natarajan8993
 
Generative AI for Social Good at Open Data Science East 2024
Generative AI for Social Good at Open Data Science East 2024Generative AI for Social Good at Open Data Science East 2024
Generative AI for Social Good at Open Data Science East 2024Colleen Farrelly
 
Indian Call Girls in Abu Dhabi O5286O24O8 Call Girls in Abu Dhabi By Independ...
Indian Call Girls in Abu Dhabi O5286O24O8 Call Girls in Abu Dhabi By Independ...Indian Call Girls in Abu Dhabi O5286O24O8 Call Girls in Abu Dhabi By Independ...
Indian Call Girls in Abu Dhabi O5286O24O8 Call Girls in Abu Dhabi By Independ...dajasot375
 
Call Us ➥97111√47426🤳Call Girls in Aerocity (Delhi NCR)
Call Us ➥97111√47426🤳Call Girls in Aerocity (Delhi NCR)Call Us ➥97111√47426🤳Call Girls in Aerocity (Delhi NCR)
Call Us ➥97111√47426🤳Call Girls in Aerocity (Delhi NCR)jennyeacort
 
ASML's Taxonomy Adventure by Daniel Canter
ASML's Taxonomy Adventure by Daniel CanterASML's Taxonomy Adventure by Daniel Canter
ASML's Taxonomy Adventure by Daniel Cantervoginip
 
From idea to production in a day – Leveraging Azure ML and Streamlit to build...
From idea to production in a day – Leveraging Azure ML and Streamlit to build...From idea to production in a day – Leveraging Azure ML and Streamlit to build...
From idea to production in a day – Leveraging Azure ML and Streamlit to build...Florian Roscheck
 
办理学位证中佛罗里达大学毕业证,UCF成绩单原版一比一
办理学位证中佛罗里达大学毕业证,UCF成绩单原版一比一办理学位证中佛罗里达大学毕业证,UCF成绩单原版一比一
办理学位证中佛罗里达大学毕业证,UCF成绩单原版一比一F sss
 
RadioAdProWritingCinderellabyButleri.pdf
RadioAdProWritingCinderellabyButleri.pdfRadioAdProWritingCinderellabyButleri.pdf
RadioAdProWritingCinderellabyButleri.pdfgstagge
 

Último (20)

Advanced Machine Learning for Business Professionals
Advanced Machine Learning for Business ProfessionalsAdvanced Machine Learning for Business Professionals
Advanced Machine Learning for Business Professionals
 
Student Profile Sample report on improving academic performance by uniting gr...
Student Profile Sample report on improving academic performance by uniting gr...Student Profile Sample report on improving academic performance by uniting gr...
Student Profile Sample report on improving academic performance by uniting gr...
 
2006_GasProcessing_HB (1).pdf HYDROCARBON PROCESSING
2006_GasProcessing_HB (1).pdf HYDROCARBON PROCESSING2006_GasProcessing_HB (1).pdf HYDROCARBON PROCESSING
2006_GasProcessing_HB (1).pdf HYDROCARBON PROCESSING
 
INTERNSHIP ON PURBASHA COMPOSITE TEX LTD
INTERNSHIP ON PURBASHA COMPOSITE TEX LTDINTERNSHIP ON PURBASHA COMPOSITE TEX LTD
INTERNSHIP ON PURBASHA COMPOSITE TEX LTD
 
Biometric Authentication: The Evolution, Applications, Benefits and Challenge...
Biometric Authentication: The Evolution, Applications, Benefits and Challenge...Biometric Authentication: The Evolution, Applications, Benefits and Challenge...
Biometric Authentication: The Evolution, Applications, Benefits and Challenge...
 
While-For-loop in python used in college
While-For-loop in python used in collegeWhile-For-loop in python used in college
While-For-loop in python used in college
 
Effects of Smartphone Addiction on the Academic Performances of Grades 9 to 1...
Effects of Smartphone Addiction on the Academic Performances of Grades 9 to 1...Effects of Smartphone Addiction on the Academic Performances of Grades 9 to 1...
Effects of Smartphone Addiction on the Academic Performances of Grades 9 to 1...
 
Call Girls in Saket 99530🔝 56974 Escort Service
Call Girls in Saket 99530🔝 56974 Escort ServiceCall Girls in Saket 99530🔝 56974 Escort Service
Call Girls in Saket 99530🔝 56974 Escort Service
 
Deep Generative Learning for All - The Gen AI Hype (Spring 2024)
Deep Generative Learning for All - The Gen AI Hype (Spring 2024)Deep Generative Learning for All - The Gen AI Hype (Spring 2024)
Deep Generative Learning for All - The Gen AI Hype (Spring 2024)
 
NLP Data Science Project Presentation:Predicting Heart Disease with NLP Data ...
NLP Data Science Project Presentation:Predicting Heart Disease with NLP Data ...NLP Data Science Project Presentation:Predicting Heart Disease with NLP Data ...
NLP Data Science Project Presentation:Predicting Heart Disease with NLP Data ...
 
Multiple time frame trading analysis -brianshannon.pdf
Multiple time frame trading analysis -brianshannon.pdfMultiple time frame trading analysis -brianshannon.pdf
Multiple time frame trading analysis -brianshannon.pdf
 
办理学位证纽约大学毕业证(NYU毕业证书)原版一比一
办理学位证纽约大学毕业证(NYU毕业证书)原版一比一办理学位证纽约大学毕业证(NYU毕业证书)原版一比一
办理学位证纽约大学毕业证(NYU毕业证书)原版一比一
 
RABBIT: A CLI tool for identifying bots based on their GitHub events.
RABBIT: A CLI tool for identifying bots based on their GitHub events.RABBIT: A CLI tool for identifying bots based on their GitHub events.
RABBIT: A CLI tool for identifying bots based on their GitHub events.
 
Generative AI for Social Good at Open Data Science East 2024
Generative AI for Social Good at Open Data Science East 2024Generative AI for Social Good at Open Data Science East 2024
Generative AI for Social Good at Open Data Science East 2024
 
Indian Call Girls in Abu Dhabi O5286O24O8 Call Girls in Abu Dhabi By Independ...
Indian Call Girls in Abu Dhabi O5286O24O8 Call Girls in Abu Dhabi By Independ...Indian Call Girls in Abu Dhabi O5286O24O8 Call Girls in Abu Dhabi By Independ...
Indian Call Girls in Abu Dhabi O5286O24O8 Call Girls in Abu Dhabi By Independ...
 
Call Us ➥97111√47426🤳Call Girls in Aerocity (Delhi NCR)
Call Us ➥97111√47426🤳Call Girls in Aerocity (Delhi NCR)Call Us ➥97111√47426🤳Call Girls in Aerocity (Delhi NCR)
Call Us ➥97111√47426🤳Call Girls in Aerocity (Delhi NCR)
 
ASML's Taxonomy Adventure by Daniel Canter
ASML's Taxonomy Adventure by Daniel CanterASML's Taxonomy Adventure by Daniel Canter
ASML's Taxonomy Adventure by Daniel Canter
 
From idea to production in a day – Leveraging Azure ML and Streamlit to build...
From idea to production in a day – Leveraging Azure ML and Streamlit to build...From idea to production in a day – Leveraging Azure ML and Streamlit to build...
From idea to production in a day – Leveraging Azure ML and Streamlit to build...
 
办理学位证中佛罗里达大学毕业证,UCF成绩单原版一比一
办理学位证中佛罗里达大学毕业证,UCF成绩单原版一比一办理学位证中佛罗里达大学毕业证,UCF成绩单原版一比一
办理学位证中佛罗里达大学毕业证,UCF成绩单原版一比一
 
RadioAdProWritingCinderellabyButleri.pdf
RadioAdProWritingCinderellabyButleri.pdfRadioAdProWritingCinderellabyButleri.pdf
RadioAdProWritingCinderellabyButleri.pdf
 

代表性论文电子版文件1.pdf

  • 1. U N C O R R E C T E D P R O O F Food Chemistry xxx (xxxx) xxx-xxx Contents lists available at ScienceDirect Food Chemistry journal homepage: http://ees.elsevier.com Simultaneously and quantitatively analyze the heavy metals in Sargassum fusiforme by laser-induced breakdown spectroscopy LaijinSua,b , WenShic,⁎ , XiaojingChenc,⁎ , LiuweiMengc , LeimingYuanc , XiChenc , GuangzaoHuangc a Wenzhou Academy of Agricultural Sciences, Wenzhou 325006, PR China b Wenzhou Characteristic Food Resources Engineering and Technology Research Center, Wenzhou 325006, PR China c College of Electrical and Electronic Engineering, Wenzhou University, Wenzhou 325035, PR China A R T I C L E I N F O Keywords Sargassum fusiforme Laser-induced breakdown spectroscopy Heavy metal Qualitative analysis Threshold variables method Variable selection method A B S T R A C T As a nutritious and popular seafood among consumers, Sargassum fusiforme is susceptible to the toxic heavy met- als because of its strong adsorption properties. In this study, laser-induced breakdown spectroscopy (LIBS) cou- pled with a simple framework (only remove some noise and low-intensity variables, and then combine with PLS algorithm) was used to establish the detection models to simultaneously and quantitatively analyze the content of heavy metals arsenic (As), chromium (Cd), cadmium (Cr), copper (Cu), mercury (Hg), lead (Pb) and zinc (Zn) in Sargassum fusiforme. As comparisons, three classic variable methods of successive projections algorithm (SPA), uninformative variable elimination (UVE) and variable importance in projection (VIP) were adopted. The final results showed that six of seven heavy metal models from the TV-PLSR model were optimal. These results demon- strate that the TV-PLSR framework combined with LIBS technique is an effective framework for quantitatively analyzing the heavy metals in Sargassum fusiforme. 1. Introduction Sargassum fusiforme belonging to the Sargassaceae family is a kind of algae that is widely distributed along the coast of Asia (Cong et al., 2016). Due to its rich nutrient components, such as minerals, di- etary fiber, polysaccharides, protein, and vitamins, Sargassum fusiforme has been a popular health seafood among consumers, especially in Chi- nese market (Yang et al., 2019). Furthermore, it also has the ef- fects of scavenging free radicals, anti-oxidation and enhancing immu- nity. Therefore, Sargassum fusiforme is also a medicinal seafood (Ye et al., 2018). Over the past several decades, the rapid development of industry has produced a tremendous amount of pollution, which has led to many cultural coastal zones being at high risk of exposure to industrial pollutions (Wang & Yang, 2016). Consequently, many nu- trient metals in Sargassum fusiforme, such as copper (Cu), chromium (Cr) and zinc (Zn) become toxic heavy metals with the increases of concentration level. As one of the most important pollutants, toxic heavy metals have become a serious environmen tal issue due to their significant toxic impacts on living organisms (Mo- han et al., 2014). Since these toxic heavy metals cannot be degraded by biological systems, they ultimately bioaccumulate in living organ- isms through the food chain (Sankhla, Kumari, Nandan, Kumar, & Agrawal, 2016). According to relevant studies, Sargassum fusiforme has a strong adsorption capacity for heavy metal and is susceptible to heavy metal pollution (Poo et al., 2018). Therefore, Sargassum fusiforme is likely to contain excessive amounts of toxic heavy metals when exposed to heavy metal pollution. Toxic heavy metals have a highly toxic effect on public health even at trace levels (Roleda et al., 2019). In addi- tion, consumers are increasingly paying attention to food safety with the improvement of living standards. Thus, it is essential to develop a rapid and accurate detection model for several heavy metals to ensure the quality and safety of Sargassum fusiforme. There are various commonly used heavy metal detection methods, such as atomic absorption spectroscopy (De, De, Dos, & Quináia, 2018), flame or atomic emission spectroscopy (Wang, Tang, Zheng, & Xiang, 2017), inductively ⁎ Corresponding authors. E-mail addresses: shiwen@wzu.edu.cn (W. Shi); chenxj@wzu.edu.cn (X. Chen) https://doi.org/10.1016/j.foodchem.2020.127797 Received 5 November 2019; Received in revised form 13 July 2020; Accepted 6 August 2020 Available online xxx 0308-8146/© 2020.
  • 2. U N C O R R E C T E D P R O O F L. Su et al. Food Chemistry xxx (xxxx) xxx-xxx coupled plasma optimal emission and mass spectroscopy (Hwang et al., 2018). Although these methods can obtain sensitive and accurate results, the complex preprocessing and the use of toxic and expensive chemical reagents make these methods unable to meet the requirements of non-destruction and green detection, such as the detection of some precious and rare sample. (Gałuszka, Migaszewski, & Namieśnik, 2013). In addition, infrared spectroscopy was also tried to detect the metal heavy metal in seafood (Chen, Liu, Cai, Zhu, & Chen, 2015). However, this method can only qualitatively identify heavy metal pol- lution and cannot meet the requirements of quantitative detection. As for the issue, laser-induced breakdown spectroscopy (LIBS), a kind of atomic emission spectroscopy technique, has been used to analyze many mineral elements for gas, solid and liquid samples (Bilge, Sezer, Boy- aci, Eseller, & Berberoğlu, 2018). The main principle of LIBS is to use a high power pulsed laser beam which focus onto the sample sur- face to create the high temperature plasma containing atoms and ions. Then, the emission lines were released in the cooling of plasma in which the atoms and ions return to the fundamental state with the plasma cooling. (Fortes, Moros, Lucena, Cabalin, & Laserna, 2013). Af- terwards, these emission lines that can provide spectral signature were detected by a spectrometer. Consequently, the type of element present in plasma can be identified based on the emission line position of tar- geted element and multiple elements of the sample can be qualitatively and quantitatively analyzed according to the position and intensity of the emission lines (Anderson et al., 2017). In addition to being able to analyze multiple elements simultaneously, LIBS has many other ad- vantages, such as being non-destructive or causing only microlosses of the sample, offering real-time fast online detection and having no need for chemical reagents (Peña-Icart et al., 2017). Hence, LIBS has been widely used in food (Markiewicz-Keszycka et al., 2017), agriculture (Senesi & Senesi, 2016), energy (Phuoc, Wang, & McIntyre, 2016) and other fields in recent years. Although each element of sample has its own unique LIBS excitation lines whose intensity information can be used to quantitatively analyze the content or concentration of tar- get elements in samples, the universal analysis method can not accu- rately quantify the concentrations between the emission line intensity and element content in sample. To address this issue, multivariate cal- ibration method were usually used to establish the quantitative analy- sis model. Nowadays, many studies have been conducted on the quan- titative analysis of LIBS data and great progress has been made. For in- stance, yan et al proposed an image feature method for the quantita- tive analysis of LIBS data and content of nickel (Ni) in alloy steel was determined. Good results with the coefficient of determination (R2) of 0.9996 was obtained. Which demonstrated the potential of LIBS tech- nique in elemental quantitative analysis element (Yan et al., 2019). It is well known that LIBS data usually contain thousands of variables, but many variables are uninformative. At present, there are two com- monly used strategies to analyze LIBS data. One method uses the emis- sion lines of the target element to quantitatively analyze the sample, but this method usually cannot obtain satisfactory results. Therefore, a mul- tivariate analysis strategy is usually adopted to establish the quantita- tive model for the target element (Hernández-García et al., 2017). Before establishing the multivariate model, variable selection algorithms are usually recommended for selecting the optimal variables. Currently, several classic variable selection methods, such as the successive pro- jections algorithm (SPA) (Araújo et al., 2001), uninformative vari- able elimination (UVE) (Han, Wu, Cai, Xu, & Yu, 2008), variable importance in projection (VIP) (Farrés, Platikanov, Tsakovski, & Tauler, 2015) and competitive adaptive reweighted sampling (CARS) (Li, Liang, Xu, & Cao, 2009), are usually performed to select the in- formative variables. However, these methods are complicated to use and the algorithm code must be programmed by professional programmers. On the other hand, univariate model based on the target line was usu- ally used to try to establish the detection model in the past research, but the prediction results usually can’t meet the accuracy requirements of practical application due to the self-absorption effect, matrix effect and changes in environmental factors during detection. In addition to univariate model, many other different strategies were also tried to ana- lyze the LIBS data, such as combination with other analytical instrument (de Oliveira, Fontes, & Pasquini, 2019), correction of self-absorp- tion (Tianqi, Hou, Jianlong, & Zhe, 2019) and novel feature selec- tion strategies (Yan et al., 2019). Although high accuracy can be ob- tained under the condition of these strategies, they are too complex for non-professionals and only suitable for specific analysis object. There- fore, a simple, efficient and widely adaptable method needs to be de- veloped for LIBS data. To this end, a novel variable selection method, the threshold variables (TV) method was proposed to eliminate the re- dundant variables and establish the quantitative detection model. The principle is to set a threshold value by observing the LIBS curve in or- der to eliminate the variables of which the intensity are less than the set threshold value. Therefore, the purpose of TV is to search the optimal threshold value for each analysis element. After eliminating the noise and redundant variables, the remaining variables are used as the input variables for the multivariate model. To the best of our knowledge, this is the first time to detect heavy metals of Sargassum fusiforme by com- bining TV-PLS model and LIBS technique. According to the above analysis, LIBS technique coupled with newly proposed framework was used to quantitatively detect the content of seven heavy metals in Sargassum fusiforme. To obtain the experimental samples, Sargassum fusiforme were manually contaminated with arsenic (As), chromium (Cd), cadmium (Cr), copper (Cu), mercury (Hg), lead (Pb) and zinc (Zn). At the same time, three conventional variable selec- tion methods SPA, UVE and VIP were adopted to verify the effectiveness of the TV method by comparing model performances each other. More concretely, the sub-objectives were as follows: (1) collecting the LIBS spectral data of Sargassum fusiforme, (2) identifying the useful LIBS vari- ables using the proposed TV method, (3) trying to establish the quan- titative analysis model for several heavy metals based on full variables and extracted useful variables, (4) verifying the effectiveness of the TV method by comparing it with the full variable model and several vari- able selection method models, and (5) simultaneously determining the contents of multiple heavy metal elements in sargassum fusiforme. 2. Materials and methods 2.1. Sample collection and preparation Sargassum fusiforme samples were cultured and harvested from an aquaculture site (Dongtou Area, Wenzhou city, 2
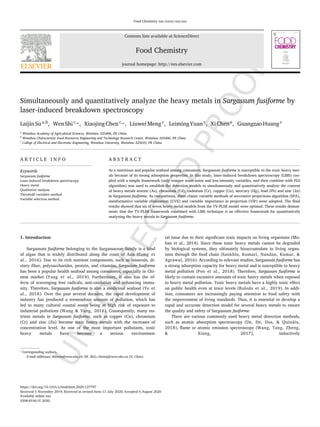
  • 3. U N C O R R E C T E D P R O O F L. Su et al. Food Chemistry xxx (xxxx) xxx-xxx China) in April 2019. The standard solution of arsenic (As), cadmium (Cd), chromium (Cr), copper (Cu), mercury (Hg), lead (Pb), and zinc (Zn) in a concentration of 1000 ug/ml (provided by National Standards Material Network-Beijing Century Aoke Biotechnology Co., Ltd.., Beijing City, China) were diluted to a concentration of 20 ug/L for As, Cd, Cr, Cu, and Hg and 50 ug/L for Pb, and Zn in seawater to artificially cont- aminate the Sargassum fusiforme samples simultaneously. Samples were reared for different number of days (up to 15 days) to accumulate the elements As, Cd, Cr, Cu, Hg, Pb, and Zn. The heavy metals-contaminated Sargassum fusiforme samples were collected every three days from the manual containers. Finally, five stages of Sargassum fusiforme samples were collected in five stages under seven heavy metal condition for fur- ther analysis. After the Sargassum fusiforme samples were collected, they were first washed using the running distilled water sufficiently to remove the salt and surface residual heavy metals, and then dried in an oven at 50 °C for five hours until the sample was at a constant weight (the difference between the two quality measurements is less than 0.0002 g). After dry- ing, each prepared sample was ground and passed through a 100 mesh screen to obtain approximately 0.3 g sample powder, and then the pow- der was pressed at 20 MPa for one minute using a tableting machine. Finally, a total of 100 pellets with a diameter of 14 mm and a thickness of approximately 0.2 mm were prepared for the subsequent acquisition of LIBS data. 2.2. Acquisition of LIBS data The LIBS setup used in this work was a self-assembled developed system, and a schematic diagram of the LIBS system was shown in Fig. 1. It includes a spectrometer (Model: Aryelle 150, LTB Lasertech- nik Berlin Ltd., Germany) for acquiring LIBS data, a Nd:YAG laser with Q-switched function (Model: Nano SG150-10, Litron Ltd., UK) for emit- ting plasma, and a 3D sample stage (Model: SC300-1A, Beijing Zolix Lid., China). In addition, a digital delay generator (model: DG645, Stan- ford Research Systems Inc. USA) was used to control the time delay of the laser pulse during the scanning process. The parameters of the de- vice units were controlled by a desktop computer to optimize the perfor mance of the laser’s emission, and to transform the optics signal and data processes. The laser light featuring a short pulse and high energy was emit- ted from the Nd:YAG laser source, and was projected onto the beam splitter after deflection by the reflection mirror. A beam was transferred onto the pellet sample after the convergence of laser light by a convex lens. The excited plasma emitted from the pellet’s surface was collected through a light collector accessory and digitalized by an ICCD spectrom- eter. The parameters of the laser source were tested in preliminary trials, and the optimized parameters were set for samples: 1064 nm @150 mJ pulse energy, repetition rate of 5 Hz, and duration time of 6 ns. The LIBS data feature a wavelength range of 217–800 nm with 30,267 wave- bands. Spectral acquisition was performed on five points for each sam- ple, and five spectra were acquired at each point, therefore, so that 25 spectra were obtained for each sample. The 25 spectra were averaged to obtain LIBS spectra for each sample. Finally, the LIBS data matrix with 100 rows (sample number) and 30,267 columns (variable number) was obtained. 2.3. Measurements of heavy metals After collecting the LIBS data, the contents of seven heavy met- als in Sargassum fusiforme were determined by inductively coupled plasma-mass spectrometry (ICP-MS) according to the approach national standards of People's Republic of China (GB 5009.268–2016). Before de- tecting the concentration of the heavy metals, the quality control analy- sis for ICP-MS was performed using 100 ug/ml of As, Cd, Cr, Cu, Hg, Pb, and Zn standard solutions to calculate the recovery rate of each ele- ment of this study. The main analysis procedures include sample diges- tion, filtration and purification of the digestion solution, and digestion solution detection using ICP-MS (ELAN DRC-e, Perkin Elmer, USA). All of these steps were carried out by experimental technicians at the Zhe- jiang Mariculture Research Institute. As a preliminary attempt to detect multiple heavy metals in Sargassum fusiforme using the LIBS technique. Only five concentrations for each heavy metal were detected. That is, the heavy metal content in Sargassum fusiforme was determined at each of the five harvest stages. The calculated recoveries rate of the seven elements were in the range of 87.4%-102.2% and the relative standard Fig. 1. Schematic diagram of LIBS setup. 3
  • 4. U N C O R R E C T E D P R O O F L. Su et al. Food Chemistry xxx (xxxx) xxx-xxx deviations were in the rage of 0.455–3.34%, which indicate the detec- tion result is accurate and realistic. In addition, the statistical results of the heavy metals concentration are shown in Table 1. It can be seen that all of the elements have a large concentration range, which will be beneficial to establish the stable regression model. 2.4. Multivariate data analysis 2.4.1. Calibration model Partial least squares (PLS) was introduced approximately 30 years ago by WOLD et al. (2001). Partial least squares–discriminant analysis (PLS-DA) was also developed based on the PLS algorithm. Which have the similar idea in constructing the calibration model (Xiaojing Chen et al., 2020). In PLS, several orthogonal bases of latent variables are constructed one by one so that they are oriented along directions of max- imal covariance between the spectral matrix X and the response vector Y. In this way, the latent variables are ordered according to their rele- vance for predicting the Y variable. Then, the relationship (the regres- sion model) between X and Y is established using several latent variables (LVs). The method performs particularly well when the various X vari- ables express common information, i.e., when there is a large amount of correlation, or even collinearity, which is the case for spectral data of intact biological material. More detailed information about PLSR can be found in the literature (Geladi & Kowalski, 1985). 2.4.2. Variable selection methods LIBS data usually contain thousands of variables, but most of them are uninformative, redundant and noise variables. Therefore, variable selection and elimination methods are recommended to select the op- timal variable. In this study, a noise elimination method and three classic variable selection methods were applied to simplify the calcu- lation process and improve the model performance. The noise elimi- nation method was named the threshold variables (TV) method. It is generally acknowledged that LIBS spectra contain many low-intensity noise variables that usually lead to the poor performance of quanti- tative models. Therefore, TV was developed to eliminate these vari- ables. There are four key steps in the TV method. First, the range of the intensity for noise variables is determined based on the LIBS curve. In this paper, the range of the intensity of elimination vari- ables is from 5 to 30. Then, the interval elimination value was set to 5, and the noise variables were deleted at the variables intensity level of 5. Next in importance, the PLSR quantitative Table 1 Statistics of the content of heavy metals in the Sargassum fusiforme samples (mg kg −1). Elements Min Max Mean Standard Deviation Arsenic (As) 0.011 45 10.047 17.680 Cadmium (Cd) 0.180 1.200 0.724 0.382 Chromium (Cr) 0.160 3.240 1.312 1.044 Copper (Cu) 3.90 13.500 7.000 3.434 Mercury (Hg) 0.024 0.082 0.048 0.023 Lead (Pd) 0.030 0.520 0.193 0.178 Zinc (Zn) 4.800 25.900 10.920 7.678 model was established based on the set of variables after the noise vari- ables were eliminated. Finally, the prediction performance of the model was compared to determine the optimal threshold for each heavy metal. In addition to the TV method, three commonly used variables selec- tion methods, SPA, UVE and VIP, were also adopted to select the in- formative variables and build the comparison models. SPA extracts use- ful variables by eliminating redundant and collinear variables. UVE ob- tains the informative variables set based on the stability analysis of the PLS regression coefficient. VIP evaluates the importance of each variable based on the PLSR algorithm to identify the optimal variables. More de- tailed information about SPA, UVE and VIP can be found in the litera- ture (Araújo et al., 2001; Farrés et al., 2015; Han et al., 2008). After the optimal variables were selected, the PLSR model was built to comprehensively compare the performance of each prediction model and quantitatively analyze the heavy metals in Sargassum fusiforme. 2.4.3. Model evaluation and calculation When the calibration model was established, several evaluation in- dices were calculated to evaluate the performance of the PLSR model. In this study, root mean square error of calibration (RMSEC), root mean square error of prediction (RMSEP), coefficients of determination of cal- ibration (Rc2) and prediction (Rp2) and residual predictive deviation (RPD) were calculated based on the predicted results to determine the accuracy of the model. Additionally, the absolute difference between RMSEC and RMSEP (ABS) was also considered to evaluate the model robustness and stability. Briefly, an excellent calibration model should have small RMSEC, RMSEP and ABS values and large Rc2, Rp2, and RPD values. It was noted that all calculations in this study were performed in the MATLAB 2015b environment (The Math Works, Natick, USA). 2.5. Heavy metal detection process using LIBS coupled with the newly proposed framework When the LIBS data was collected, the detection model will be con- structed using multivariate model. As explained in the introduction, the spectral dimension of LIBS data needs to be reduced. That is, the op- timal variables need to be identified to simplify model calculation and improve model performance. As shown in Fig. 2, when the information of heavy metal elements contained in the LIBS spectra was collected by LIBS setup. The newly proposed variables selection method of TV was carried out to eliminate the noise variables whose intensity is lower than the threshold value. Based on the principle of TV method (described in Section 2.4.2), the intensity range of noise variables was determined to be between 5 and 30 by directly observing the LIBS spectral curve with the naked eye. And then the optimal threshold value was identified by building calibration model by using variables with an intensity above the threshold and determine the optimal threshold based on the model performance. At last, the threshold value was identified and the use- ful variables are retained while removing noise variables. At the same time, other several variables selection methods SPA, UVE and VIP were also adopted to select the optimal variables and build the regression models. Finally, the performance of the prediction model was compared with TV model, the effectiveness of the newly proposed framework is 4
  • 5. U N C O R R E C T E D P R O O F L. Su et al. Food Chemistry xxx (xxxx) xxx-xxx Fig. 2. Schematic illustration of heavy metal detection using LIBS coupled with the newly proposed framework. verified, and the best detection model for several toxic heavy metal ele- ments in Sargassum fusiforme was determined. 3. Results and discussion 3.1. Analysis of the LIBS curve Fig. 3 shows the average LIBS spectral curve of Sargassum fusiforme in the range of 217–800 nm. The characteristic lines of As, Cd, Cr, Cu, Pb, Hg and Zn were identified on the basis of the databases of the Na- tional Institute of Standards and Technology (NIST National Institute of Standard and Technology USA. Electronic database). In addi- tion, many other emission lines from mineral elements in Sargassum fusiforme such as K, Na, Ca, and Fe were also identified. However, be- cause the purpose of this study is to quantitatively analyze the above seven heavy metals and the space limitations in Fig. 3, these elements are not included in detail. Since the LIBS spectra from different harvest periods have similar curves, it is difficult to simultaneously and quanti- tatively analyze the heavy metal content for Sargassum fusiforme observ- ing the LIBS spectra. Therefore, it is necessary to adopt the appropriate chemometric methods to further analyze the LIBS data. 3.2. PLS regression based on full variables and threshold variables Before creating the regression models, LIBS data were randomly divided into a calibration set and a prediction set at a ratio of 2:1. Consequently, 67 and 33 samples were contained in the calibration and prediction sets, respectively. Fig. 3. Average LIBS spectral profile of Sargassum fusiforme. Then quantitative analysis models for heavy metals in Sargassum fusiforme were conducted using the PLSR algorithm. Notably, the latent variables (LVs) were determined by using the Monte Carlo cross-valida- tion method in calibration set. A total of 30,267 variables were collected using the LIBS system in this experiment. The PLSR model was first established based on the full variables. The corresponding results are shown in Table 2. Excellent performance were obtained for the heavy metals Cr, Cu, Pb and Zn, which have Rp2 values of 0.968, 0.890, 0.924 and 0.950, respectively. For the heavy metals Cd and Hg, a satisfactory prediction result was also obtained by the PLSR model, and the values of Rp2 are 0.739 and 0.822, respectively. However, the performance of the PLSR model for As is poor, with Rp2 value of 0.496, and the Rc2 is 0.998. This finding indicates that the PLSR model with full variables for As has poor predictive power and robustness compared with other elemental models. Although good performances for most heavy metals can be ob- tained using LIBS full variables, the calculation process of establishing the PLSR model is too complex and time-consuming. Therefore, suitable variable elimination or selection methods are suggested to simplify the calculation process and further improve the model performance. To this end, the TV method was carried out to eliminate the low-intensity noise variables, and Table 2shows the calculated results. The number of vari- ables was greatly reduced using the TV method, and most of the elim- inated variables were noise variables of which the intensity was lower than 30 counts. In addition, much better prediction results for all heavy metals were obtained when comparing the performance of the thresh- old value PLSR model (TV- PLSR) with that of the full variables PLSR model (F-PLSR). Clearly, all of the PLSR models have Rp2 values larger than 0.700, and the average Rp2 value is 0.900. This means the TV-PLSR model established based on those selected variables using TV can quanti- tatively and simultaneously analyze the heavy metal contents in Sargas- sum fusiforme with accuracy. Nevertheless, it is worth noting that these quantitative calibration models have a slight overfitting, which may be caused by the phenomenon of shot-to-shot fluctuation (Stehrer, Pra- her, Viskup, Jasik, & Pedarnig, 2009) and the problem of small sam- ples and large variables (Subramanian & Simon, 2013). Generally, the quantitative PLSR model’s results for heavy metals are acceptable. To further verify the effectiveness of the TV method, optimal variables were selected by adopting three classic variables selection methods and were used to establish the PLSR models for seven heavy metals in Sargassum fusiforme. The corresponding results were summarized and discussed in Section 3.3. 5
  • 6. U N C O R R E C T E D P R O O F L. Su et al. Food Chemistry xxx (xxxx) xxx-xxx Table 2 Results of the PLSR model based on the full variables and threshold variables using TV. Elements Methods LVs No. Calibration set Prediction set ABS Rc 2 RMSEC Rp 2 RMSEP RPD As No 18 30,267 0.998 0.760 0.496 12.172 1.408 11.412 TV 20 8212 0.993 1.484 0.743 8.689 2.107 7.205 Cd No 15 30,267 0.993 0.030 0.739 0.201 2.005 0.171 TV 17 10,998 0.989 0.040 0.843 0.147 2.755 0.107 Cr No 13 30,267 0.994 0.077 0.968 0.197 5.624 0.120 TV 17 17,533 0.999 0.027 0.977 0.167 6.623 0.140 Cu No 14 30,267 0.921 0.960 0.890 1.134 3.022 0.174 TV 20 13,737 1.000 0.046 0.961 0.814 5.486 0.768 Hg No 18 30,267 0.999 0.001 0.822 0.010 2.407 0.009 TV 18 15,853 0.997 0.001 0.871 0.009 2.924 0.007 Pb No 18 30,267 1.000 0.003 0.924 0.052 3.725 0.050 TV 20 8212 0.999 0.005 0.949 0.042 5.484 0.037 Zn No 17 30,267 1.000 0.162 0.950 1.811 4.606 1.648 TV 18 15,853 1.000 0.138 0.956 1.567 4.746 1.429 Methods: variables selection method; LVs: number of latent variables; No.: number of variables. 3.3. PLSR results based on the selected variables By comparing the performance levels of the F-PLSR and TV-PLSR models, it can be concluded that the low-intensity noise variables have an adverse effect on the model accuracy and robustness. To avoid selecting these low-intensity LIBS variables, three variables selection methods SPA, UVE and VIP were performed on the remaining high-in- tensity variables. Then, three PLSR prediction models were created based on these selected optimal variables for each heavy metal ele- ment in Sargassum fusiforme. The corresponding calculated results are presented in Table 3. It can be clearly found that the number of selected variables by SPA, UVE and VIP is increased in turn and the number of the variable was greatly re- duced (the least reduction from As is 88.21% from 8212 to 968). This means that the calculation process for the calibration and prediction model will be much faster and simper. However, the accuracy of the prediction model was reduced. It can be seen from Table 3 that the accuracy of the almost all of the PLSR model was lower than that of TV-PLSR models. The best regression model for heavy metal As is the SPA-PLSR model with the Rp2 value of 0.244. Therefore, it is impos- sible to quantitatively analyze the As content for Sargassum fusiforme. In contrast, the accuracy of the PLSR model for Zn was improved com- pared with that of the TV-PLSR model (the Rp2 value of 0.956 vs. 0.967) when the variable selection method of VIP was performed to estab Table 3 Results of PLSR based on the selected variables using the SPA, UVE and VIP methods. Elements Methods LVs No. Calibration set Prediction set ABS Rc 2 RMSEC Rp 2 RMSEP RPD As SPA 9 9 0.746 8.717 0.244 15.772 1.164 7.055 UVE 9 338 0.851 6.743 0.179 16.186 1.121 9.443 VIP 3 968 0.220 17.273 −0.350 12.316 0.888 4.957 Cd SPA 10 11 0.907 0.122 0.567 0.222 1.519 0.100 UVE 15 353 0.987 0.044 0.794 0.164 2.324 0.120 VIP 17 813 0.971 0.064 0.723 0.205 1.908 0.140 Cr SPA 5 5 0.966 0.192 0.953 0.221 4.682 0.029 UVE 15 428 0.999 0.038 0.959 0.226 5.217 0.189 VIP 20 1151 0.999 0.032 0.943 0.260 4.320 0.228 Cu SPA 7 7 0.944 0.760 0.920 1.037 3.583 0.276 UVE 8 855 0.970 0.602 0.855 1.262 2.713 0.660 VIP 8 965 0.943 0.744 0.842 1.485 2.524 0.741 Hg SPA 5 8 0.827 0.009 0.597 0.015 1.627 0.006 UVE 19 454 1.000 0.000 0.807 0.010 2.430 0.010 VIP 14 1033 0.950 0.005 0.475 0.015 1.449 0.010 Pb SPA 12 12 0.948 0.041 0.894 0.054 3.341 0.013 UVE 12 263 0.984 0.022 0.943 0.046 4.232 0.024 VIP 4 870 0.898 0.056 0.882 0.061 3.072 0.005 Zn SPA 8 8 0.958 1.449 0.937 2.130 3.985 0.682 UVE 19 254 1.000 0.107 0.941 1.936 4.125 1.829 VIP 5 1132 0.931 2.001 0.967 1.390 5.574 0.611 Methods: variables selection method; LVs: number of latent variables; No.: number of variables. 6
  • 7. U N C O R R E C T E D P R O O F L. Su et al. Food Chemistry xxx (xxxx) xxx-xxx lish the calibration model. Generally, the prediction accuracy was re- duced after the variable selection methods were carried out, and the pre- diction accuracy of the optimal regression model for each heavy metal is also acceptable. The results indicate that it is a good strategy to conduct variable selection when TV-PLSR models have high accuracy, which will help to further simplify the calculation process. However, the framework is the best choice to analyze the heavy metal in Sargassum fusiforme when the prediction accuracy is the most important index. Therefore, whether to adopt the variable selection algorithm should be analyzed according to the specific situation. 3.4. Discussion In this study, Sargassum fusiforme, which is popular with consumers and has huge consumption, was chosen as the research object to col- lect LIBS data and determine seven heavy metal contents (Milledge, Nielsen, & Bailey, 2016). When the heavy metal content of Sargas- sum fusiforme exceeds the standard, it will pose great harm to human health. Moreover, sargassum fusiforme has a strong adsorption capac- ity for heavy metals, which easily leads to excessive levels of heavy metals in Sargassum fusiforme (Poo et al., 2018). But there is still a lack of rapid and effective techniques and methods for the detection of heavy metals Sargassum fusiforme. Therefore, developing a rapid detec- tion method for heavy metal of Sargassum fusiforme is highly important to consumers and the sargassum industry. Considering the above reasons and the advantages of the LIBS technique, LIBS technique was applied to simultaneously and quantitatively analyze the contents of seven heavy metals in Sargassum fusiforme in this study. However, LIBS data usu- ally contain a high-dimensional variables. Although some studies focus- ing on the selection of the optimal variables have been conducted, these methods usually contain complex concepts and calculation processes, and many of them can only be used on a specific target sample. To solve the problem, the TV method was proposed and used in this study. And the performance of the TV-PLSR model was compared with full variable and optimal variable PLSR models in the detection of seven heavy met- als. Based on the evaluation criteria (Mouazen & Al-Walaan, 2014), an RPD value between 2.5 and 3 or above corresponds to good and ex- cellent prediction accuracy. According to the results in Tables 2 and 3, excellent quantitative prediction results were obtained for Cr, Cu, Pb and Zn because their optimal models all have RPD values greater than 3, a good quantitative model can be established for Cd and Hg, and coarse quantitative analysis can be performed for As in Sargassum fusiforme. Therefore, LIBS technique coupled with TV-PLS model can be used to simultaneously analyze seven heavy metal contents in Sar- gassum fusiforme. Moreover, when the establishment of rapid detection model was finished, the simple and effective TV-PLS model can be em- bedded in LIBS instrument to replace the traditional and complex wet chemical detection method for the detection of quality and heavy metal content of sargassum fusiforme. 4. Conclusion A simple framework consisting of the TV method and PLSR model was developed and combined with LIBS technique to simultaneously and qualitatively analyze seven heavy metal contents in Sargassum fusiforme. A total of five PLSR models were established for each heavy metal based on the full variables, threshold variables and three optimal variables set, and their performances were compared. The calculated results show that four best PLSR models analyzing the content of heavy metals Cr, Cu, Pb and Zn had RPD values greater than 3, the two best PLSR models cor- responding to the heavy metals Cd and Hg had RPD values in the range of 2.5 to 3, and the optimal PLSR model for As had an RPD value of 2.107. Notably, six best PLSR models in seven models are from TV-PLSR model. Which demonstrates the effectiveness and feasibility of the pro- posed TV-PLSR framework coupled with the LIBS technique for simulta- neously and quantitatively analyzing several heavy metals in Sargassum fusiforme. This study provides an alternative method for rapid detection of heavy metal in Sargassum fusiforme. CRediT authorship contribution statement Laijin Su: Data curation, Funding acquisition, Writing - original draft. Wen Shi: Formal analysis, Writing - original draft, Writing - re- view & editing. Xiaojing Chen: Formal analysis, Funding acquisi- tion, Writing - review & editing. Liuwei Meng: Data curation, Method- ology, Software. Leiming Yuan: Methodology. Xi Chen: Investiga- tion. Guangzao Huang: Methodology, Software. Declaration of Competing Interest The authors declare that they have no known competing financial in- terests or personal relationships that could have appeared to influence the work reported in this paper. Acknowledgements This work was supported by National Natural Science Foundation of China [31571920]; Zhejiang Province Public Welfare Technology Appli- cation Research Project [2017C32098]; Wenzhou Science and Technol- ogy Commissioner Special Project [X20170033]; Wenzhou Basic Pub- lic Welfare Project [N20180014]; Wenzhou City's major scientific and technological innovation project, research and application of Wenzhou's main marine fish frozen storage quality control technology [ZS2019001]; and Construction Project of Wenzhou Key Laboratory (En- gineering Center) [ZD202003]. References Anderson, D E, Ehlmann, B L, Forni, O, Clegg, S M, Cousin, A, Thomas, N H, … Gasnault, O (2017). Characterization of LIBS emission lines for the identification of chlorides, carbonates, and sulfates in salt/basalt mixtures for the application to MSL ChemCam data. Journal of Geophysical Research, 122(4), 744–770. Araújo, M C U, Saldanha, T C B, Galvão, R K H, Yoneyama, T, Chame, H C, & Visani, V (2001). The successive projections algorithm for variable selection in spectroscopic multicomponent analysis. Chemometrics & Intelligent Laboratory Systems, 57(2), 65–73. Bilge, G., Sezer, B., Boyaci, I. H., Eseller, K. E., & Berberoğlu, H. (2018). Performance evaluation of laser induced breakdown spectroscopy in the measurement of liq- uid and solid samples. Spectrochimica Acta Part B Atomic Spectroscopy, 145, S0584854717303324. Chen, X, Liu, K, Cai, J, Zhu, D, & Chen, H (2015). Identification of heavy metal-contaminated Tegillarca granosa using infrared spectroscopy. Analytical Methods, 7(5), 2172–2181. Cong, Q, Chen, H, Liao, W, Xiao, F, Wang, P, Qin, Y, … Ding, K (2016). Structural characterization and effect on anti-angiogenic activity of a fucoidan from Sargassum fusiforme. Carbohydrate Polymers, 136, 899–907. 7
  • 8. U N C O R R E C T E D P R O O F L. Su et al. Food Chemistry xxx (xxxx) xxx-xxx De, C A, De, P B, Dos, V A, & Quináia, S P (2018). Determination of Cu, Cd, Pb and Cr in yogurt by slurry sampling electrothermal atomic absorption spectrometry: A case study for Brazilian yogurt. Food Chemistry, 240, 268. de Oliveira, D M, Fontes, L M, & Pasquini, C (2019). Comparing laser induced breakdown spectroscopy, near infrared spectroscopy, and their integration for simultaneous multi-elemental determination of micro- and macronutrients in vegetable samples. Analytica Chimica Acta. Farrés, M, Platikanov, S, Tsakovski, S, & Tauler, R (2015). Comparison of the variable importance in projection (VIP) and of the selectivity ratio (SR) methods for variable selection and interpretation. Journal of Chemometrics, 29(10), 528–536. Fortes, F J, Moros, J, Lucena, P, Cabalin, L M, & Laserna, J J (2013). Laser-Induced Breakdown Spectroscopy. Analytical Chemistry, 85(2), 640–669. Gałuszka, A, Migaszewski, Z, & Namieśnik, J (2013). The 12 principles of green analytical chemistry and the SIGNIFICANCE mnemonic of green analytical practices. TRAC Trends in Analytical Chemistry, 50, 78–84. Geladi, P, & Kowalski, B R (1985). Partial least-squares regression: A tutorial. Analytica Chimica Acta, 185(86), 1–17. Han, Q J, Wu, H L, Cai, C B, Xu, L, & Yu, R Q (2008). An ensemble of Monte Carlo uninformative variable elimination for wavelength selection. Analytica Chimica Acta, 612(2), 121–125. Hernández-García, R, Villanueva-Tagle, M E, Calderón-Piñar, F, Durruthy-Rodríguez, M D, Aquino, F W B, Pereira-Filho, E R, & Pomares-Alfonso, M S (2017). Quantitative analysis of Lead Zirconate Titanate (PZT) ceramics by laser-induced breakdown spectroscopy (LIBS) in combination with multivariate calibration. Microchemical Journal, 130, 21–26. Hwang, I M, Moon, E W, Lee, H W, Jamila, N, Kim, K S, Ha, J H, & Kim, S H (2018). Discrimination of chili powder origin using inductively coupled plasma-mass spectrometry (ICP-MS), inductively coupled plasma-optical emission spectroscopy (ICP-OES), and near infrared (NIR) spectroscopy. Analytical Letters, 52(6), 1–16. Li, H, Liang, Y, Xu, Q, & Cao, D (2009). Key wavelengths screening using competitive adaptive reweighted sampling method for multivariate calibration. Analytica Chimica Acta, 648(1), 77–84. Markiewicz-Keszycka, M, Cama-Moncunill, X, Casado-Gavalda, M P, Dixit, Y, Cama-Moncunill, R, Cullen, P J, & Sullivan, C (2017). Laser-induced breakdown spectroscopy (LIBS) for food analysis: A review. Trends in Food Science & Technology, 65, 80–93. Milledge, J J, Nielsen, B V, & Bailey, D (2016). High-value products from macroalgae: The potential uses of the invasive brown seaweed, Sargassum muticum. Reviews in Environmental Science and Bio/Technology, 15(1), 67–88. Mouazen, A M, & Al-Walaan, N (2014). Glucose adulteration in Saudi honey with visible and near infrared spectroscopy. International Journal of Food Properties, 17(10), 2263–2274. NIST National Institute of Standard and Technology USA. Electronic database. In.). Peña-Icart, M, Pomares-Alfonso, M S, de Aquino, F W B, Alonso-Hernandez, C, Bolaños-Alvarez, Y, & Pereira-Filho, E R (2017). Fast and direct detection of metal accumulation in marine sediments using laser-induced breakdown spectroscopy (LIBS): A case study from the Bay of Cienfuegos, Cuba. Analytical Methods, 9(24), 3713–3719. Phuoc, T X, Wang, P, & McIntyre, D (2016). Detection of rare earth elements in Powder River Basin sub-bituminous coal ash using laser-induced breakdown spectroscopy (LIBS). Fuel, 163, 129–132. Poo, K-M, Son, E-B, Chang, J-S, Ren, X, Choi, Y-J, & Chae, K-J (2018). Biochars derived from wasted marine macro-algae (Saccharina japonica and Sargassum fusiforme) and their potential for heavy metal removal in aqueous solution. Journal of Environmental Management, 206, 364–372. Roleda, M Y, Hélène, M, Natasa, D, Rósa, J, Jorunn, S, Céline, R, & Udo, N (2019). Variations in polyphenol and heavy metal contents of wild-harvested and cultivated seaweed bulk biomass: Health risk assessment and implication for food applications. Food Control, 95, 121–134. Sankhla, M S, Kumari, M, Nandan, M, Kumar, R, & Agrawal, P (2016). Heavy metals contamination in water and their hazardous effect on human health—a review. International Journal of Current Microbiology and Applied Sciences, 5(10), 759–766. Senesi, G S, & Senesi, N (2016). Laser-induced breakdown spectroscopy (LIBS) to measure quantitatively soil carbon with emphasis on soil organic carbon. A review. Analytica Chimica Acta, 938, 7–17. Stehrer, T, Praher, B, Viskup, R, Jasik, J, & Pedarnig, J D (2009). Laser-induced breakdown spectroscopy of iron oxide powder. Journal of Analytical Atomic Spectrometry, 24(7), 973–978. Subramanian, J, & Simon, R (2013). Overfitting in prediction models–is it a problem only in high dimensions? Contemporary clinical trials, 36(2), 636–641. Tianqi, Zongyu, Hou, Yangting, Jianlong, Weilun, Zhe, & Wang. (2019). Correction of self-absorption effect in calibration-free laser-induced breakdown spectroscopy (CF-LIBS) with blackbody radiation reference. Analytica Chimica Acta. Wang, J, Tang, P, Zheng, P, & Xiang, Z (2017). Analysis of metal elements by solution cathode glow discharge-atomic emission spectrometry with a modified pulsation damper. Journal of Analytical Atomic Spectrometry, 32(10). Wang, Q, & Yang, Z (2016). Industrial water pollution, water environment treatment, and health risks in China. Environmental Pollution, 218, 358–365. WOLD, Svante, SJÖSTRÖM, Michael, ERIKSSON, & Lennart (2001). PLS-regression: A basic tool of chemometrics. Chemometrics & Intelligent Laboratory Systems, 58(2), 109–130. Xiaojing Chen, Y X, Meng, L, Chen, X, Yuan, L, Cai, Q, Shi, W, & Huang, G (2020). Non-parametric partial least squares–discriminant analysis model based on sum of ranking difference algorithm for tea grade identification using electronic tongue data. Sensors and Actuators B Chemical, 311. Yan, C, Liang, J, Zhao, M, Zhang, X, Zhang, T, & Li, H (2019). A novel hybrid feature selection strategy in quantitative analysis of laser-induced breakdown spectroscopy. Analytica Chimica Acta, 1080, 35–42. doi:10.1016/j.aca.2019.07.012. Yan, J, Hao, Z, Zhou, R, Tang, Y, Yang, P, Liu, K, … Zeng, X (2019). A quantitative analysis method assisted by image features in laser-induced breakdown spectroscopy. Analytica Chimica Acta. Yang, J, Liu, C, Cai, H, Gu, D, Ji, Z, Guo, X, … Yang, Y (2019). Identification and theoretical explanation of chemical composition against α-amylase in the n-hexane extract from Sargassum fusiforme. Algal Research, 43, 101642. Ye, Y, Ji, D, You, L, Zhou, L, Zhao, Z, & Brennan, C (2018). Structural properties and protective effect of Sargassum fusiforme polysaccharides against ultraviolet B radiation in hairless Kun Ming mice. Journal of Functional Foods, 43, 8–16. 8