5e consulting method statement for program management

5E Consulting, india, ahmedabad, sourabh agarwal, readesign, architecture, project management, sustainabilityl estate, Project Feasibility, Research, Technology and system, Economic commercial, Legal, green building, leed, griha, sustainability, Swapnil anil, real estate demand assessment, Ahmedabad, ranchi, cept, nicmar, energy star rating, interior design, earned value management, pert, cpm, Microsoft project, primavera, material management, multiplex, truck terminal, amusement park, bridge, building, park, garden, bus stop, viability study, planning, infrastructure, environment, usgbc, igbc, teri, leed ap, housing, construction, contractor, sbst, school of building science and technology, flyover, industrial shead, shed, water harvesting, heat island effect, third party inspection, telecom towers, eoi, rfp, storm water management, energy modeling, renewable energy, carbon credits, 5e, five elements, five e, 5, e, consultants, consultancy, consulting, rainwater harvesting, solar energy, wind energy, green power, green e, construction activity pollution prevention, fsi, saleable area, gicea, carpet area, builtup built-up, area, super builtup, mckinsey, plants, reuse, recycling, resource, reduction, Rajkot, solid waste management, ocean villa resort, cottage, tourism, tourists, survey, opinion survey, cvc, classified volume count mdf agrifibre board rfp eoi tender estimation quantity survey hvac air conditioning power albedo aquifer architectural architect performance index performance monitoring dashboard basis of design commissioning report agent biofuel vermin-composting vermin composting waste to energy blackwater brownfield vc pe funding venture capital private equity bankable feasibility reports document power point excel ms project leed rating platinum certified 1so 9000 14001 automation density carbon dioxide climate change rainfall flood commissioning authority Inddor environmental quality air quality controls factor End-to-End Integrated Solution Provider linking the entire value chains from Planning & Architecture to Engineering/Design to Project Management across various sectors: Core Infrastructure, Urban Services, Public Health Eng, Transportation and Value Added/ Themed based/ Integrated Development. premier design engineering and consultancy organization Budget Business Process Modeling Transportation

Recomendados
Mais conteúdo relacionado
Mais procurados
Mais procurados (19)
Destaque
Destaque (20)
Semelhante a 5e consulting method statement for program management
Semelhante a 5e consulting method statement for program management (20)
Mais de 5e Consulting
Mais de 5e Consulting (8)
Último
Último (20)
5e consulting method statement for program management
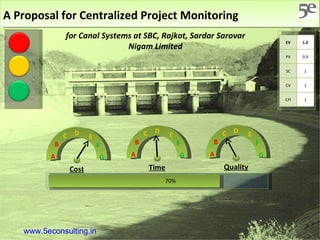
- 1. A Proposal for Centralized Project Monitoring 70% for Canal Systems at SBC, Rajkot, Sardar Sarovar Nigam Limited Cost Time Quality A B C D G F E A B C D G F E A B C D G F E www.5econsulting.in EV 1.0 PV 0.9 SC 1 CV 1 CPI 1
- 2. h elping e xecute your p rojects 5e Consulting Approach & Methodology For Program Management www.5econsulting.in 5E Consulting, india, ahmedabad, sourabh agarwal, readesign, architecture, project management, sustainabilityl estate, Project Feasibility, Research, Technology and system, Economic commercial, Legal, green building, leed, griha, sustainability, Swapnil anil, real estate demand assessment, Ahmedabad, ranchi, cept, nicmar, energy star rating, interior design, earned value management, pert, cpm, Microsoft project, primavera, material management, multiplex, truck terminal, amusement park, bridge, building, park, garden, bus stop, viability study, planning, infrastructure, environment, usgbc, igbc, teri, leed ap, housing, construction, contractor, sbst, school of building science and technology, flyover, industrial shead, shed, water harvesting, heat island effect, third party inspection, telecom towers, eoi, rfp, storm water management, energy modeling, renewable energy, carbon credits, 5e, five elements, five e, 5, e, consultants, consultancy, consulting, rainwater harvesting, solar energy, wind energy, green power, green e, construction activity pollution prevention, fsi, saleable area, gicea, carpet area, builtup built-up, area super builtup mckinsey plants reuse recycling resource reduction Rajkot solid waste management ocean villa resort cottage tourism tourists survey opinion survey cvc classified volume count mdf agrifibre board rfp eoi tender estimation quantity survey hvac air conditioning power albedo aquifer architectural architect performance index performance monitoring dashboard basis of design commissioning report agent biofuel vermin-composting vermin composting waste to energy blackwater brownfield vc pe funding venture capital private equity bankable feasibility reports document power point excel ms project leed rating platinum certified 1so 9000 14001 automation density carbon dioxide climate change rainfall flood commissioning authority Inddor environmental quality air quality controls factor End-to-End Integrated Solution Provider linking the entire value chains from Planning & Architecture to Engineering/Design to Project Management across various sectors: Core Infrastructure, Urban Services, Public Health Eng, Transportation and Value Added/ Themed based/ Integrated Development. premier design engineering and consultancy organization Budget Business Process ModelingTransportation
- 3. 5E Consulting, india, ahmedabad, sourabh agarwal, readesign, architecture, project management, sustainabilityl estate, Project Feasibility, Research, Technology and system, Economic commercial, Legal, green building, leed, griha, sustainability, Swapnil anil, real estate demand assessment, Ahmedabad, ranchi, cept, nicmar, energy star rating, interior design, earned value management, pert, cpm, Microsoft project, primavera, material management, multiplex, truck terminal, amusement park, bridge, building, park, garden, bus stop, viability study, planning, infrastructure, environment, usgbc, igbc, teri, leed ap, housing, construction, contractor, sbst, school of building science and technology, flyover, industrial shead, shed, water harvesting, heat island effect, third party inspection, telecom towers, eoi, rfp, storm water management, energy modeling, renewable energy, carbon credits, 5e, five elements, five e, 5, e, consultants, consultancy, consulting, rainwater harvesting, solar energy, wind energy, green power, green e, construction activity pollution prevention, fsi, saleable area, gicea, carpet area, builtup built-up, area super builtup mckinsey plants reuse recycling resource reduction Rajkot solid waste management ocean villa resort cottage tourism tourists survey opinion survey cvc classified volume count mdf agrifibre board rfp eoi tender estimation quantity survey hvac air conditioning power albedo aquifer architectural architect performance index performance monitoring dashboard basis of design commissioning report agent biofuel vermin-composting vermin composting waste to energy blackwater brownfield vc pe funding venture capital private equity bankable feasibility reports document power point excel ms project leed rating platinum certified 1so 9000 14001 automation density carbon dioxide climate change rainfall flood commissioning authority Inddor environmental quality air quality controls factor End-to-End Integrated Solution Provider linking the entire value chains from Planning & Architecture to Engineering/Design to Project Management across various sectors: Core Infrastructure, Urban Services, Public Health Eng, Transportation and Value Added/ Themed based/ Integrated Development. premier design engineering and consultancy organization Budget Business Process ModelingTransportation HO & Registered Office Mumbai E-8, Suman Apartments, Opp Aggarwal Residency, Shankar Lane, Kandiwali West, Mumbai-64 Contact Mr. Parthiv Soni Landline Mobile +91-9930316916 Email [email_address] 6 Mangal, 3A Vishrut Bunglows, Opposite A School Subhash chowk, Memnagar Ahmedabad 380052 Contact Mr. Sourabh Agarwal Landline +91-79-40055790 Mobile +91-9662124866 Email [email_address] Ahmedabad Tagore Apartment Tagore Road Rajkot Contact Mr. Tushar Vadodaria Landline Mobile +91-98987 06178 Email [email_address] Rajkot Associated Companies Wise Financial Solution Pvt. Ltd., Hyderabad Varishta Consultants Pvt. Ltd., Hyderabad Hyderabad Contact Mr. Raghuram AVG Landline +91-04-27627607 Mobile +91-9701010000 Email [email_address] Mr. Raghuram AVG 102 A, Sri Dattasai Commercial Complex, Opp. Saptagiri Theatre, RTC ‘X’ Roads, Hyd - 500020
- 7. Current Progress (Summary for SBC) - Physical Narmada Main Canal (Ch 263.20 Km) Dholi Dhaja Dam 1. MSBC(Ch 69.493 Km) Earth work 100% Structures 100% Lining 100% Service Rd 90% Distributaries 3. DSBC(Ch 88.870 Km) Earth work 50% Structures Lining Service Rd 0% Distributaries 0% 5. MoSBC(Ch 104.460 Km) Earth work Structures Lining Service Rd 0% Distributaries 0% 20% 0% 0% 0% 0% 0% Earth work 100% Structures 100% Lining 60% Service Rd 90% Distributaries 2. VSBC(Ch 70.680 Km) 20% Earth work 50% Structures Lining 0% Service Rd 0% Distributaries 4. LSBC(Ch 89.140 Km) 20% 0% Earth work 50% Structures Lining 0% Service Rd 0% Distributaries 6. BSBC(Ch 104.460 Km) 20% 0% www.5econsulting.in
- 8. Current system of Monitoring www.5econsulting.in
- 10. Our Approach Day 1-5 Day 6-28 Day 28-30 Monthly Cycle We would start by base lining the entire project with quantity wise execution schedule. This, one time revision work, is required as tracking against historic schedule would not help in efficient tracking. At every report cycle, based on the previous week’s progress the plan would be re-base lined to measure the actual deviation. In addition, newly allotted work packages would be included in the master schedule Once we will complete the initial scheduling and subsequent base lining on an ongoing basis , we would start tracking the project upto nth details. We start be deploying quick and easy field formats that would capture an upto date progress in terms of time/cost/quality along with pictorial documentation. We will also schedule the tracking requirement in such a way that an optimal utilization of field visits are done with respect to physical progress. Along with this we will be closely monitoring the progress and dependencies of no field based tasks. 1 2 3 Since this will be a system base monitoring process, the progress details will be available at your finger tips on basis of the information keyed in. But to make the reports more meaningful and deliver results we would interpret the reports and present them in much more informative and interactive way that would enable the leadership team to effectively review the progress and take required executive decision. System www.5econsulting.in
- 11. Approach Details A. Scheduling 1. Finalize Work break down structure 2. Linking dependencies 3. Input Planned dates as per tender 4. Revise planned dates as per new targets 5. Input Contract rates, quantities, cost, etc. 6. Input Earned Value Parameters 7. Input Bill payment parameters 8. Input provision for qualitative parameters 9. Input provision for Quality Mgmt. B. Tracking 1. Finalize field recording formats 2. Finalize field team structure 3. Finalize reporting cycle & schedule 4. Capture Qty wise Item wise progress 5. Capture Financial progress wrt RA Bills 6. Capture Issues for delays 7. Gather notes related to expected issues 8. Photographic documentations 9. Gather outcome of quality tests 10. Enter field reports on the system C. Reporting 1. Executive Dashboards 2. Package wise progress Repts (Cost, time, quality) 3. Activity wise progress reports 4. Earned Value Reports 5. Financial reports 6. Photographs and Visual reports 7. Issues & scope management reports 8. Escalations 9. Quality reports www.5econsulting.in
- 12. QUALITY REPORTS COST ANALYSIS DPRs MS PROJECT INPUTS SITE REGISTERS INPUTS FROM TEAM LEADER INPUTS FROM EXPERTS FINDINGS INPUTS FROM FIELD STAFF PHOTOGRAP. SUPPORT + MONTHLY REPORTS PROGRESS ANALYSIS COST, QUALITY ANALYSIS ISSUEs MANAGEMENT RISK MANAGEMENT MIS AND REPORTING SYSTEM www.5econsulting.in CENTRAL DATABASE
- 13. MS PROJECT WBS PLANNED R0 ELEMENTS S CURVE ANALYSIS ACTUAL R1 ELEMENTS REVISED R2 ELEMENTS TRAFFIC SIGNAL REPORTING PIVOT TABLES SPREAD SHEETS GRADING SYSTEM LINKAGES X X PHOTOGRAPHS REVIEWS ANALYSIS EXPERTS = PROJECT ON COST PROJECT ON TIME PROJECT ON QUALITY TOOLS AND TECHNIQUES www.5econsulting.in
- 15. A.1 – Finalize Work Break Down Structure Saurashtra Branch Canal MSBC VSBC DSBC LSBC MoSBC BSBC + + + + + - Ch 0-16 Ch 16-32 Ch 33-48 Ch 49-64 Ch 65-80 Ch x-y + + + + + - L1 L2 Sub Branch Canal Structures Distributaries S1 S2 S3 Sx + + + - Execution Pre Tendering Survey & Invest. Alignment Approval Land Acquisition & Clearances Detailed Design & Engineering Tender Process Award of Contract Mobilization Earth Work/Excavation RCC/Concreting Lining/Structure WBM Service road Completion L3 L4 D1 D2 D3 Dx + + + - Task Module – to be repeated for each of the end levels Ch 1-50 - Ch 50-100 + Ch x-y + L5 - - - L6 Distributary M1 M2 M3 Mx - - + + + www.5econsulting.in
- 16. Data Structure Planned Duration Planned Start Date Planned End Date Planned Quantity Planned Cost Actual Duration Actual Start Date Actual End Date Actual Quantity Actual Cost % Work Complete % Financials Complete Delay Cost Variance Etc. Contractor Package SBC Chainage etc General Attributes Planning Attributes BCWS BCWP ACWP SV CV Earned Value Attributes EAC VAC BAC CPI Total qty Achieved Qty Qty – Bill Submitted Qty – Bill Cleared Qty - Rejected Billing Details Qty - Balance Qty – Bill withheld RA Date RA Cleared Monthly Quarterly Yearly Launch Flag Risks Issues Next Steps Resolution Qualitative Parameters Material Workmanship Total tests Passed Sigma Level Quality Management www.5econsulting.in
- 17. A.2 Linking out dependencies Once the Work break down structure is finalized, activities of individual modules (work package) would cross linked with respect to dependencies on the predecessor tasks. Here care shall be taken to map out the parallel tasks in order to save time. Mapped WBS on Master project schedule Putting dependencies clearly help in understanding the reasons for possible delays in execution. It also helps in strongly cross linking and synchronizing office and field related works. This also allows us to report upcoming talks in the current month based on the actual completion till date. www.5econsulting.in
- 18. A.3&4 Planned Dates as per tender/Revised Dates After linking out the dependency we would key in the scheduled start and finish dates as per the tender, we will also keep provision to record the quantity wise progress w.r.t to phase wise completion. There will also be a provision for recording multiple base line so as to be in a position wherein we can not only compare the progress with the initial baseline but also with baseline as of last month, last quarter, etc. Mapped WBS on Master project schedule www.5econsulting.in
- 19. A.5 Contract Rates, quantities, cost, etc. As part of the fifth step, all the quantitative parameters would be entered along with their unit, unit rate, fixed cost, fixed cost accrual, etc. along with the name of agency, responsibilities, and other details so as to be able to churn out reports with any of the associated tags Mapped WBS on Master project schedule www.5econsulting.in
- 20. A.6 Earned Value Tags Earned Value management is one of the best ways of tracking a project. In this system the progress of the project is measured not only wrt time but also with respect to cost. There are three major parmeter which helps in deriving the progress indicators of the project. BCWS – Budgeted cost of work scheduled- this helps in understanding the amount to be spent as per the progress schedule, BCWP – Budgeted cost of work performed- this provides information on amount that should have been spent as per the base price, and ACWP – Actual cost of the work performed – This provide info on actual amount spent for the quantities executed. Now, using these three variables, we could find the Schedule variance that shows the deviation of the time, and we could also find CV – cost variance – that shows deviation in cost for executing the said quantities. These parameters are subsequently used to forcast parameters like EAC – Estimate at completion, CPI – Cost performance Index, etc. Mapped WBS on Master project schedule www.5econsulting.in
- 21. A.7 Bill payment parameters Bill tracking is one of the most important task in any of the civil projects, we intend to put the right tracking mechanism in place so as to be able to track bill by bill progress of the project at any level. We will develop this module further when we get the know the exact billing procedure followed at SSNL. Mapped WBS on Master project schedule www.5econsulting.in
- 22. A.8 Qualitative Parameters Each activity – at a rolled up level as well as at a task level would be assessed on qualitative parameters – flag (RAG Status), Issues, potential risks, dependencies, next steps, etc. The capturing of qualitative issues will help in understanding the reasons lying below the quantitative assessment of the progress. Mapped WBS on Master project schedule www.5econsulting.in
- 23. A.9 Quality Management Quality Assurance would be monitored at all execution levels. Parameters like quality flag for materials, workmanship, etc would be assessed and would along with analysis on number of tests conducted, no of tests passed and the present sigma level as per the quality deviation standards. Mapped WBS on Master project schedule www.5econsulting.in
- 26. B2. Team Structure Narmada Main Canal (Ch 263.20 Km) Dholi Dhaja Dam 1. MSBC(Ch 69.493 Km) Earth work Structures Lining Service Rd Distributaries 3. DSBC(Ch 88.870 Km) Earth work Structures Lining Service Rd Distributaries 5. MoSBC(Ch 104.460 Km) Earth work Structures Lining Service Rd Distributaries Earth work Structures Lining Service Rd Distributaries 2. VSBC(Ch 70.680 Km) Earth work Structures Lining Service Rd Distributaries 4. LSBC(Ch 89.140 Km) Earth work Structures Lining Service Rd Distributaries 6. BSBC(Ch 104.460 Km) PM 1 PM 2 PM 3 www.5econsulting.in
- 27. B4. Photographic Documentation Date Package WBS Code We would be engaging in comprehensive photographic documentation of the entire work scope with separate tags on the capture date, package, wbs code, stage, etc. The entire archive would available on our system linked to the specific task level for any subsequent reporting requirement Stage www.5econsulting.in
- 28. B5. Outcome of Quality Tests We shall be (on clients instructions)engaging ourselves into collection of all quality and conformance tests for statistical analysis. Basis our analysis we would be highlighting the conformance of the overall quality assurance program for the SBC project. www.5econsulting.in
- 29. B6. Entering Field Results on System Between 28 th and 30 th of every month a consolidate field reports would be entered on the system with supporting like field quality reports, photographs, etc. We would continue to feed the reports on system on a weekly basis, however this monthly consolidation will be required for preparation of month end report along with saving new baselines www.5econsulting.in
- 31. C1. Overall Summary Main SBCs Progress Canal Structures Distributaries Minors www.5econsulting.in
- 32. C2. Target versus Achievement (Sample Model) For Q1 For the Year Financial in Rs. Lakhs www.5econsulting.in
- 33. C3. Executive Dash Board (Sample Model) These dashboards and the rating algorithm would be designed after consultation with the client. www.5econsulting.in
- 34. C4. Bar Chart (Sample Model) Open MS Project File www.5econsulting.in
- 35. C5. Earned Value Charts (Sample Model) Earned Value Help www.5econsulting.in
- 36. Earned Value (EV). The earned value is calculated by adding up the budgeted cost of every activity that has been completed. If an activity is in progress, you can give it zero value until it is completed, 50%, or the full amount. Just be sure you are consistent with whatever rule you choose for in-progress work. EV is the basic measure of how much value the project has achieved so far. By itself, it does not tell you too much. So, you use it in combination with other calculations to determine your budget status. Actual Cost (AC) . To calculate this number, add up the actual cost for all the work that has been completed so far on the project (or for any specific date or in any given time period). Planned Value (PV). This is the sum of all the budgeted estimates for all the work that was scheduled to be completed by today (or by any specific date or in any given time period). Schedule Variance (SV). This is calculated as EV - PV. It tells you whether you are ahead of schedule or behind schedule. If the result is positive, it means that you have performed more work than what was initially scheduled at this point. In other words, the earned value (EV) of the work actually completed is greater than the planned value (PV) of the work that was scheduled to be completed. Likewise, if the SV is negative, the project is probably behind schedule. Cost Variance (CV). This is calculated as EV - AC. This gives you a sense for how you are doing against the budget. If this CV is positive, it means that the budgeted cost to perform the work (EV) was more than what was actually spent for the same amount of work (AC). This means that you are fine from a budget perspective. If the CV is negative, you may be overbudget at this point. Schedule Performance Index (SPI ). This is a ratio calculated by taking the EV / PV. This shows the relationship between the budgeted cost of the work that was actually performed and the cost of the work that was scheduled to be completed at this same time. It gives the run rate for the project. If the calculation is greater that 1.0, the project is ahead of schedule. For instance, if the SPI is 1.1, it means that your project has completed approximately 10% more work (EV) than what was scheduled (PV) at this same point in time. If that trend continues, you will end up taking 10% less time to complete the project than what was scheduled. Cost Performance Index (CPI). This is the ratio of taking the EV / AC. This shows the relationship between the budgeted cost of work performed and the actual cost of the work performed. It gives the burn rate for the project. If the calculation is less than 1.0, the project is over budget. For instance, a CPI of .90 means that for every 90.00 of budgeted expenses (EV), your project is spending 100.00 (AC) to get the same work done. If that trend continues, you will end up 10% over budget when the project is completed. Budget at Completion (BAC ). This calculation can be in terms of money or hours. It is the AC, added to the budgeted cost of the remaining work. If the CPI is not close to 1.0, the budgeted cost of the remaining work must be factored to take into account the historical burn rate. So, if the CPI is not 1.0, the BAC is the AC + (Budgeted Cost of Work Remaining / CPI). Estimate at Completion (EAC). This represents your current best guess as to what the total cost (or hours) of the project will be at completion. You can derive this from the formula of EAC = BAC / CPI. The formula shows what your new costs would be if you continue spending money (or hours) at your current burn rate. If your CPI is 1.0, it means you are on target, so your estimate at completion would be your current budget. If you were running behind (CPI < 1.0) the EAC will be higher then your budget. If you are running ahead (CPI > 1.0), your EAC will be less than your current budget. For instance, if your budget is 10,000, and you are running behind, with a CPI of .90, then your estimate at completion (EAC) would be 10,000 / .90, or 11,111. Estimate to Complete (ETC). This is calculated by looking at the estimate at completion (EAC), and subtracting the money (or hours) you have spent so far (AC).
- 37. C6. Photographs (Sample Model) www.5econsulting.in
- 38. C7. Qualitative Parameters www.5econsulting.in
- 39. C8. Visual Representation www.5econsulting.in
- 40. C9. Quality Reports www.5econsulting.in