Major League Soccer 2015 Front Office Efficiency
•
1 gostou•14,718 visualizações

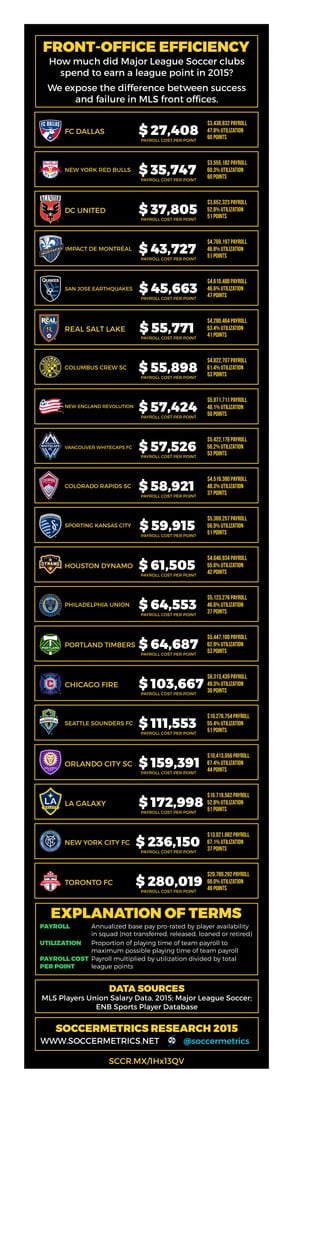
How much did Major League Soccer teams spend to earn a league point in 2015? How much of their payroll actually saw time on the pitch instead of languishing on the bench or the rehab table? We consider publicly available data such as salaries, in-season arrivals and departures, minutes played by every player, and total points won to find out how successful MLS clubs were with plenty or with very little.
Recomendados

Recomendados
Mais conteúdo relacionado
Destaque
Destaque (18)
Semelhante a Major League Soccer 2015 Front Office Efficiency
Semelhante a Major League Soccer 2015 Front Office Efficiency (20)
Último
Último (20)
Major League Soccer 2015 Front Office Efficiency
- 1. FRONT-OFFICE EFFICIENCY How much did Major League Soccer clubs spend to earn a league point in 2015? We expose the difference between success and failure in MLS front offices. EXPLANATION OF TERMS PAYROLL UTILIZATION PAYROLL COST PER POINT Annualized base pay pro-rated by player availability in squad (not transferred, released, loaned or retired) Proportion of playing time of team payroll to maximum possible playing time of team payroll Payroll multiplied by utilization divided by total league points DATA SOURCES MLS Players Union Salary Data, 2015; Major League Soccer; ENB Sports Player Database SOCCERMETRICS RESEARCH 2015 WWW.SOCCERMETRICS.NET @soccermetrics LA GALAXY $ 172,998 $16.719,562 payroll 52.8% utilization 51 pointsPAYROLL COST PER POINT VANCOUVER WHITECAPS FC $ 57,526 $5,422,176 payroll 56.2% utilization 53 pointsPAYROLL COST PER POINT CHICAGO FIRE $ 103,667 $6,313,439 payroll 49.3% utilization 30 pointsPAYROLL COST PER POINT ORLANDO CITY SC $ 159,391 $10,413,056 payroll 67.4% utilization 44 pointsPAYROLL COST PER POINT COLORADO RAPIDS SC $ 58,921 $4,516,380 payroll 48.3% utilization 37 pointsPAYROLL COST PER POINT TORONTO FC $ 280,019 $20,789,292 payroll 66.0% utilization 49 pointsPAYROLL COST PER POINT COLUMBUS CREW SC $ 55,898 $4,822,707 payroll 61.4% utilization 53 pointsPAYROLL COST PER POINT SPORTING KANSAS CITY $ 59,915 $5,369,257 payroll 56.9% utilization 51 pointsPAYROLL COST PER POINT DC UNITED $ 37,805 $3,652,323 payroll 52.8% utilization 51 pointsPAYROLL COST PER POINT SAN JOSE EARTHQUAKES $ 45,663 $4,610,488 payroll 46.6% utilization 47 pointsPAYROLL COST PER POINT FC DALLAS $ 27,408 $3,438,832 payroll 47.8% utilization 60 pointsPAYROLL COST PER POINT NEW ENGLAND REVOLUTION $ 57,424 $5,971,711 payroll 48.1% utilization 50 pointsPAYROLL COST PER POINT NEW YORK RED BULLS $ 35,747 $3,555,182 payroll 60.3% utilization 60 pointsPAYROLL COST PER POINT SEATTLE SOUNDERS FC $ 111,553 $10,276,754 payroll 55.4% utilization 51 pointsPAYROLL COST PER POINT HOUSTON DYNAMO $ 61,505 $4,646,934 payroll 55.6% utilization 42 pointsPAYROLL COST PER POINT REAL SALT LAKE $ 55,771 $4,280,464 payroll 53.4% utilization 41 pointsPAYROLL COST PER POINT IMPACT DE MONTRÉAL $ 43,727 $4,769,197 payroll 46.8% utilization 51 pointsPAYROLL COST PER POINT PORTLAND TIMBERS $ 64,687 $5,447,100 payroll 62.9% utilization 53 pointsPAYROLL COST PER POINT PHILADELPHIA UNION $ 64,553 $5,123,276 payroll 46.6% utilization 37 pointsPAYROLL COST PER POINT SCCR.MX/1Hx13QV NEW YORK CITY FC $ 236,150 $13,021,682 payroll 67.1% utilization 37 pointsPAYROLL COST PER POINT