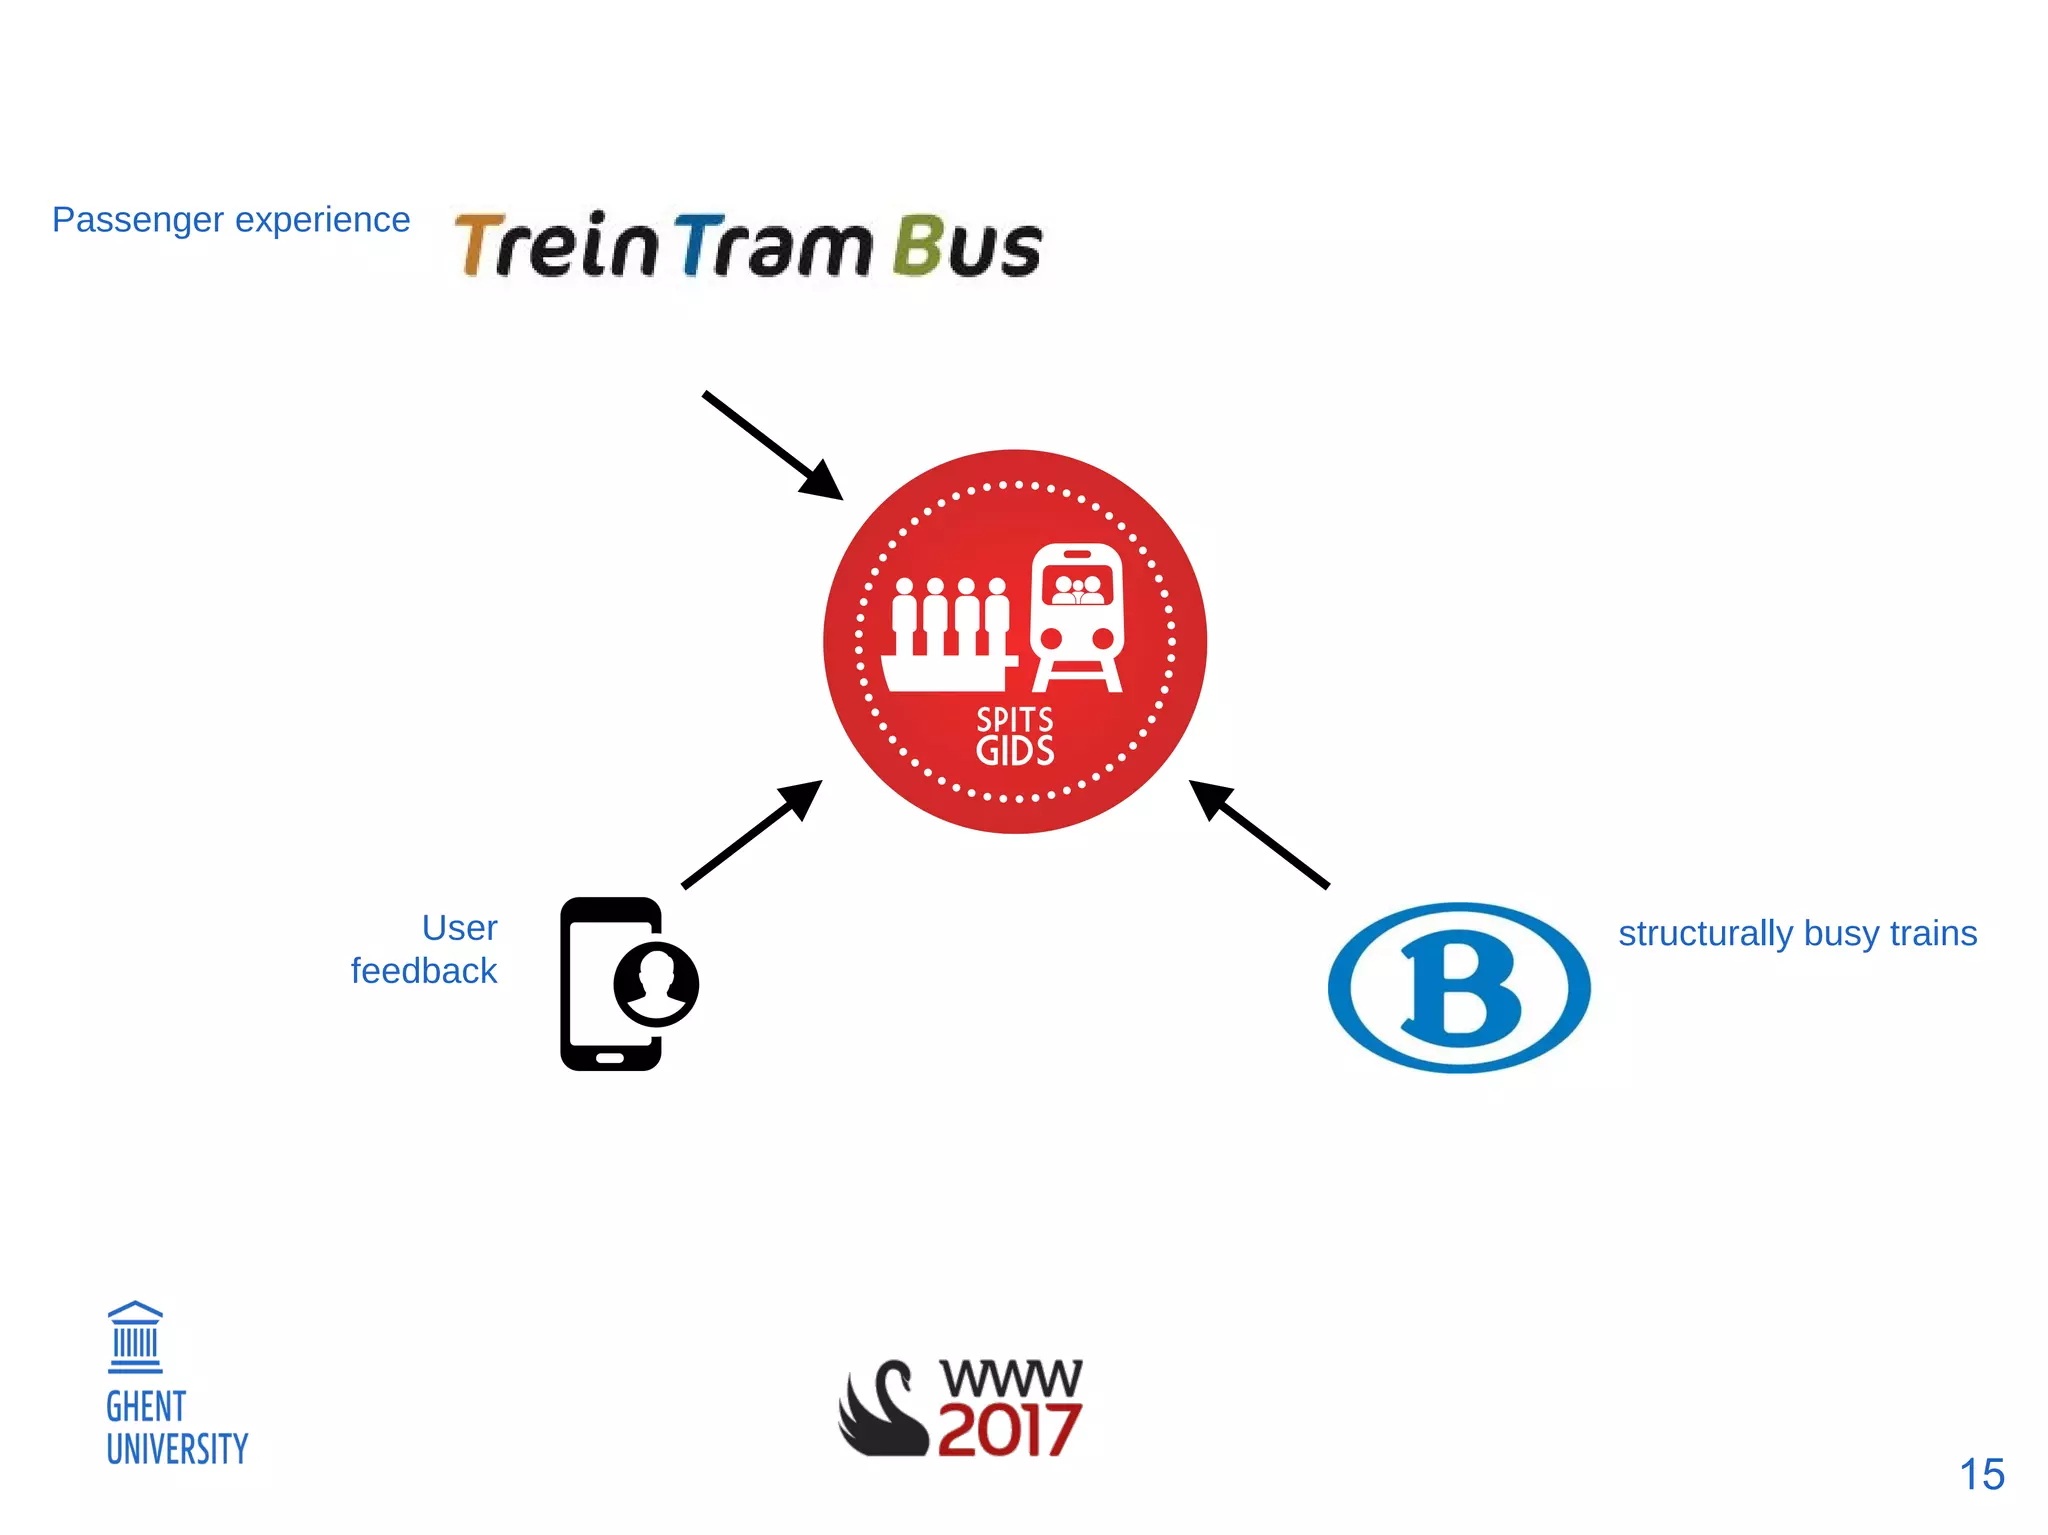
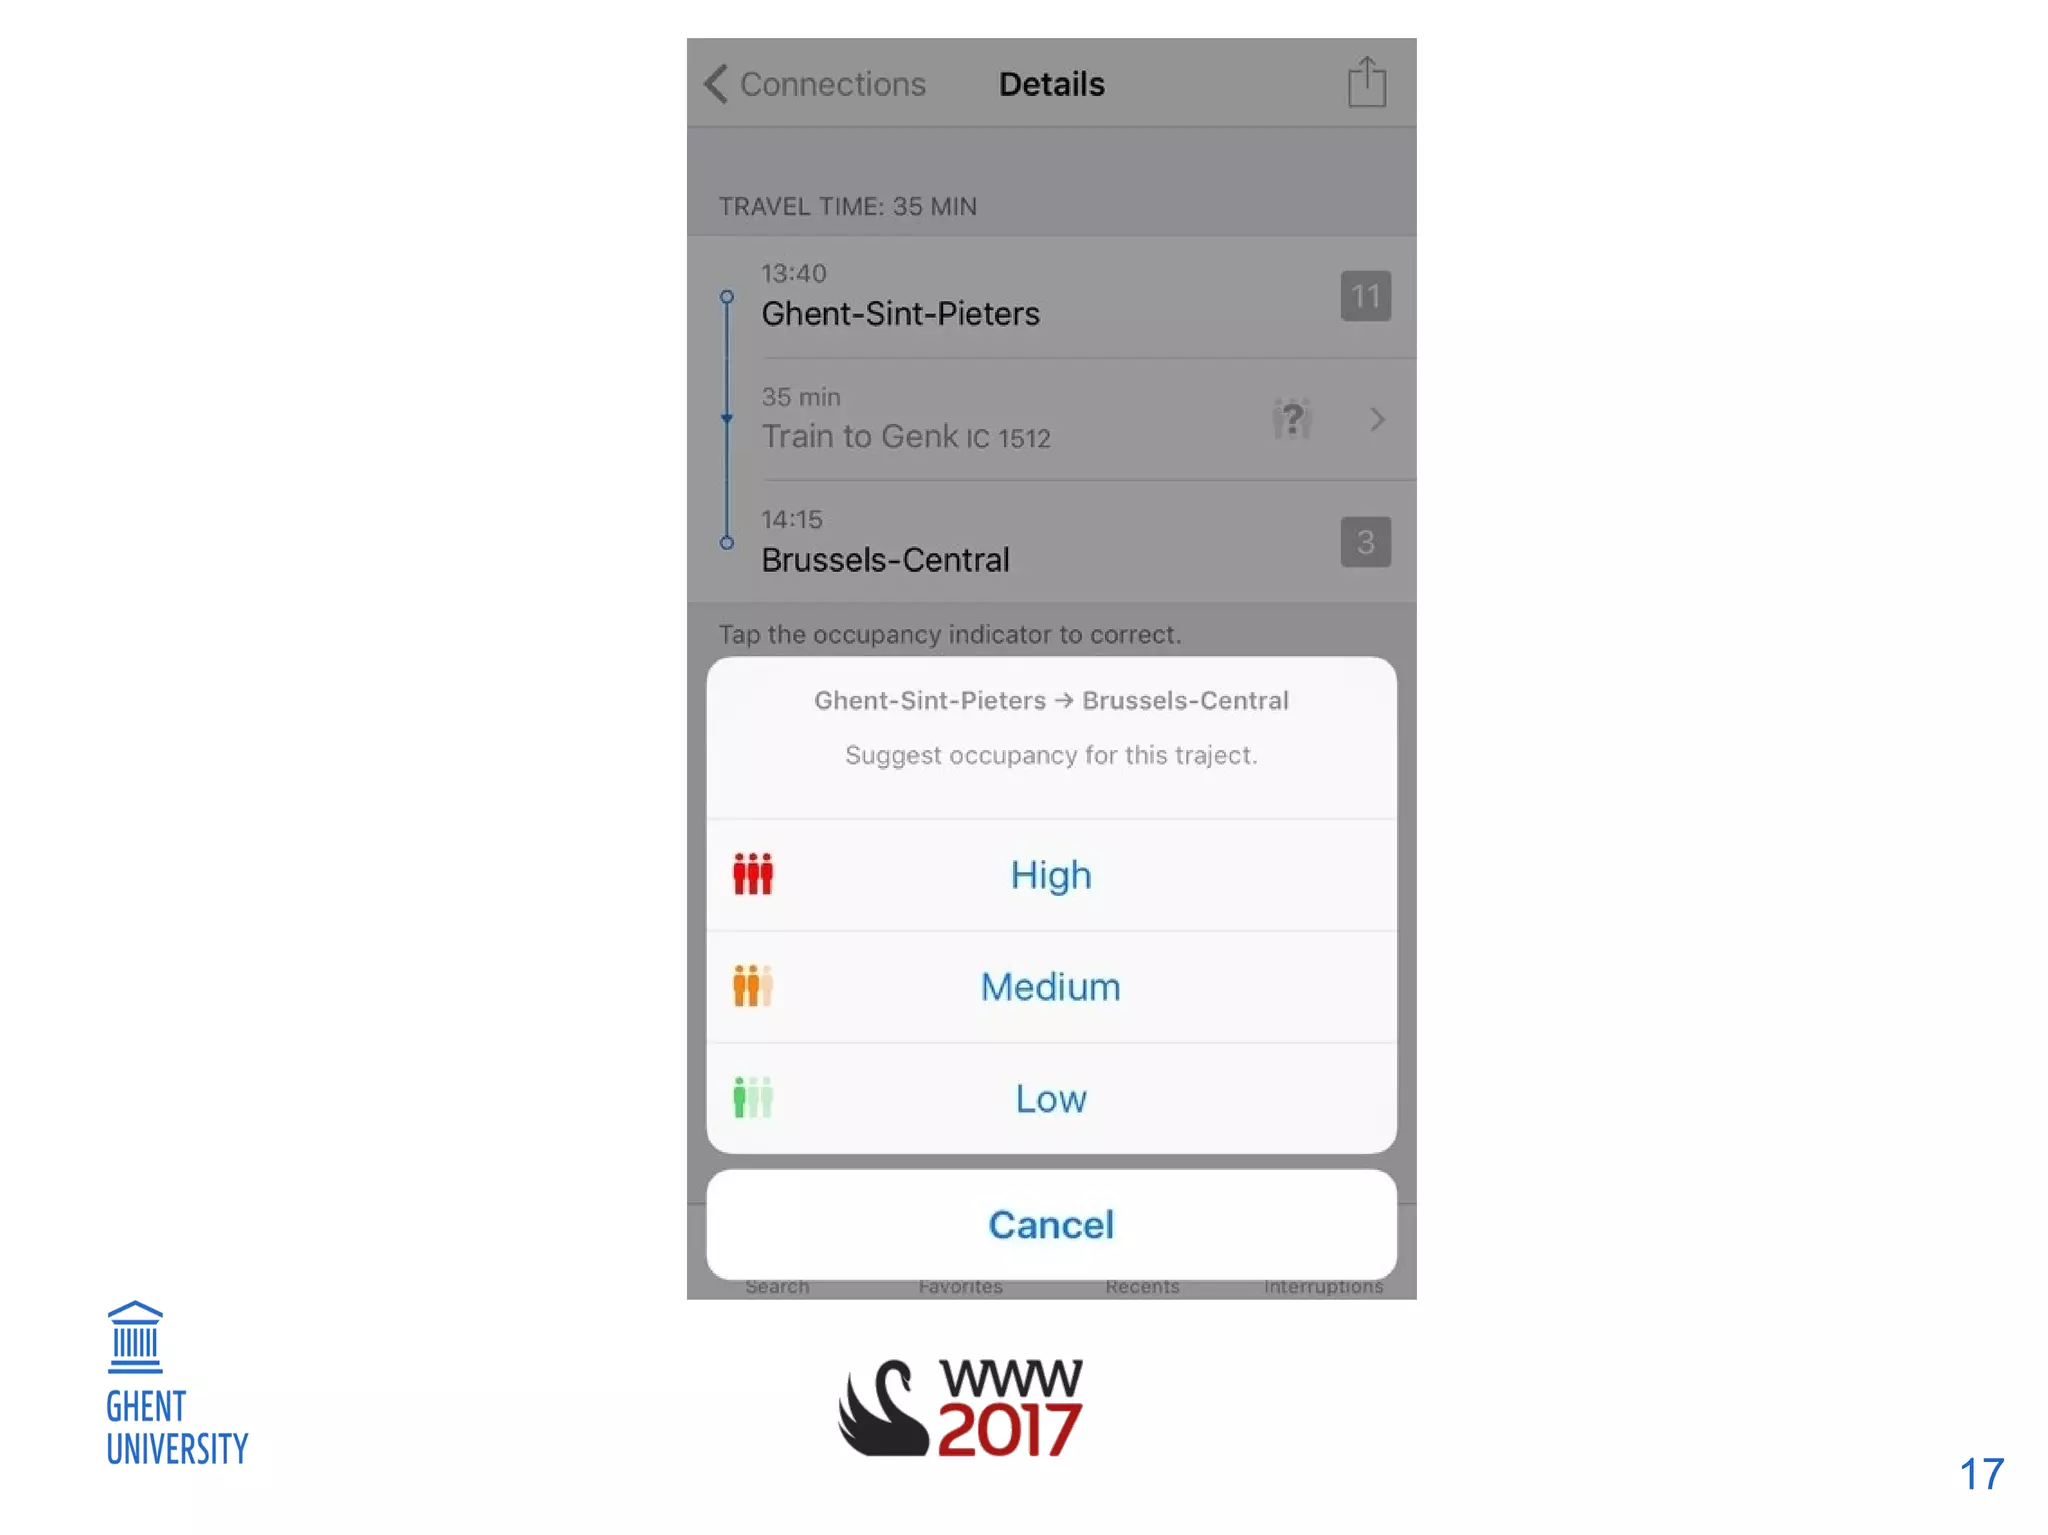
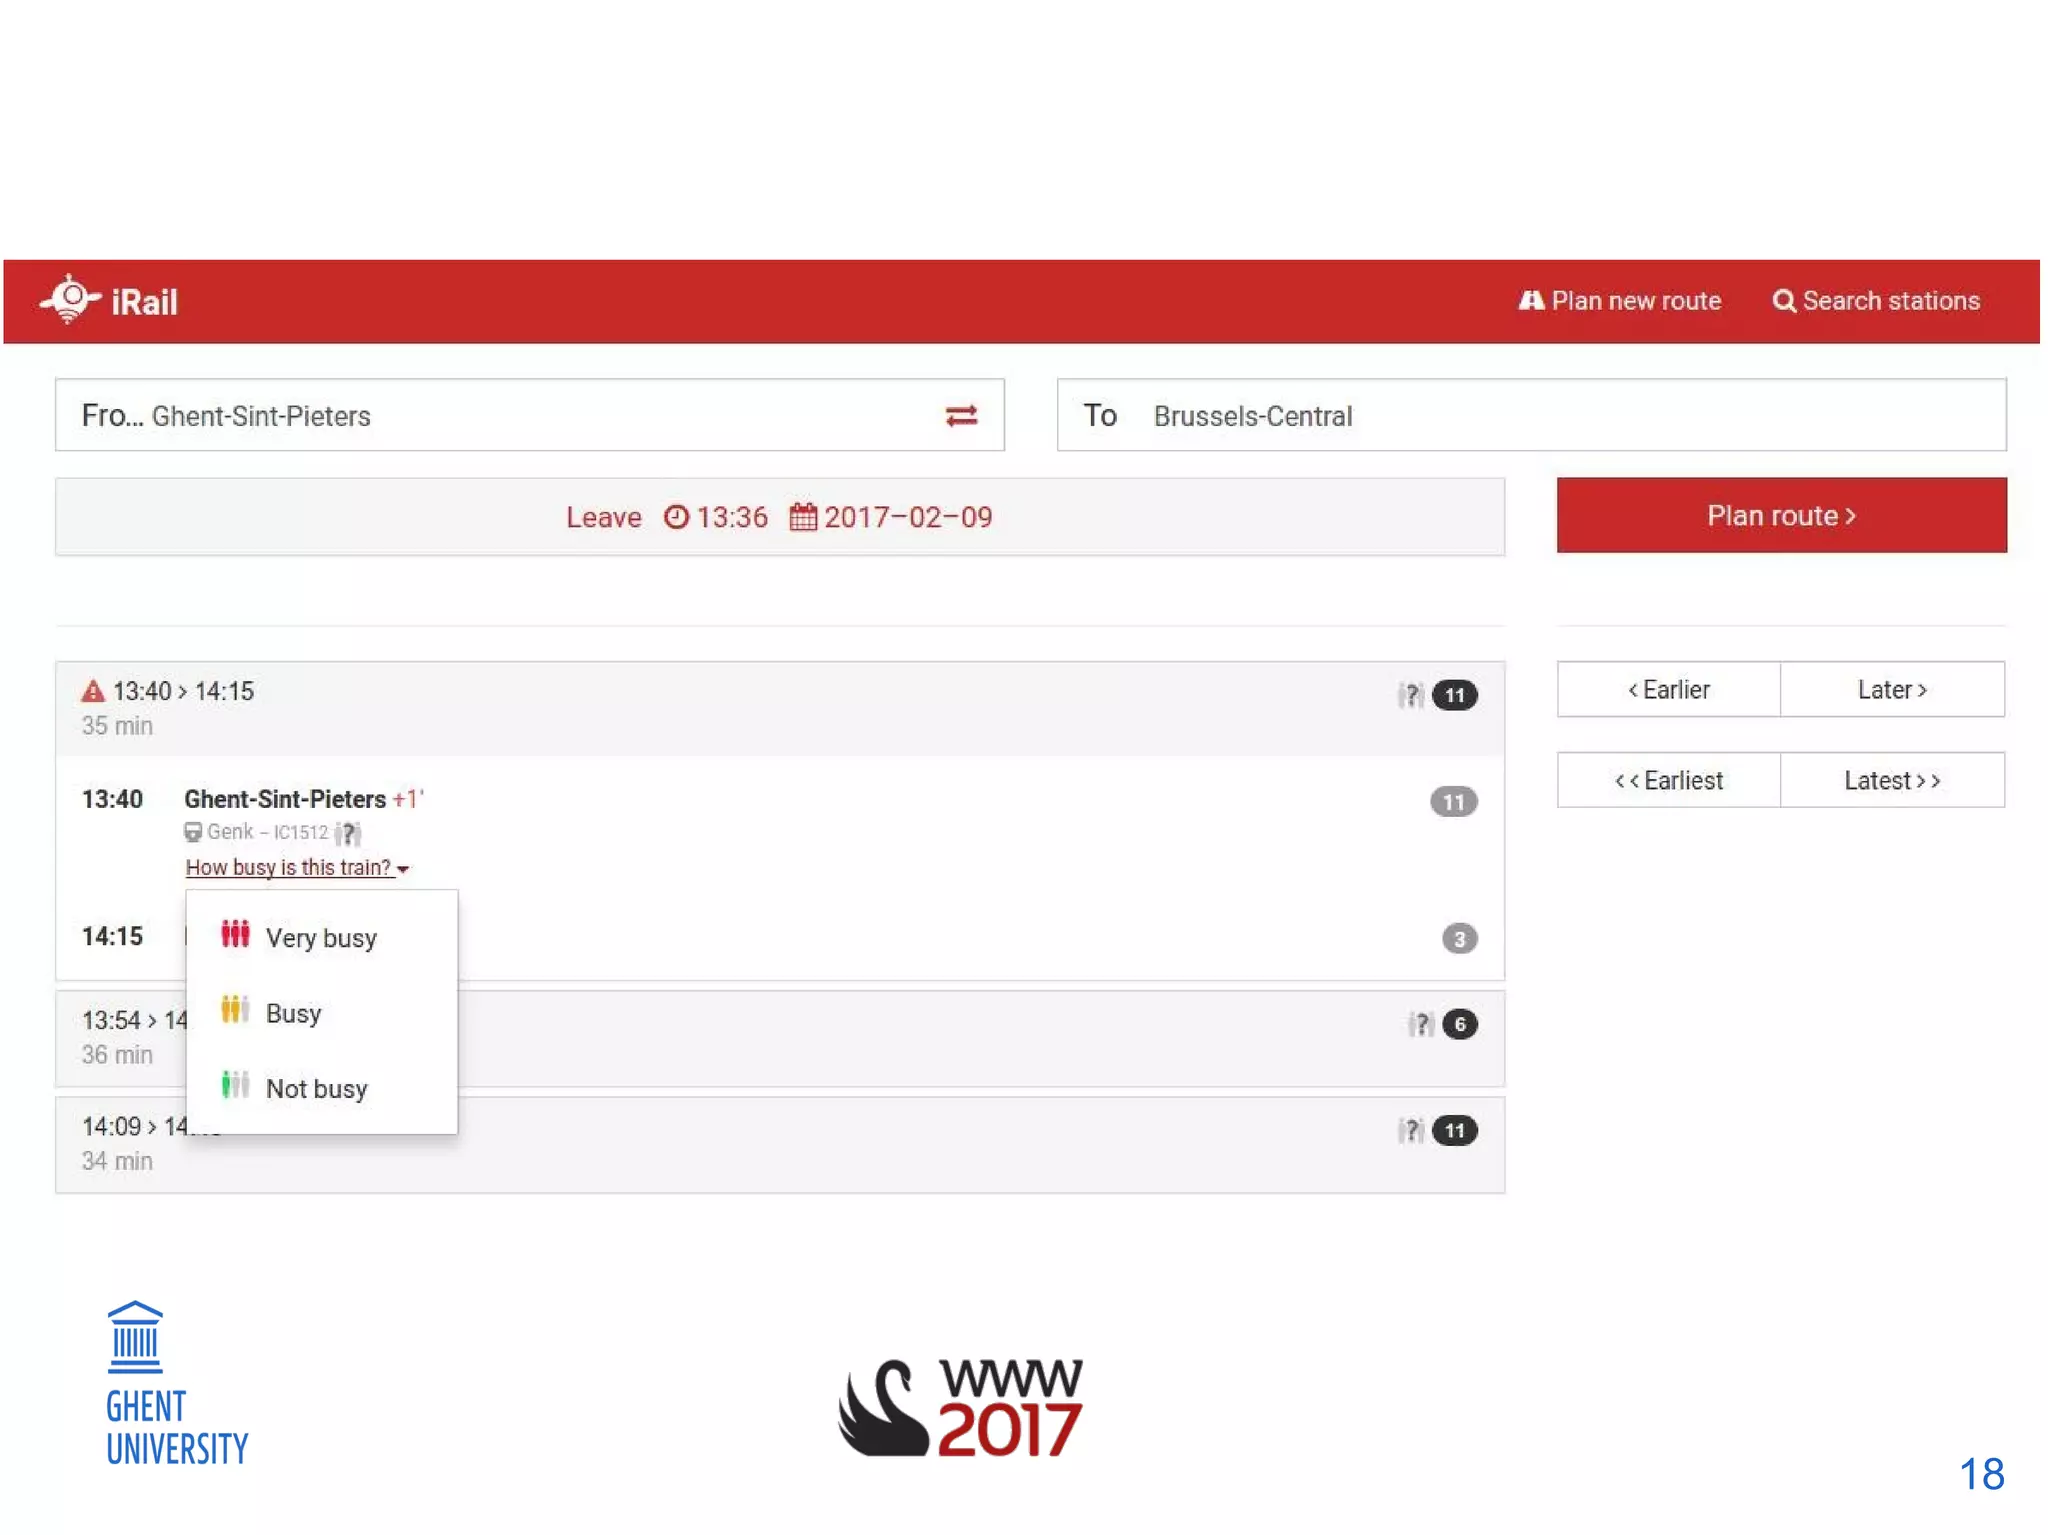
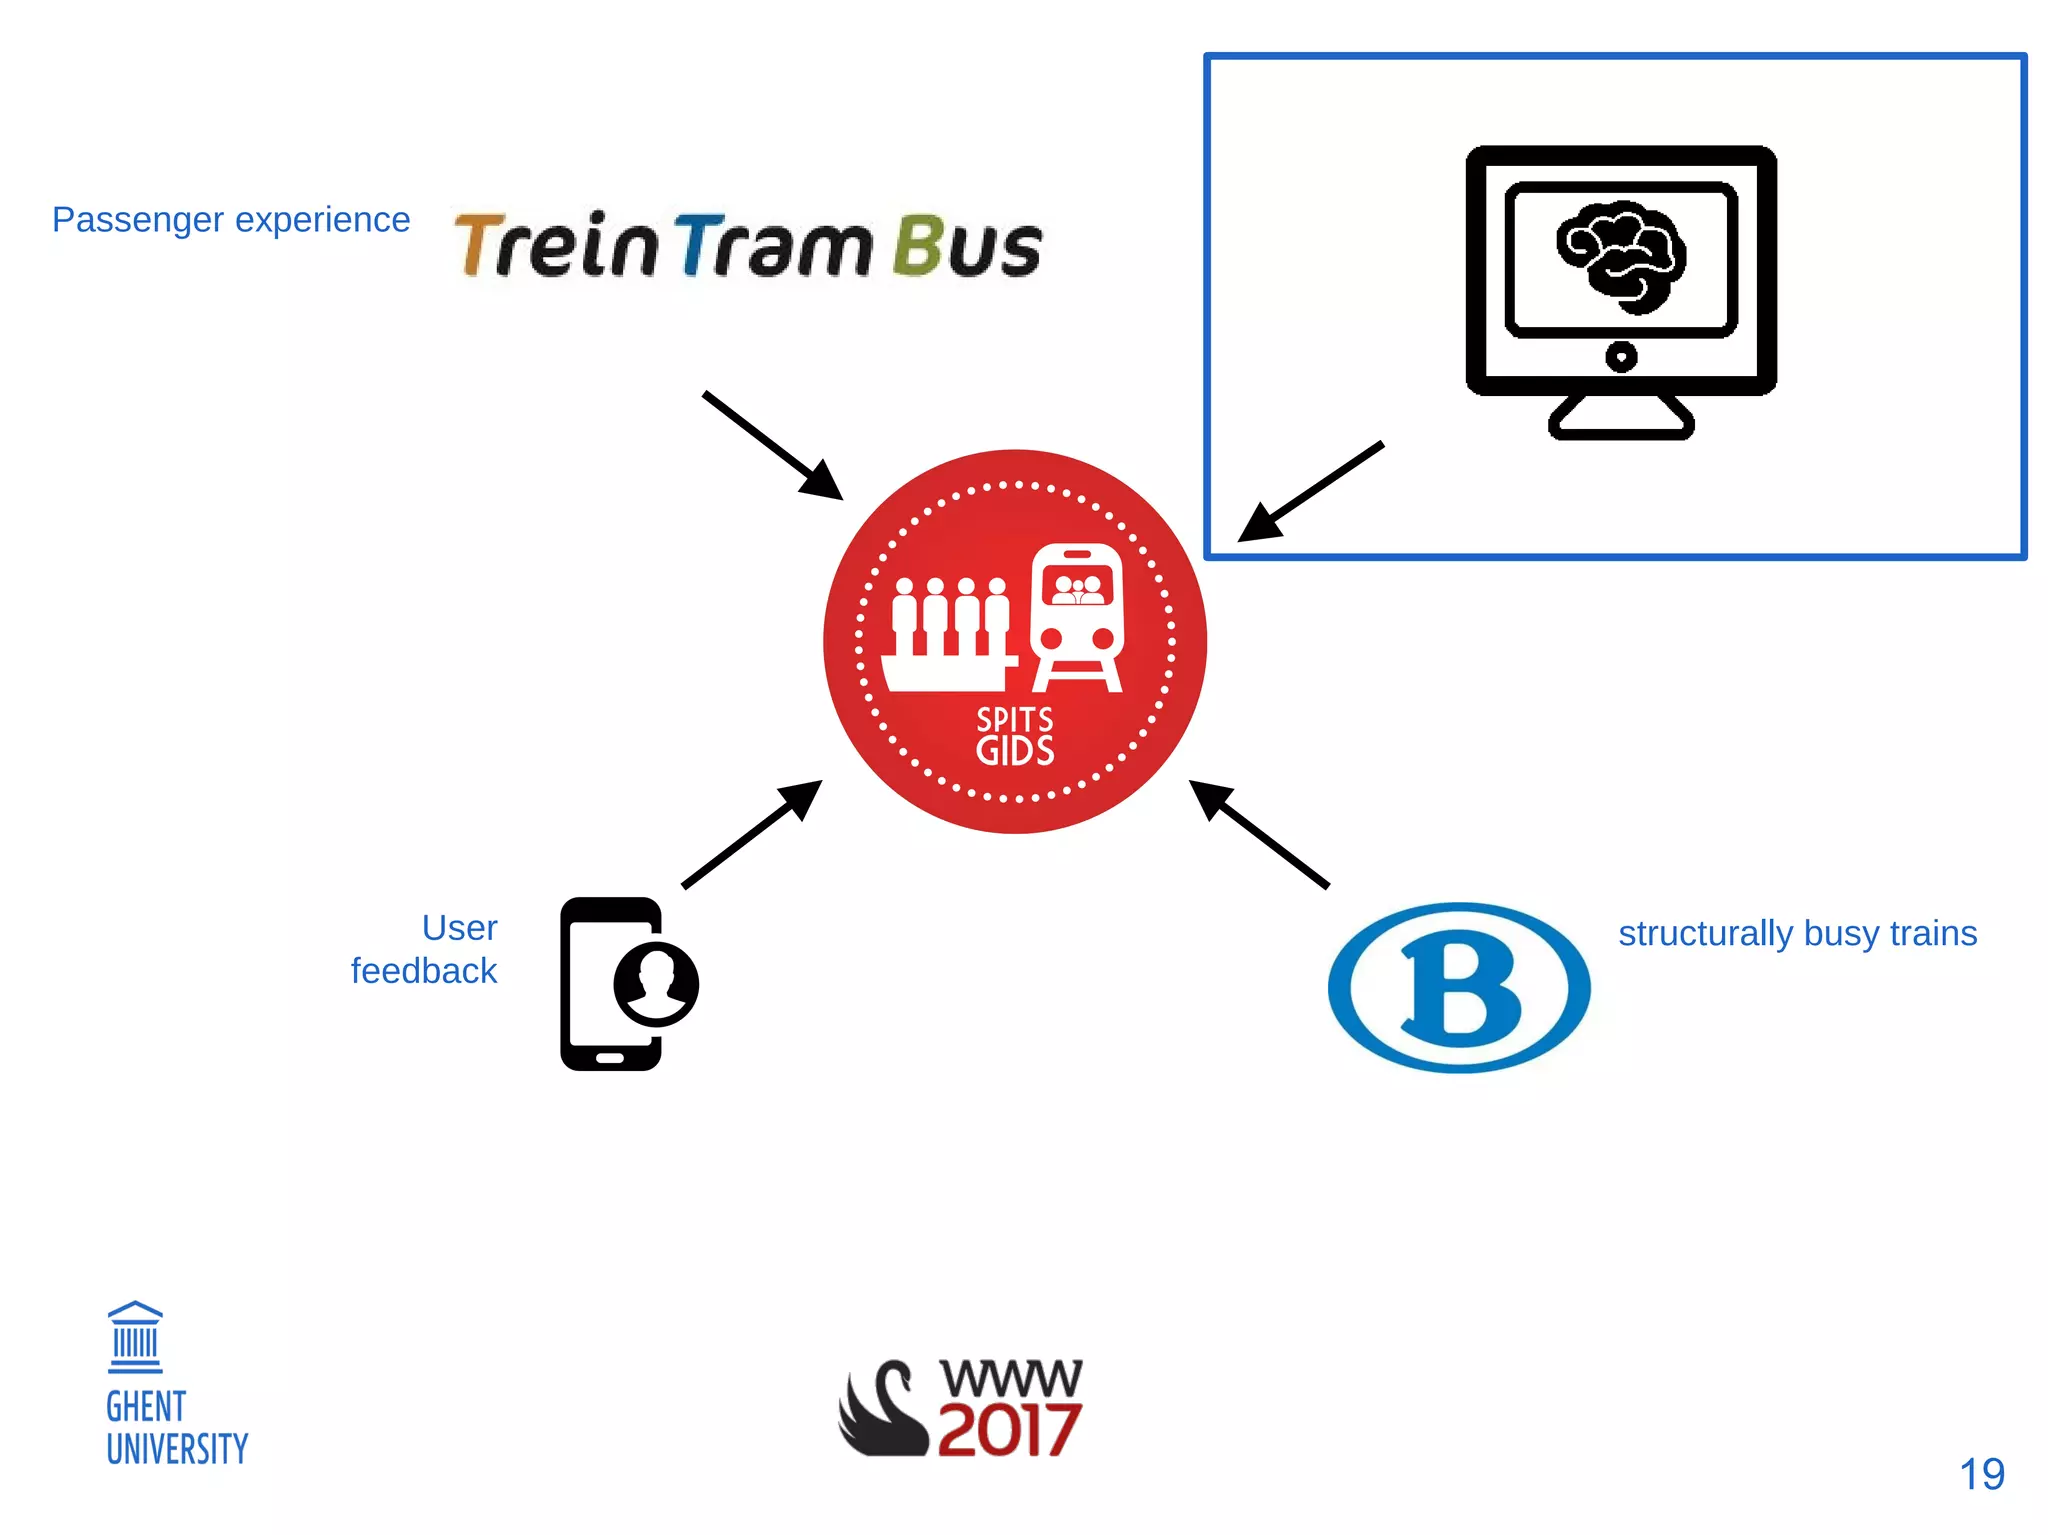
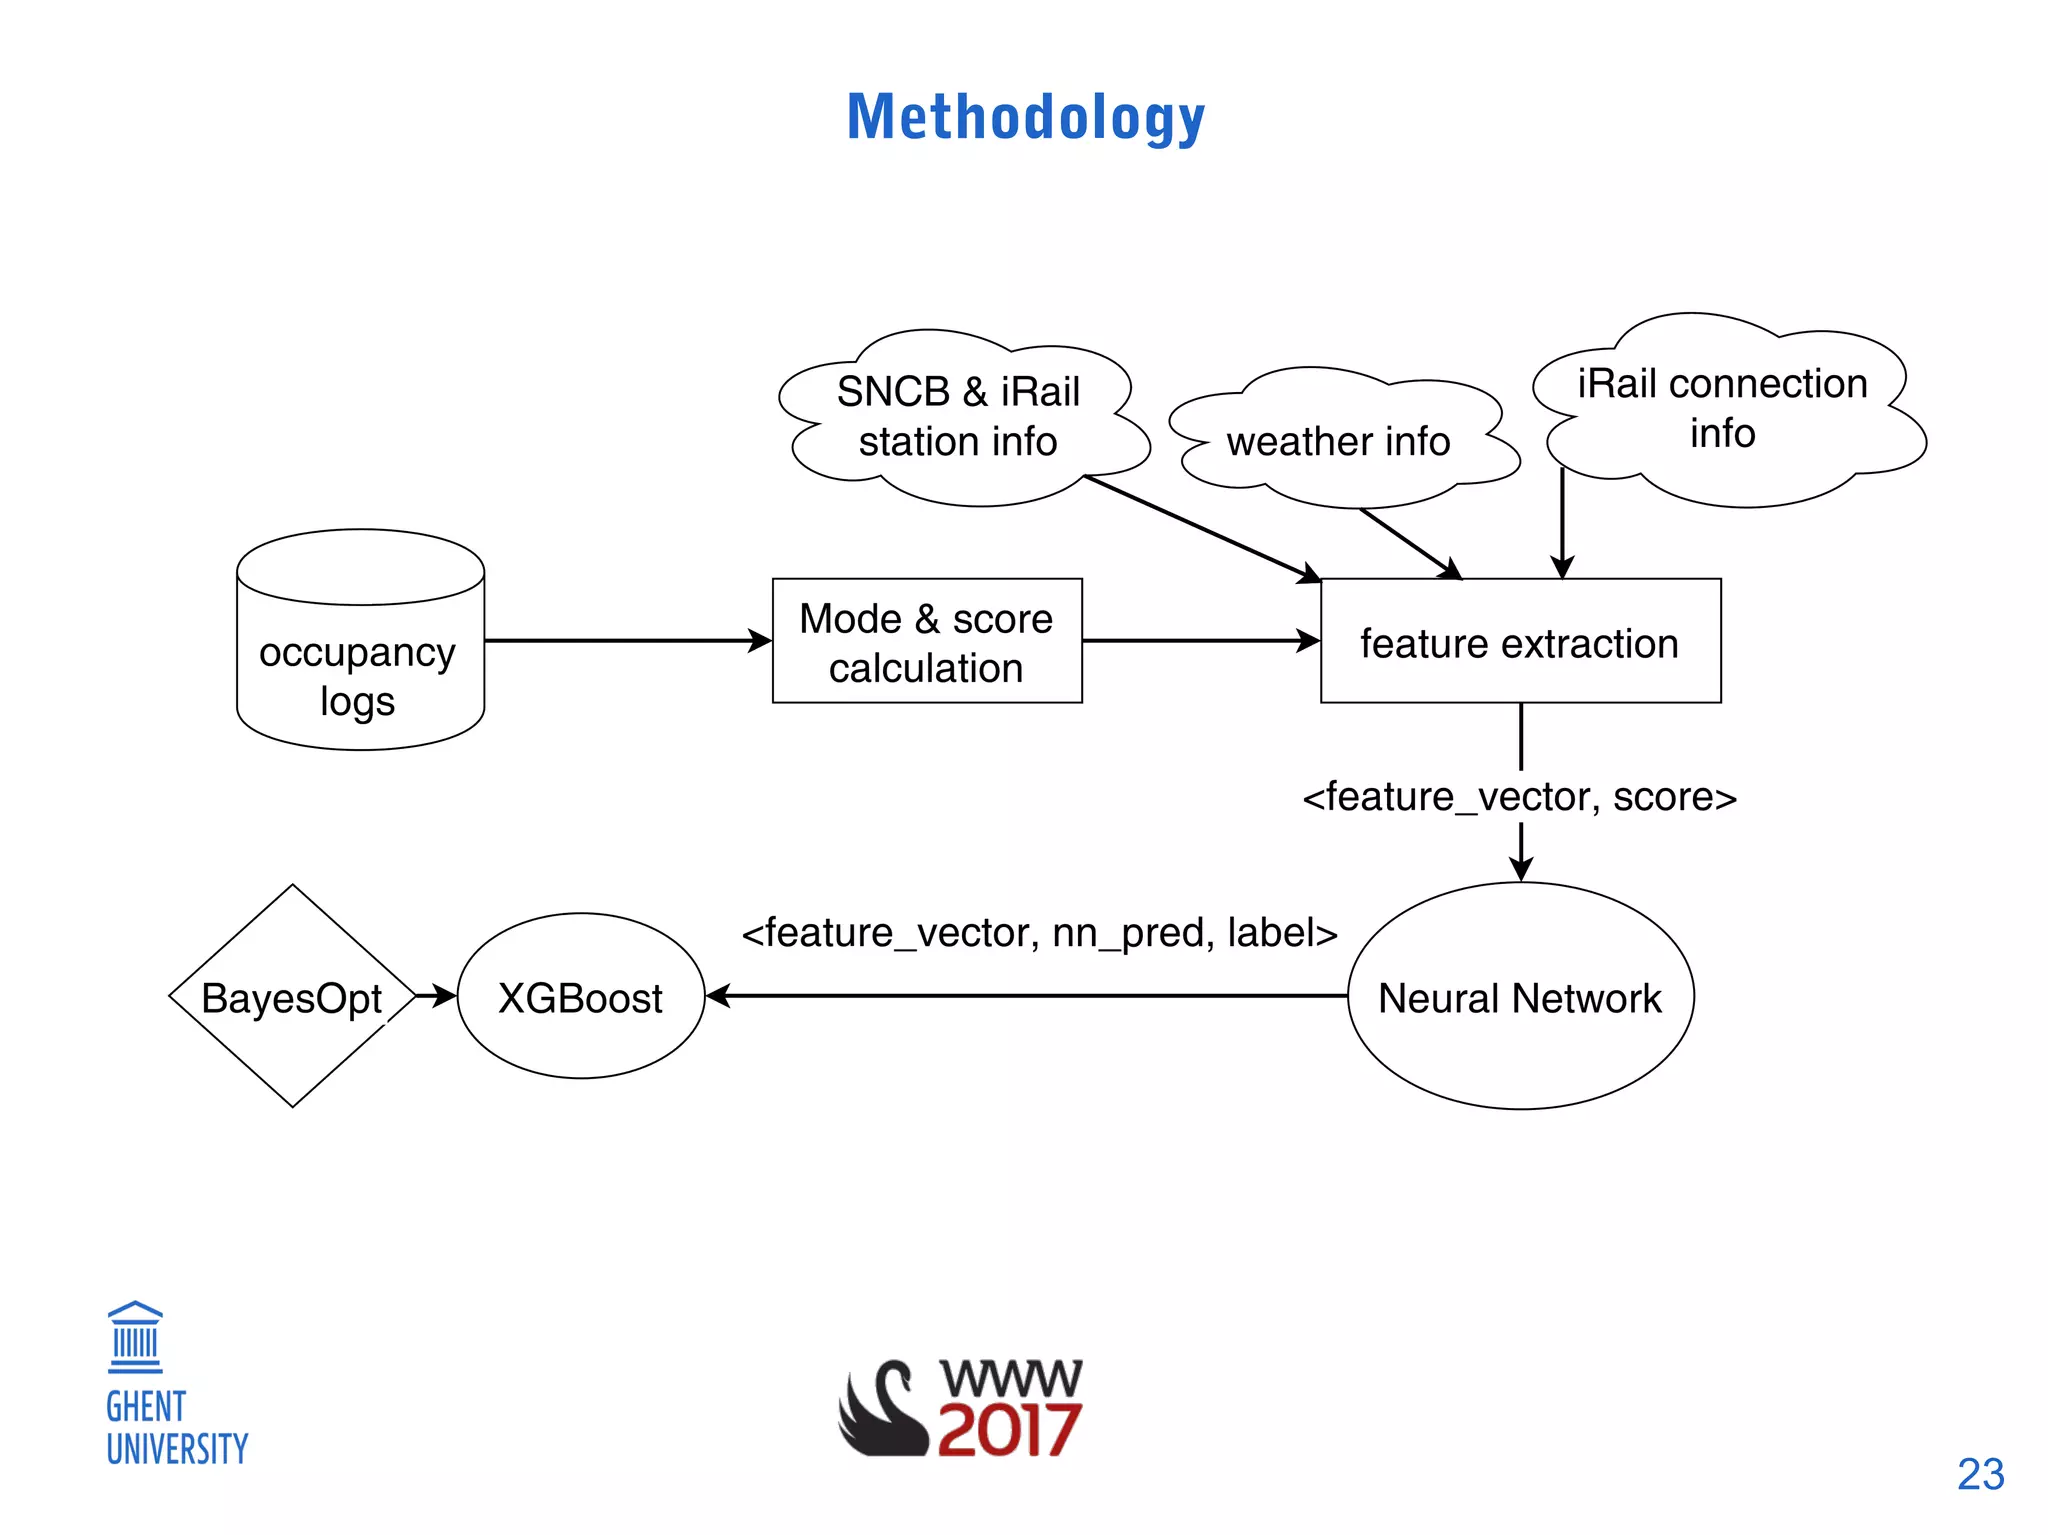
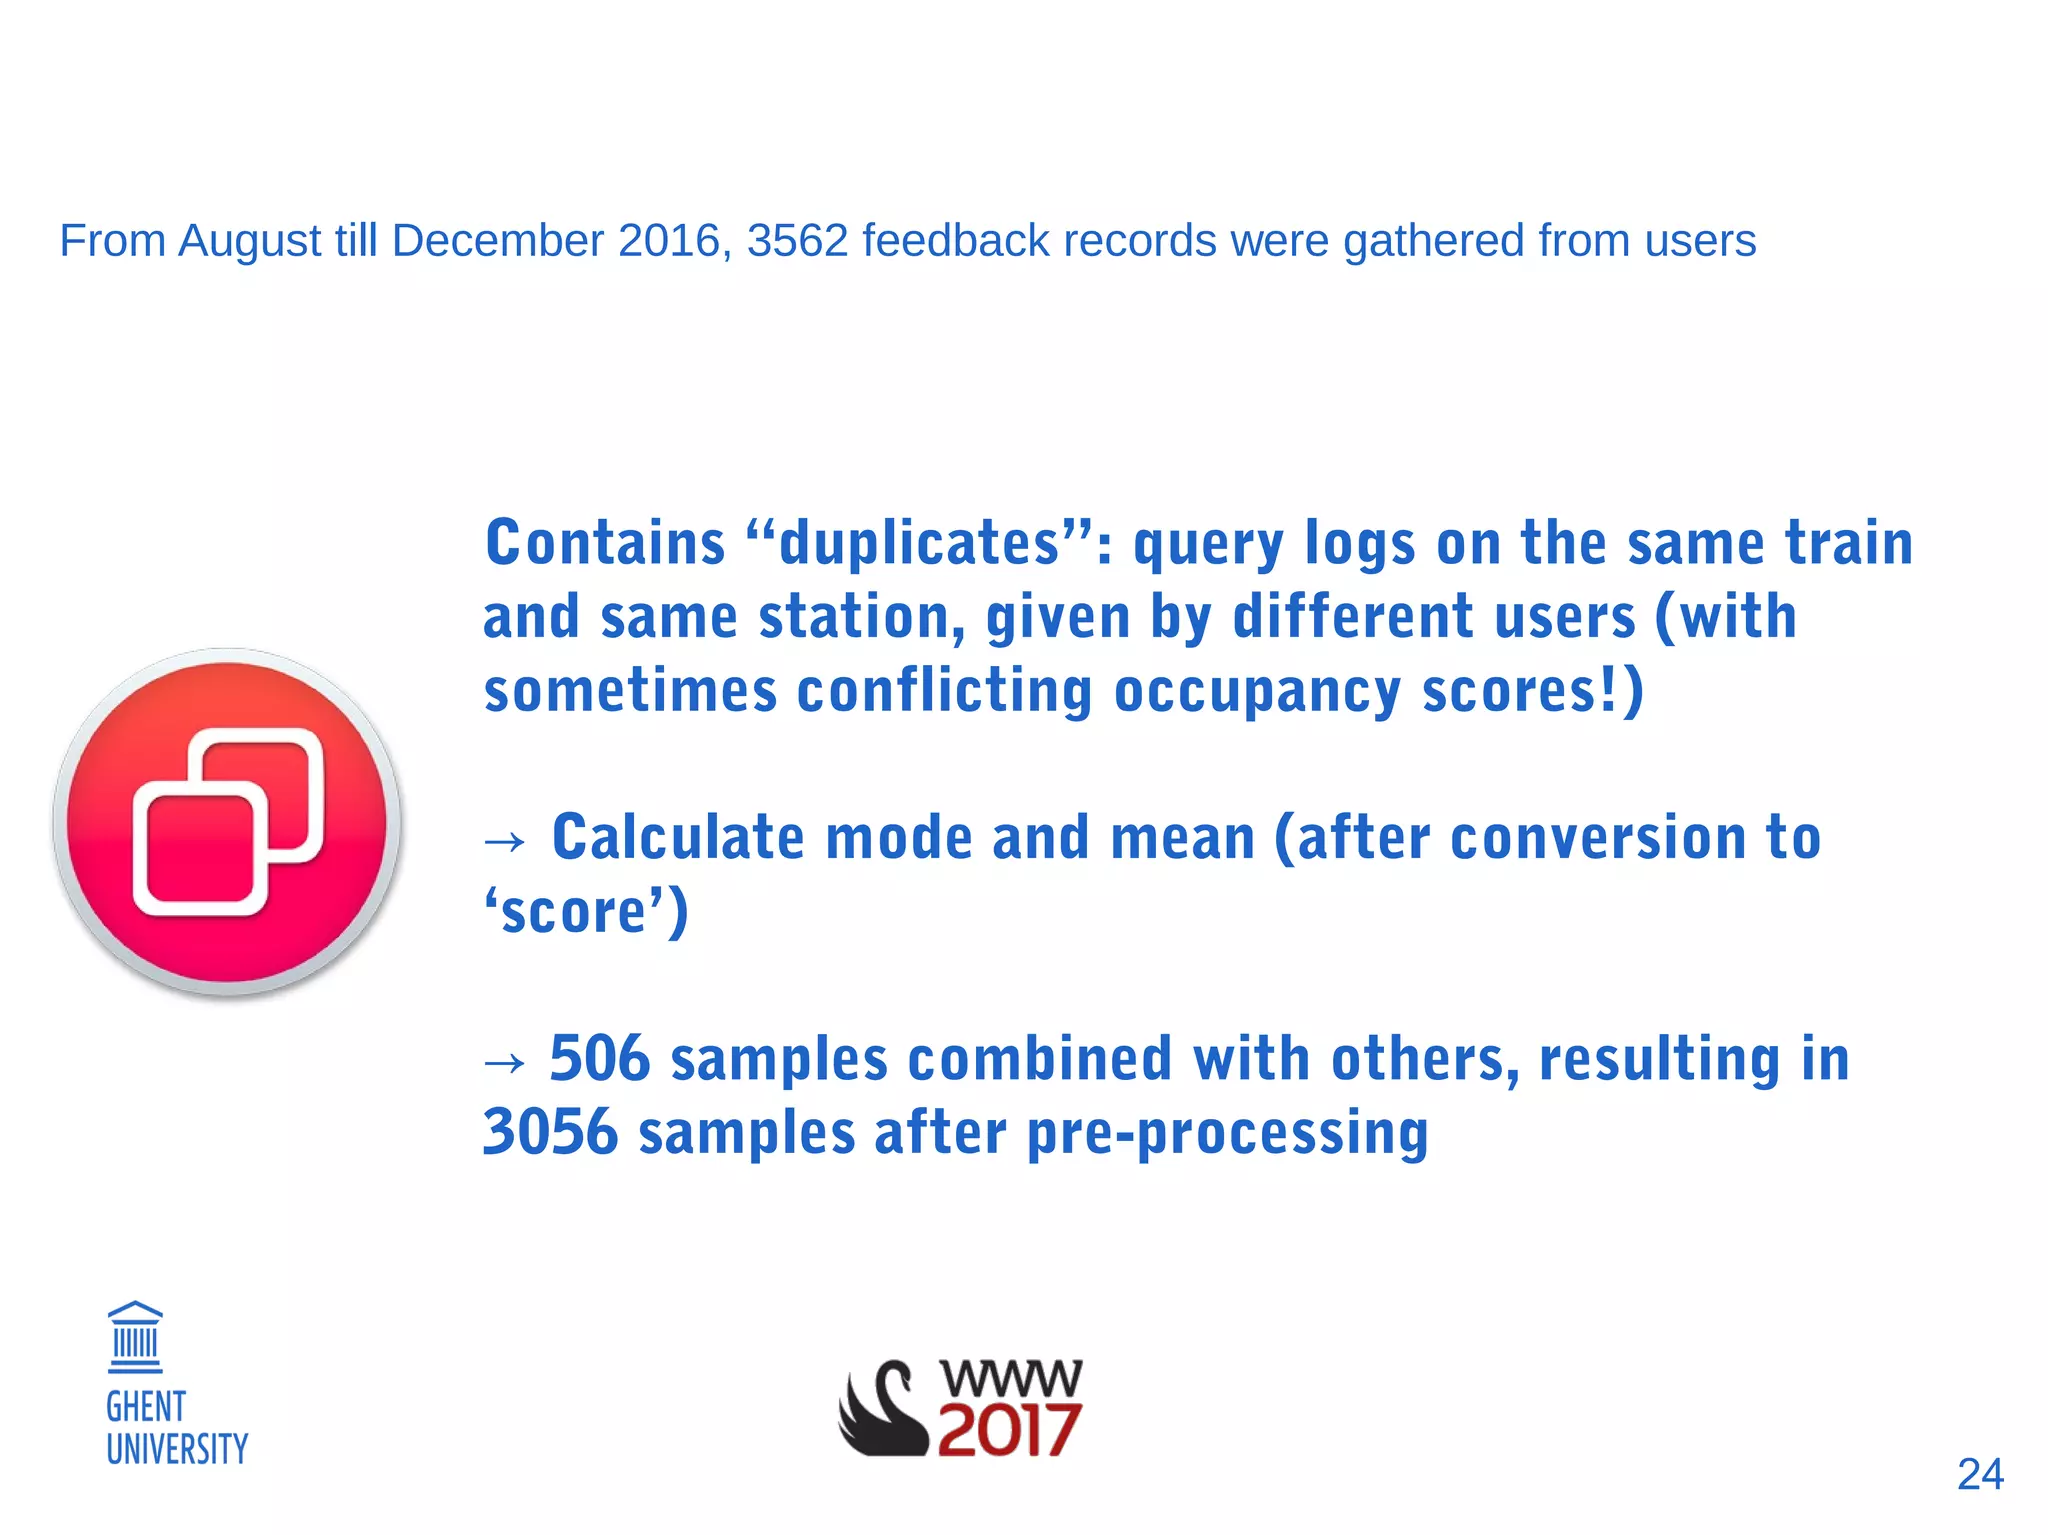
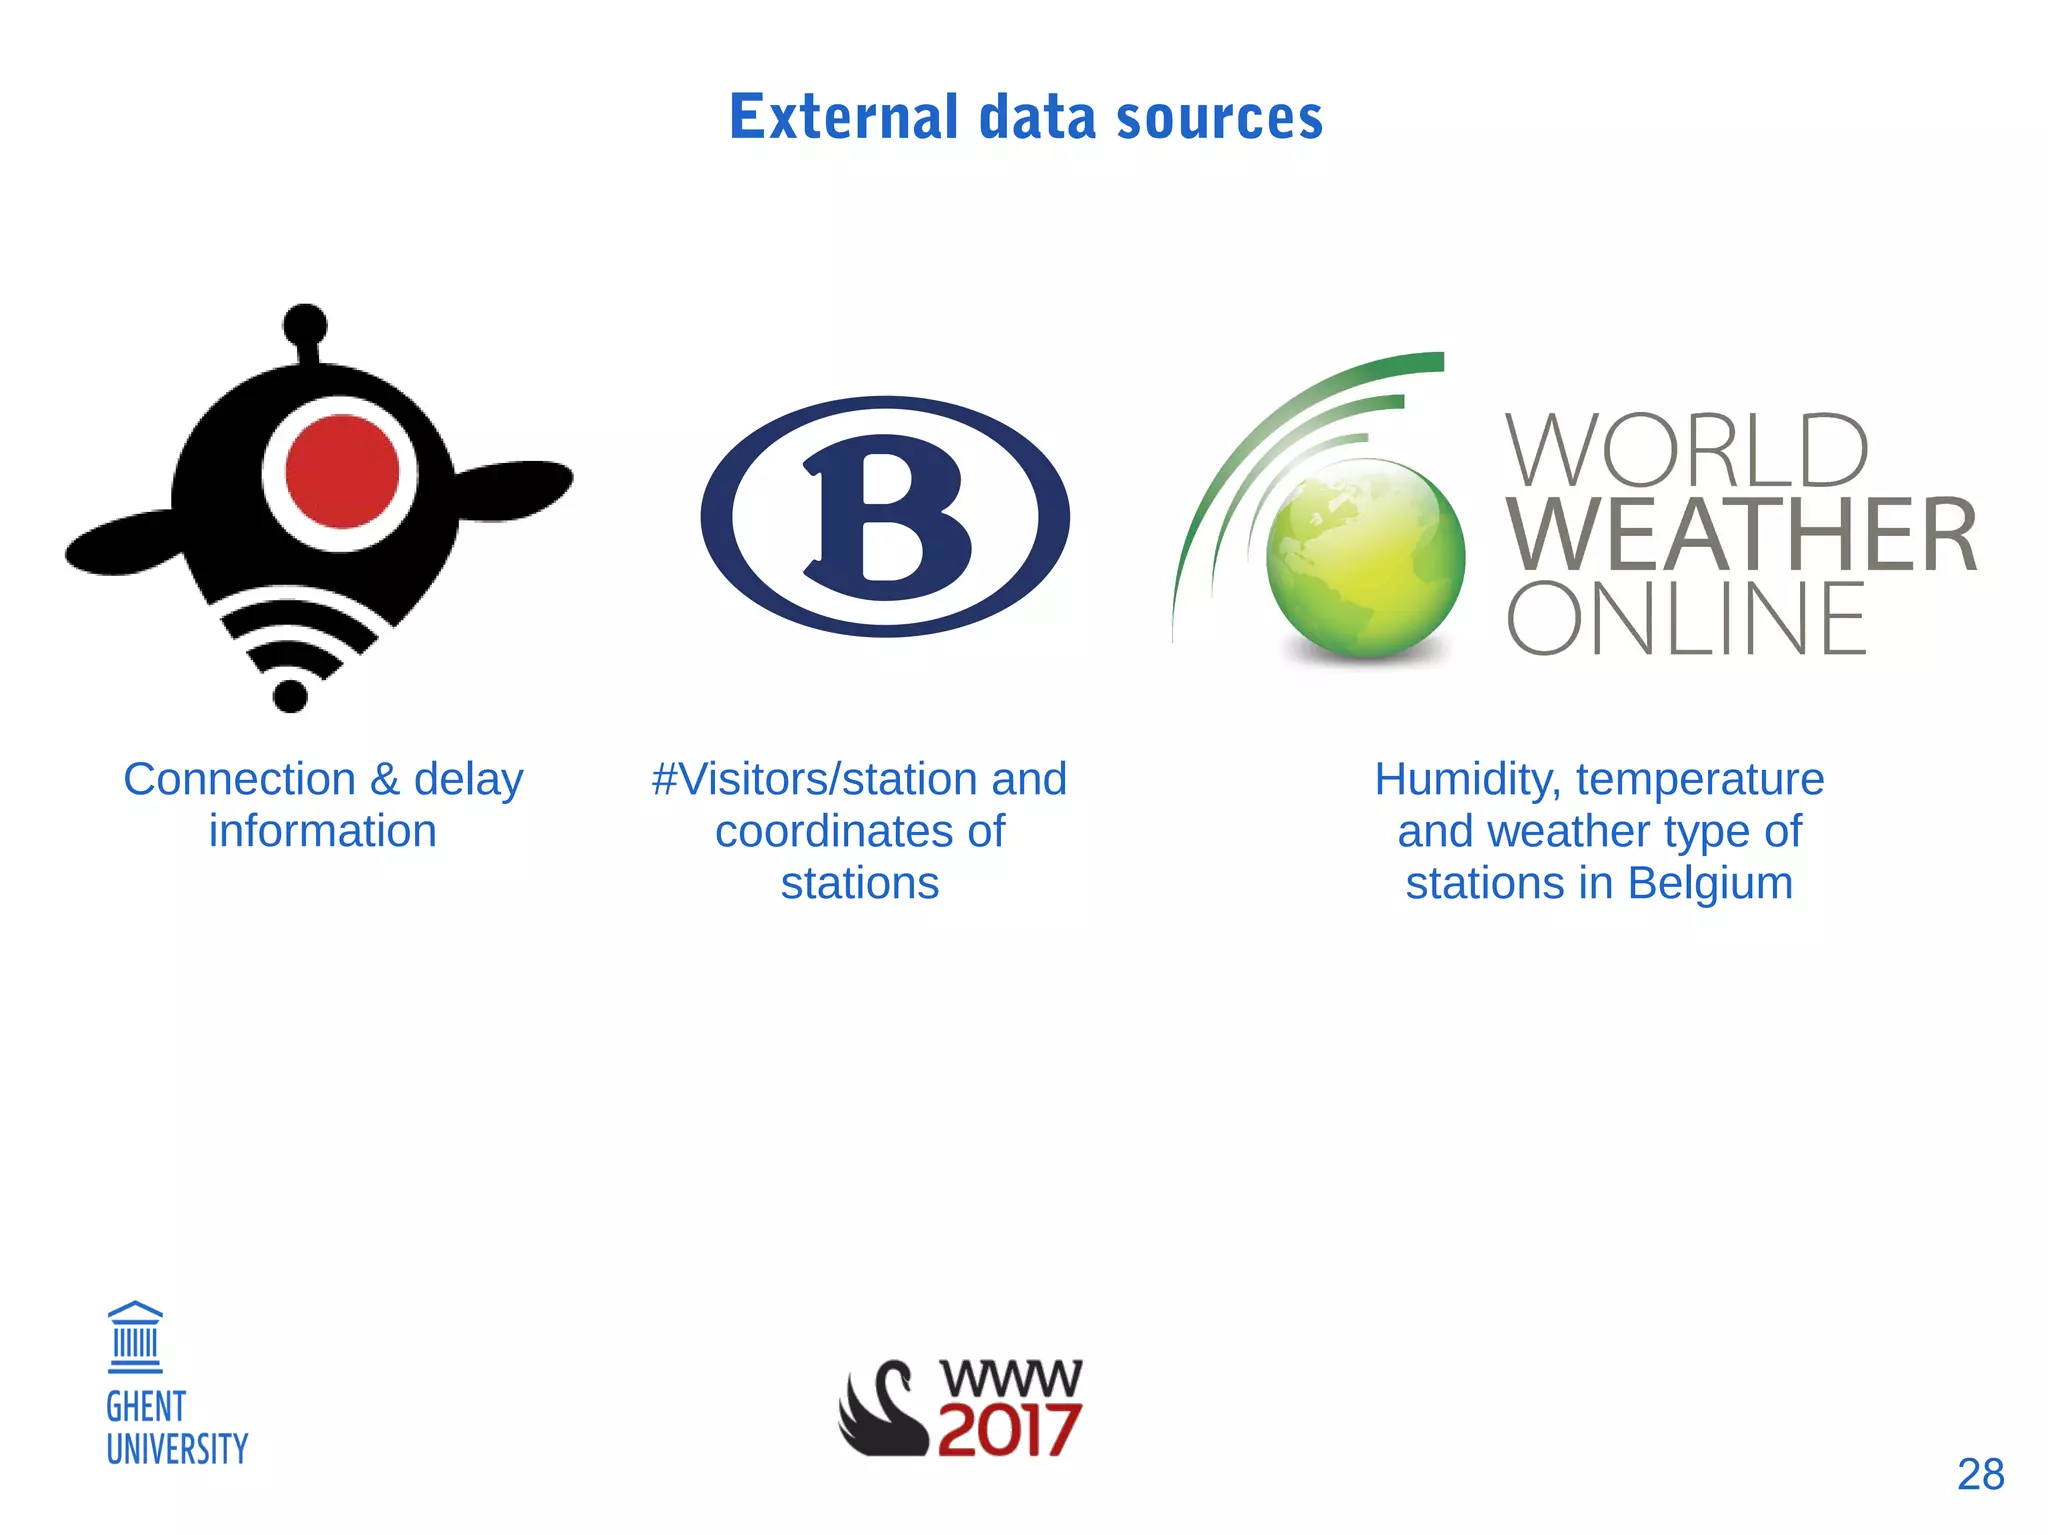
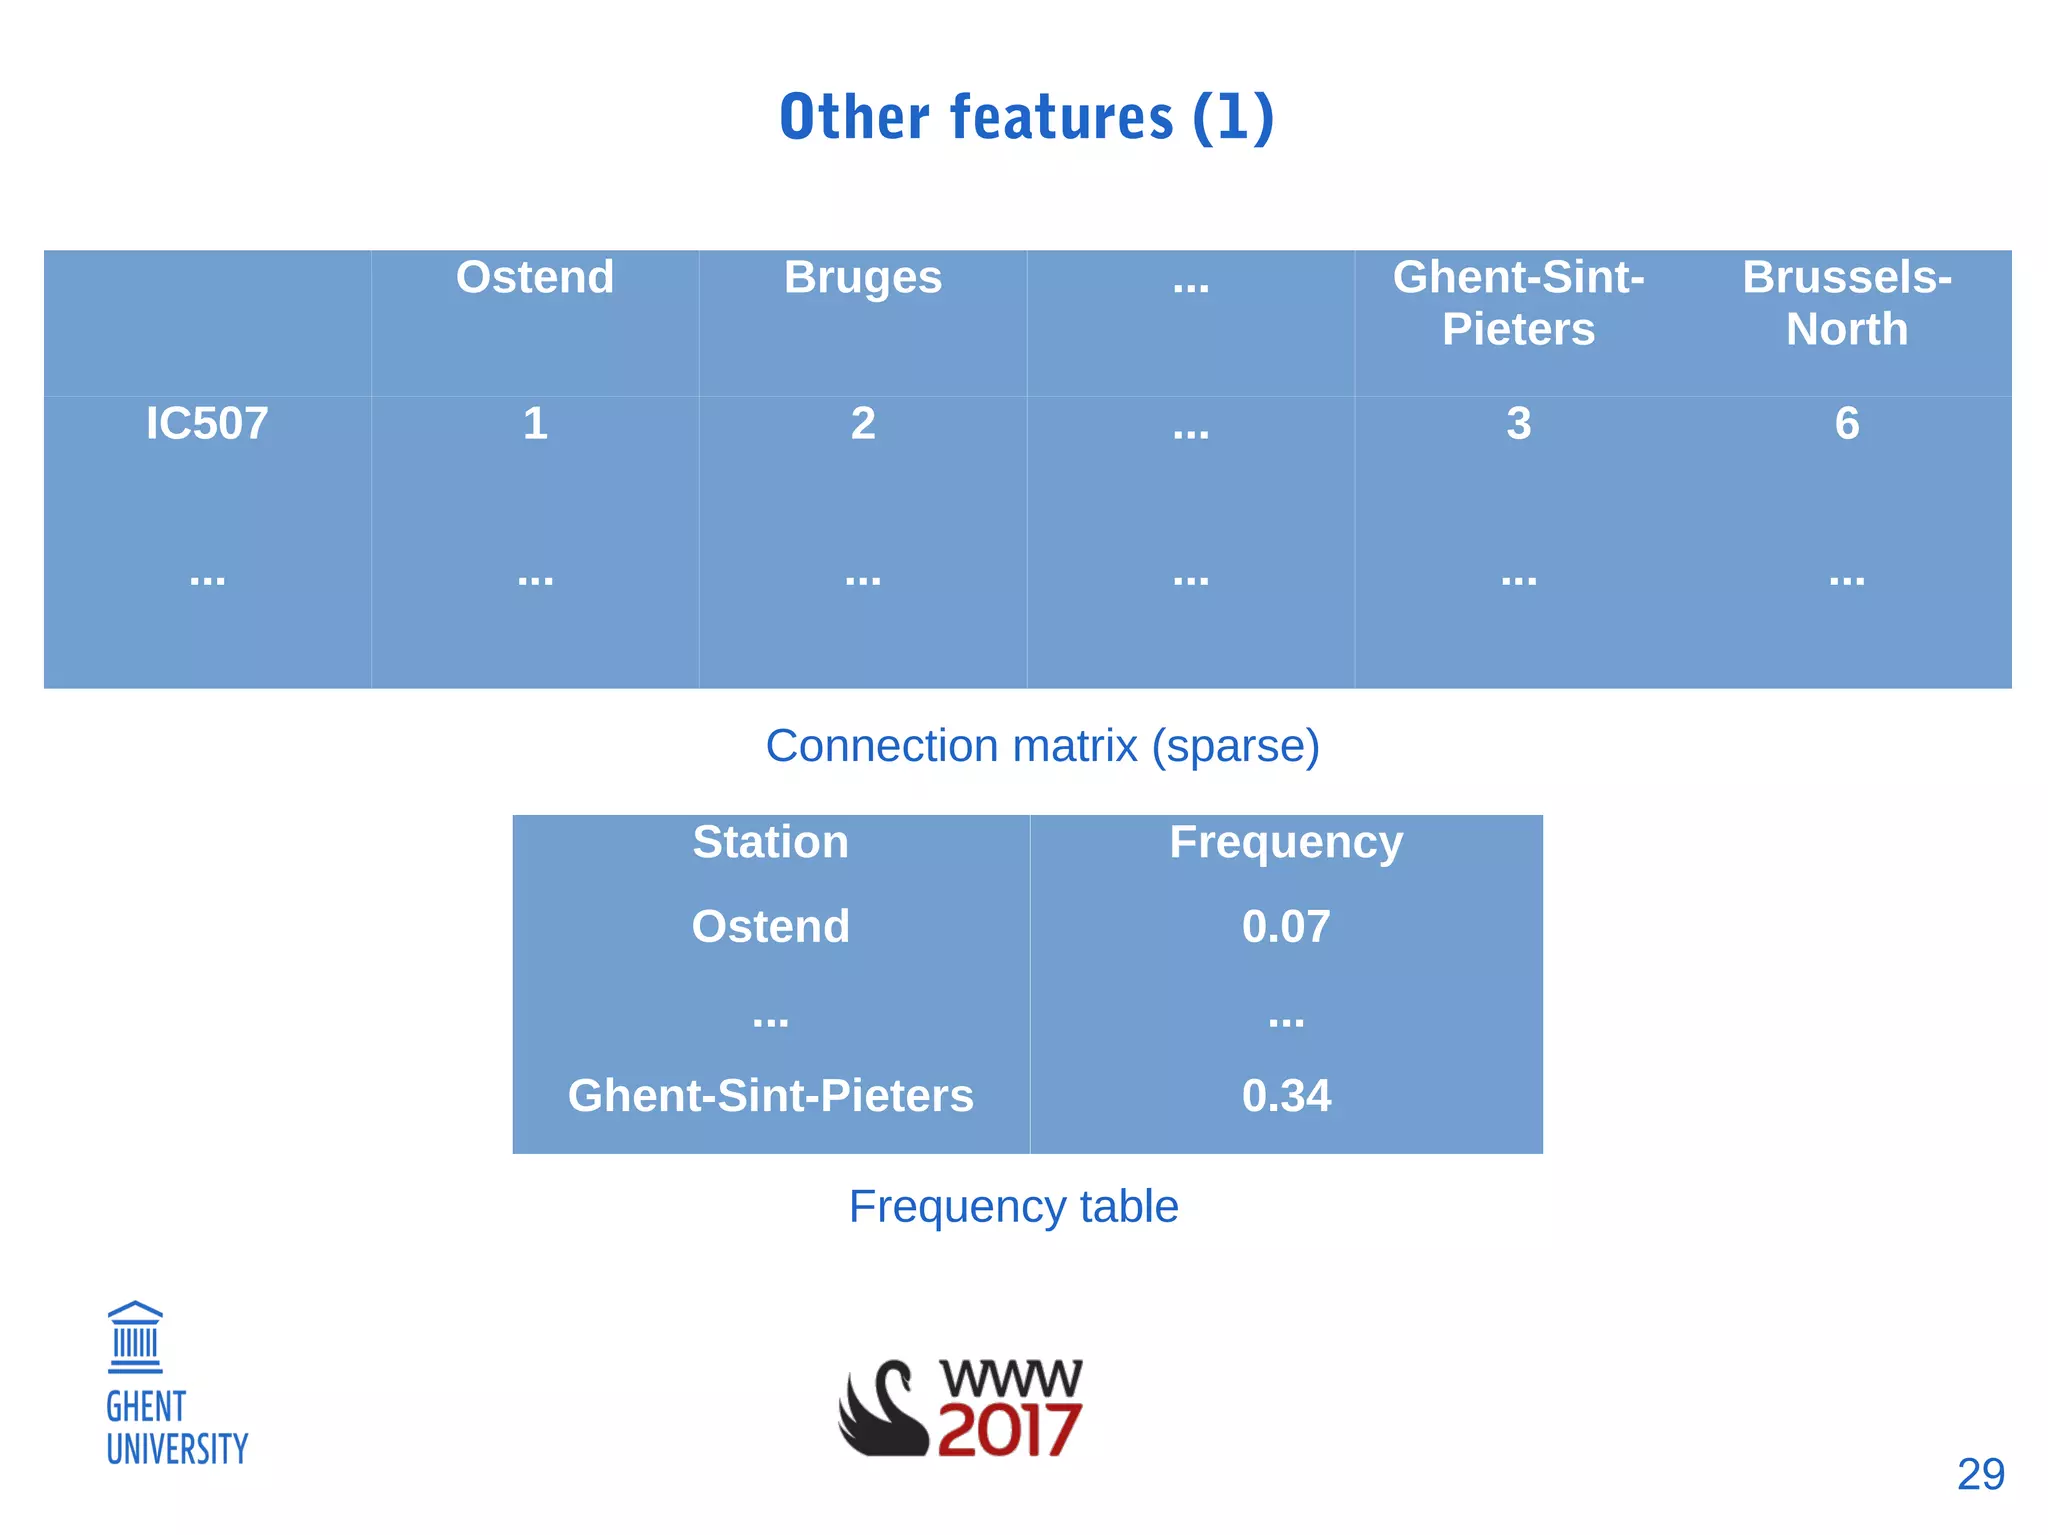
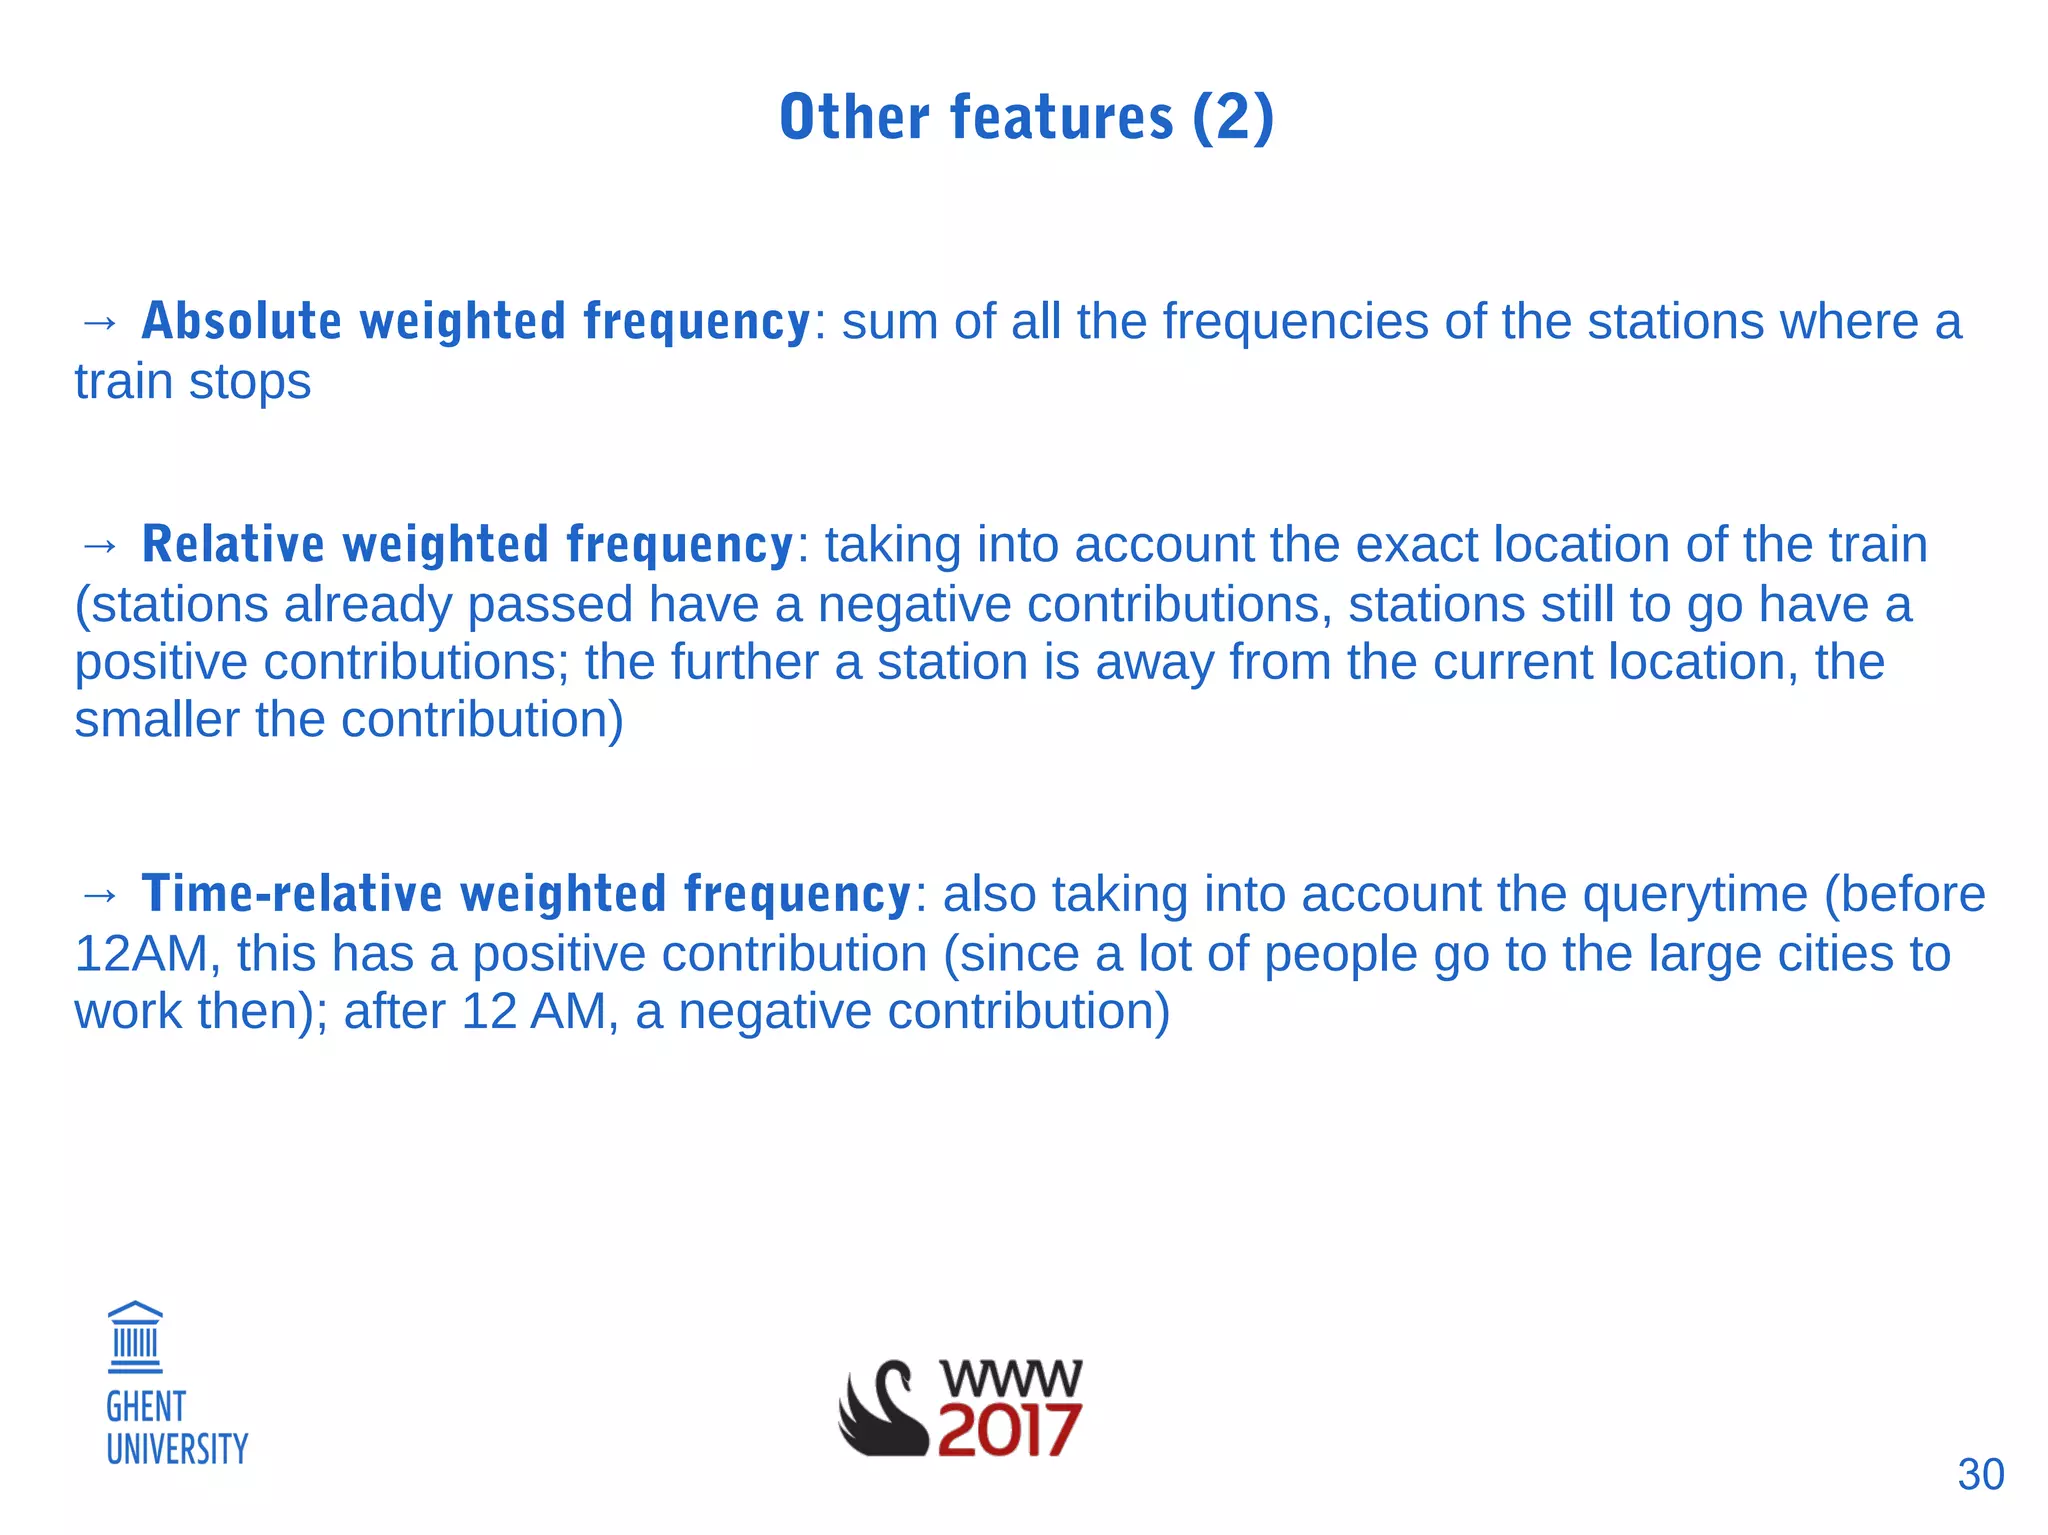
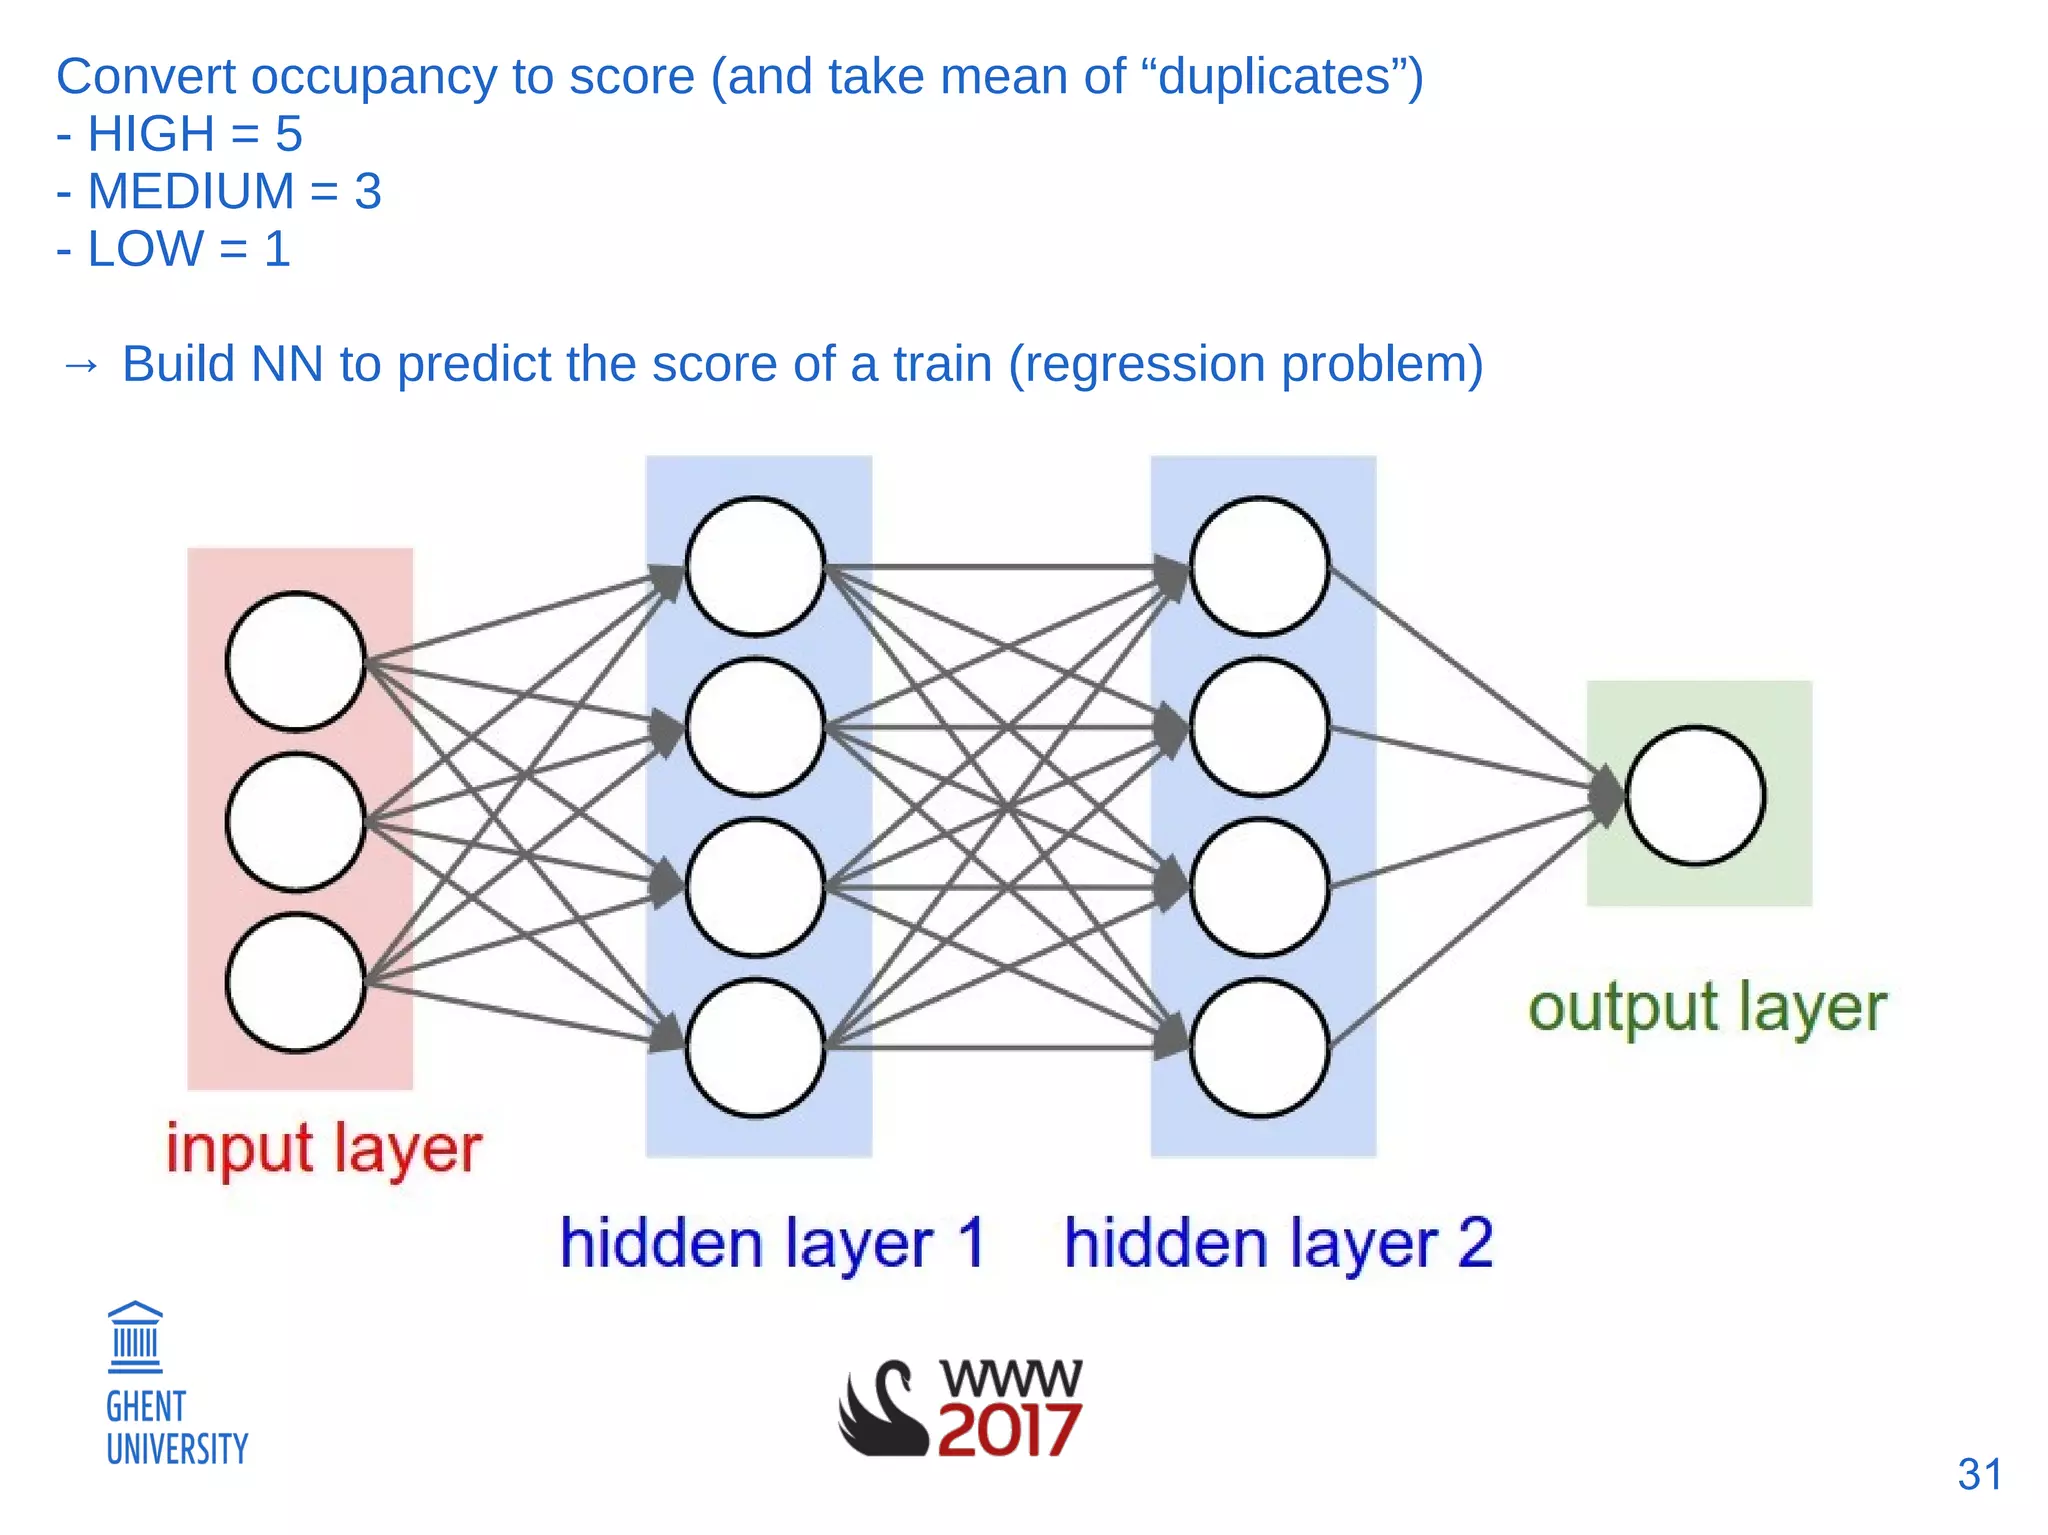
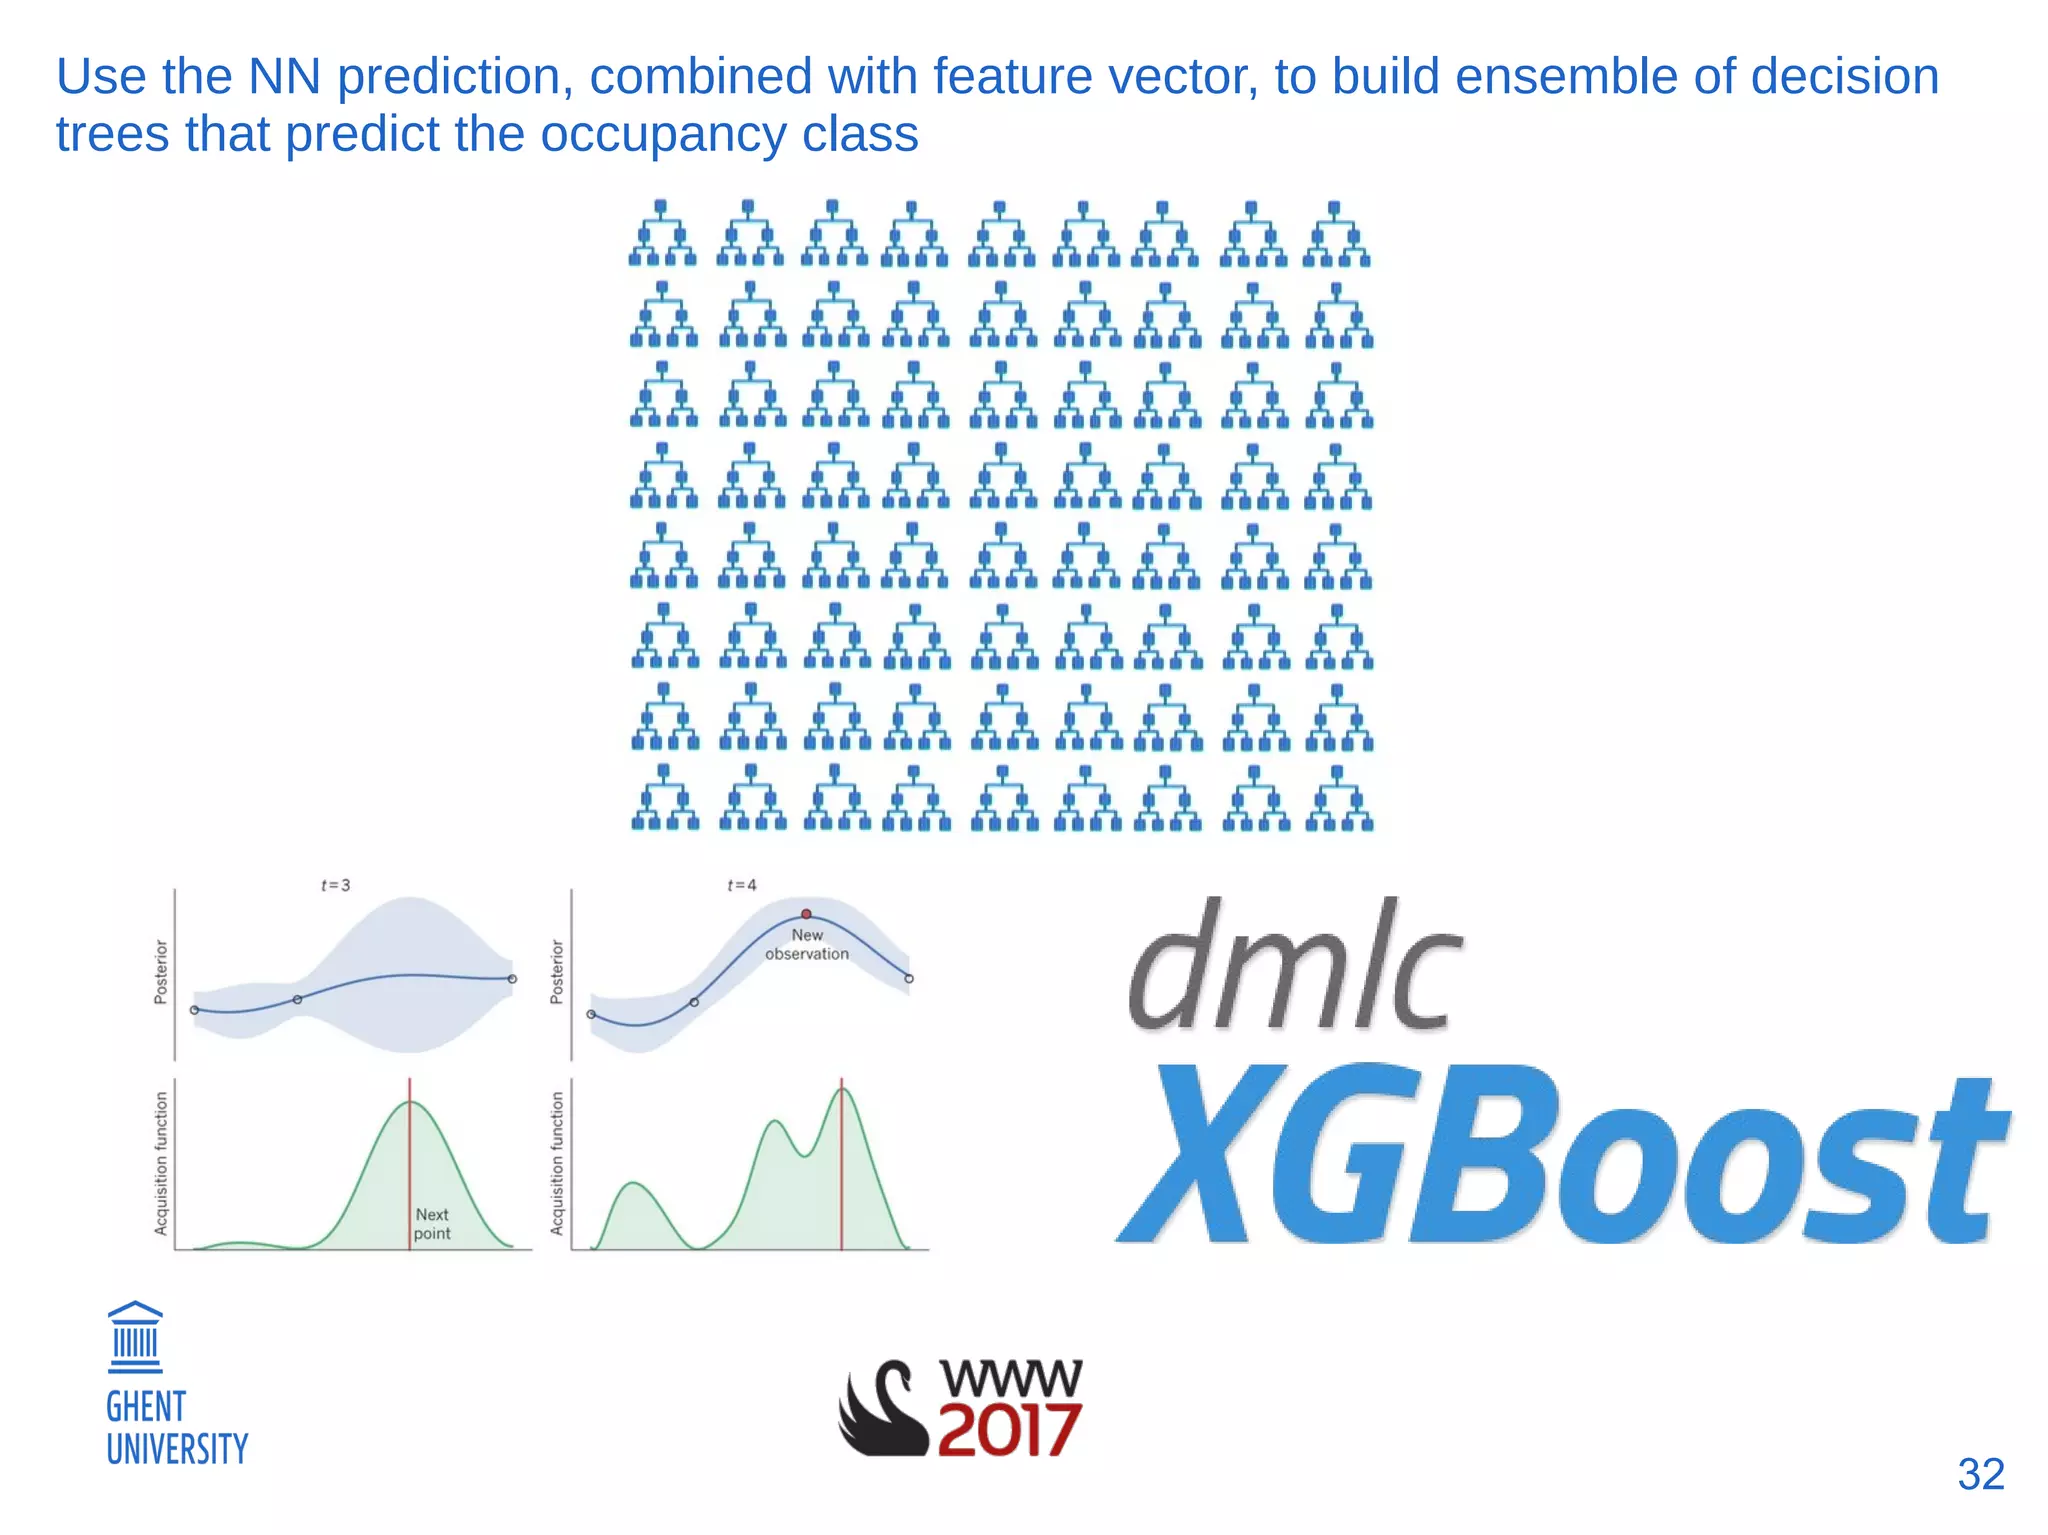
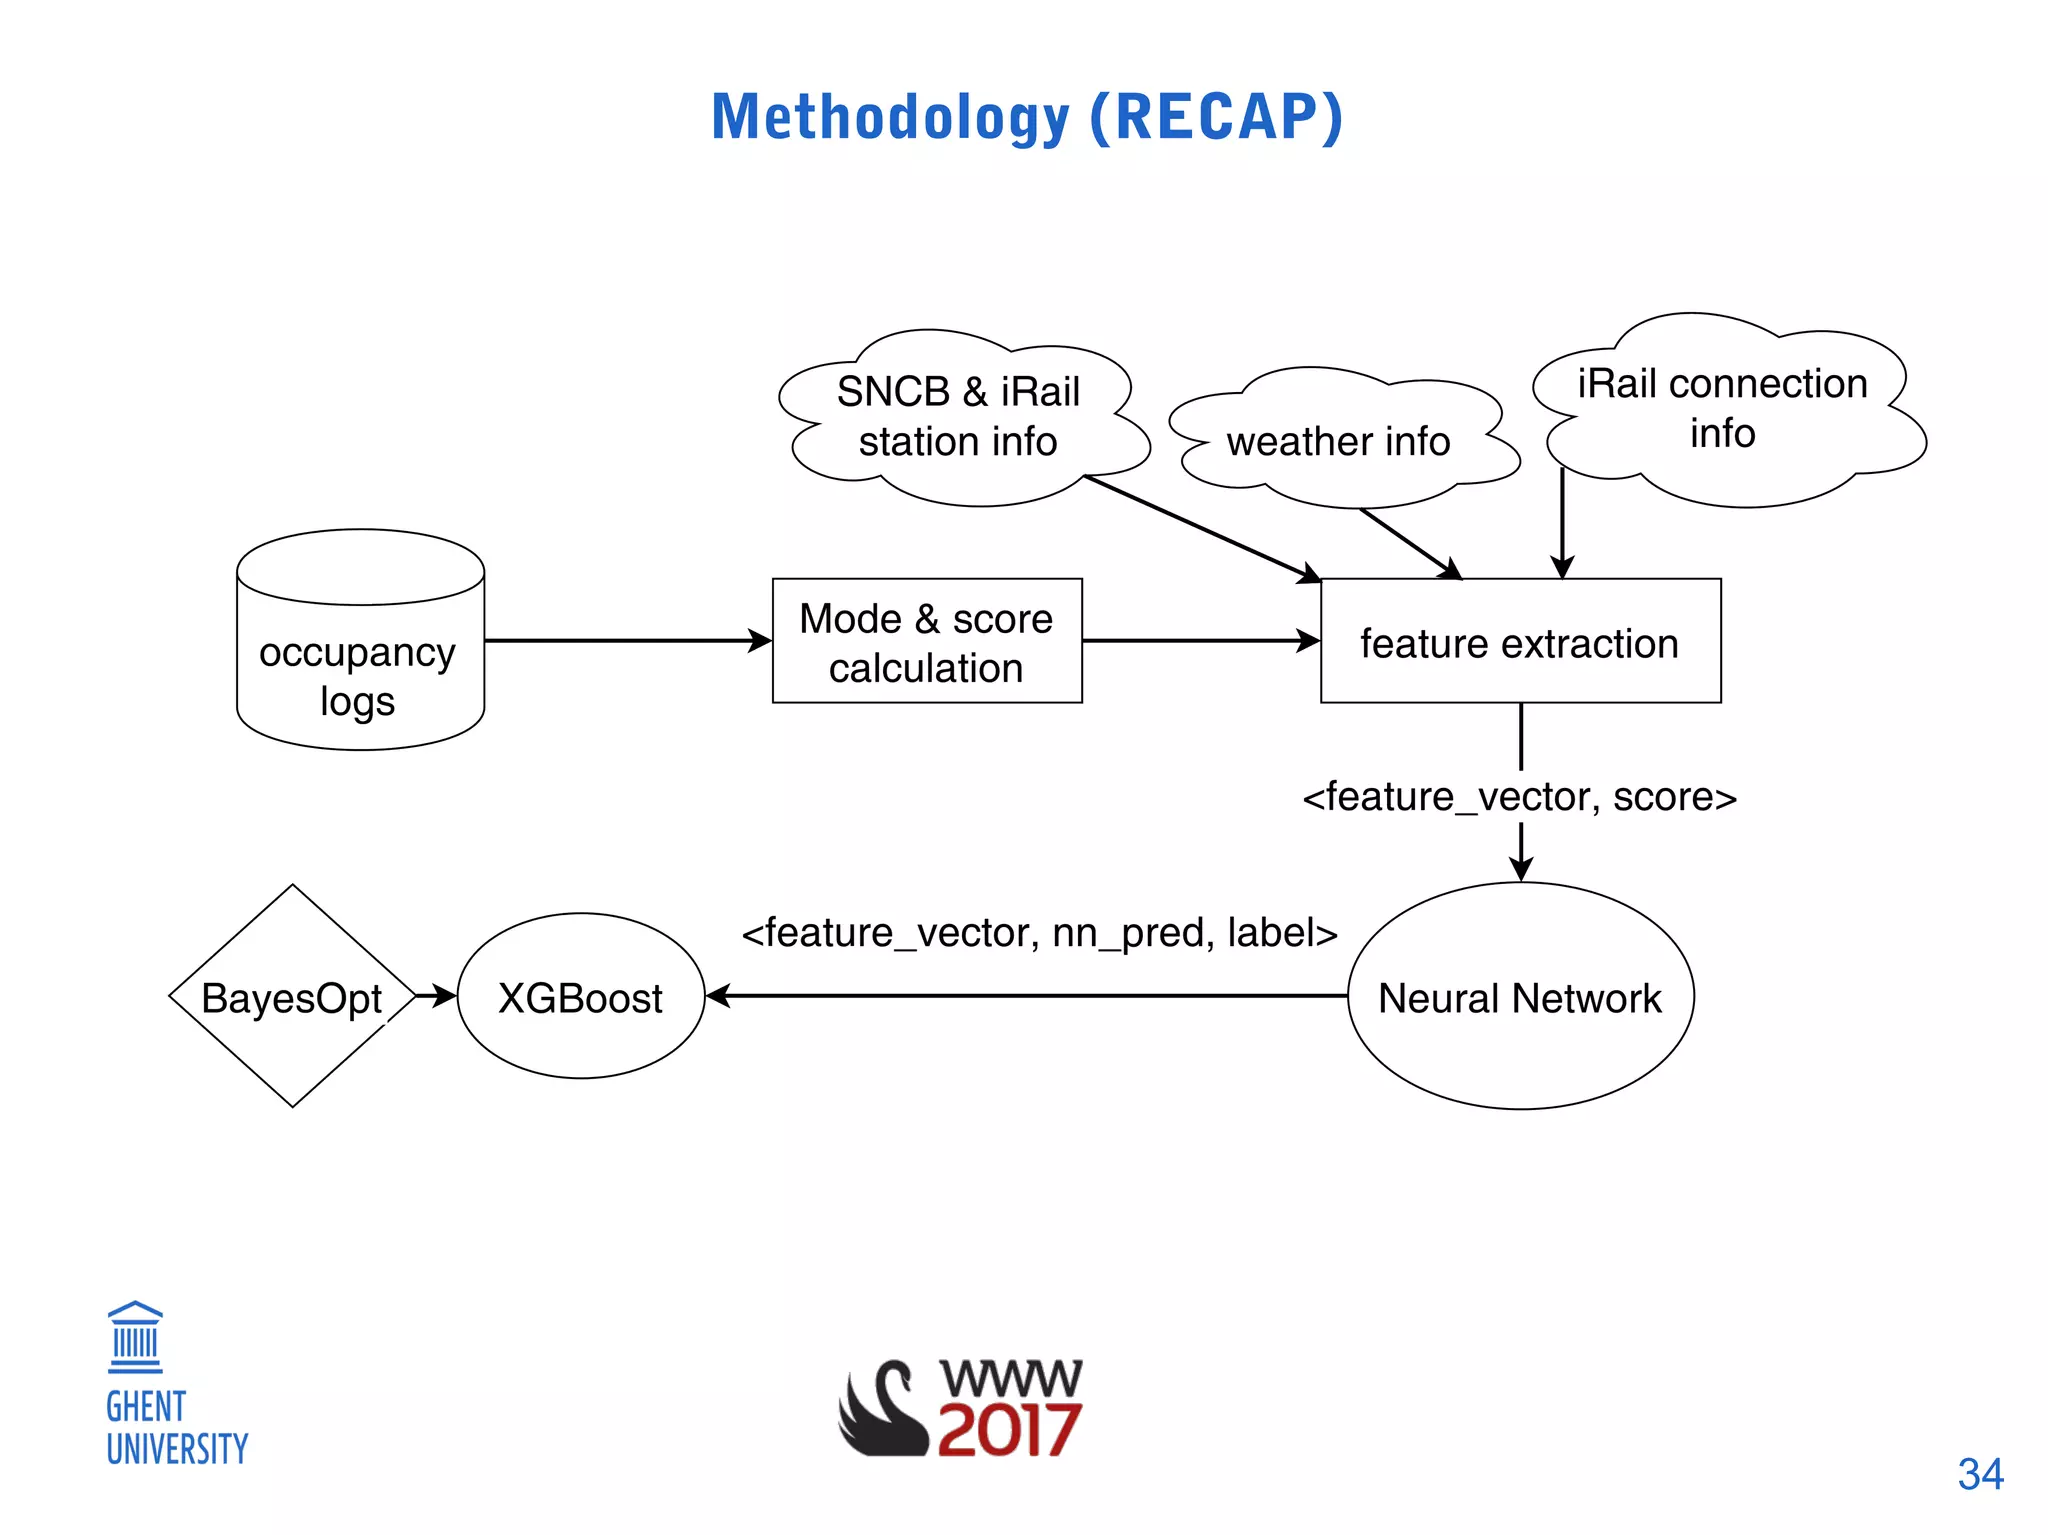
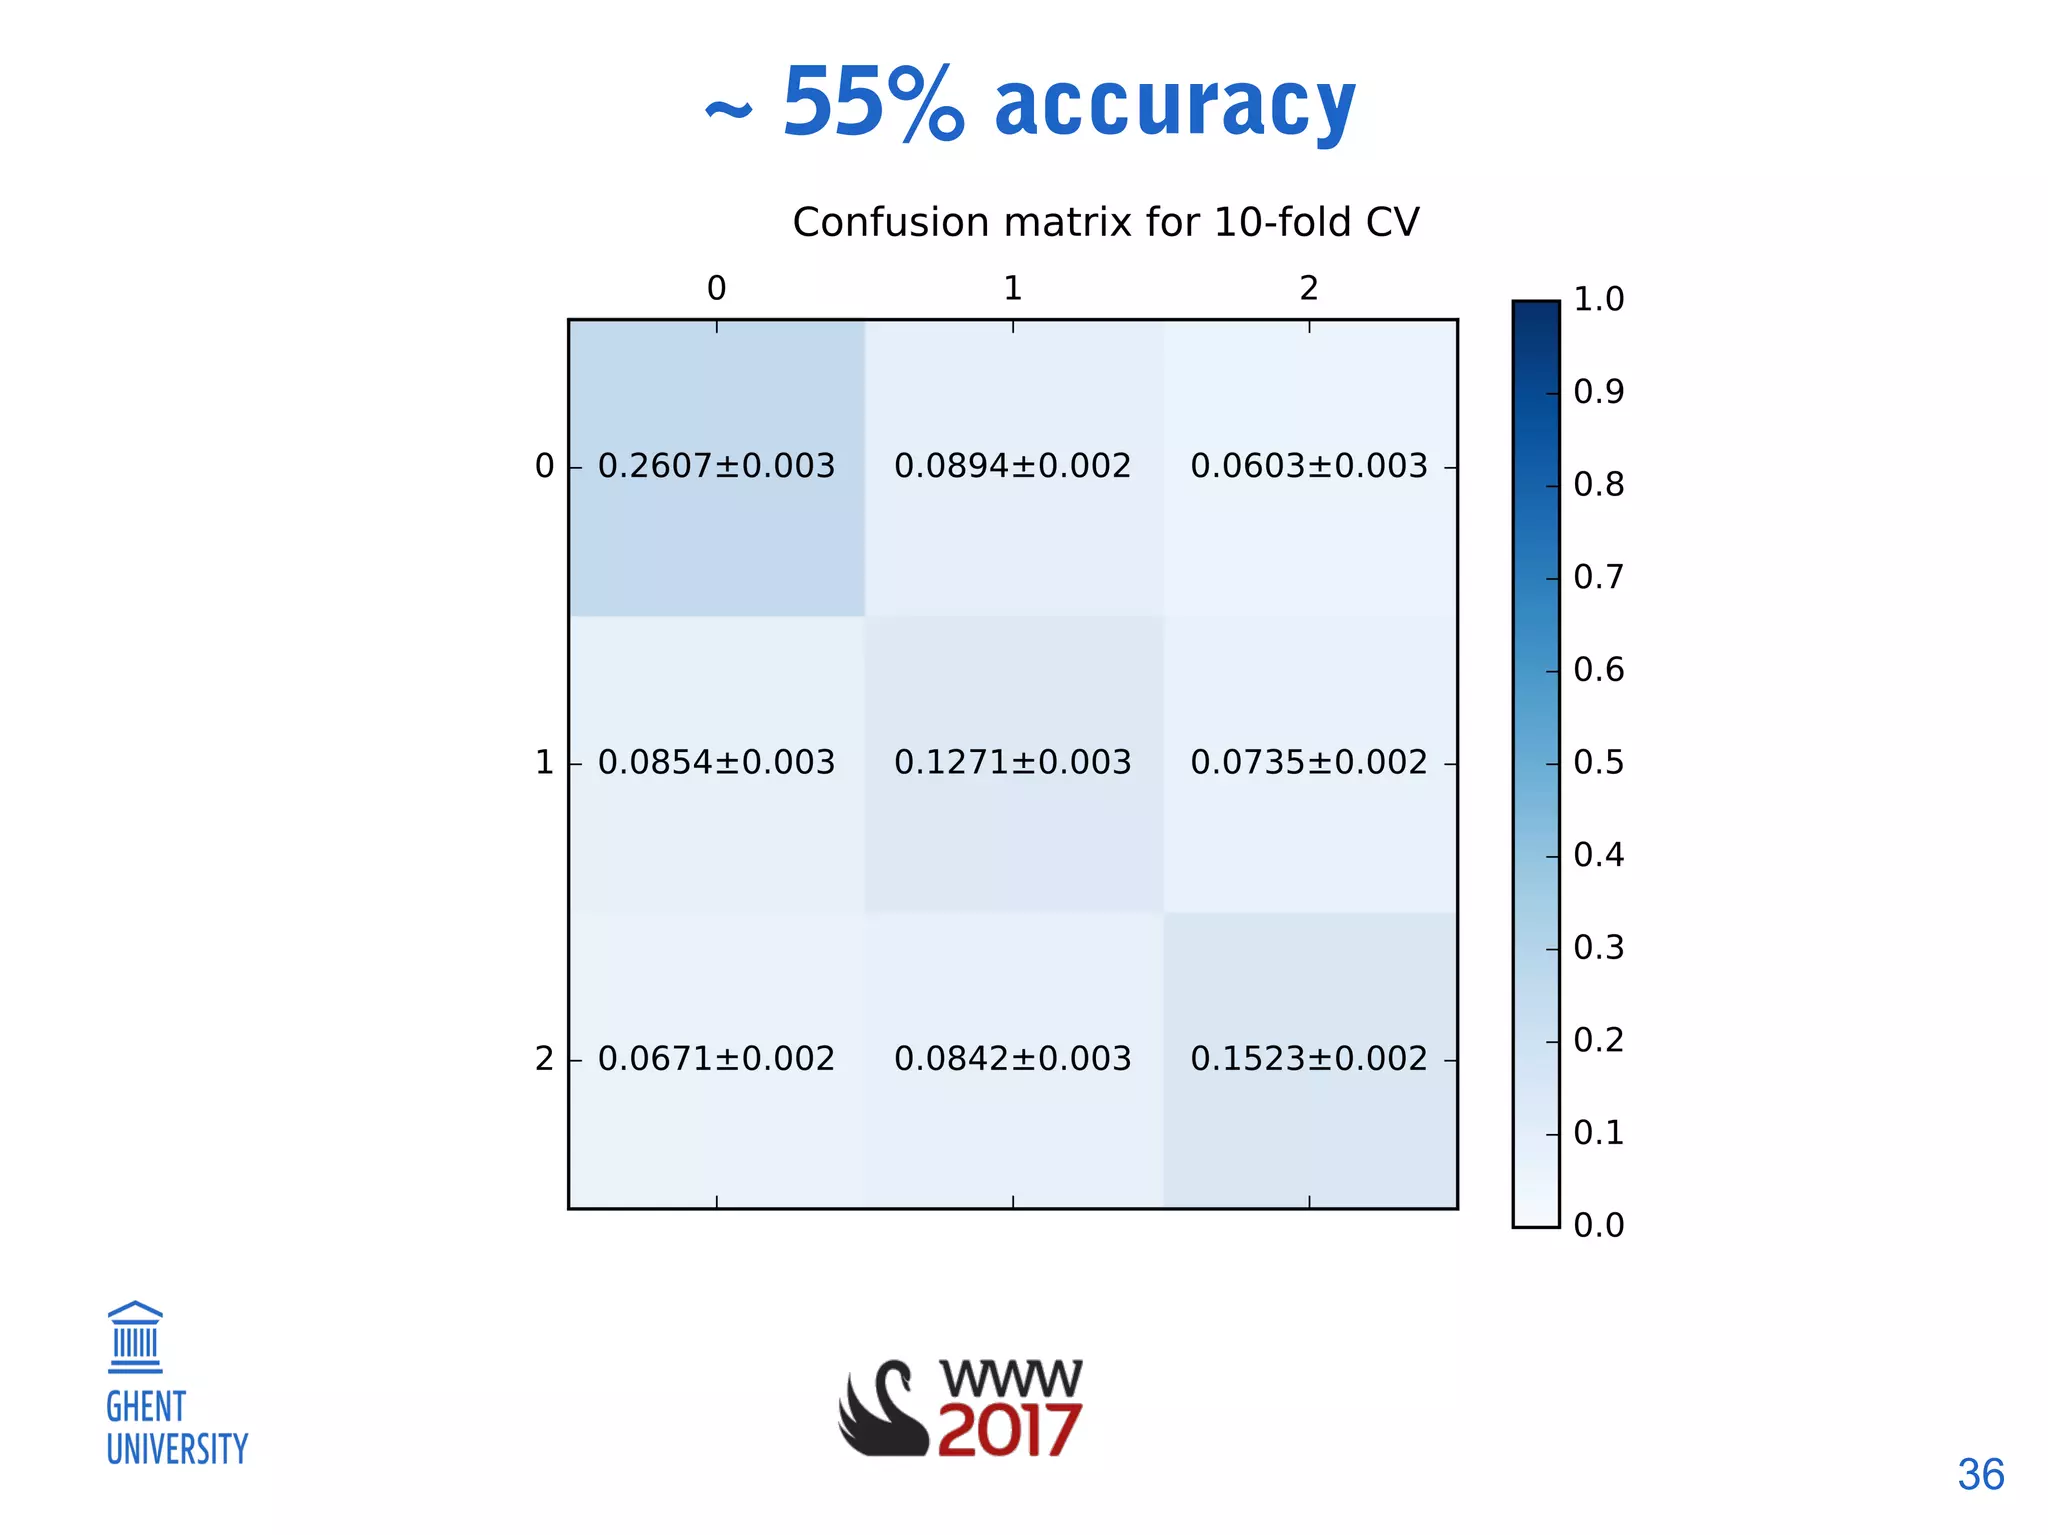
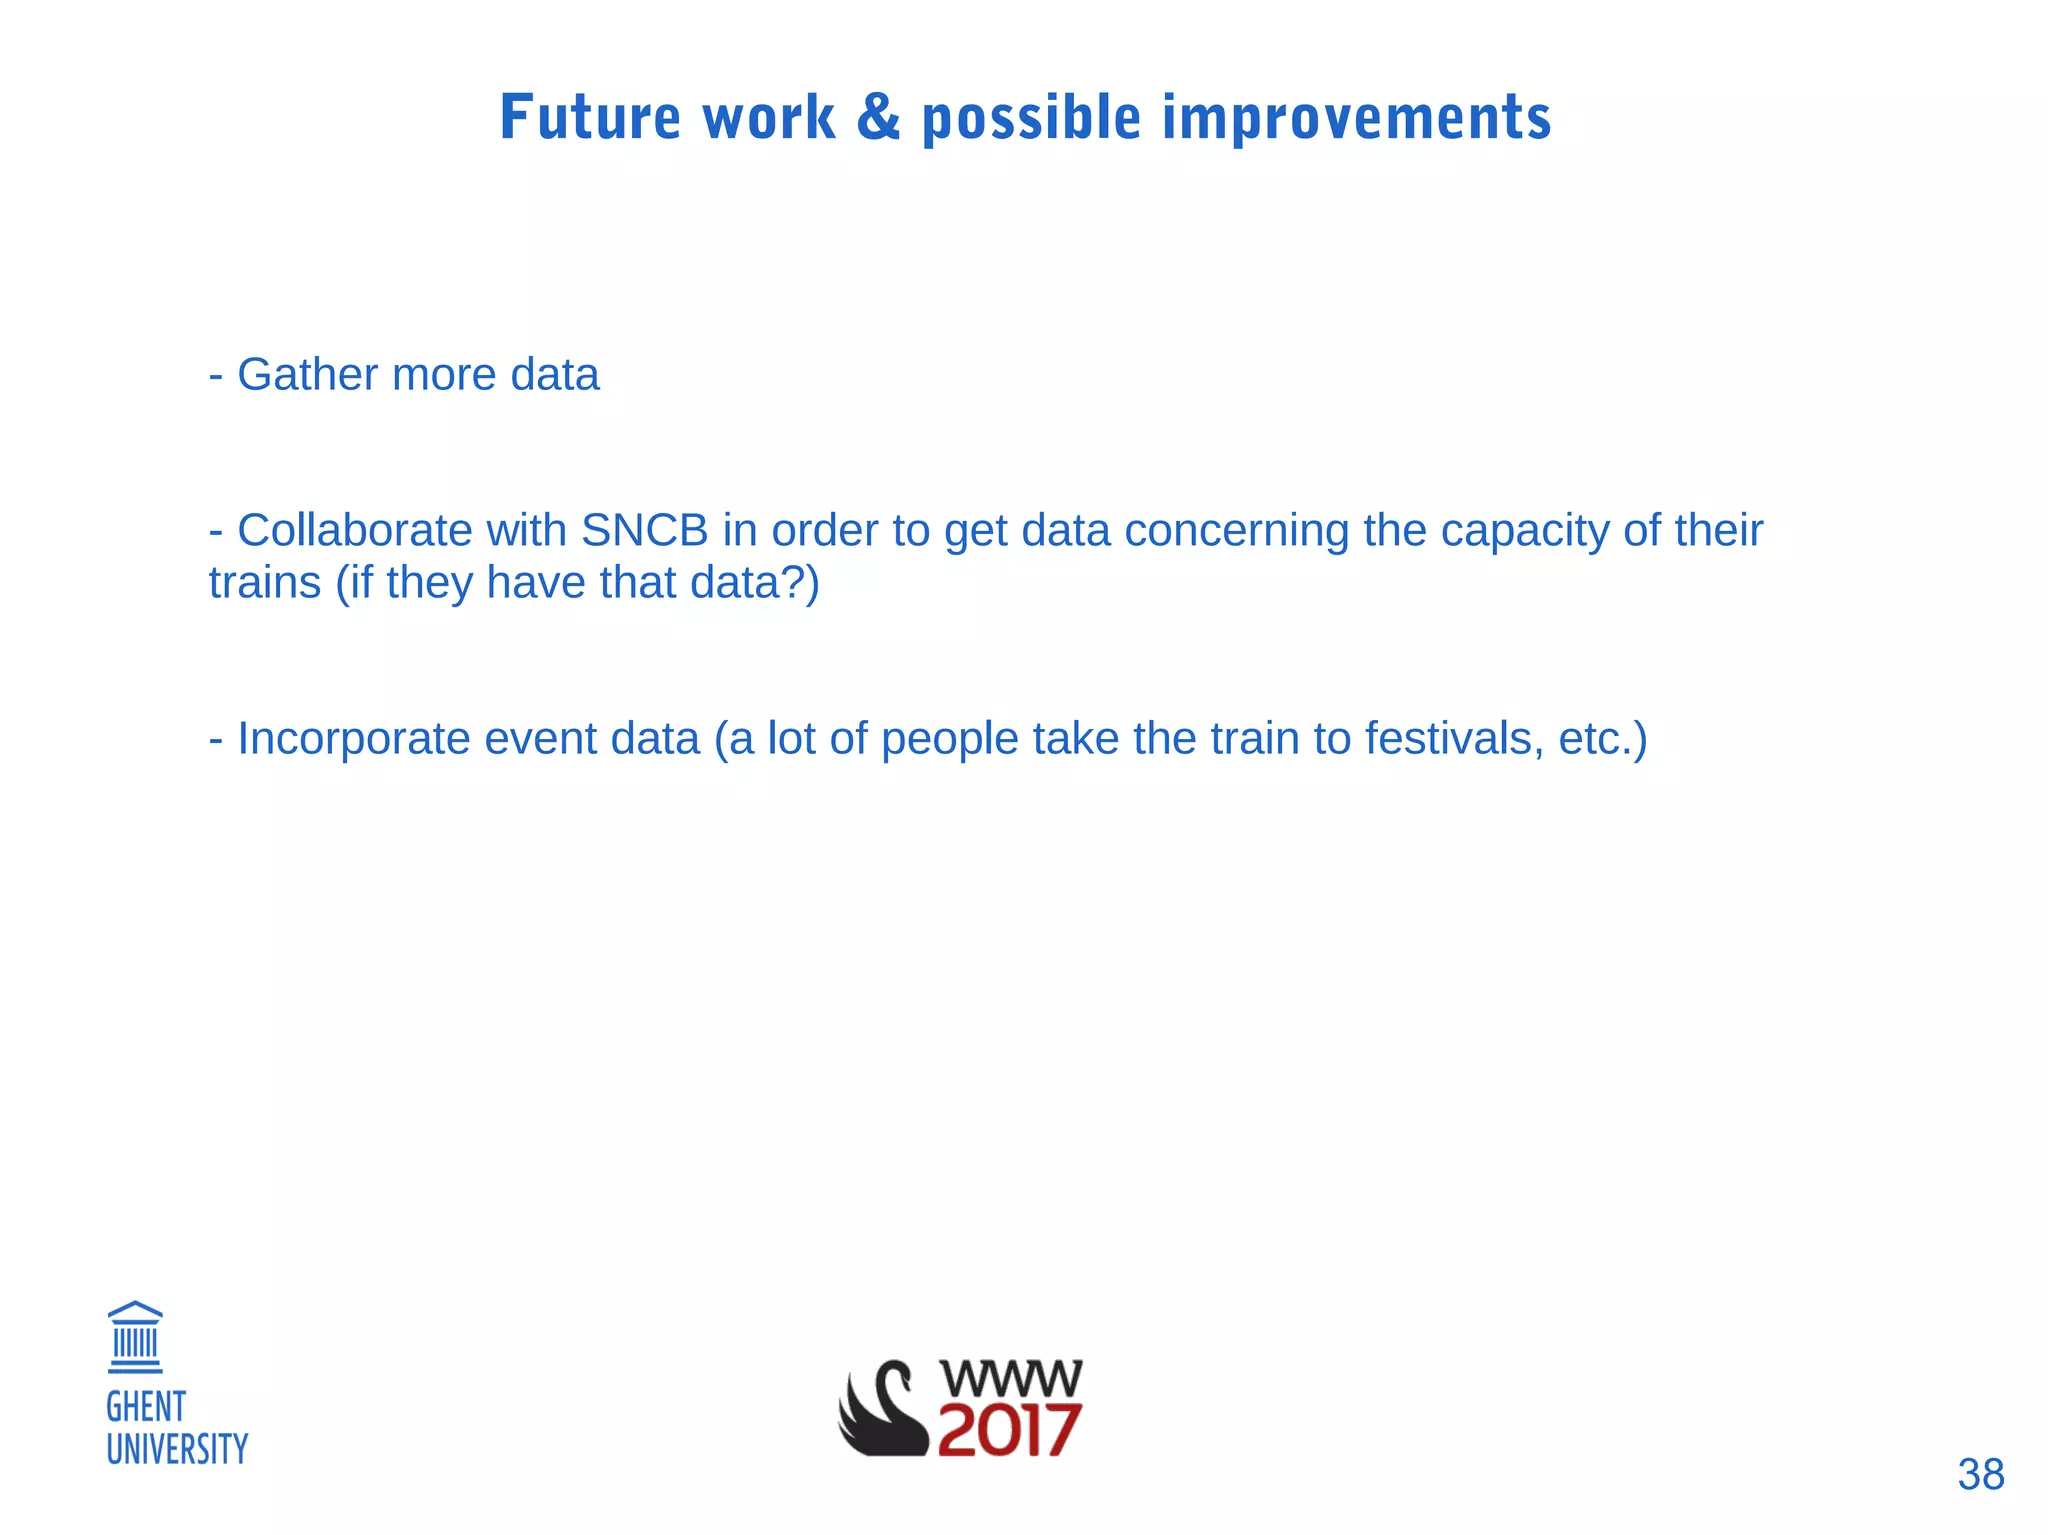
Predicting train occupancies based on
query logs and external data sources
Gilles Vandewiele, Pieter Colpaert, Joachim Van Herwegen,
Olivier Janssens, Ruben Verborgh, Erik Mannens,
Femke Ongenae, Filip De Turck
2
Who often takes a train?
3
4
5
6
7
“For every billion we invest in public
transportation, we create a lot of
jobs, save thousands of dollar a year
for each commuter and dramatically
cut greenhouse gas emissions”
→ Bernie Sanders
8
Source: SNCB (2016)
Increase of >25%!
9
Source: Leefmilieu Brussel (2013)
10
11
How can we try to avoid busy trains?
Incentivize people to take another
train by letting them know the
occupancy beforehand
12
1. SpitsGids
2. Building an occupancy classifier
3. Results
13
“rush hour guide”
14
LOW MEDIUM HIGH UNKNOWN
Occupancy indicator
Allows for user feedback
15
Passenger experience
User
feedback
structurally busy trains
16
17
18
19
Passenger experience
User
feedback
structurally busy trains
20
No automated fare collection in Belgium!
21
No exact numbers of passengers (imperfect information)
Dataset (of user feedback) is several orders of magnitude smaller than
prior research in other countries!
22
1. SpitsGids
2. Building an occupancy classifier
3. Results
23
Methodology
24
From August till December 2016, 3562 feedback records were gathered from users
Contains “duplicates”: query logs on the same train
and same station, given by different users (with
sometimes conflicting occupancy scores!)
→ Calculate mode and mean (after conversion to
‘score’)
→ 506 samples combined with others, resulting in
3056 samples after pre-processing
25
Query time
A feedback log is composed of...
Vehicle ID
(structural)
Departure station Arrival station
Occupancy
26
Query time
Seconds since midnight
→
Day of the week
Month
Morning/evening rush hour?
27
Vehicle ID
(structural)
Vehicle type (L/IC/P/...)
→ Line number (e.g. 500 goes from
Ostend to Brussels)
Series number (with hour encoded)
→ IC507 is the InterCity train from
Ostend to Brussels that departs at 7:40
AM in Ostend
28
External data sources
Connection & delay
information
#Visitors/station and
coordinates of
stations
Humidity, temperature
and weather type of
stations in Belgium
29
Other features (1)
Ostend Bruges ... Ghent-Sint-
Pieters
Brussels-
North
IC507 1 2 ... 3 6
... ... ... ... ... ...
Connection matrix (sparse)
Station Frequency
Ostend 0.07
... ...
Ghent-Sint-Pieters 0.34
Frequency table
30
Other features (2)
→ Absolute weighted frequency: sum of all the frequencies of the stations where a
train stops
→ Relative weighted frequency: taking into account the exact location of the train
(stations already passed have a negative contributions, stations still to go have a
positive contributions; the further a station is away from the current location, the
smaller the contribution)
→ Time-relative weighted frequency: also taking into account the querytime (before
12AM, this has a positive contribution (since a lot of people go to the large cities to
work then); after 12 AM, a negative contribution)
31
Convert occupancy to score (and take mean of “duplicates”)
- HIGH = 5
- MEDIUM = 3
- LOW = 1
→ Build NN to predict the score of a train (regression problem)
32
Use the NN prediction, combined with feature vector, to build ensemble of decision
trees that predict the occupancy class
33
34
Methodology (RECAP)
35
1. SpitsGids
2. Building an occupancy classifier
3. Results
36
~ 55% accuracy
37
Creator:cairo 1.14.6 (http://cairographi
CreationDate:Sat Feb 11 17:42:30 2017
LanguageLevel:3
Accuracy increases in function of number of samples!
38
Future work & possible improvements
- Gather more data
- Collaborate with SNCB in order to get data concerning the capacity of their
trains (if they have that data?)
- Incorporate event data (a lot of people take the train to festivals, etc.)
39
https://inclass.kaggle.com/c/train-occupancy-prediction/
40
gilles.vandewiele@ugent.be
Twitter: @IDLabResearch – @Gillesvdwiele
www.spitgids.be

[WWW - LocWeb2017] Predicting train occupancies based on query logs and external data sources