Transferir como PDF, PPTX

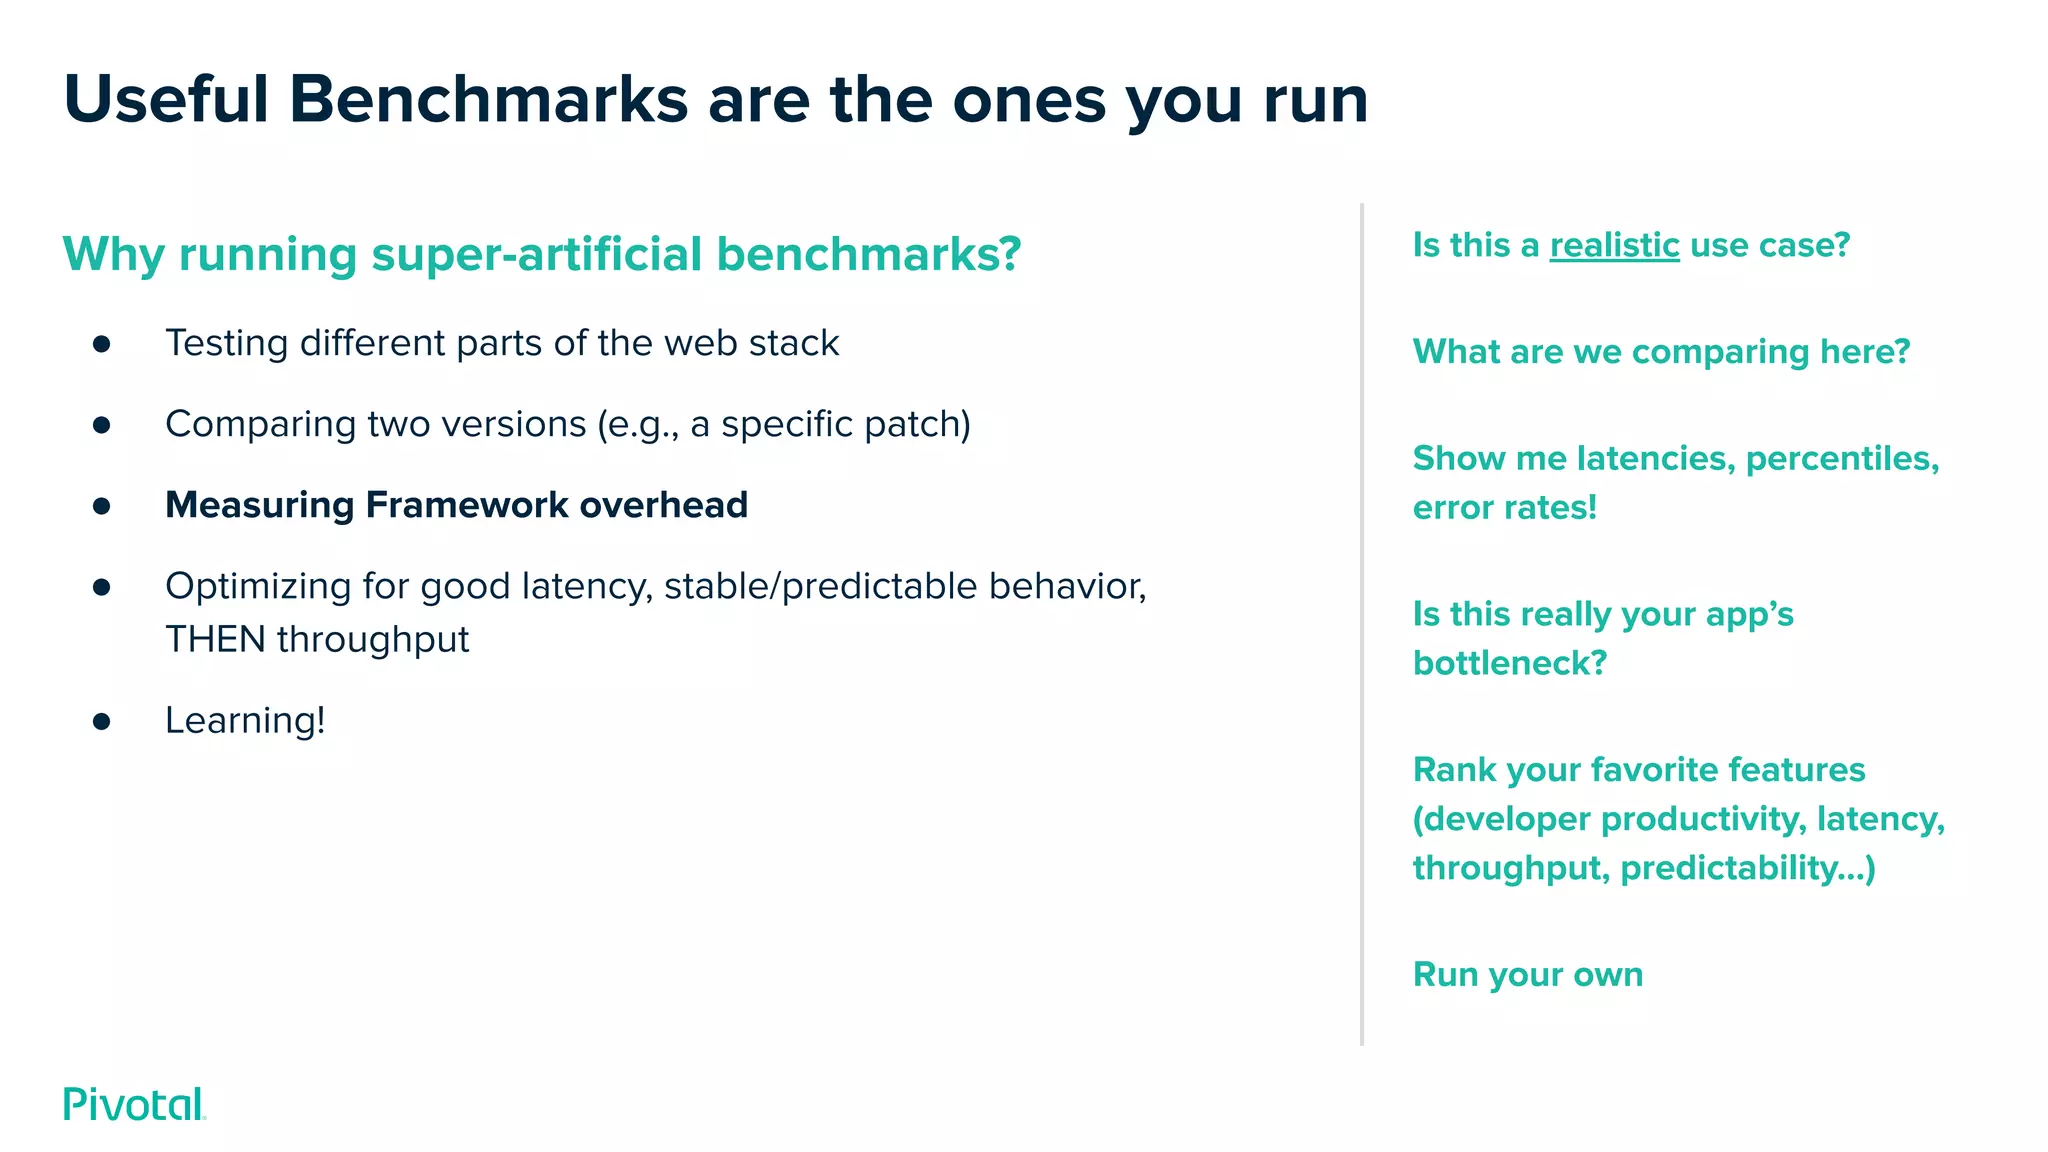
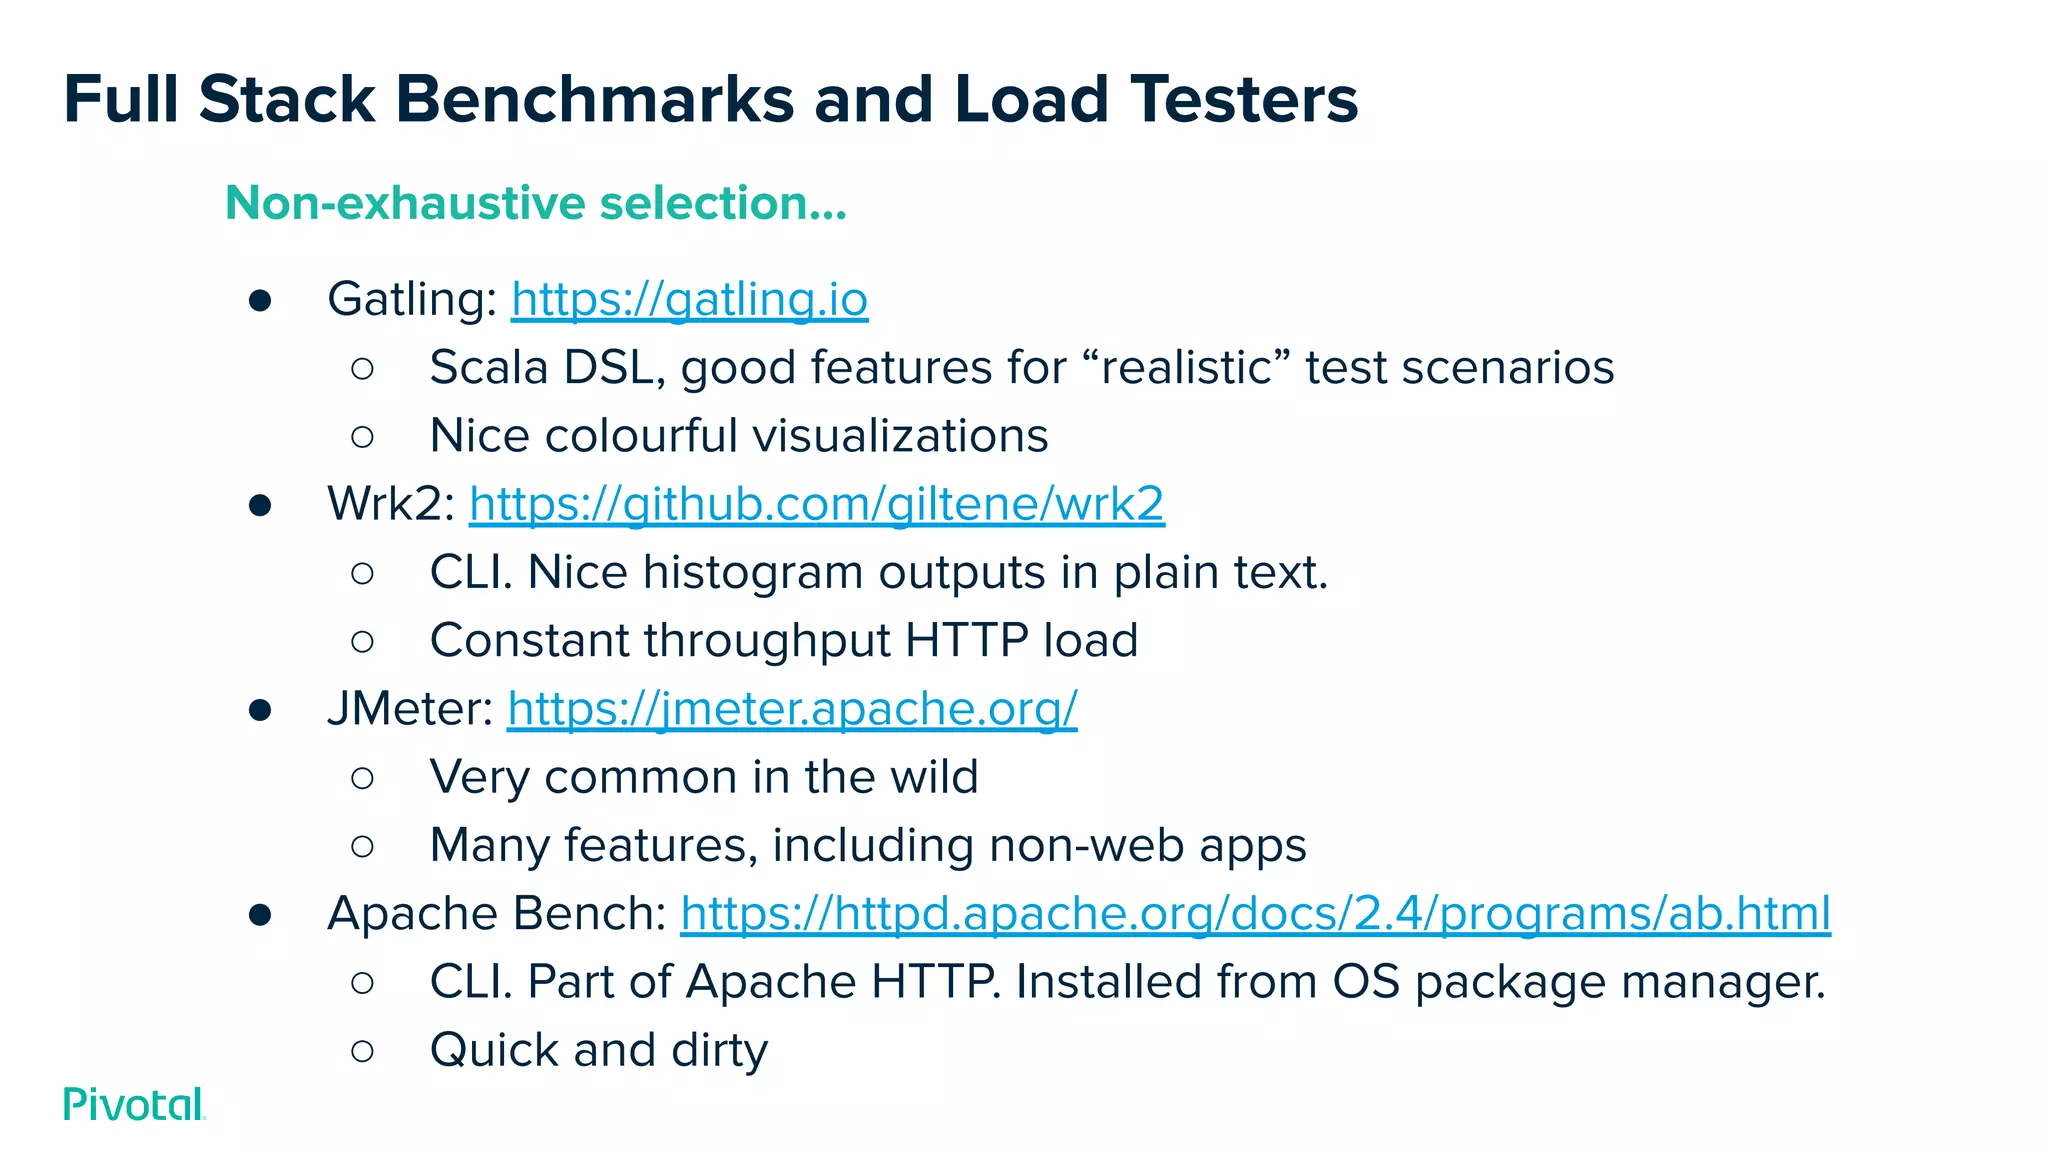
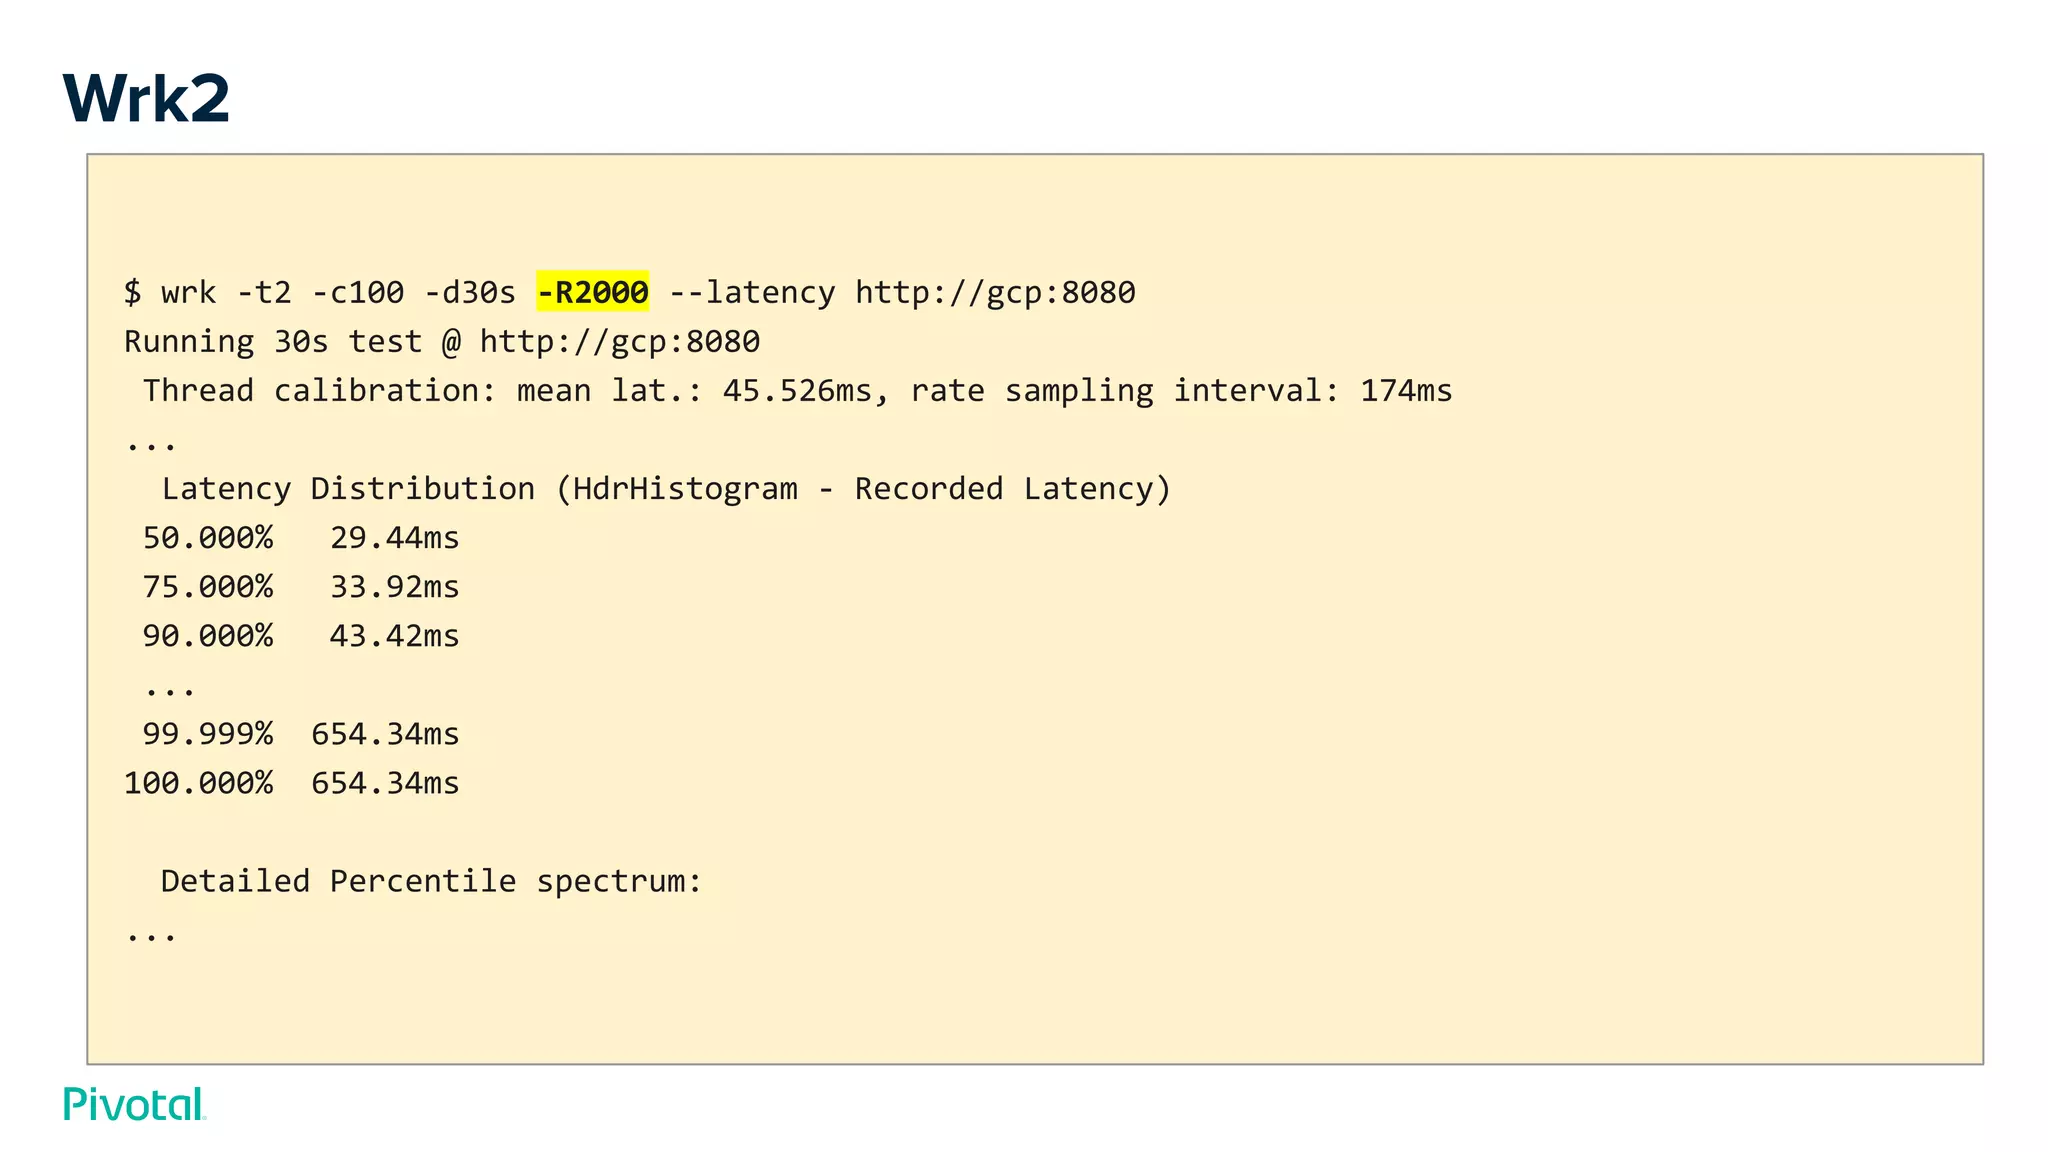
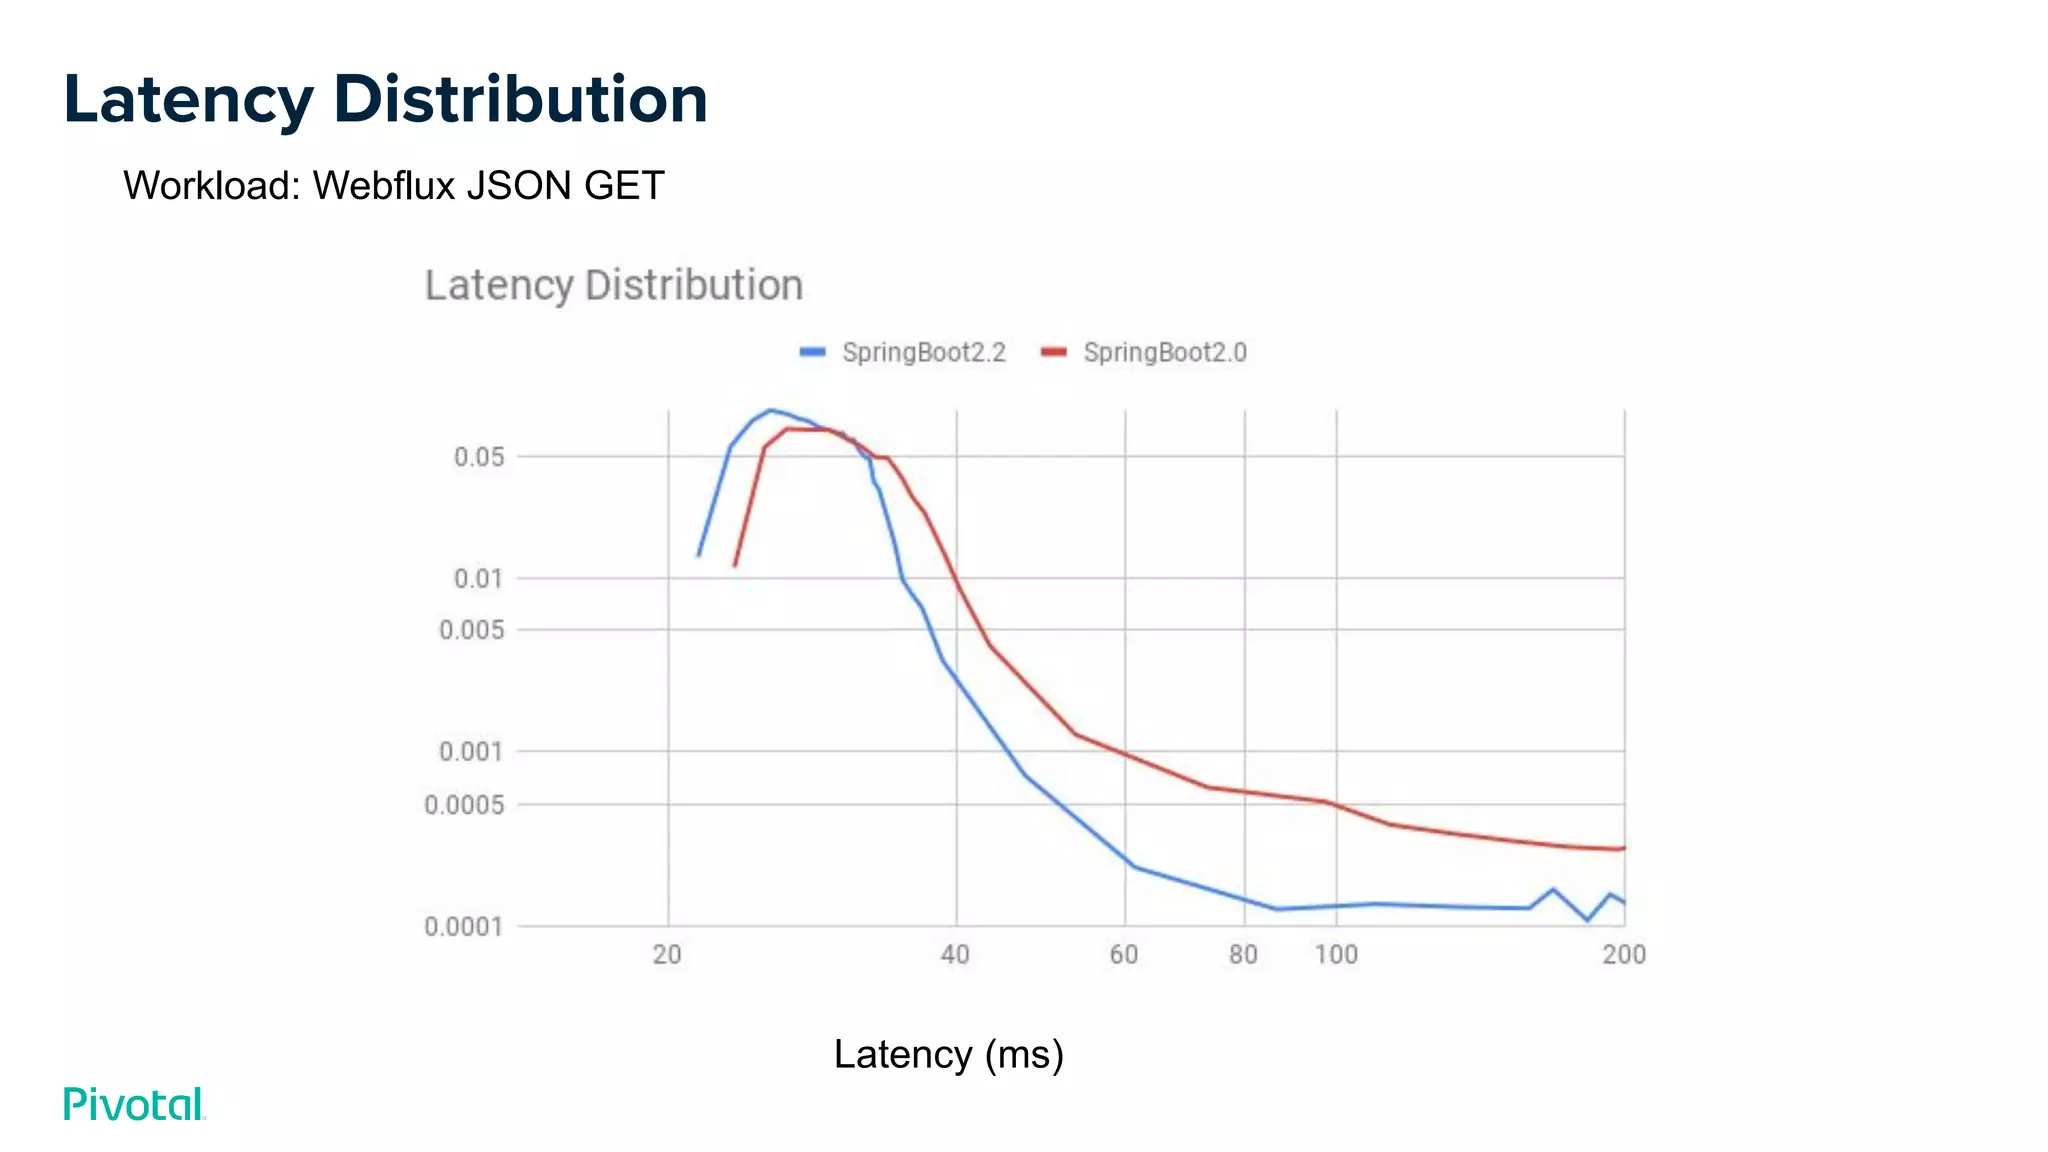
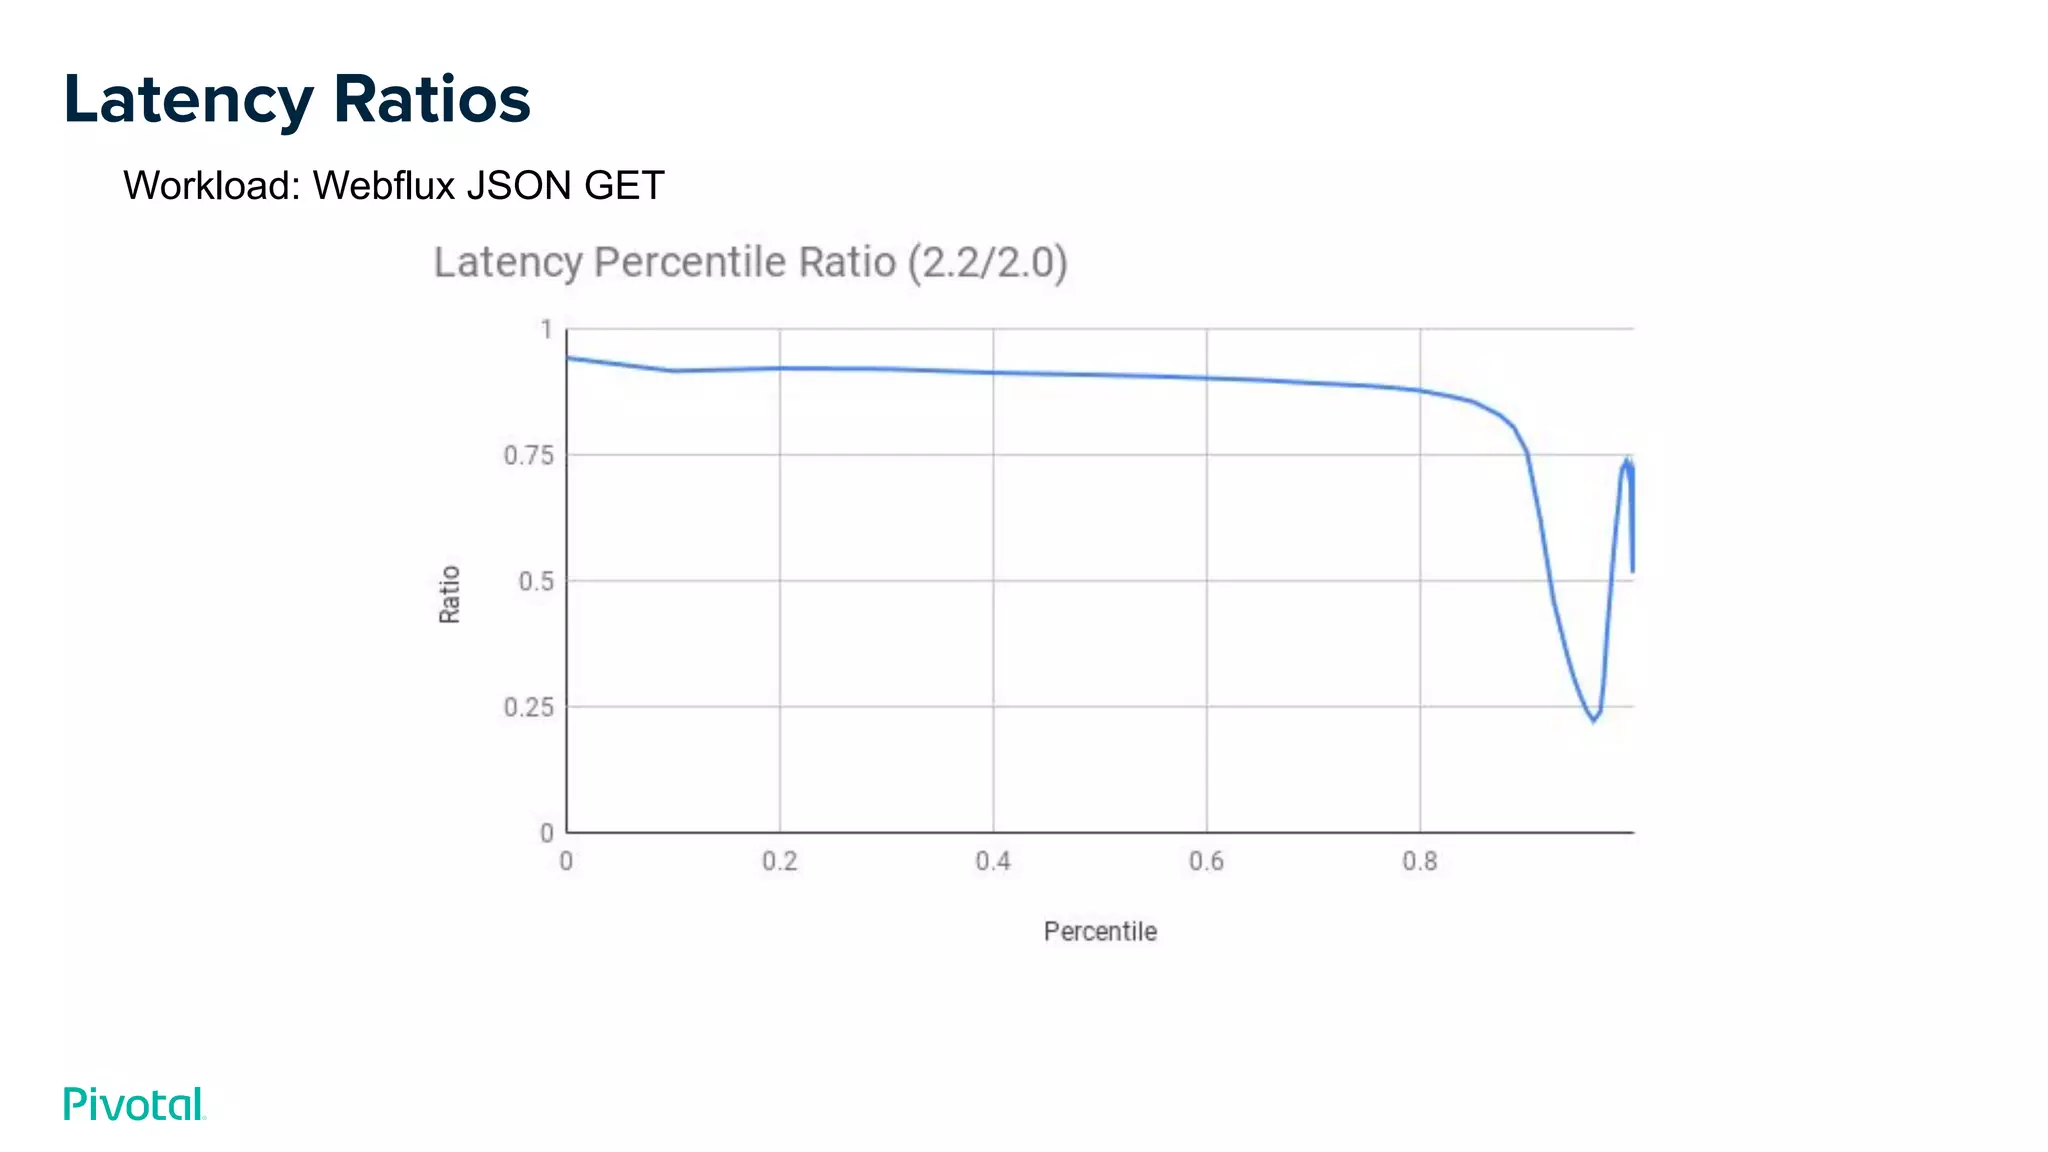
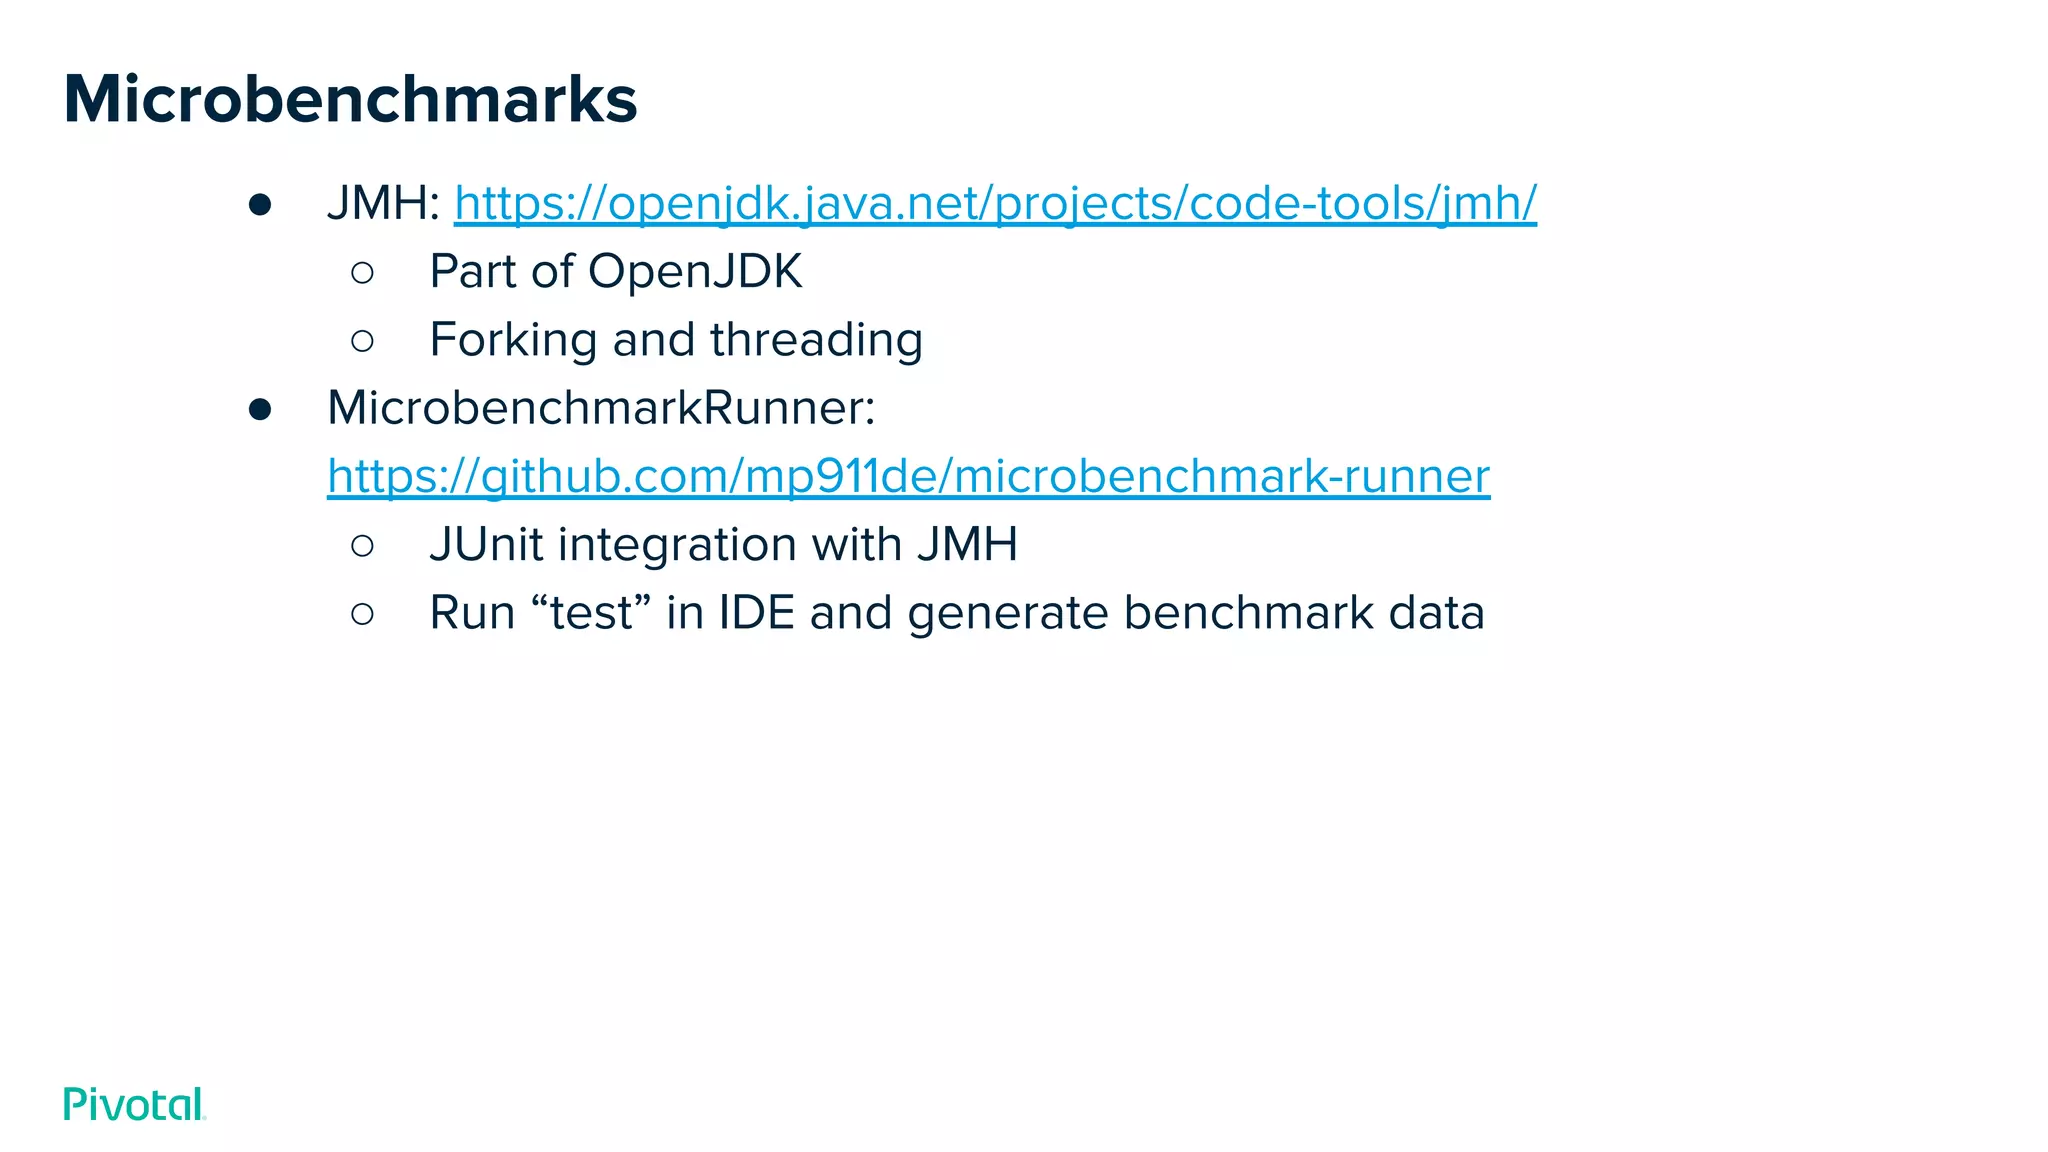
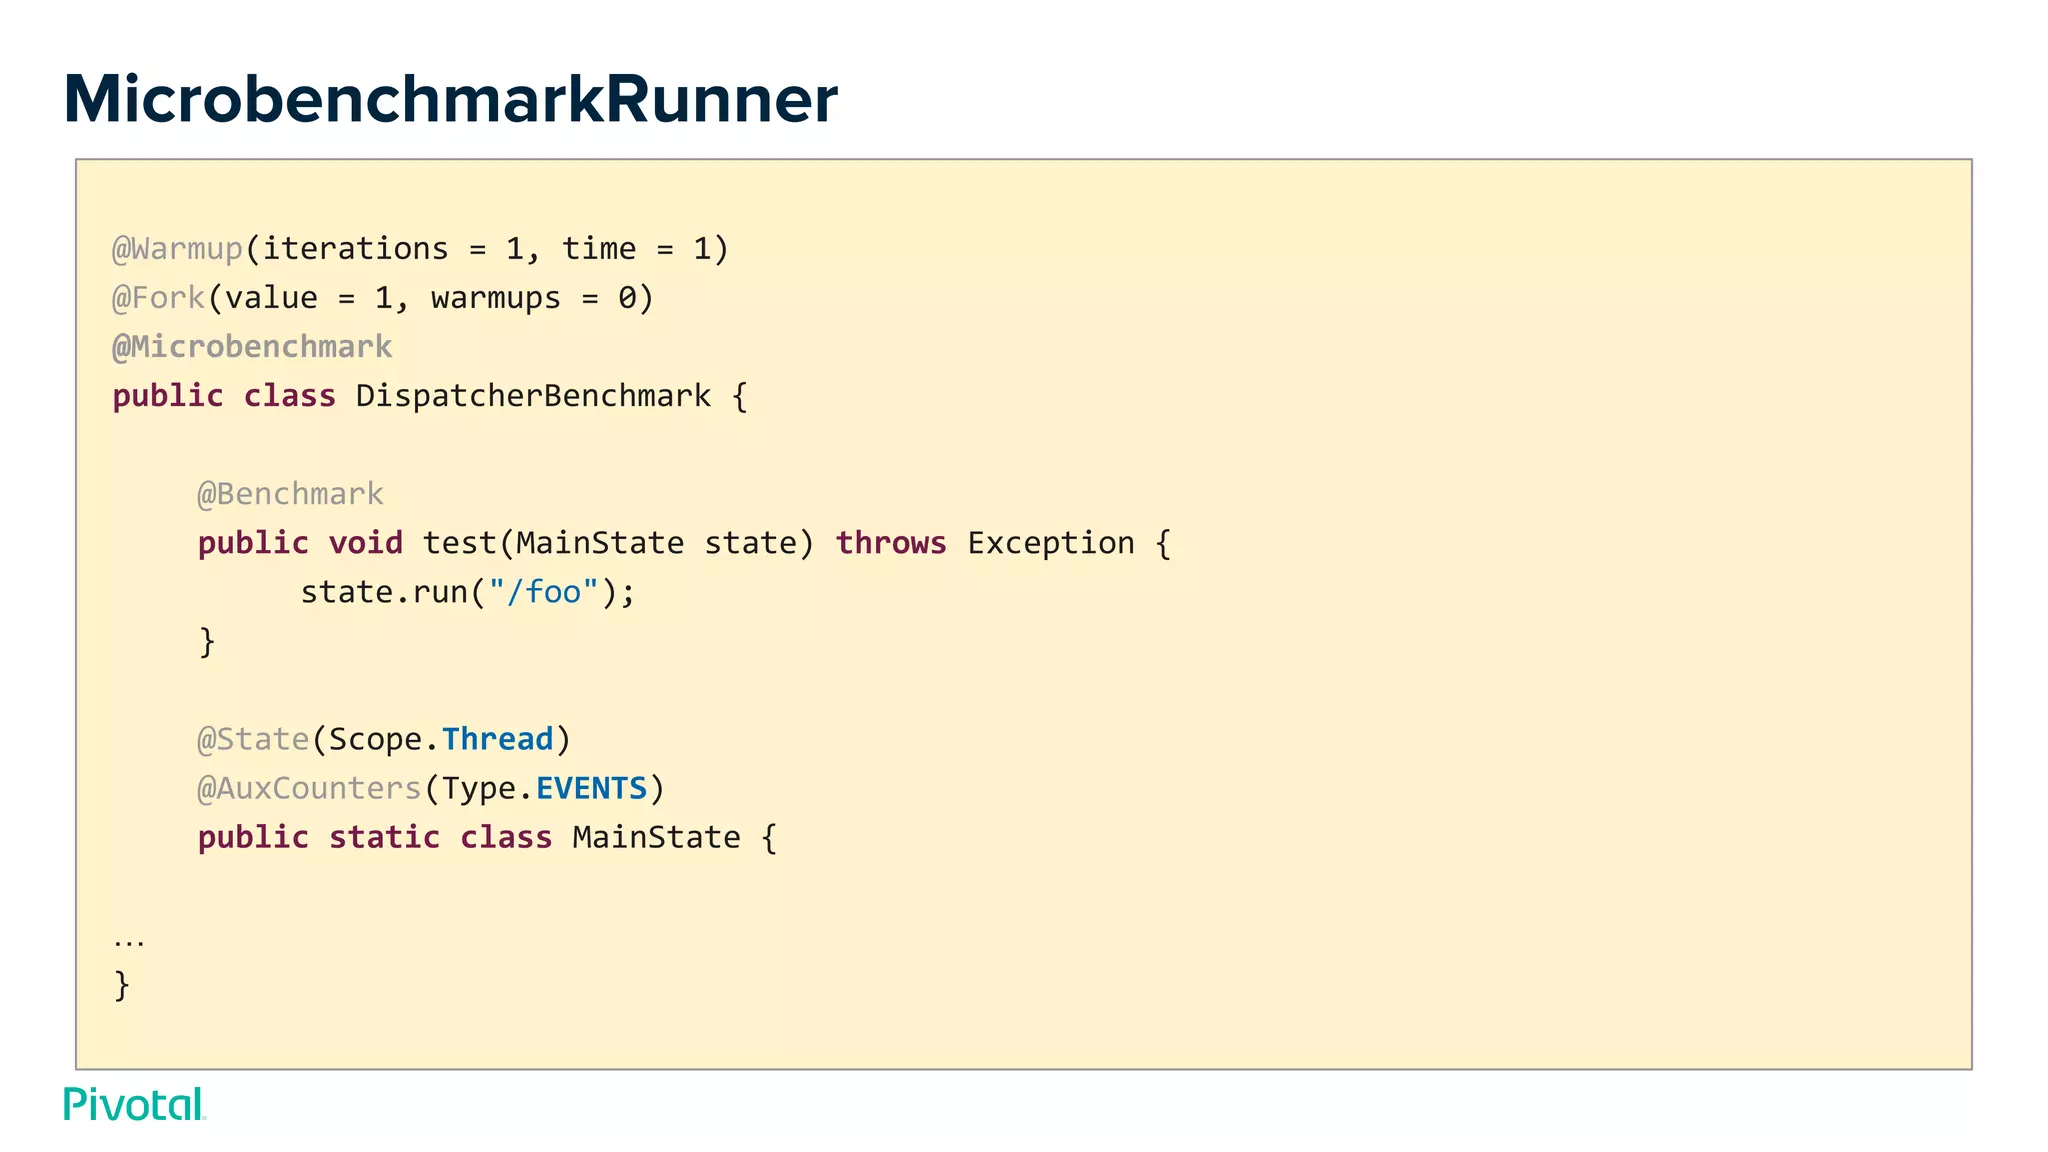
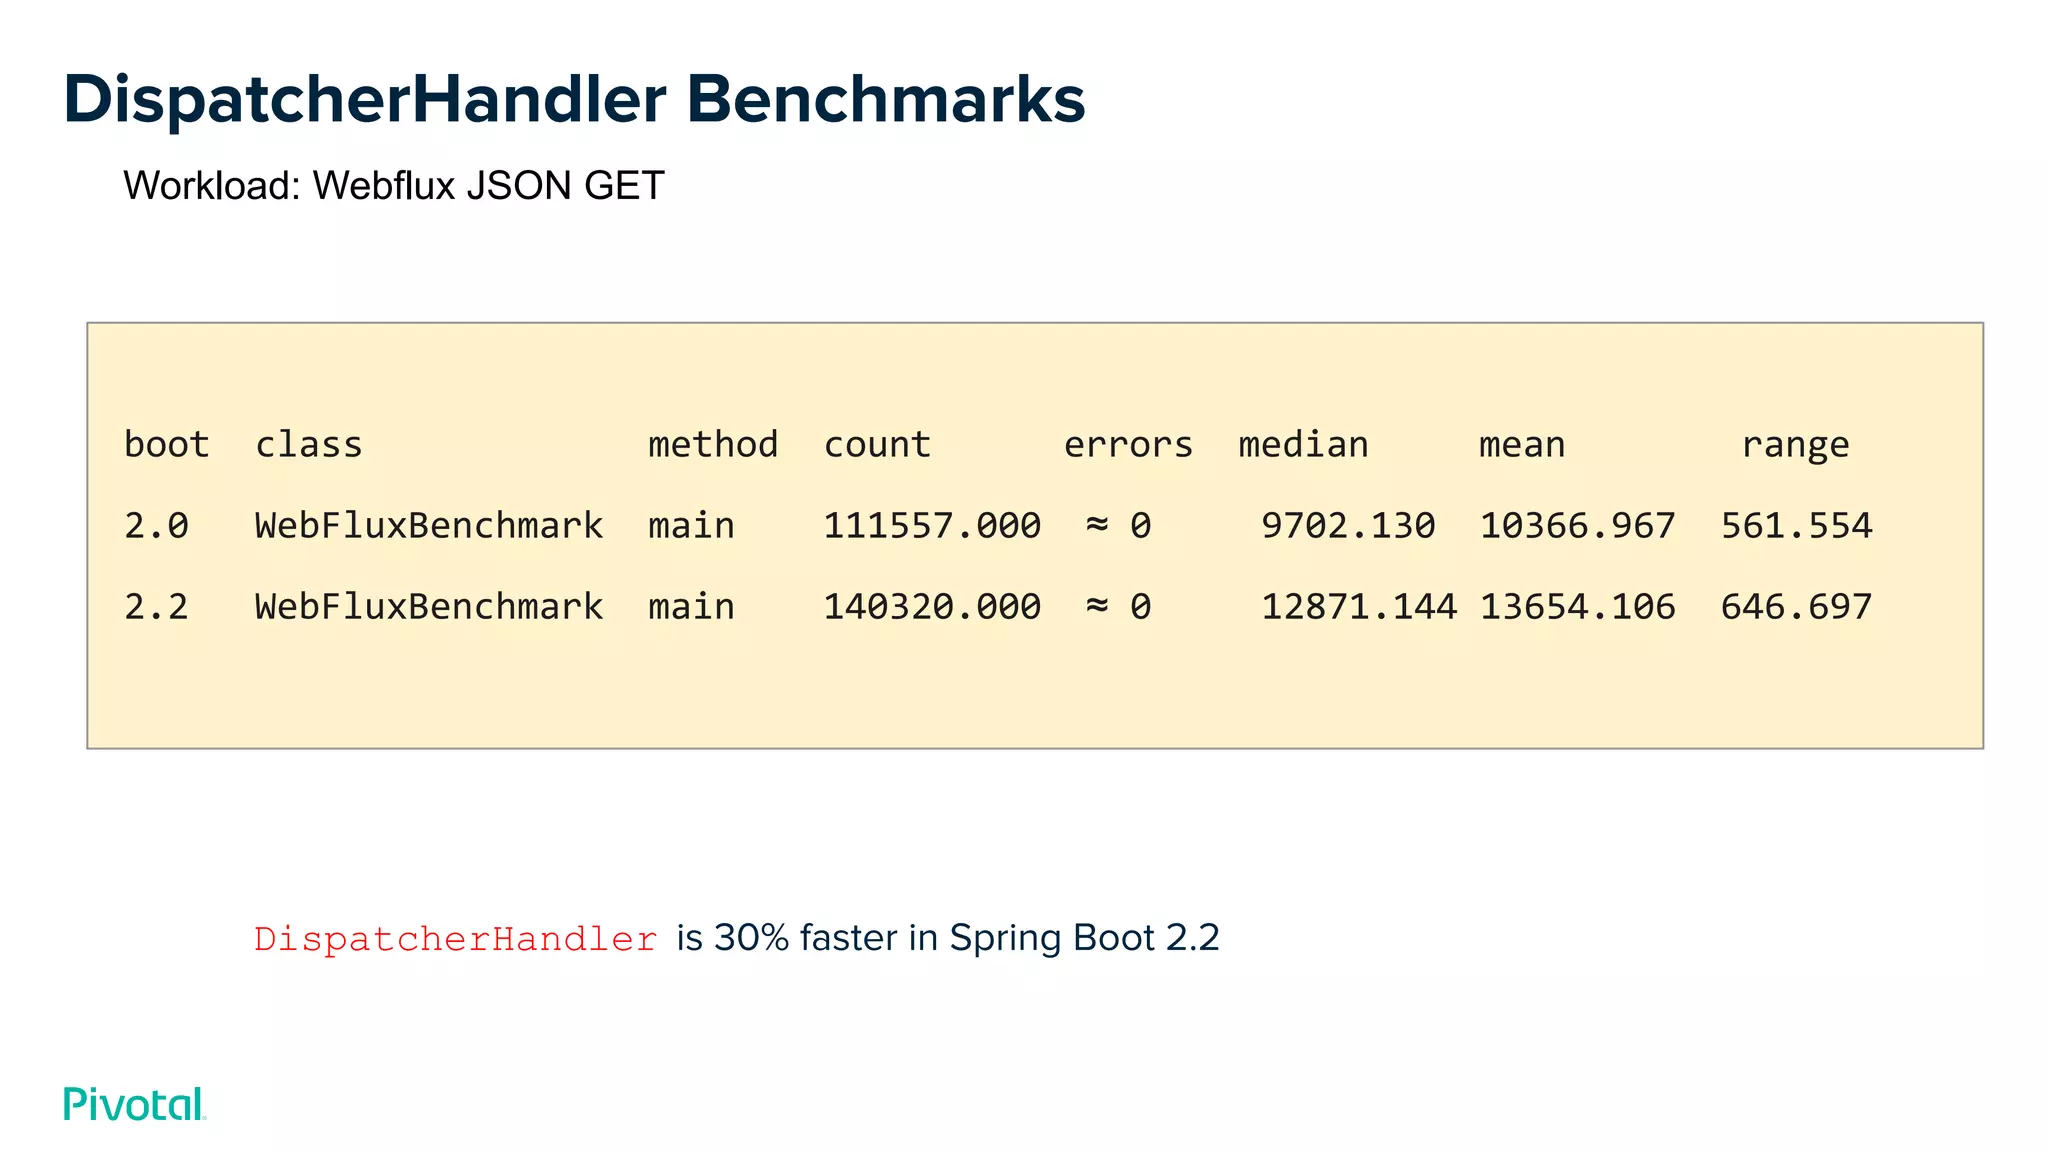
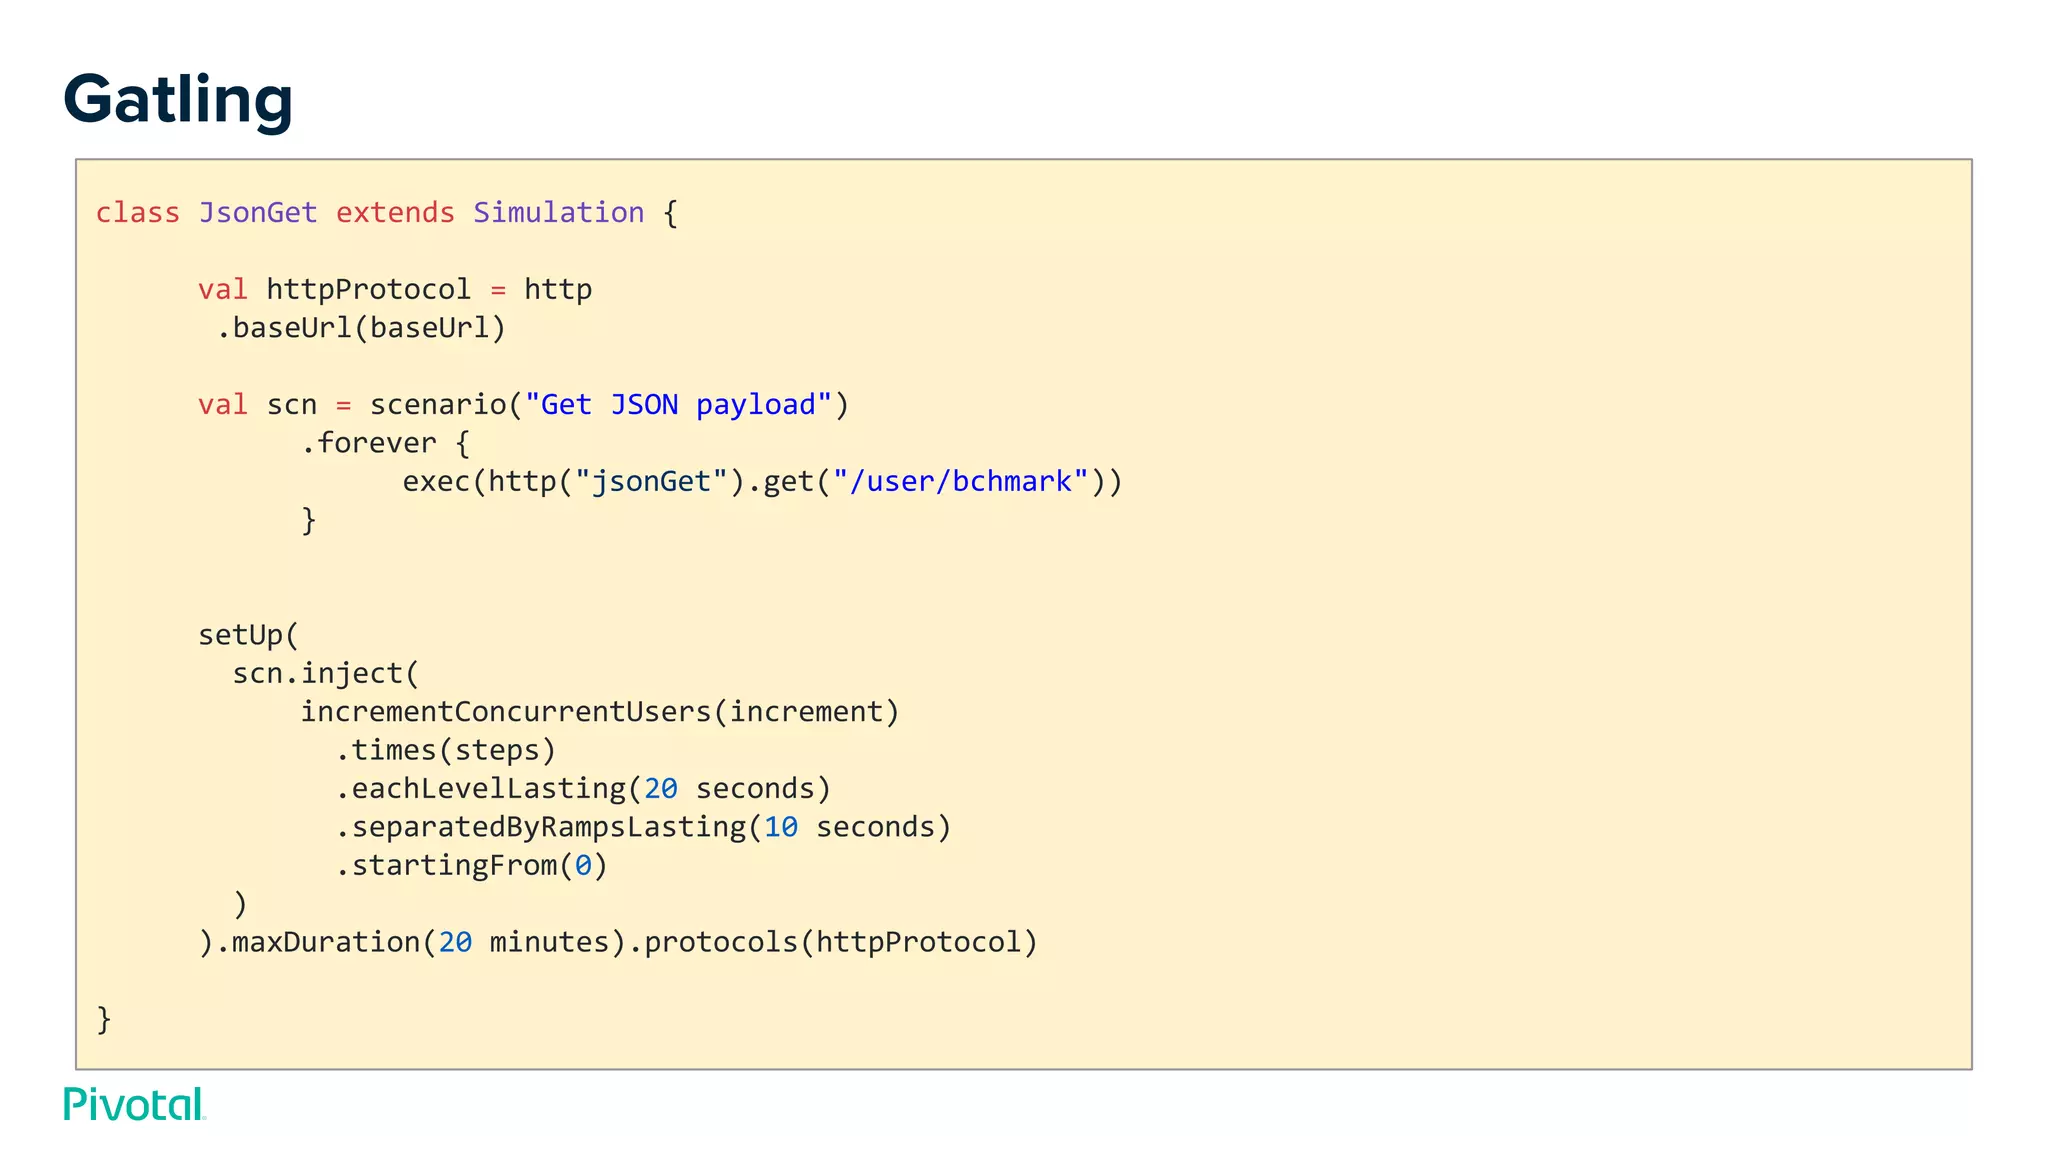
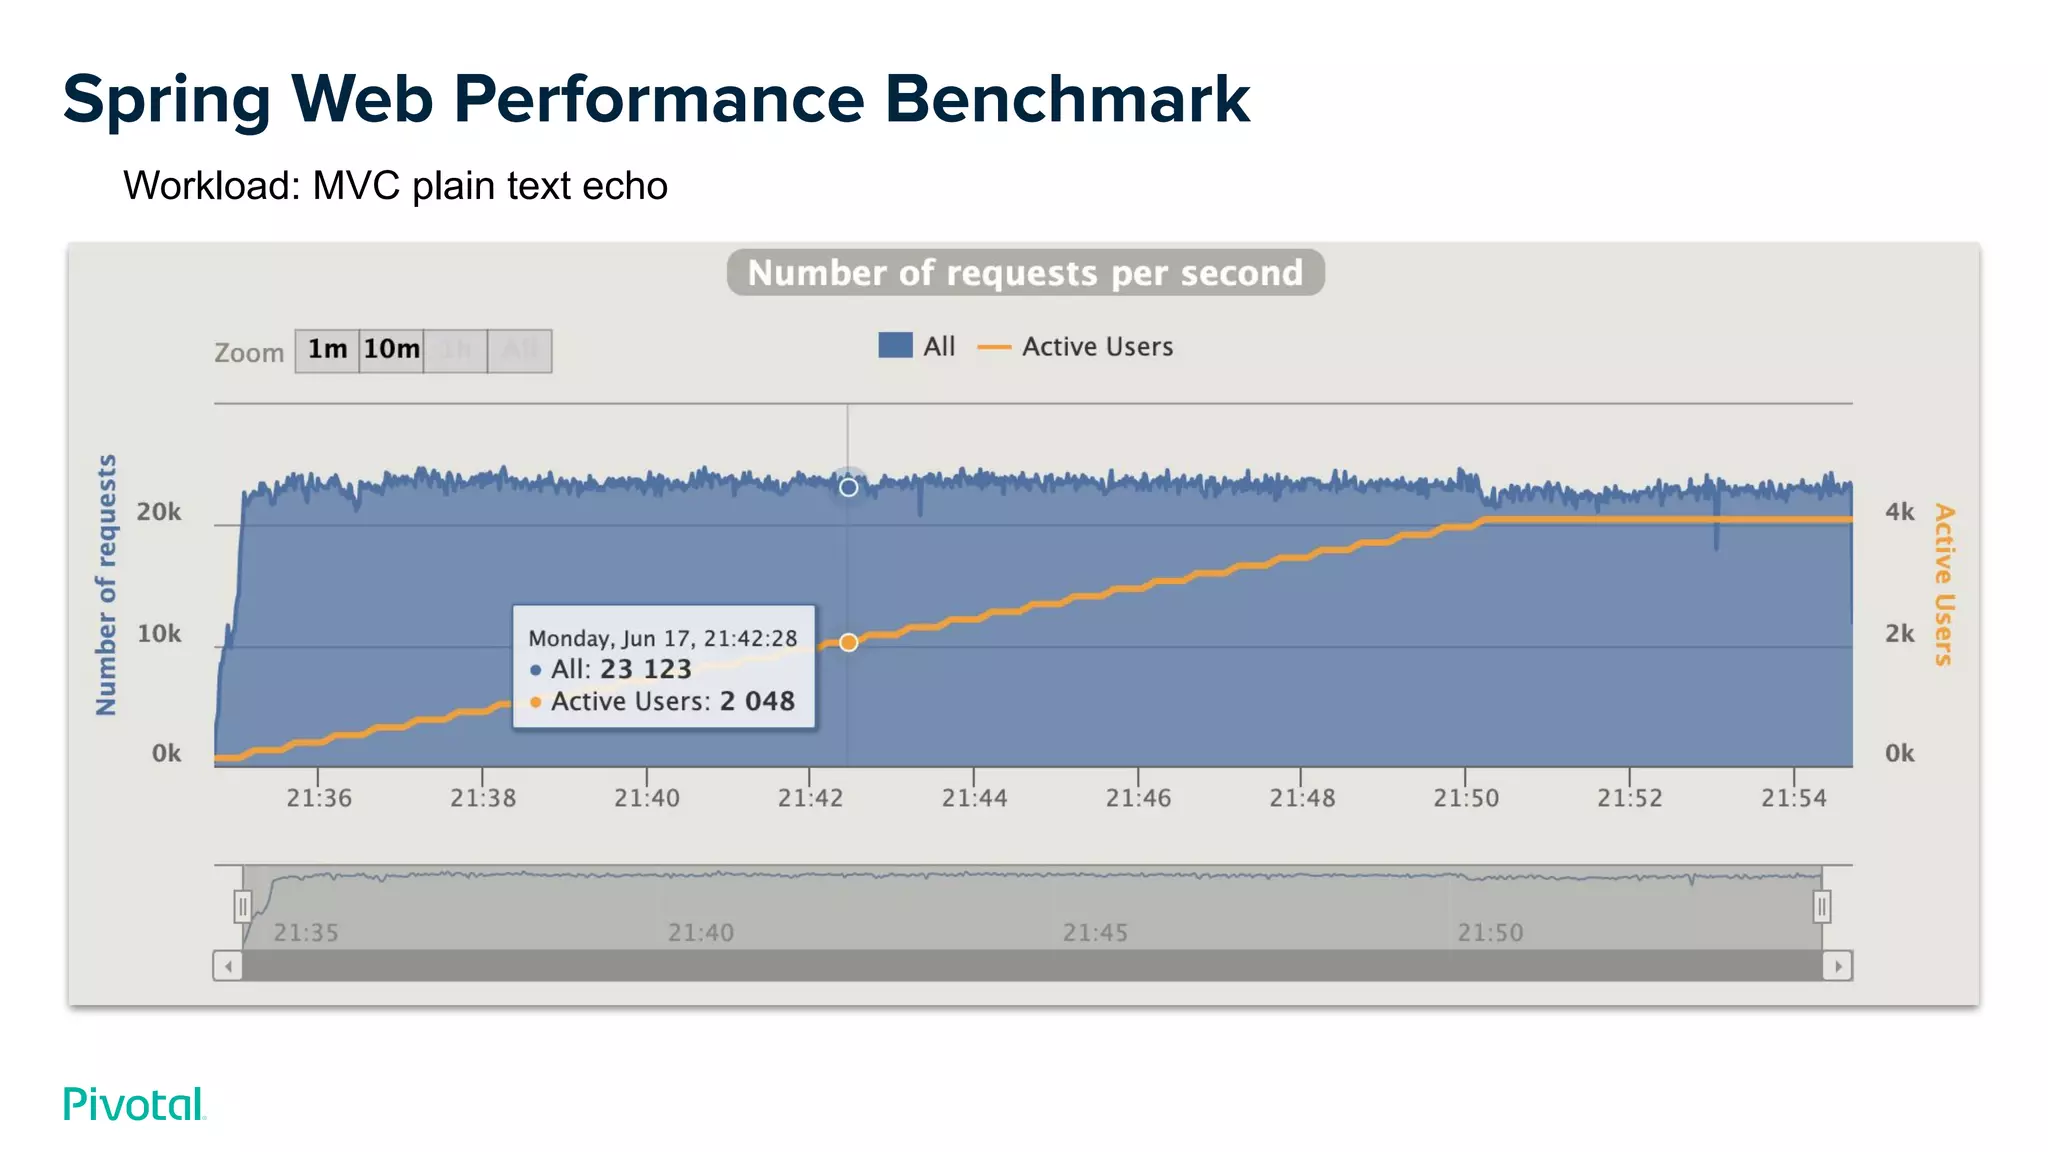
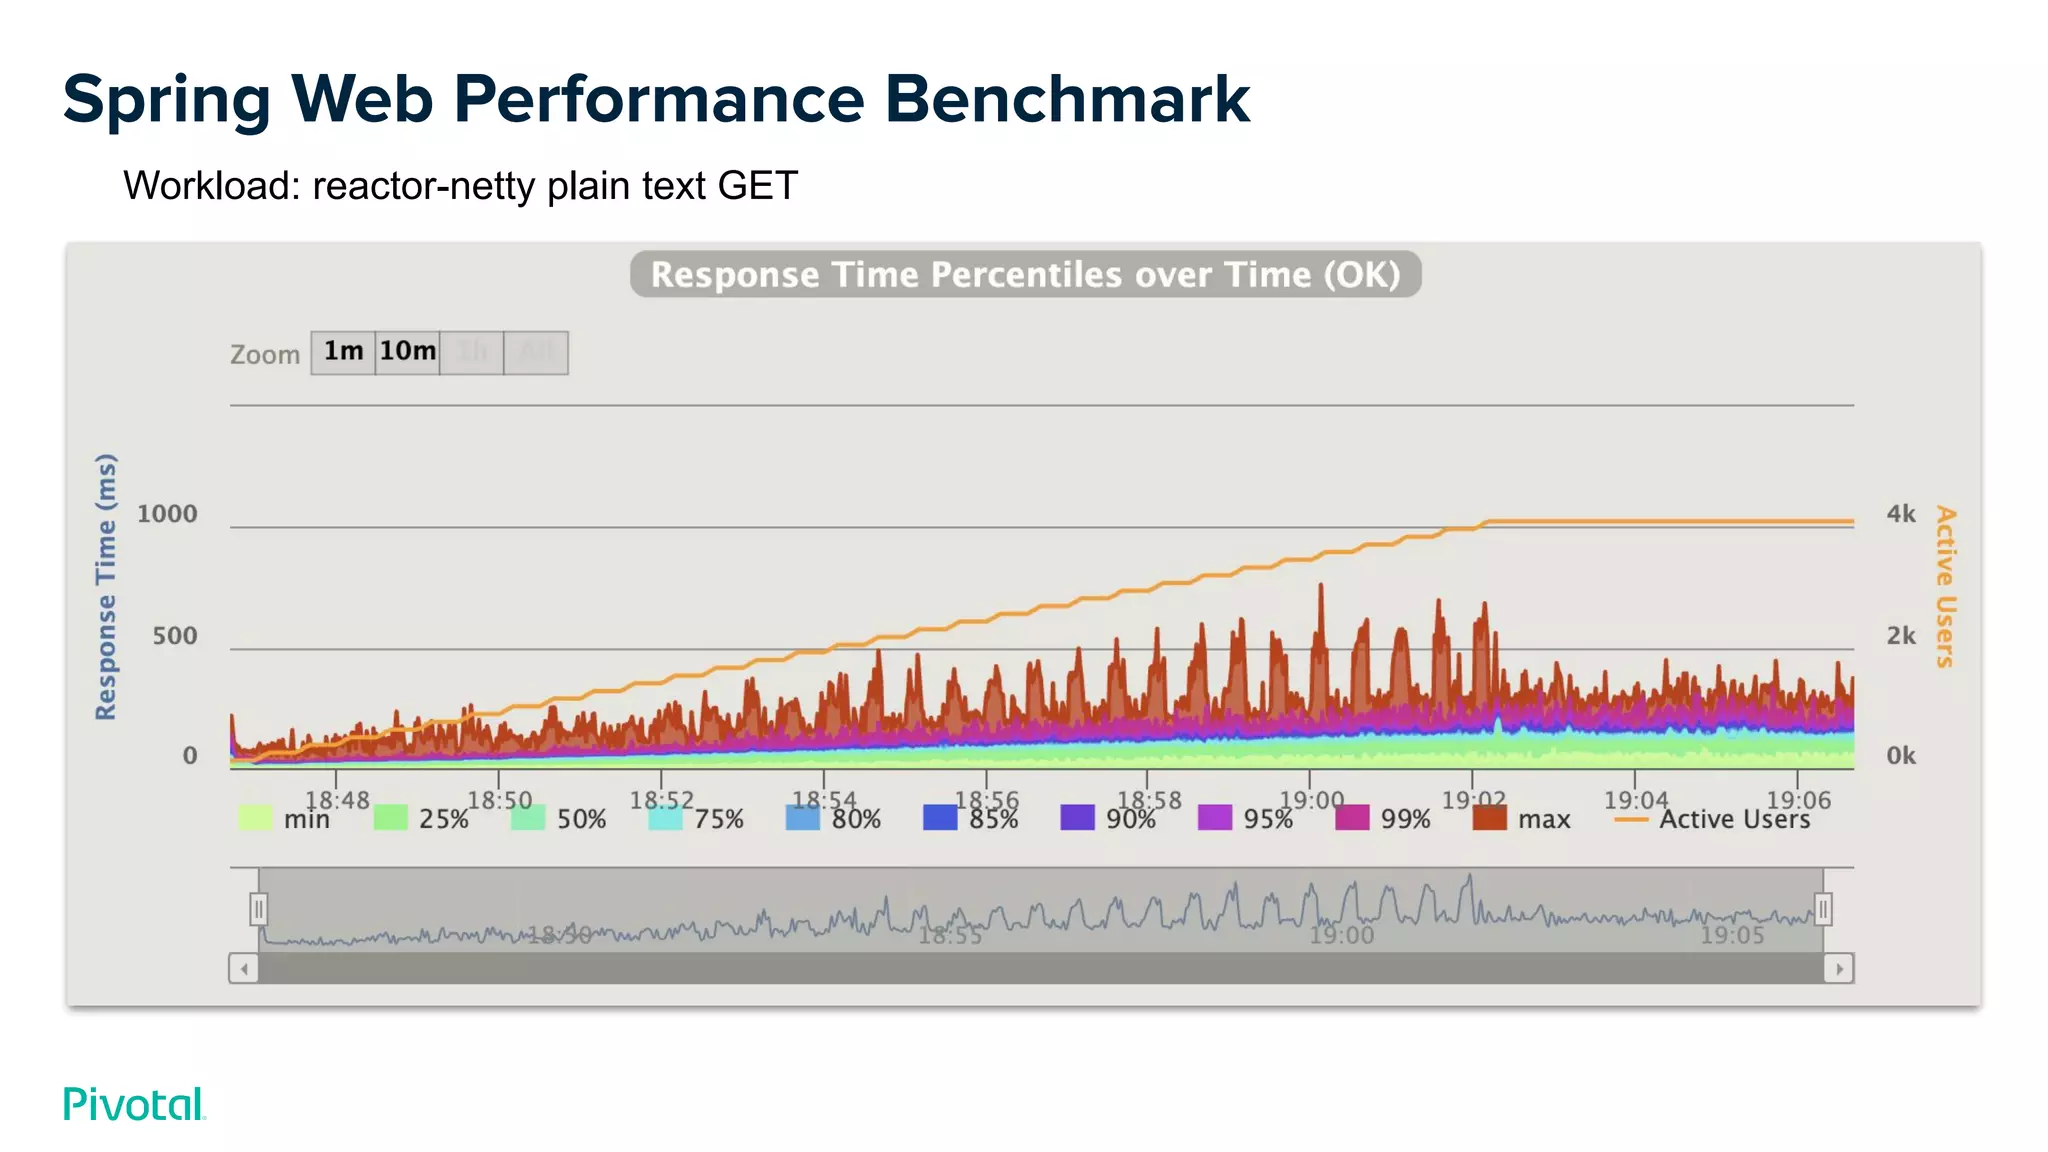
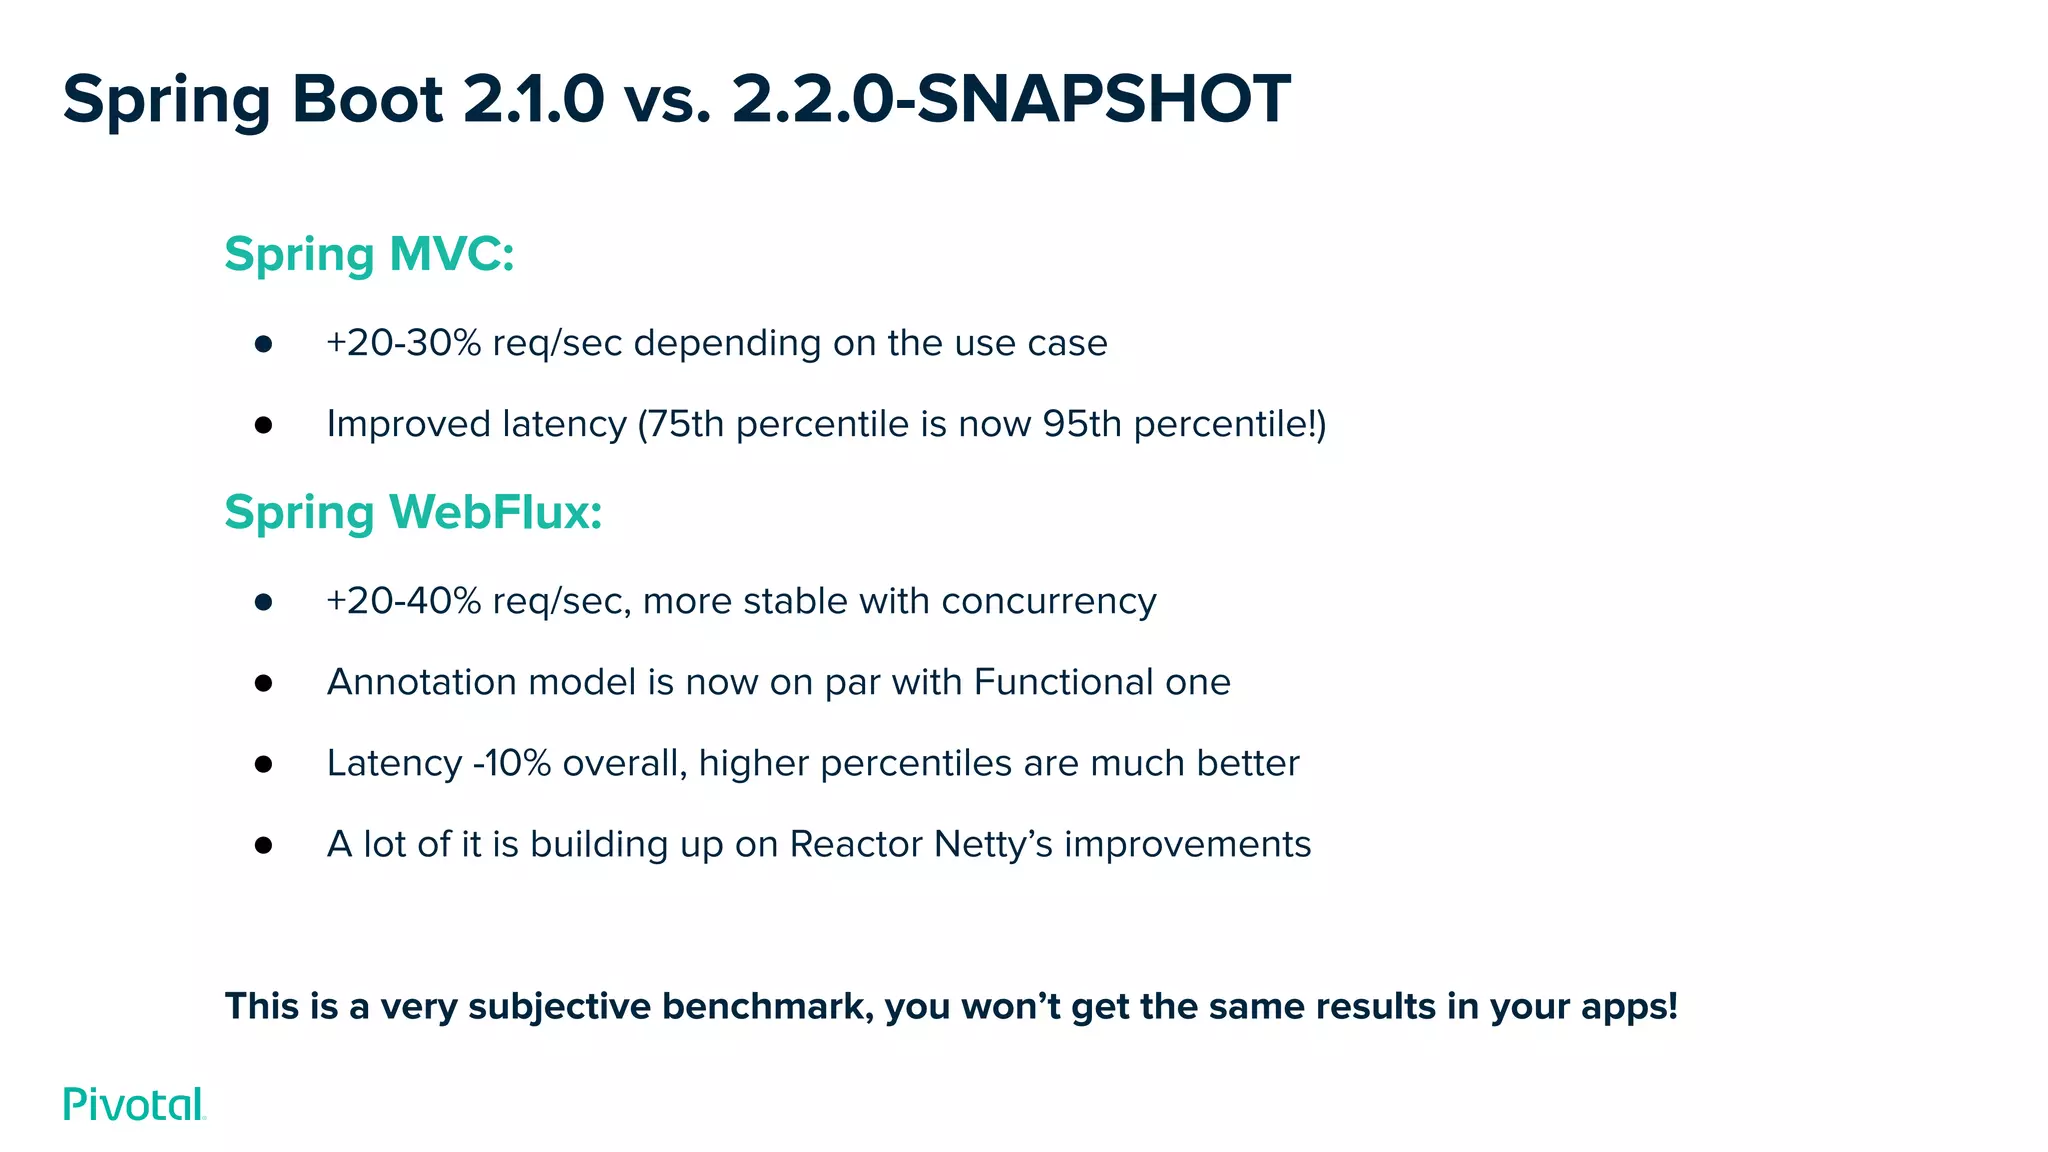

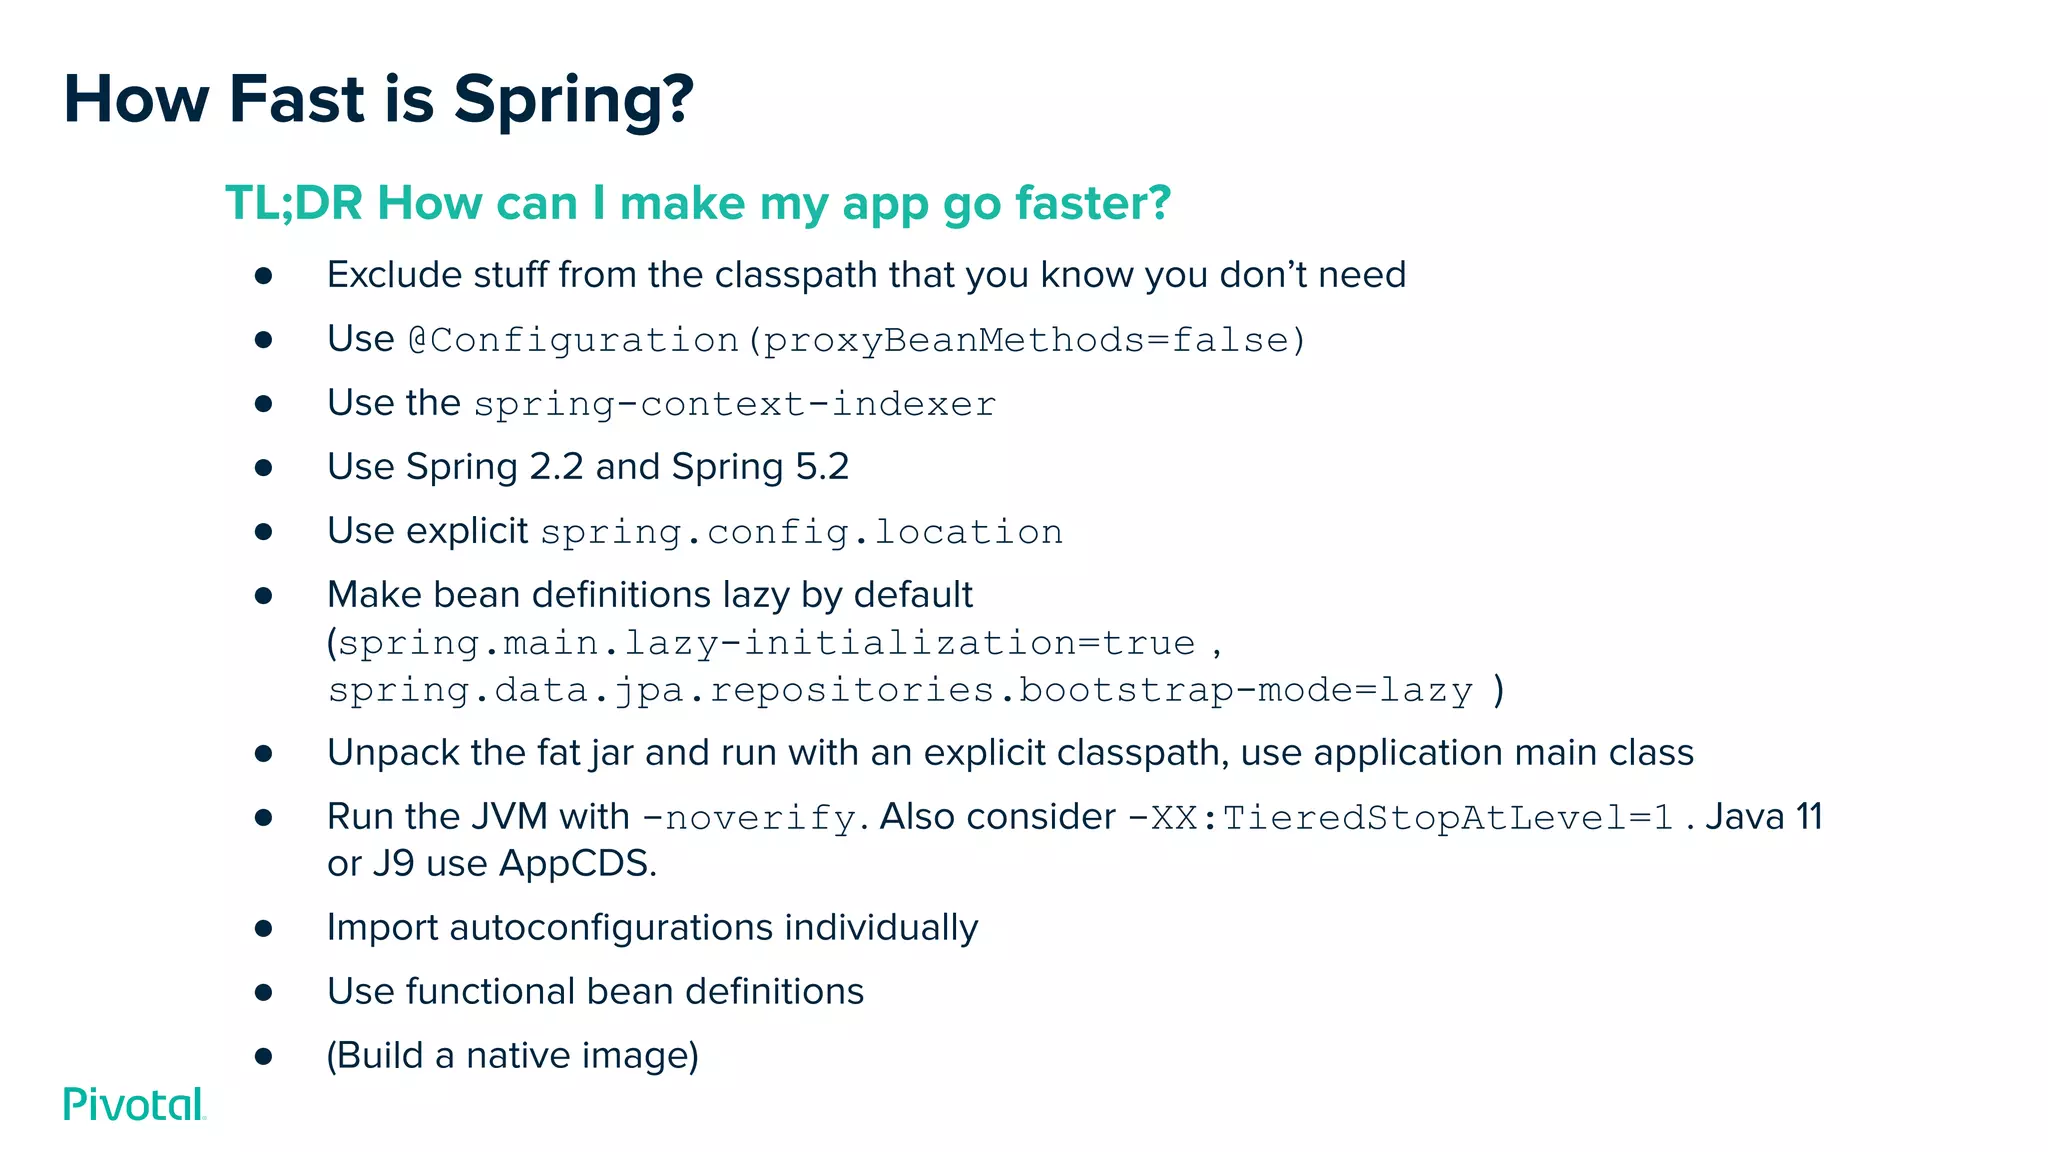
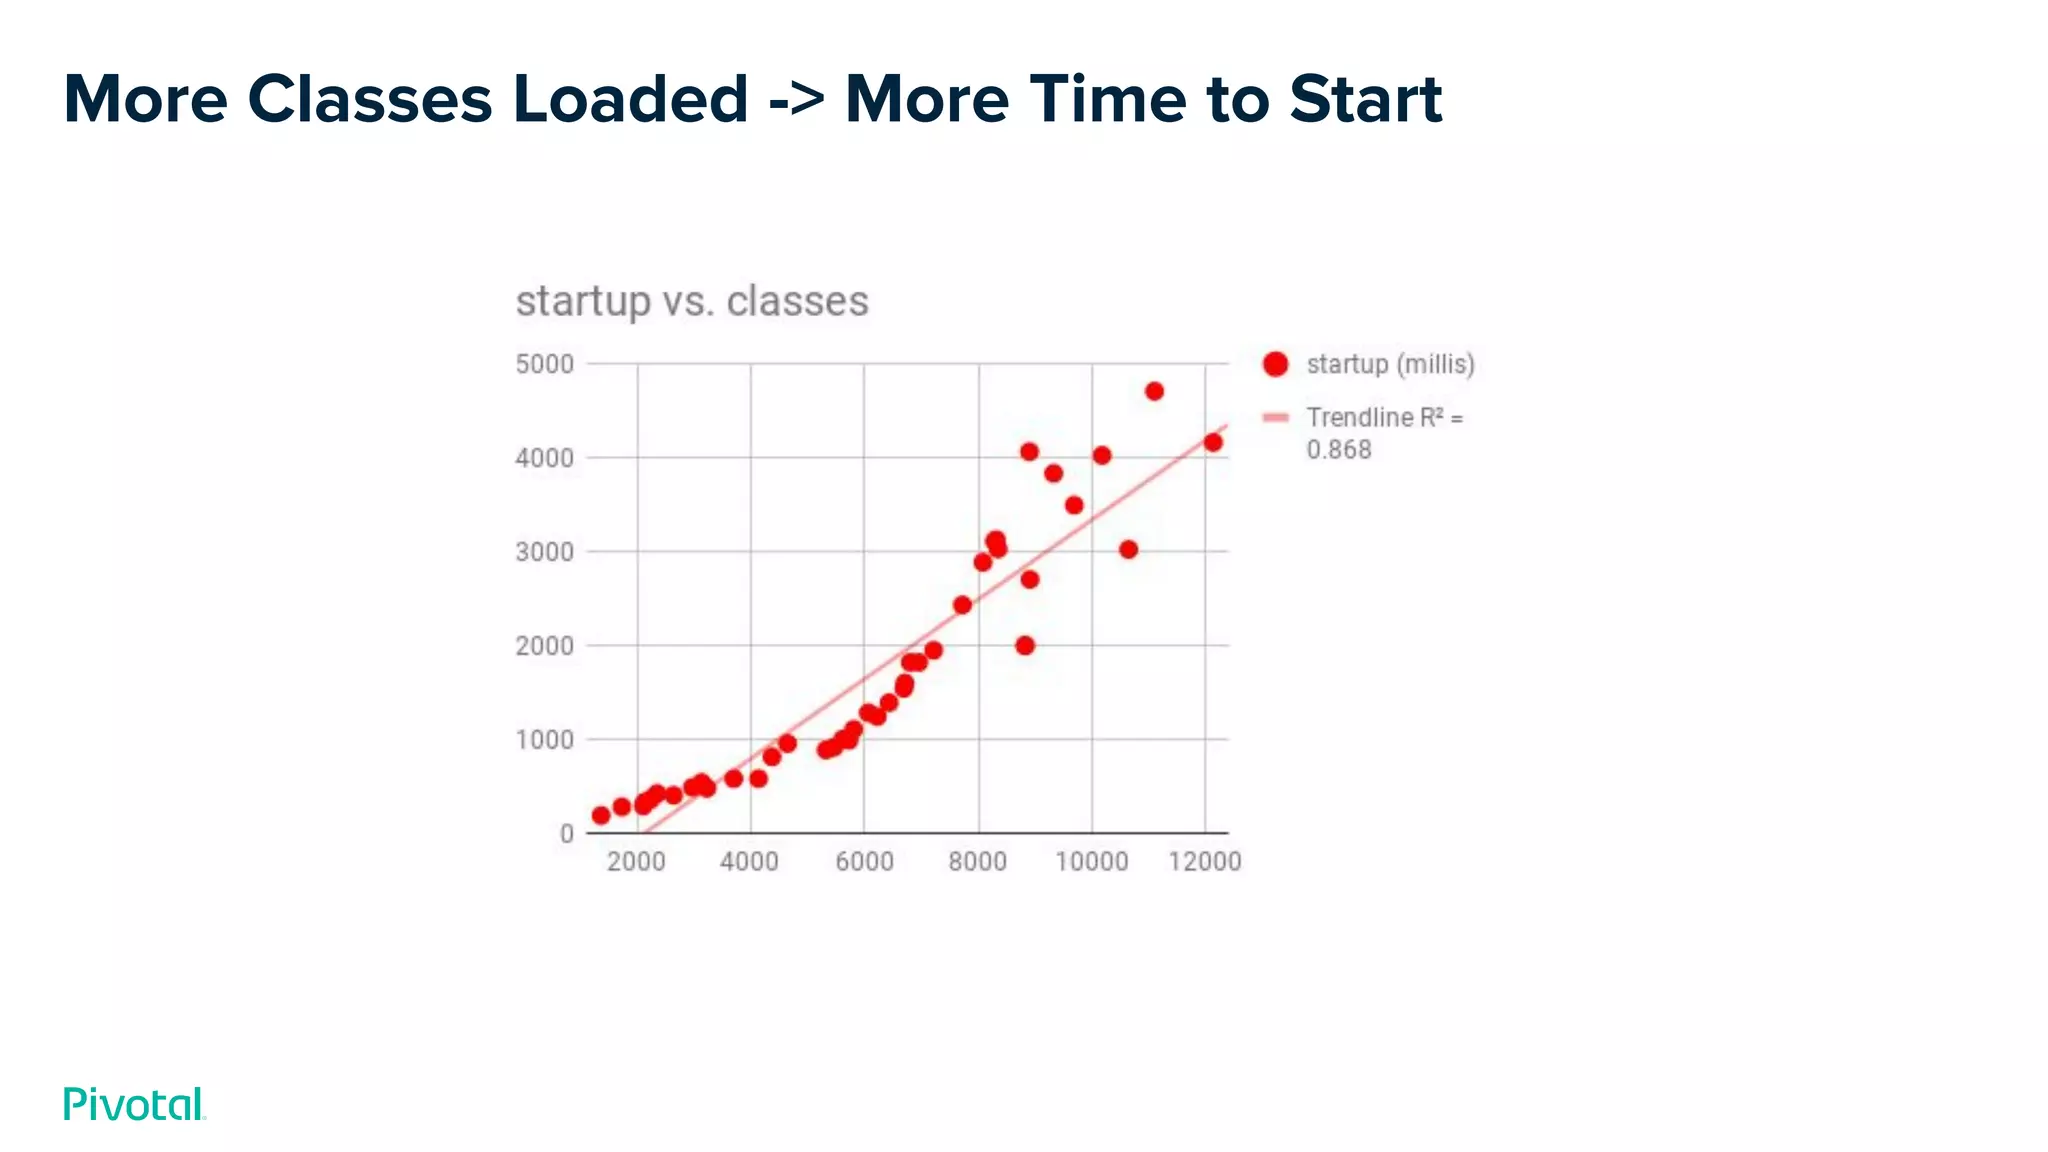
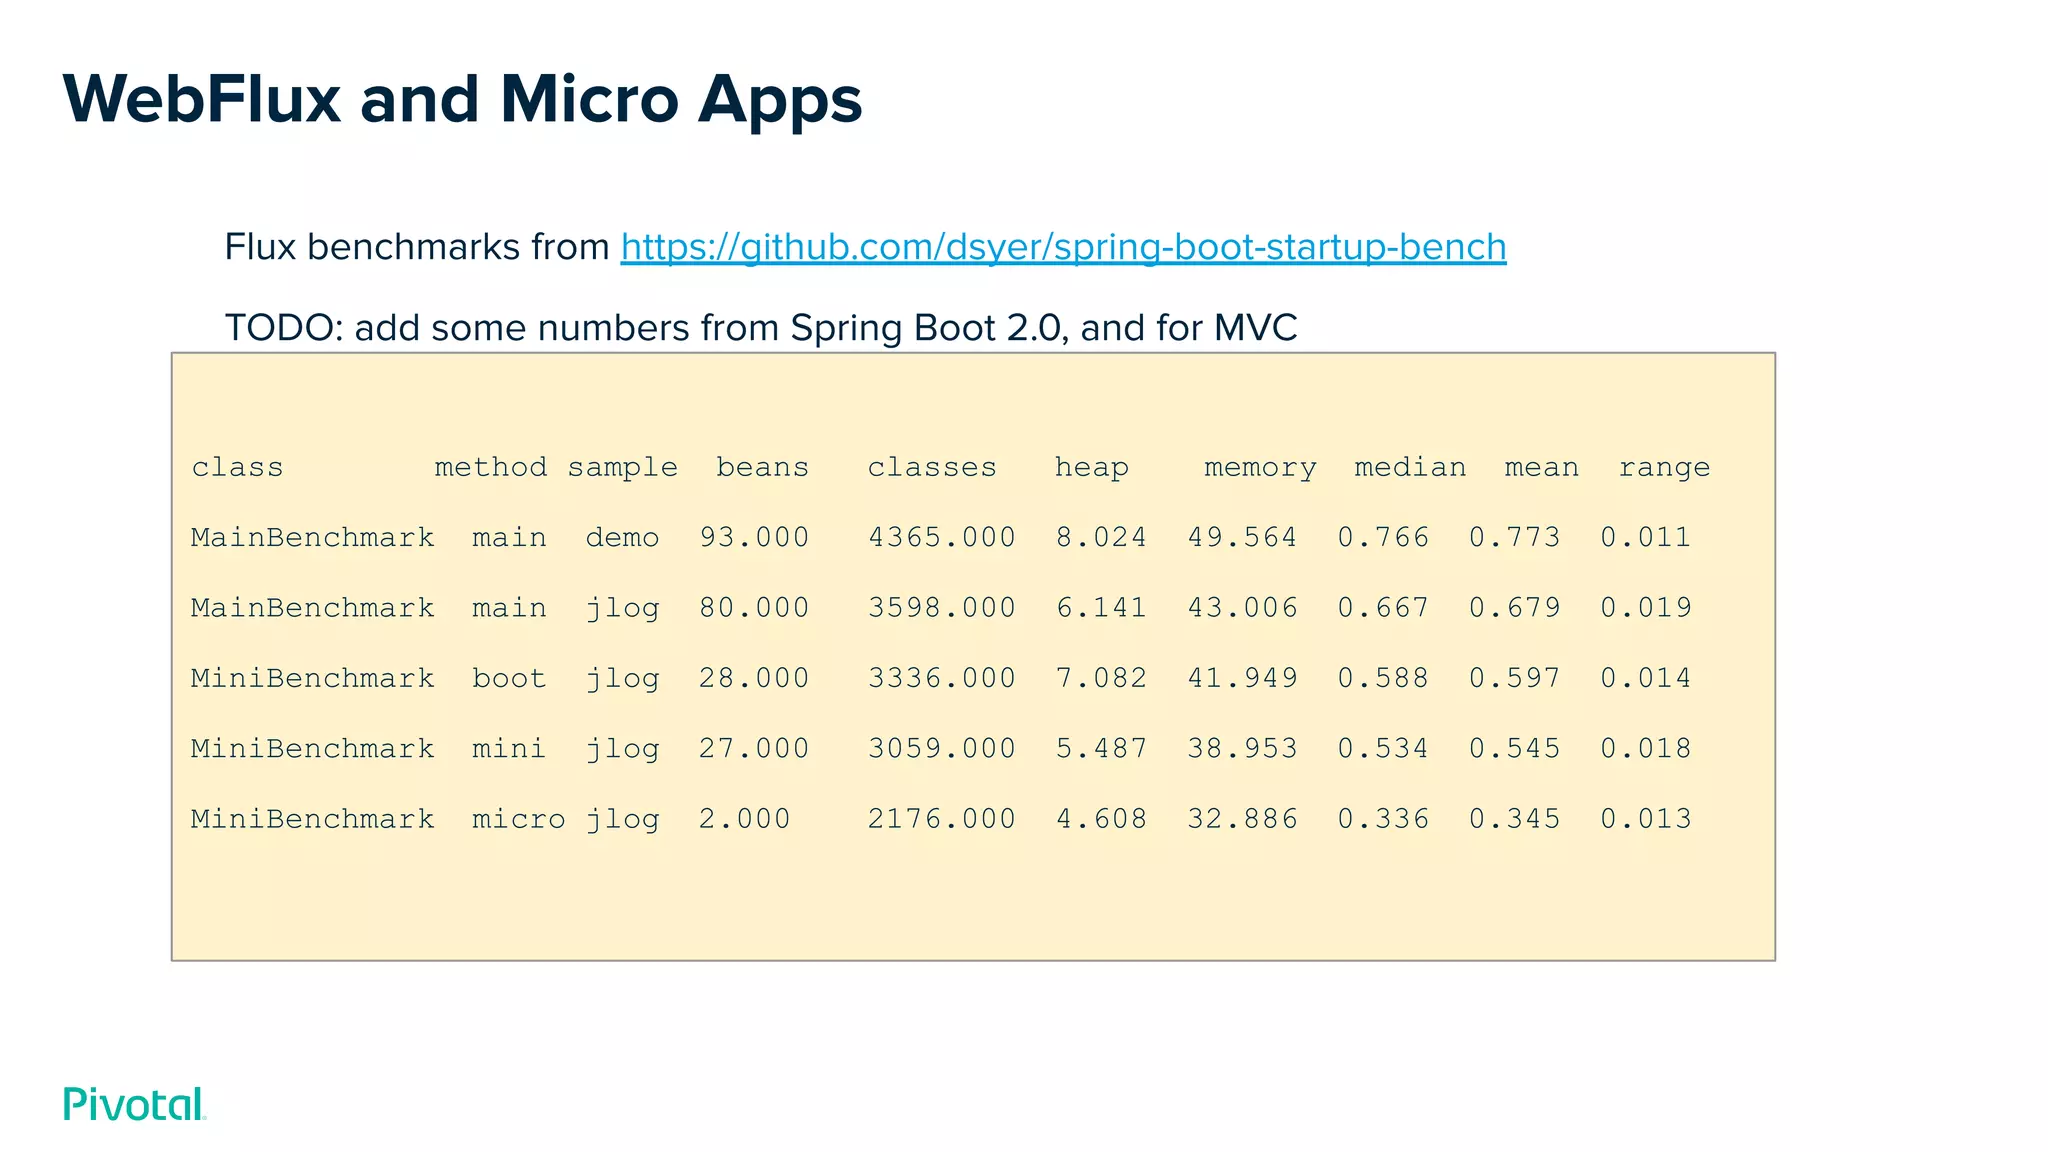
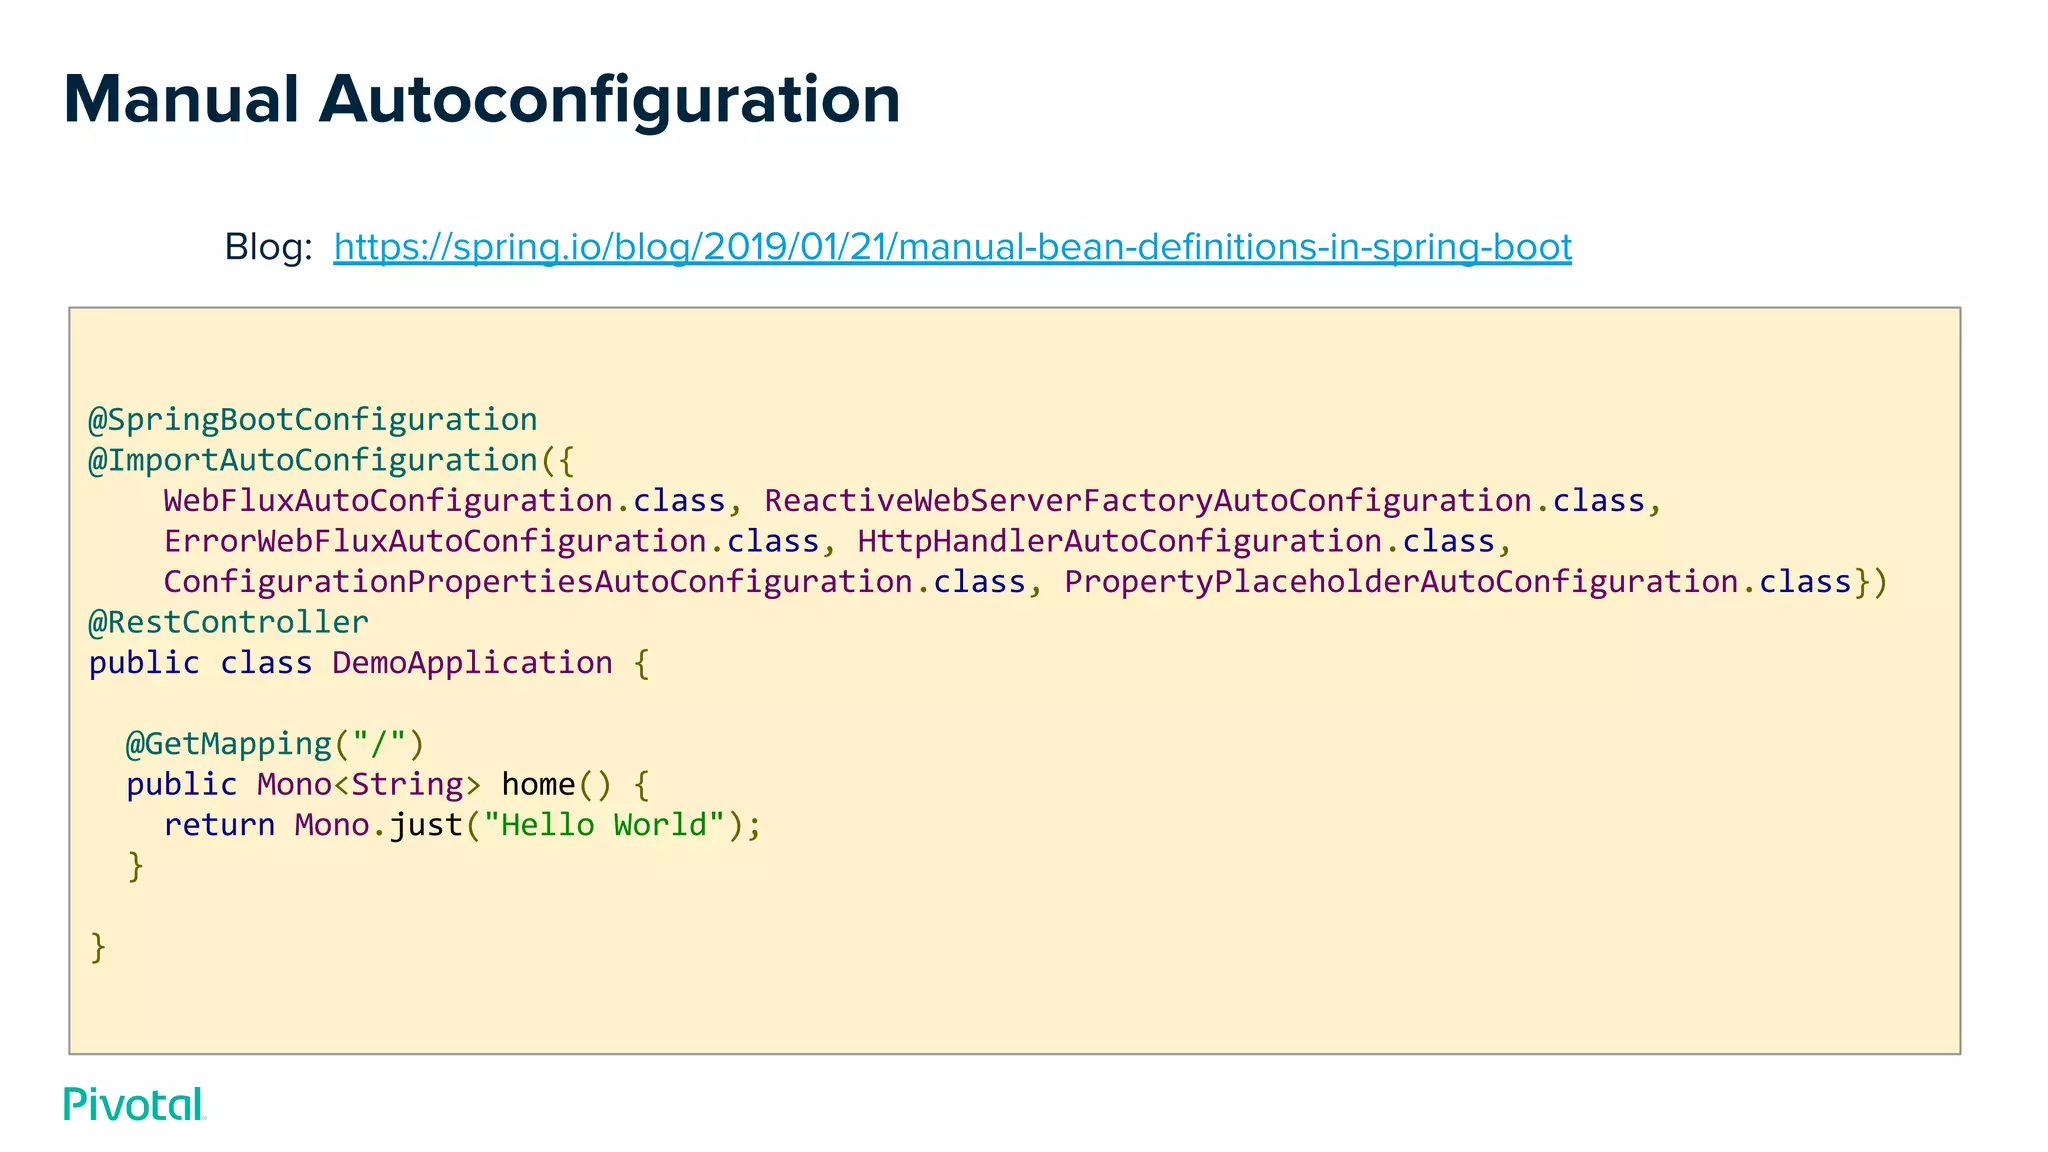
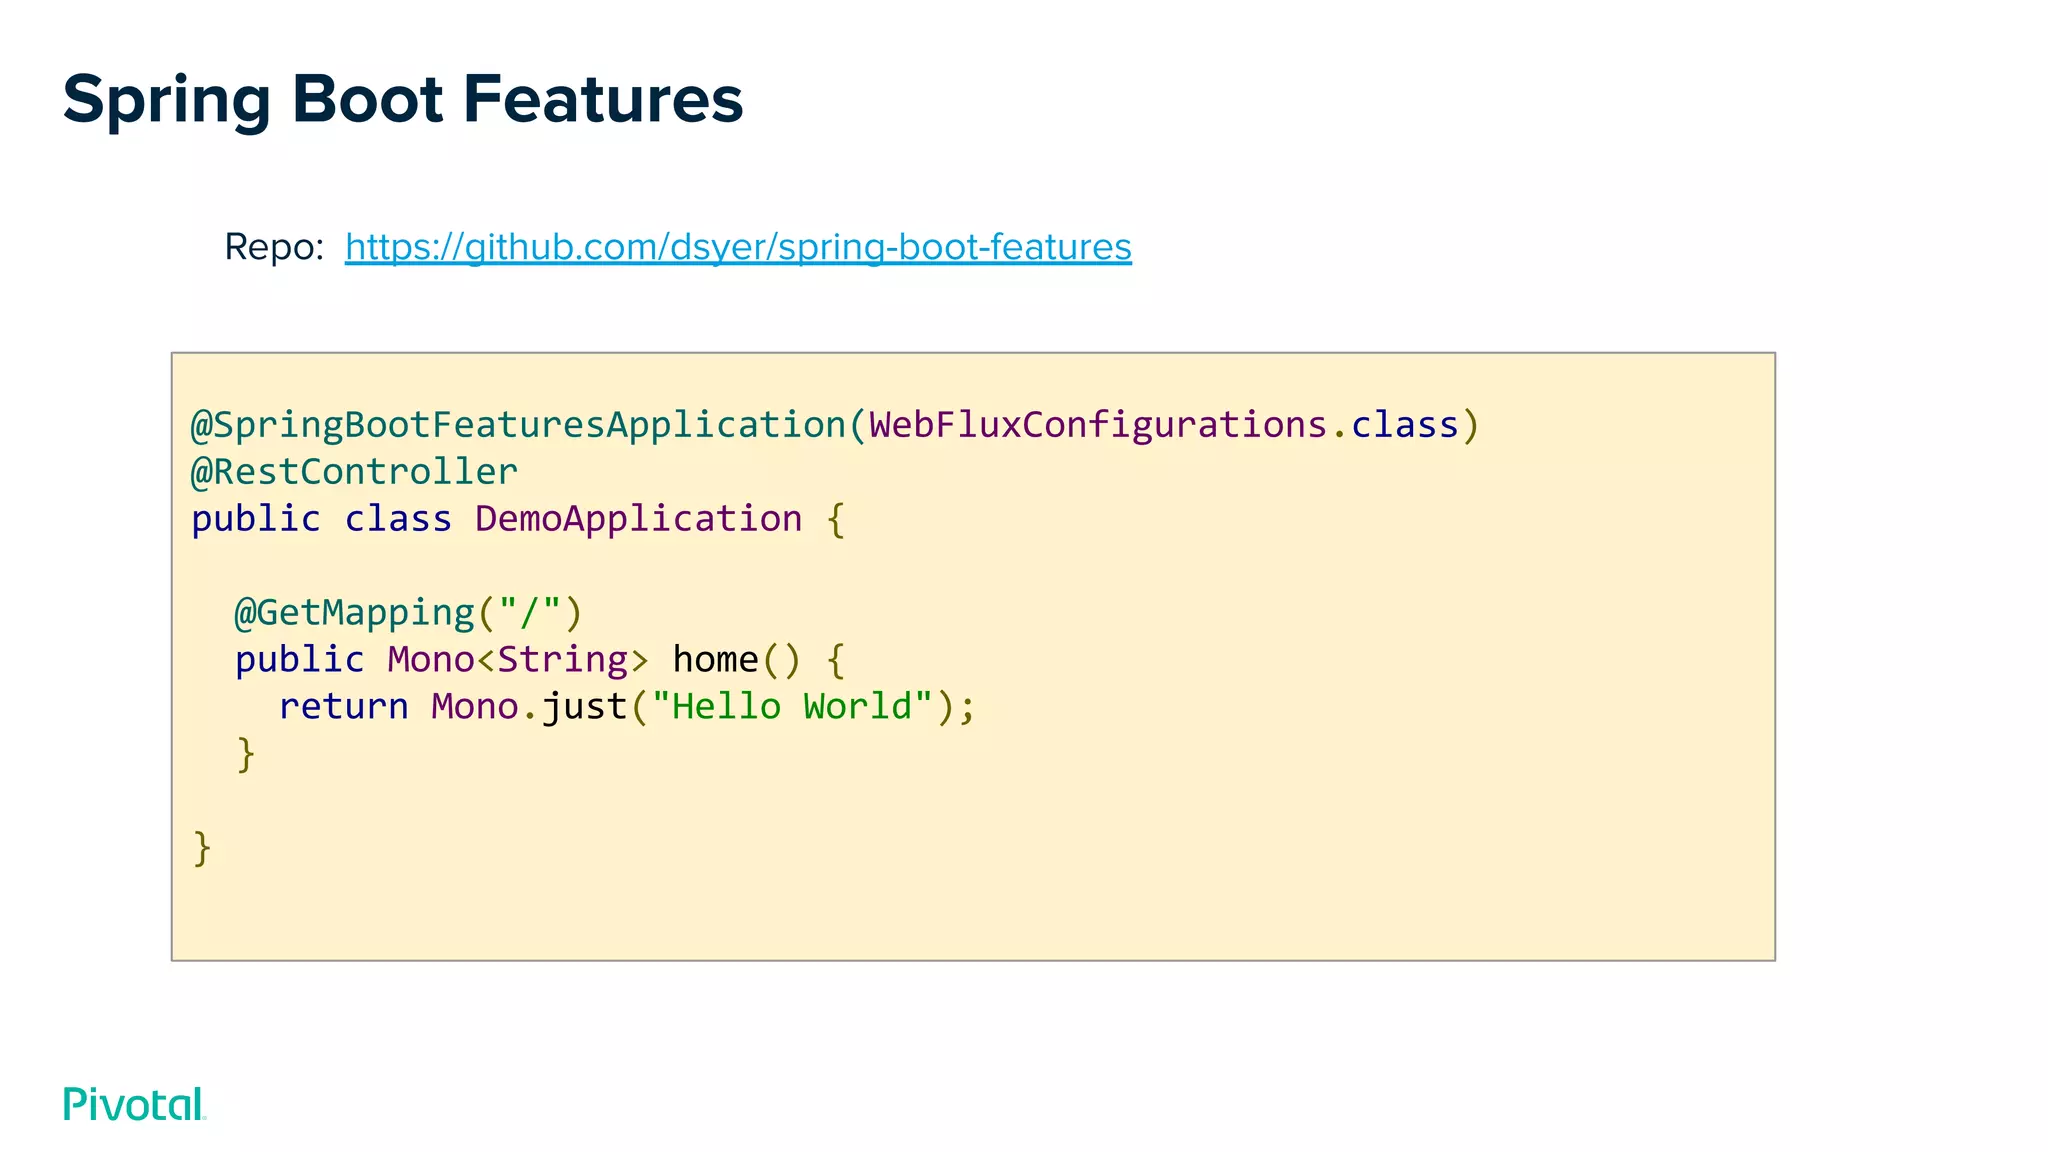
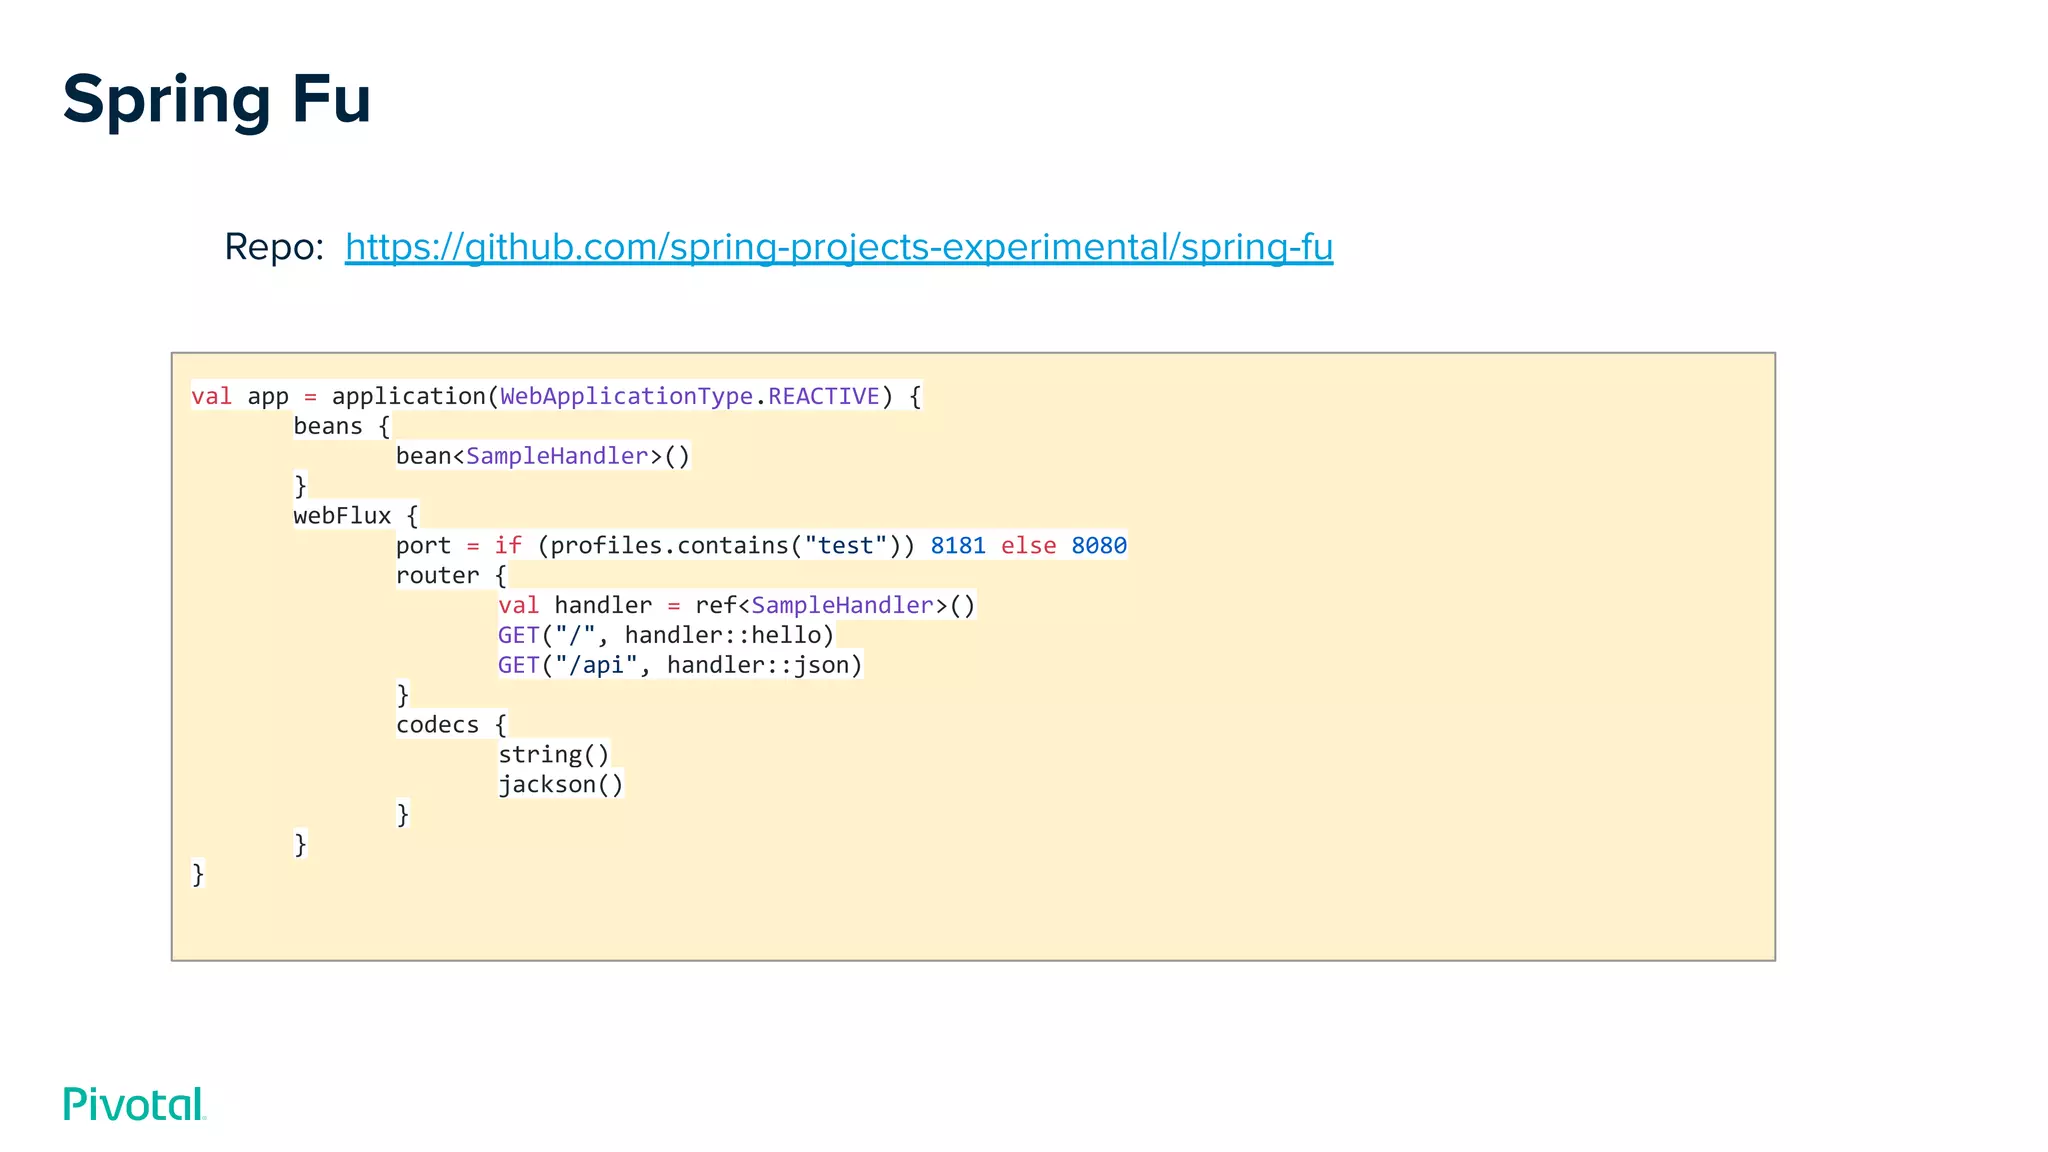
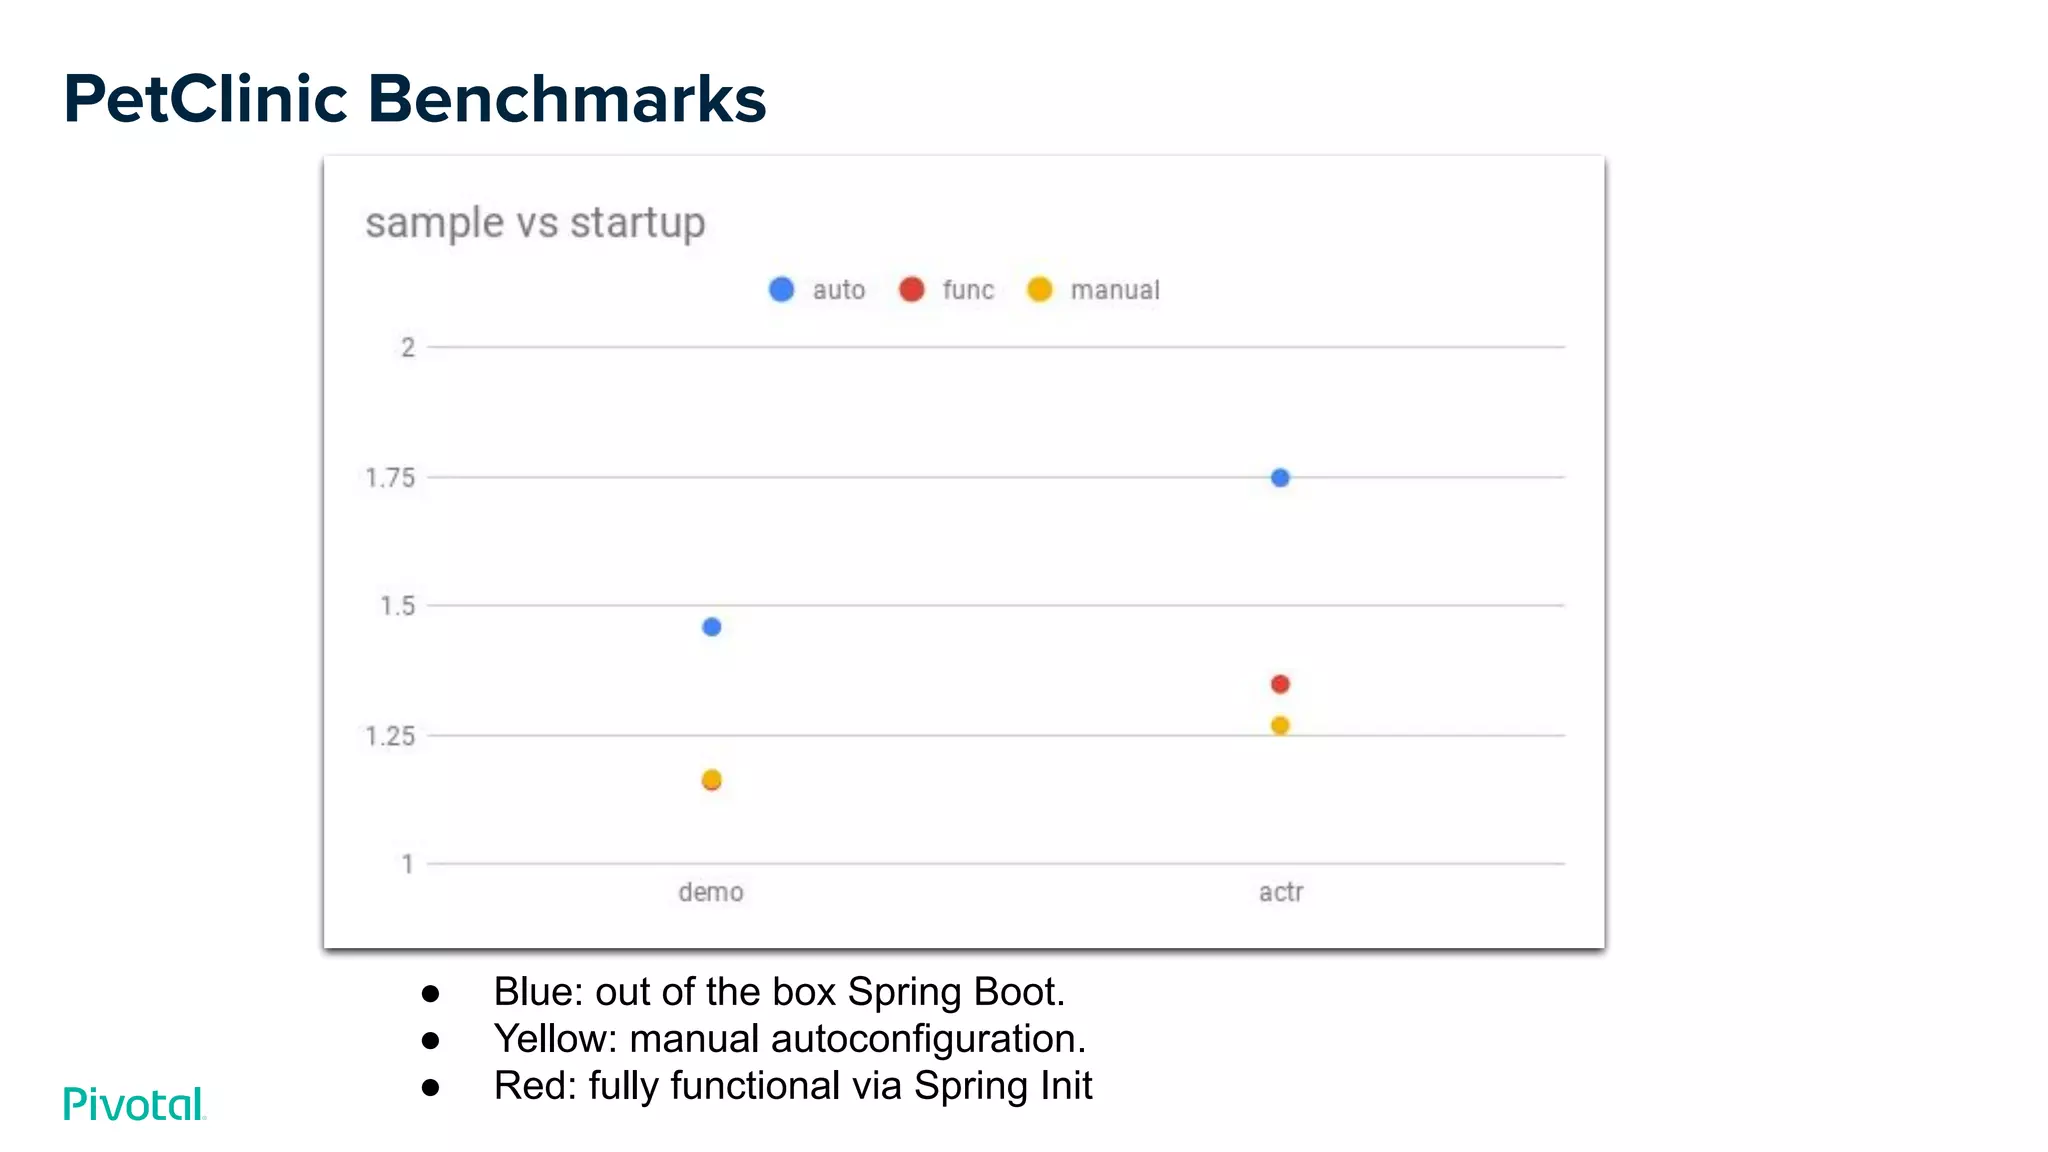
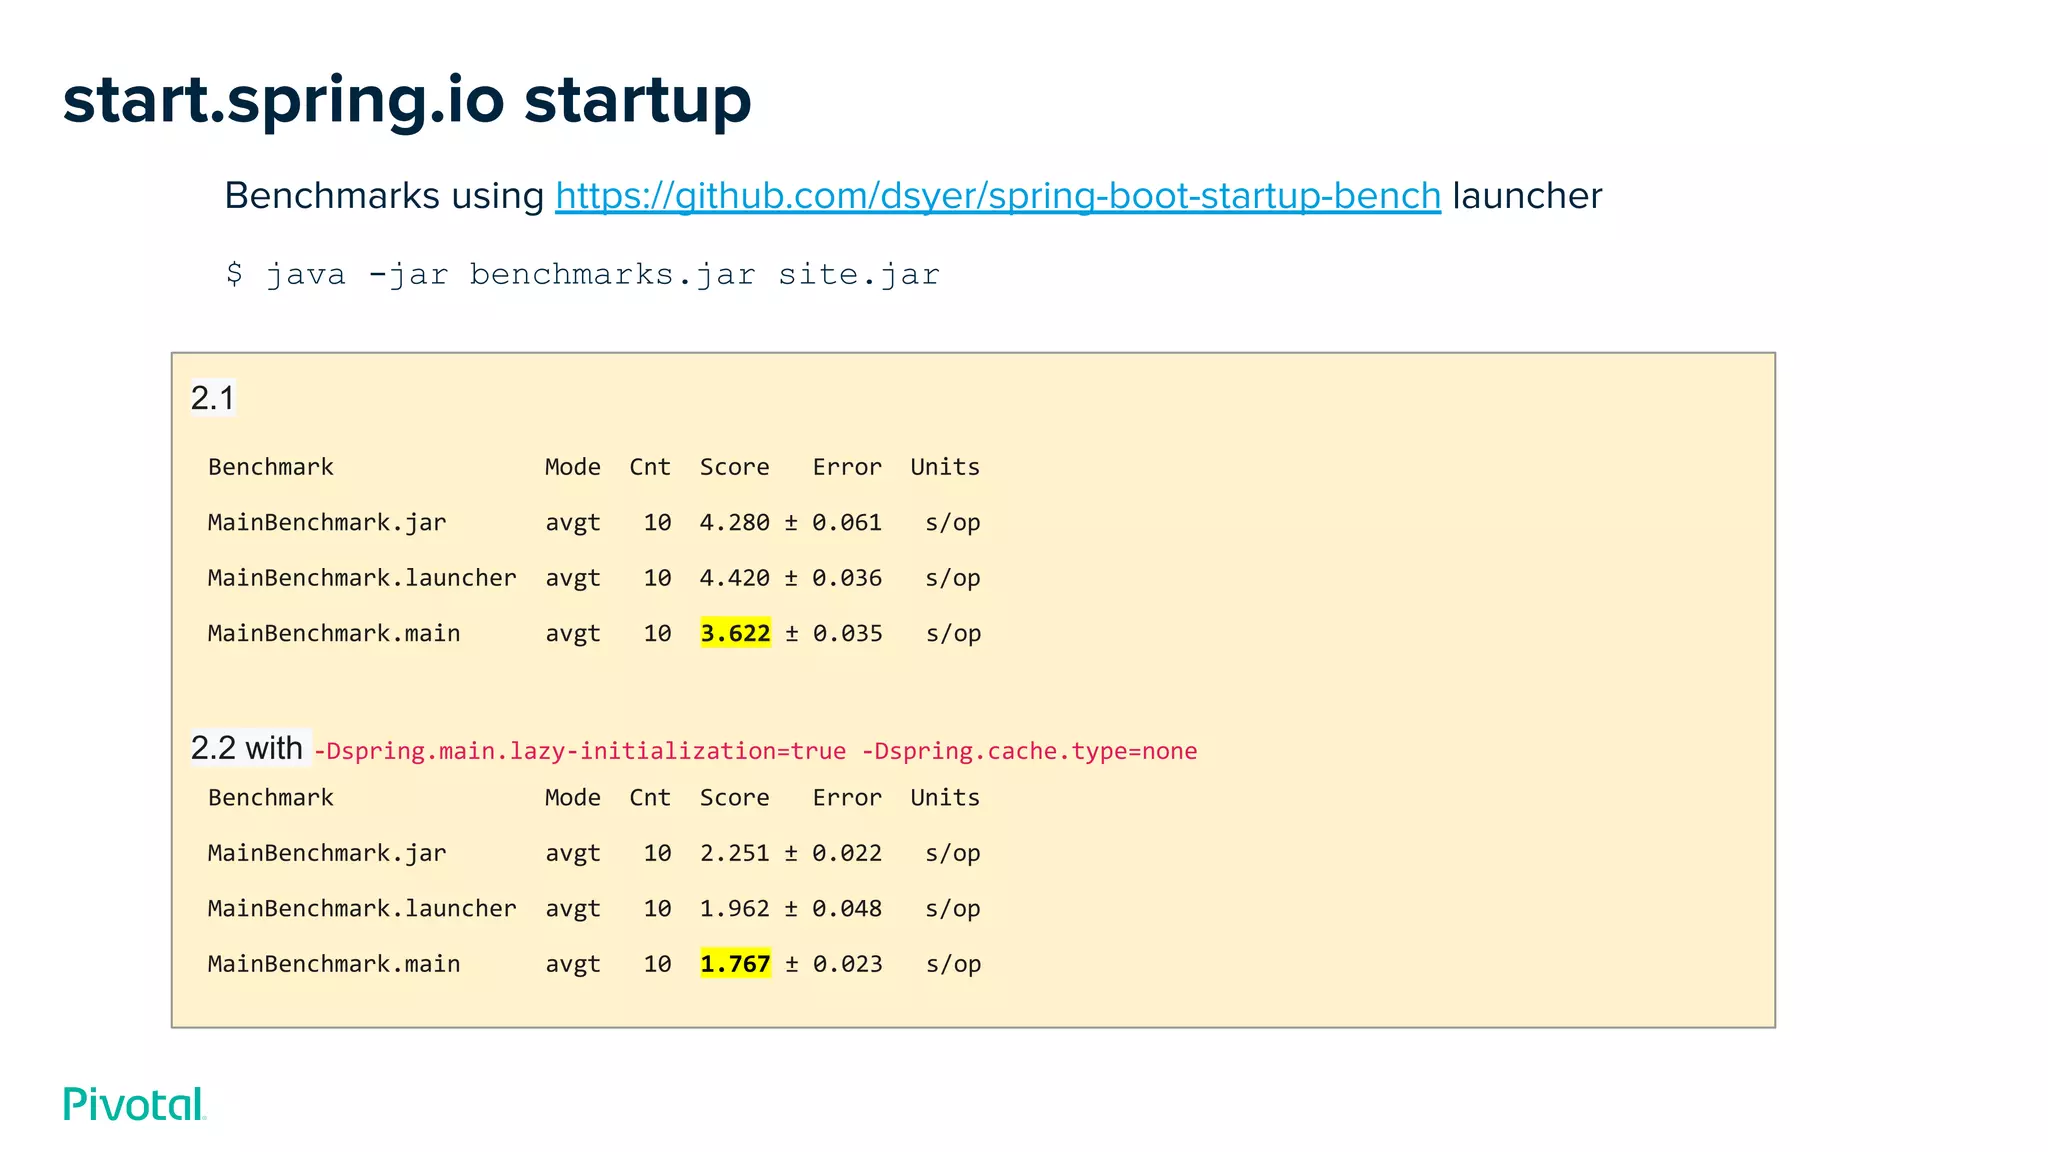

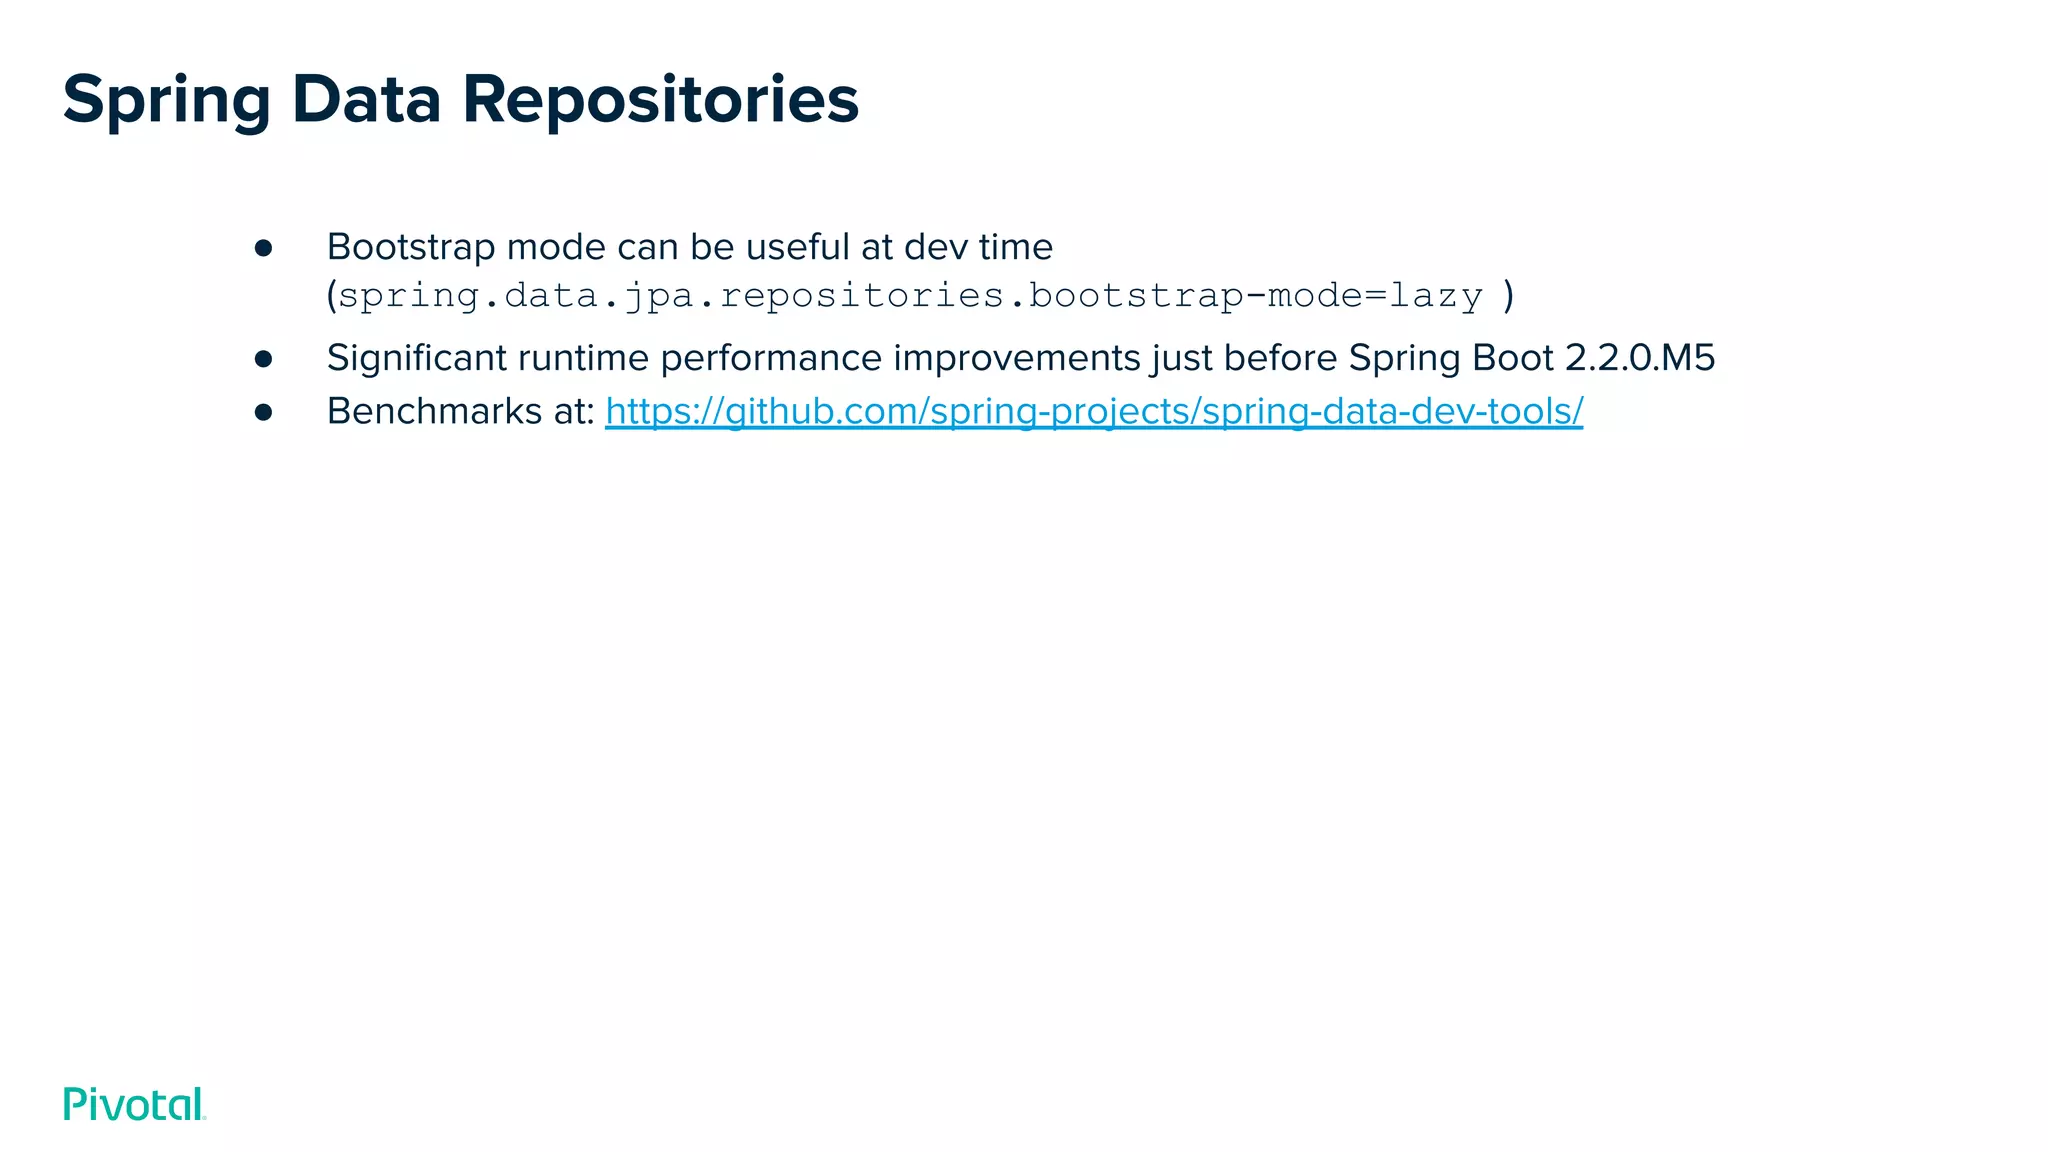
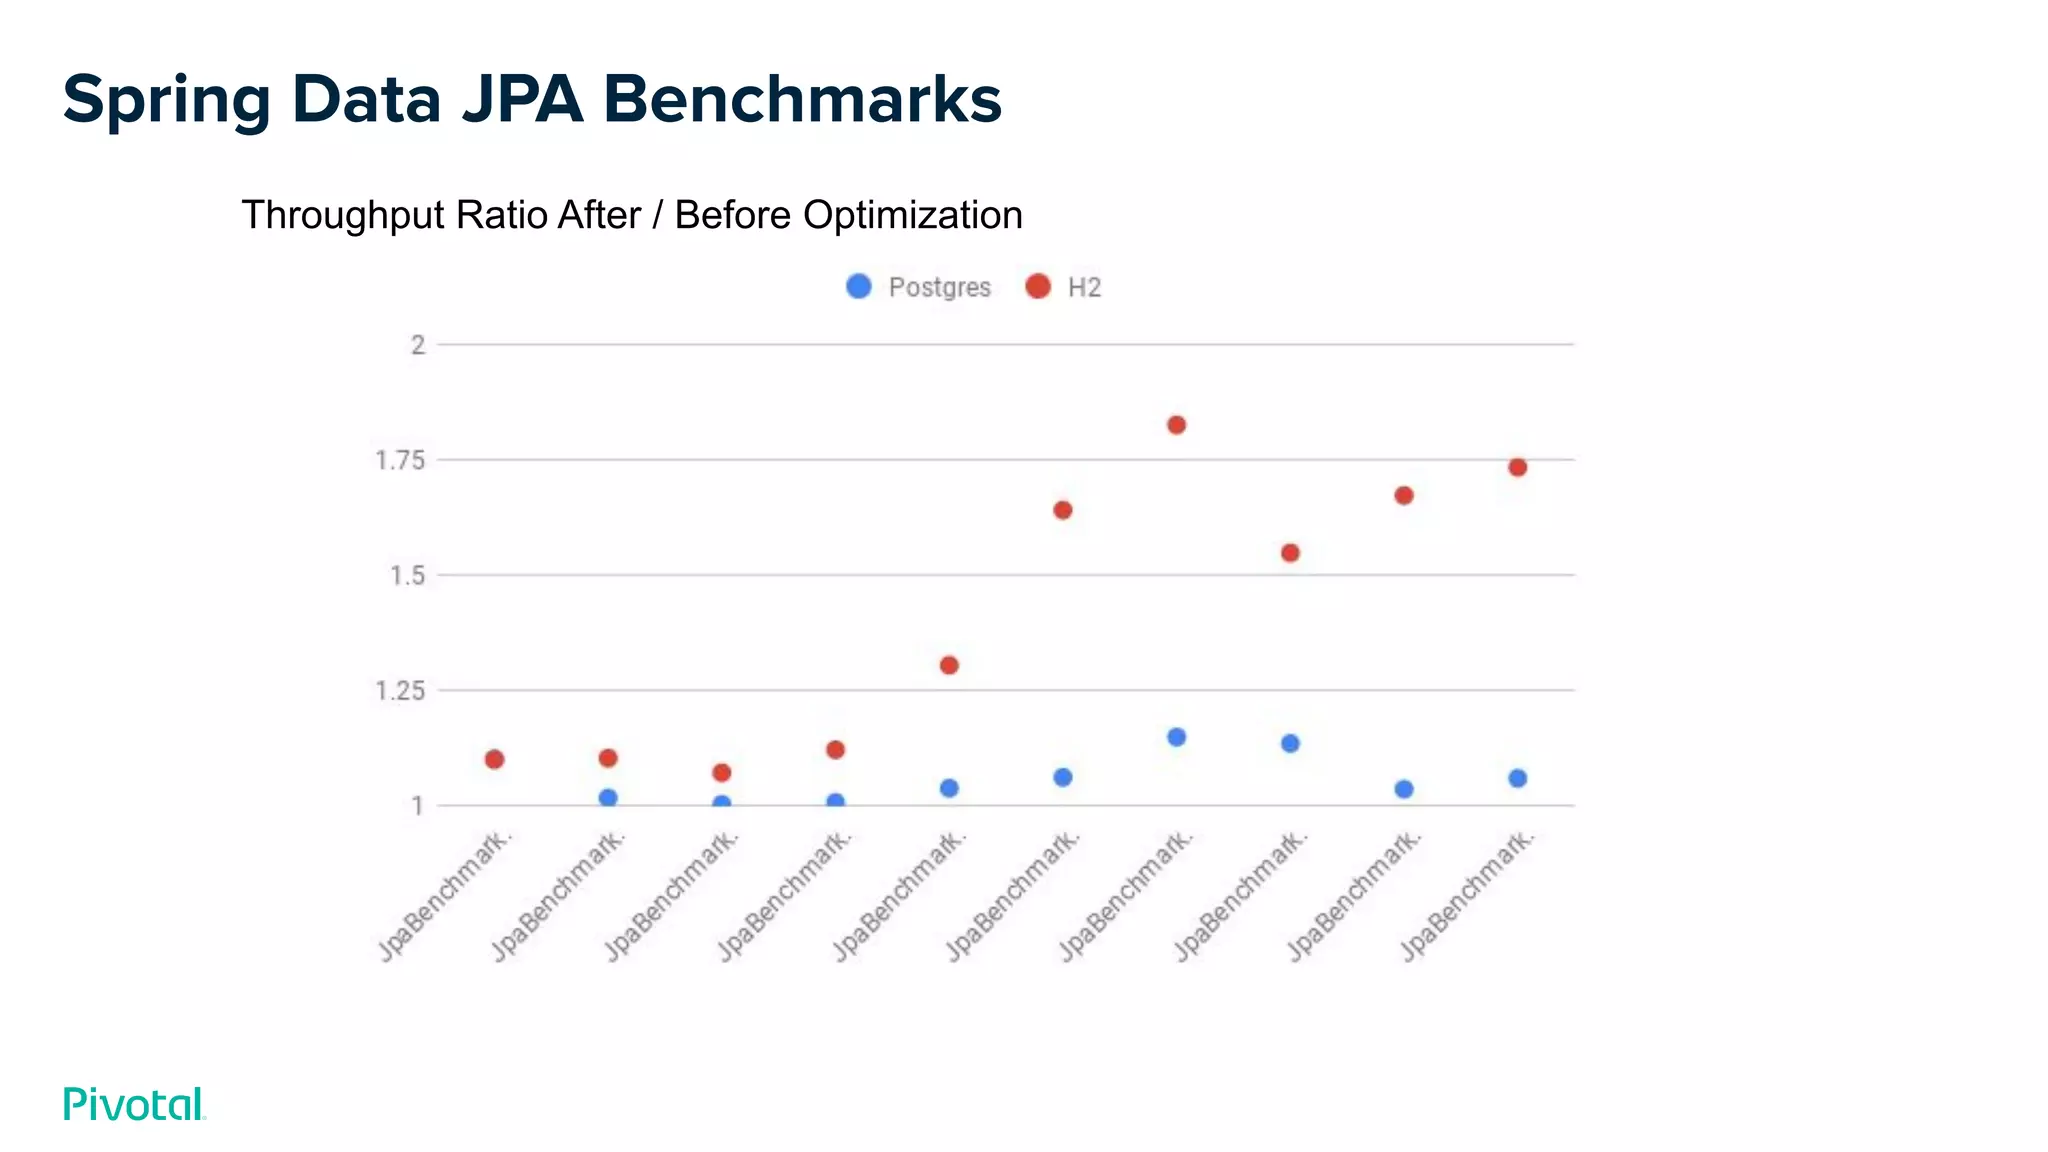

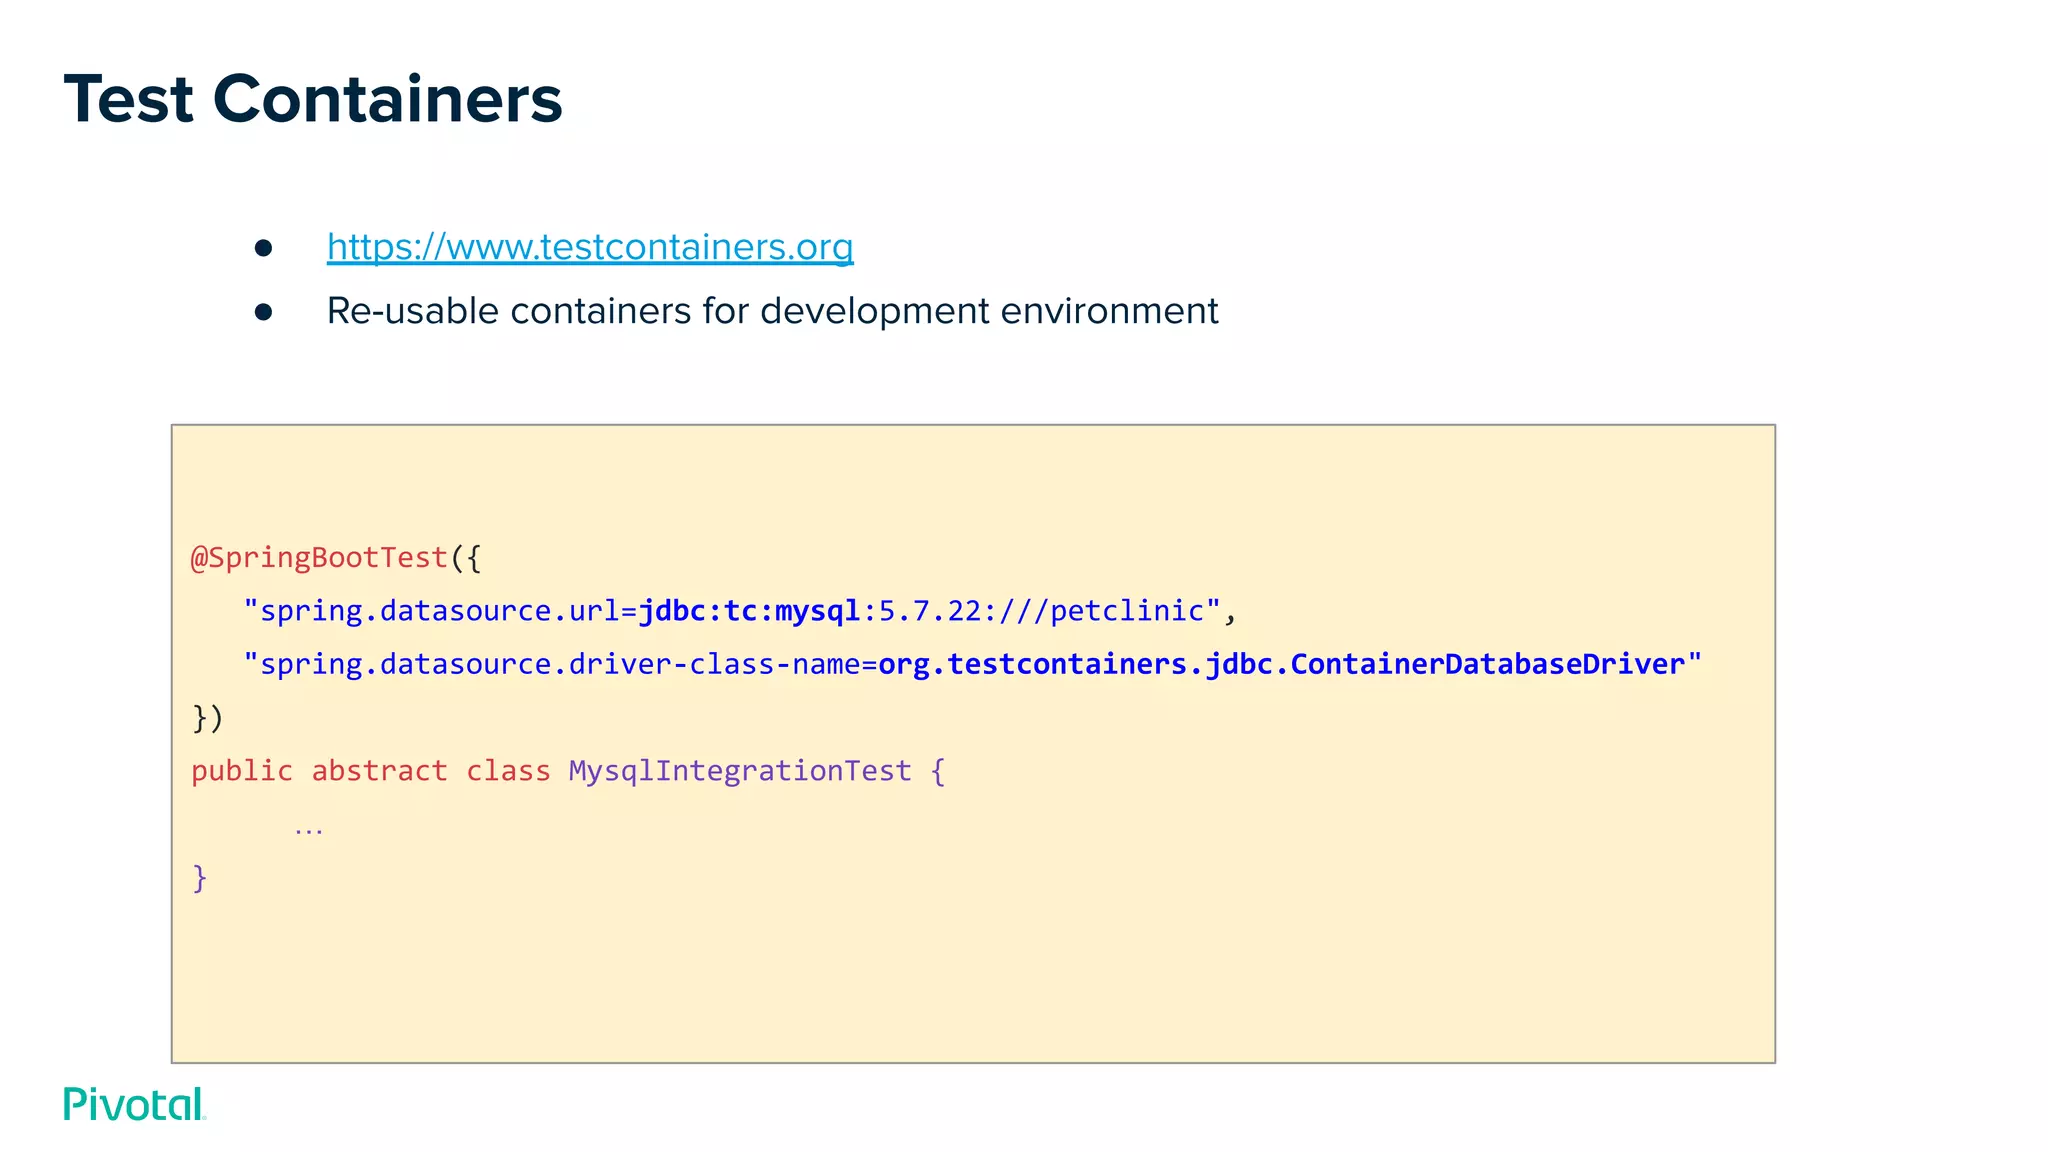
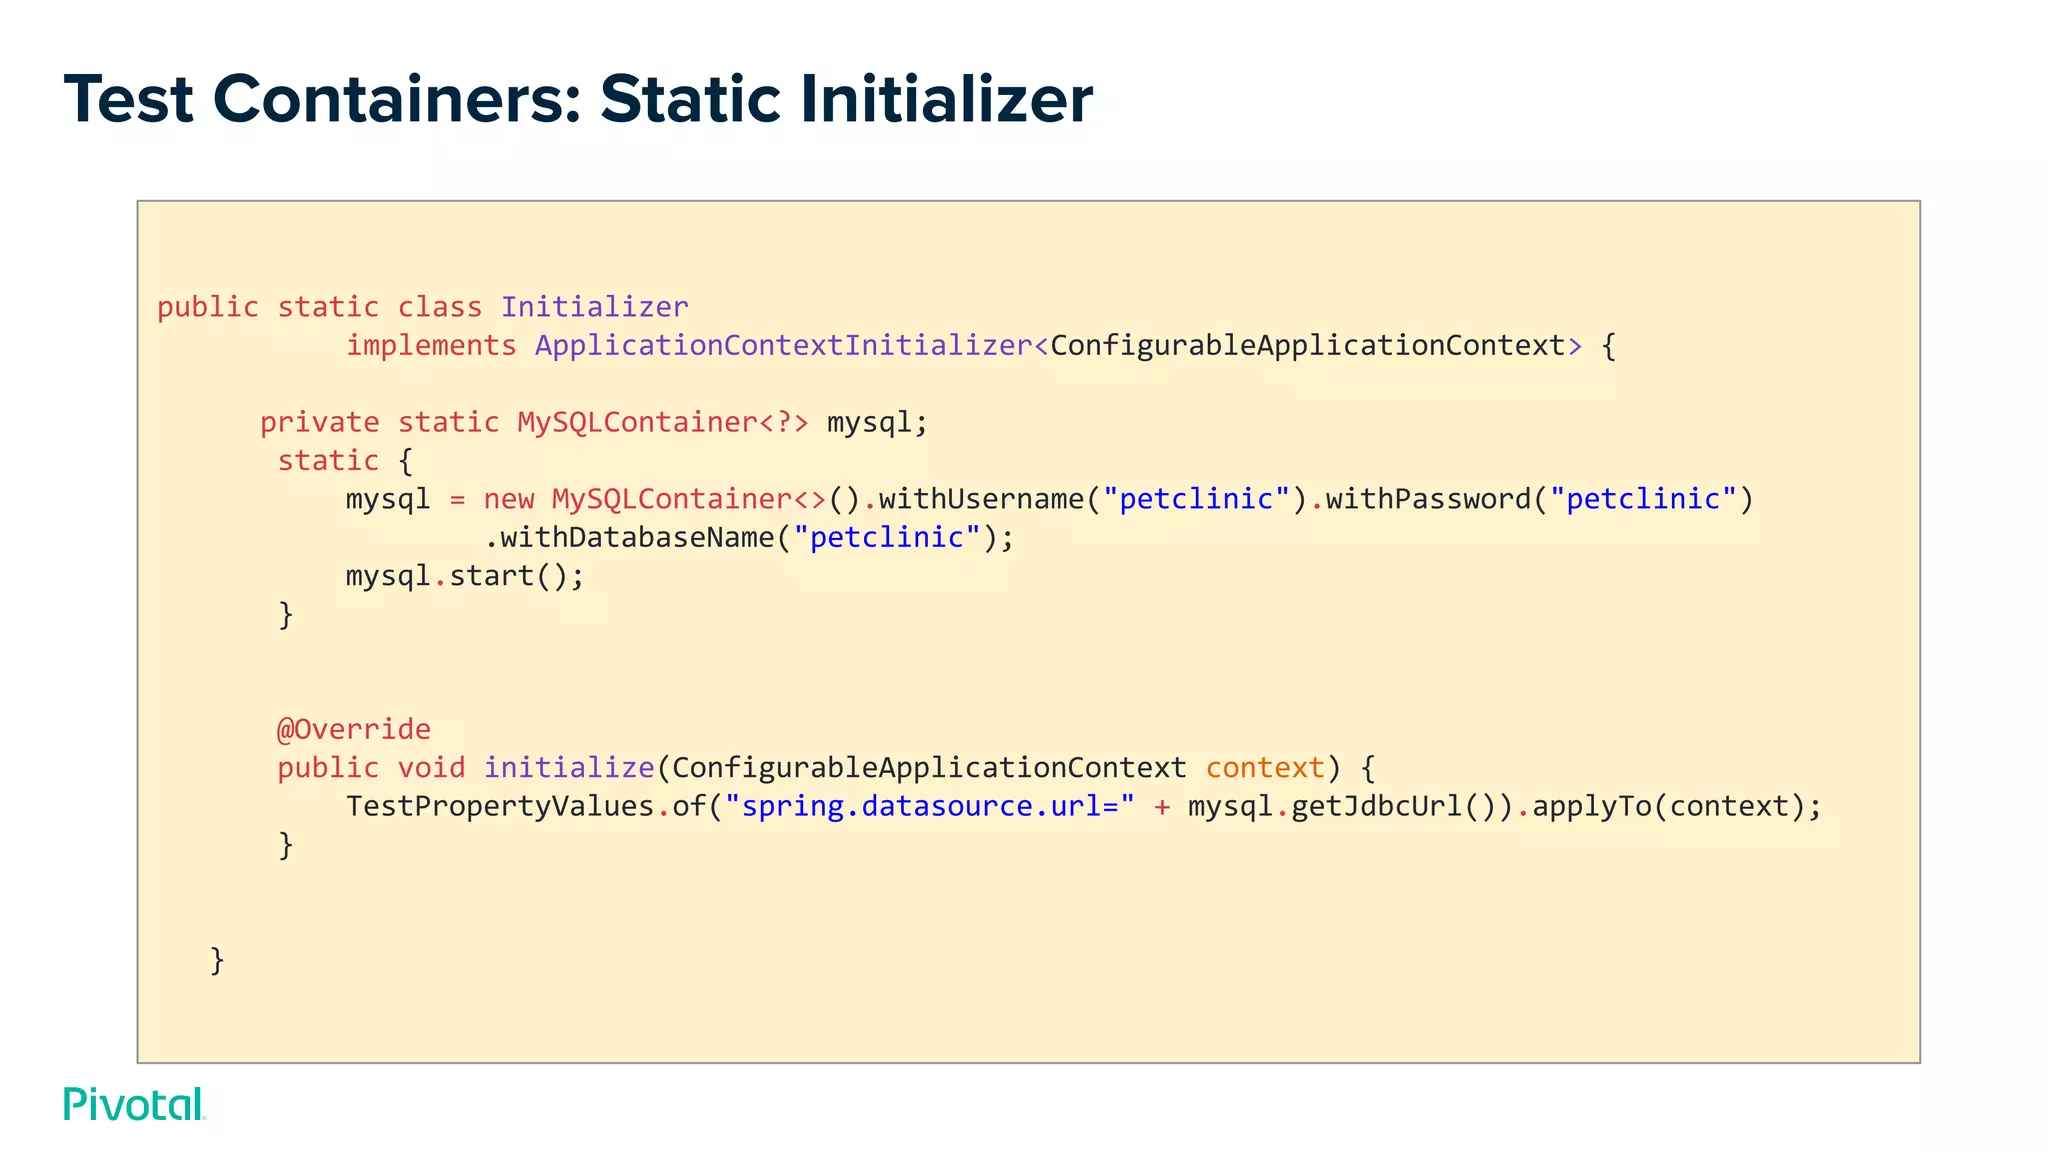
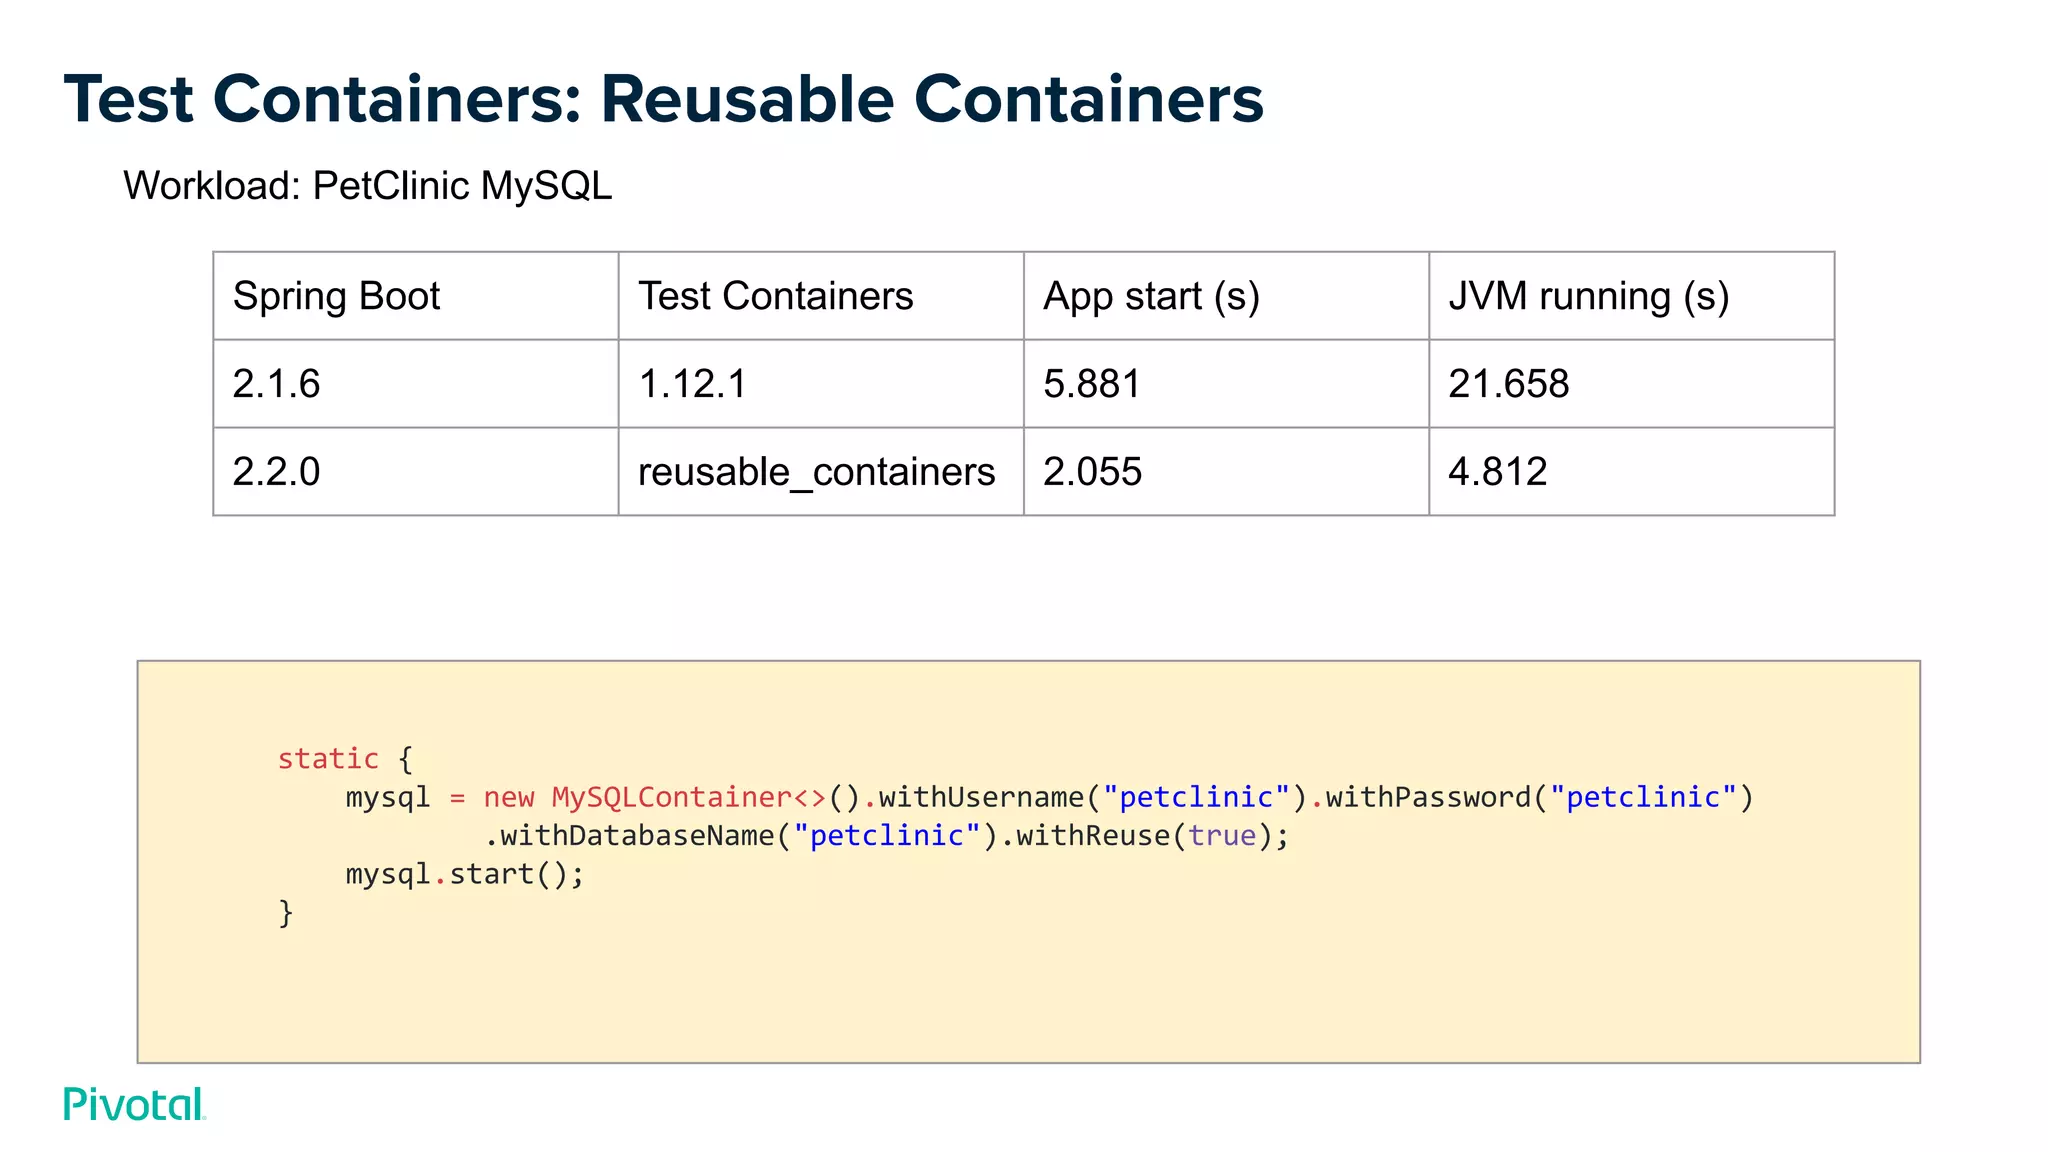


The document discusses performance improvements in Spring Boot 2.2, emphasizing the importance of benchmarking and measuring framework overhead, latency, and throughput. It provides various tools for conducting benchmarks, details specific performance metrics, and suggests optimizations for enhancing application startup times. Notable improvements include increased request rates and reduced latency for both Webflux and MVC workloads, as well as enhancements in data access and testing configurations with Spring Boot 2.2.


![[1D6]RE-view of Android L developer PRE-view](https://cdn.slidesharecdn.com/ss_thumbnails/1d6re-viewofandroidldeveloperpre-view-140929015428-phpapp01-thumbnail.jpg?width=640&height=640&fit=bounds)