Social, Digital & Mobile in APAC
•
282 gostaram•539,282 visualizações

This report offers a thorough, in-depth review of all the key stats for the Social, Digital and Mobile landscape around Asia-Pacific in 2014. Packed with more than 250 slides covering 30 of the region's key countries, the deck has been designed to offer quick and simple cut-and-paste info graphics for your own presentations and blogs.

Recomendados
Mais conteúdo relacionado
Mais procurados
Mais procurados (20)
Semelhante a Social, Digital & Mobile in APAC
Semelhante a Social, Digital & Mobile in APAC (20)
Mais de We Are Social Singapore
Mais de We Are Social Singapore (20)
Último
Último (20)
Social, Digital & Mobile in APAC
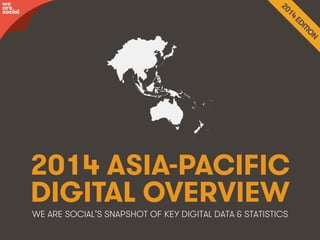
- 1. we are social 2014 ASIA-PACIFIC DIGITAL OVERVIEW WE ARE SOCIAL’S SNAPSHOT OF KEY DIGITAL DATA & STATISTICS We Are Social wearesocial.sg • @wearesocialsg • 1
- 2. COUNTRIES DETAILED IN THIS REPORT 16! 20! 25! 21! 18! 06! 03! 02! 09! 26! 15! 11! 13! 17! 08! 12! 28! 30! 05! 27! 23! 14! 04! 24! 10! 29! 22! 07! 01! 19! 01 AUSTRALIA 07 FIJI 13 MACAU 19 NEW ZEALAND 25 SOUTH KOREA 02 BANGLADESH 08 HONG KONG 14 MALAYSIA 20 NORTH KOREA 26 SRI LANKA 03 BHUTAN 09 INDIA 15 MALDIVES 21 PAKISTAN 27 TAIWAN 04 BRUNEI 10 INDONESIA 16 MONGOLIA 22 PAPUA NEW GUINEA 28 THAILAND 05 CAMBODIA 11 JAPAN 17 MYANMAR 23 PHILIPPINES 29 TIMOR-LESTE 06 CHINA 12 LAOS 18 NEPAL 24 SINGAPORE 30 VIETNAM We Are Social wearesocial.sg • @wearesocialsg • 2
- 3. IF YOU’D LIKE HELP TRANSLATING THESE FINDINGS INTO A POWERFUL SOCIAL STRATEGY, CONTACT US: SAYHELLO@WEARESOCIAL.SG @WEARESOCIALSG +65 6423 1051 WEARESOCIAL.SG We Are Social wearesocial.sg • @wearesocialsg • 3
- 4. ASIA-PACIFIC REGIONAL OVERVIEW We Are Social wearesocial.sg • @wearesocialsg • 4
- 5. JAN 2014 GLOBAL DATA SNAPSHOT 7,095,476,818 52% 48% TOTAL POPULATION URBAN RURAL 2,640,432,161 INTERNET USERS 1,856,680,860 ACTIVE SOCIAL NETWORK USERS 37% INTERNET PENETRATION 26% SOCIAL NETWORKING PENETRATION 6,572,950,124 ACTIVE MOBILE SUBSCRIPTIONS We Are Social 93% MOBILE SUBSCRIPTION PENETRATION • Sources: US Census Bureau, InternetWorldStats, CNNIC, IAMAI, Tencent, Facebook, Vkontakte, ITU, CIA wearesocial.sg • @wearesocialsg • 5
- 6. JAN 2014 SHARE OF GLOBAL USERS CENTRAL & EASTERN EUROPE 5% NORTH AMERICA 5% 6% 12% 11% 11% 10% 6% 7% WESTERN EUROPE 7% 8% EAST ASIA CENTRAL ASIA 5% 2% MIDDLE EAST 4% 4% CENTRAL AMERICA 3% 4% 3% 4% 5% 3% SOUTH AMERICA 6% INTERNET USERS 1% 2% 10% 7% 11% 37% 29% 22% 18% 9% 9% 7% 10% 4% 8% 6% 11% 16% 22% SOUTHEAST ASIA SOUTH ASIA 23% AFRICA POPULATION 1% 8% SOCIAL MEDIA USERS OCEANIA 1% 1% 1% 1% MOBILE SUBSCRIPTIONS We Are Social • Sources: US Census Bureau, InternetWorldStats, CNNIC, IAMAI, Tencent, Facebook, Vkontakte, ITU, CIA wearesocial.sg • @wearesocialsg • 6
- 7. JAN 2014 ASIA-PACIFIC 3,882,702,949 44% 56% TOTAL POPULATION URBAN RURAL 1,255,745,291 INTERNET USERS 969,583,240 ACTIVE SOCIAL NETWORK USERS 32% INTERNET PENETRATION 25% SOCIAL NETWORKING PENETRATION 3,347,580,701 ACTIVE MOBILE SUBSCRIPTIONS We Are Social 86% MOBILE SUBSCRIPTION PENETRATION • Sources: US Census Bureau, InternetWorldStats, CNNIC, IAMAI, Tencent, Facebook, Vkontakte, ITU, CIA wearesocial.sg • @wearesocialsg • 7
- 8. JAN 2014 APAC GLOBAL SHARE SHARE OF GLOBAL POPULATION SHARE OF GLOBAL INTERNET USERS SHARE OF GLOBAL SOCIAL MEDIA USERS SHARE OF GLOBAL MOBILE USERS 54.7% 47.5% 52.2% 47.6% We Are Social • Sources: US Census Bureau, InternetWorldStats, CNNIC, IAMAI, Tencent, Facebook, Vkontakte, GSMA Intelligence wearesocial.sg • @wearesocialsg • 8
- 9. JAN 2014 APAC: MOBILE CONTRACT TYPE PERCENTAGE OF TOTAL MOBILE SUBSCRIPTIONS THAT ARE PRE-PAID PERCENTAGE OF TOTAL MOBILE SUBSCRIPTIONS THAT ARE POST-PAID PERCENTAGE OF MOBILE SUBSCRIPTIONS THAT ARE 3G CONNECTIONS 3G 82% We Are Social • Source: GSMA Intelligence 18% 21% wearesocial.sg • @wearesocialsg • 9
- 10. JAN 2014 APAC MOBILE INDICATORS NUMBER OF ACTIVE MOBILE BROADBAND SUBSCRIPTIONS MOBILE BROADBAND SUBSCRIPTIONS AS A PERCENTAGE OF THE TOTAL POPULATION # 645M ACTIVE SOCIAL MEDIA USERS ACCESSING SOCIAL MEDIA ON A MOBILE DEVICE PENETRATION OF MOBILE SOCIAL AS A PERCENTAGE OF THE TOTAL POPULATION # 16.6% Tencent, Facebook, ITU We Are Social • Sources: US Census Bureau, ITU, Facebook 943M 24.3% wearesocial.sg • @wearesocialsg • 10
- 11. JAN 2014 SOUTH ASIA 1,630,919,286 31% 69% TOTAL POPULATION URBAN RURAL 280,863,846 INTERNET USERS 112,696,000 ACTIVE SOCIAL NETWORK USERS 17% INTERNET PENETRATION 7% SOCIAL NETWORKING PENETRATION 1,173,703,583 ACTIVE MOBILE SUBSCRIPTIONS 72% MOBILE SUBSCRIPTION PENETRATION We Are Social • Sources: US Census Bureau, InternetWorldStats, IAMAI, Facebook, CIA Factbook wearesocial.sg • @wearesocialsg • 11
- 12. JAN 2014 SOUTH ASIA MOBILE INDICATORS NUMBER OF ACTIVE MOBILE BROADBAND SUBSCRIPTIONS MOBILE BROADBAND SUBSCRIPTIONS AS A PERCENTAGE OF THE TOTAL POPULATION # 61.8M ACTIVE SOCIAL MEDIA USERS ACCESSING SOCIAL MEDIA ON A MOBILE DEVICE PENETRATION OF MOBILE SOCIAL AS A PERCENTAGE OF THE TOTAL POPULATION # 3.8% We Are Social • Sources: US Census Bureau, ITU, Facebook 89.1M 5.5% wearesocial.sg • @wearesocialsg • 12
- 13. JAN 2014 EAST ASIA 1,584,806,482 56% 44% TOTAL POPULATION URBAN RURAL 756,093,363 INTERNET USERS 48% INTERNET PENETRATION 678,728,200 ACTIVE SOCIAL NETWORK USERS 43% SOCIAL NETWORKING PENETRATION 1,451,087,957 ACTIVE MOBILE SUBSCRIPTIONS 92% MOBILE SUBSCRIPTION PENETRATION We Are Social • Sources: US Census Bureau, InternetWorldStats, CNNIC, Facebook, Tencent, ITU wearesocial.sg • @wearesocialsg • 13
- 14. JAN 2014 EAST ASIA MOBILE INDICATORS NUMBER OF ACTIVE MOBILE BROADBAND SUBSCRIPTIONS MOBILE BROADBAND SUBSCRIPTIONS AS A PERCENTAGE OF THE TOTAL POPULATION # 444.8M ACTIVE SOCIAL MEDIA USERS ACCESSING SOCIAL MEDIA ON A MOBILE DEVICE PENETRATION OF MOBILE SOCIAL AS A PERCENTAGE OF THE TOTAL POPULATION # 28.1% We Are Social • Sources: US Census Bureau, ITU, Facebook 707.4M 44.6% wearesocial.sg • @wearesocialsg • 14
- 15. JAN 2014 SOUTHEAST ASIA 630,551,581 45% 55% TOTAL POPULATION URBAN RURAL 195,762,594 INTERNET USERS 161,996,000 31% INTERNET PENETRATION 26% ACTIVE SOCIAL NETWORK USERS SOCIAL NETWORKING PENETRATION 688,607,654 109% ACTIVE MOBILE SUBSCRIPTIONS We Are Social • Sources: US Census Bureau, InternetWorldStats, Facebook, ITU MOBILE SUBSCRIPTION PENETRATION wearesocial.sg • @wearesocialsg • 15
- 16. JAN 2014 SOUTHEAST ASIA MOBILE INDICATORS NUMBER OF ACTIVE MOBILE BROADBAND SUBSCRIPTIONS MOBILE BROADBAND SUBSCRIPTIONS AS A PERCENTAGE OF THE TOTAL POPULATION # 113.6M ACTIVE SOCIAL MEDIA USERS ACCESSING SOCIAL MEDIA ON A MOBILE DEVICE PENETRATION OF MOBILE SOCIAL AS A PERCENTAGE OF THE TOTAL POPULATION # 18.0% We Are Social • Sources: US Census Bureau, ITU, Facebook 133.7M 21.2% wearesocial.sg • @wearesocialsg • 16
- 17. JAN 2014 OCEANIA 36,425,600 71% 29% TOTAL POPULATION URBAN RURAL 23,025,488 INTERNET USERS 16,163,220 ACTIVE SOCIAL NETWORK USERS 34,181,507 ACTIVE MOBILE SUBSCRIPTIONS We Are Social • Sources: US Census Bureau, InternetWorldStats, Facebook, ITU 63% INTERNET PENETRATION 44% SOCIAL NETWORKING PENETRATION 94% MOBILE SUBSCRIPTION PENETRATION wearesocial.sg • @wearesocialsg • 17
- 18. JAN 2014 OCEANIA MOBILE INDICATORS NUMBER OF ACTIVE MOBILE BROADBAND SUBSCRIPTIONS MOBILE BROADBAND SUBSCRIPTIONS AS A PERCENTAGE OF THE TOTAL POPULATION # 24.4M ACTIVE SOCIAL MEDIA USERS ACCESSING SOCIAL MEDIA ON A MOBILE DEVICE PENETRATION OF MOBILE SOCIAL AS A PERCENTAGE OF THE TOTAL POPULATION # 71.2% We Are Social • Sources: US Census Bureau, ITU, Facebook 13.1M 38.7% wearesocial.sg • @wearesocialsg • 18
- 19. JAN 2014 INTERNET PENETRATION IN APAC MONGOLIA 16%! SOUTH KOREA 84%! CHINA PAKISTAN 10%! INDIA 17%! SRI LANKA 39%! MALDIVES JAPAN 44%! BANGLADESH HONG KONG 73%! 22%! THAILAND 79%! APAC AVERAGE 32%! 76%! TAIWAN 35%! 18%! MALAYSIA 39%! 65%! VIETNAM 36%! PHILIPPINES 73%! SINGAPORE 29%! INDONESIA TIMOR1%! LESTE PAPUA 2%! NEW GUINEA FIJI 33%! AUSTRALIA 81%! NEW ZEALAND 89%! We Are Social • Sources: US Census Bureau, InternetWorldStats, CNNIC, IAMAI wearesocial.sg • @wearesocialsg • 19
- 20. JAN 2014 89%! 84%! 81%! INTERNET PENETRATION IN APAC 79%! 76%! 73%! 73%! 65%! 64%! 59%! GLOBAL AVERAGE 44%! 39%! 39%! 36%! 35%! 33%! 32%! 29%! 25%! 24%! 22%! 18%! 17%! 16%! 11%! 10%! We Are Social • Sources: US Census Bureau, InternetWorldStats, CNNIC, IAMAI NORTH KOREA TIMOR-LESTE MYANMAR 2%! 1%! 1%! 0%! PAPUA NEW GUINEA CAMBODIA PAKISTAN LAOS MONGOLIA INDIA SRI LANKA BANGLADESH NEPAL BHUTAN INDONESIA APAC AVERAGE FIJI THAILAND PHILIPPINES MALDIVES VIETNAM CHINA BRUNEI MACAU MALAYSIA HONG KONG SINGAPORE TAIWAN JAPAN AUSTRALIA SOUTH KOREA NEW ZEALAND 5%! wearesocial.sg • @wearesocialsg • 20
- 21. JAN 2014 INTERNET USERS IN APAC MONGOLIA 522K! SOUTH KOREA 41M! CHINA PAKISTAN 20M! INDIA 213M! SRI LANKA 154K! MALDIVES JAPAN 591M! BANGLADESH HONG KONG 5.2M! 37M! THAILAND 3.9M! MALAYSIA 101M! APAC TOTAL 1.22B! 18M! TAIWAN 24M! 36M! 19M! VIETNAM 38M! PHILIPPINES 4.0M! SINGAPORE 73M! INDONESIA TIMOR10K! LESTE PAPUA 145K! NEW GUINEA FIJI 300K! AUSTRALIA 18M! NEW ZEALAND 3.9M! We Are Social • Sources: US Census Bureau, InternetWorldStats, CNNIC, IAMAI wearesocial.sg • @wearesocialsg • 21
- 22. JAN 2014 TIME SPENT ON THE INTERNET AVERAGE NUMBER OF HOURS PER DAY SPENT BY INTERNET USERS ON THE INTERNET 6.2! ACCESS THROUGH LAPTOP / DESKTOP 3.5! 3.5! 3.1! 2.1! We Are Social • Source: GlobalWebIndex SOUTH KOREA JAPAN HONG KONG AUSTRALIA CHINA VIETNAM TAIWAN INDIA THAILAND SINGAPORE INDONESIA MALAYSIA PHILIPPINES 1.0! 1.6! 1.7! 1.9! 1.7! 2.0! 2.3! 2.5! 2.6! 3.1! 2.8! 3.5! 4.5! 4.5! 4.6! 4.7! 4.9! 5.1! 5.3! 5.5! 5.6! ACCESS THROUGH MOBILE DEVICE wearesocial.sg • @wearesocialsg • 22
- 23. JAN 2014 SOCIAL MEDIA PENETRATION IN APAC MONGOLIA 22%! 27%! CHINA PAKISTAN 6%! INDIA 7%! SRI LANKA 44%! MALDIVES HONG KONG 61%! 4%! THAILAND 17%! JAPAN 46%! BANGLADESH SOUTH KOREA APAC AVERAGE 25%! 64%! TAIWAN 36%! 9%! MALAYSIA 22%! 53%! VIETNAM 32%! PHILIPPINES 59%! SINGAPORE 25%! INDONESIA TIMOR6%! LESTE PAPUA 4%! NEW GUINEA FIJI 29%! AUSTRALIA 57%! NEW ZEALAND 57%! We Are Social • Sources: US Census Bureau, CNNIC, Tencent, Facebook wearesocial.sg • @wearesocialsg • 23
- 24. JAN 2014 64%! 63%! 61%! SOCIAL MEDIA PENETRATION IN APAC 59%! 57%! 55%! 53%! 51%! 46%! 44%! 36%! GLOBAL AVERAGE 32%! 29%! 27%! 25%! 25%! 22%! 22%! 17%! 17%! We Are Social • Sources: US Census Bureau, CNNIC, Tencent, Facebook 0%! NORTH KOREA 2%! MYANMAR BANGLADESH 4%! 4%! PAPUA NEW GUINEA PAKISTAN LAOS TIMOR-LESTE INDIA 8%! 7%! 6%! 6%! 6%! CAMBODIA 9%! SRI LANKA NEPAL BHUTAN JAPAN VIETNAM MONGOLIA INDONESIA APAC AVERAGE SOUTH KOREA FIJI PHILIPPINES THAILAND MALDIVES CHINA MACAU MALAYSIA NEW ZEALAND AUSTRALIA SINGAPORE HONG KONG BRUNEI TAIWAN 11%! wearesocial.sg • @wearesocialsg • 24
- 25. JAN 2014 SOCIAL MEDIA USERS IN APAC (MAU) MONGOLIA 720K! 13M! CHINA PAKISTAN 11M! INDIA 90M! SRI LANKA 174K! MALDIVES HONG KONG 4.4M! 5.8M! THAILAND 2.0M! MALAYSIA 22M! JAPAN 623M! BANGLADESH SOUTH KOREA APAC TOTAL 969M! 15M! TAIWAN 24M! 20M! 16M! VIETNAM 34M! PHILIPPINES 3.2M! SINGAPORE 62M! INDONESIA TIMOR76K! LESTE PAPUA 260K! NEW GUINEA FIJI 260K! AUSTRALIA 13M! NEW ZEALAND 2.4M! We Are Social • Sources: US Census Bureau, CNNIC, Tencent, Facebook wearesocial.sg • @wearesocialsg • 25
- 26. TIME SPENT ON SOCIAL MEDIA AVERAGE NUMBER OF HOURS PER DAY SPENT BY SOCIAL MEDIA USERS ON ALL SOCIAL CHANNELS 2.0! HONG KONG We Are Social • Sources: US Census Bureau, CNNIC, Tencent, Facebook JAPAN SOUTH KOREA CHINA SINGAPORE INDONESIA MALAYSIA THAILAND PHILIPPINES 0.8! 1.0! 1.5! 2.1! 2.4! VIETNAM AUSTRALIA 2.4! TAIWAN 2.2! 2.4! INDIA 2.9! 3.3! 3.7! 4.0! JAN 2014 wearesocial.sg • @wearesocialsg • 26
- 27. JAN 2014 MOBILE SUBSCRIPTION PENETRATION MONGOLIA 105%! 110%! CHINA PAKISTAN 67%! INDIA 73%! SRI LANKA 142%! MALDIVES 89%! BANGLADESH SOUTH KOREA 109%! JAPAN APAC AVERAGE 86%! HONG 126%! TAIWAN KONG 228%! 68%! THAILAND 125%! 94%! MALAYSIA 145%! 139%! VIETNAM 101%! PHILIPPINES 148%! SINGAPORE 112%! INDONESIA TIMOR53%! LESTE PAPUA 42%! NEW GUINEA FIJI 96%! AUSTRALIA 110%! NEW ZEALAND 113%! We Are Social • Sources: US Census Bureau, ITU, CIA. Data represent active mobile subscriptions. wearesocial.sg • @wearesocialsg • 27
- 28. We Are Social • Sources: US Census Bureau, ITU, CIA. Data represent active mobile subscriptions. NORTH KOREA MYANMAR PAPUA NEW GUINEA TIMOR-LESTE 10%! 7%! 42%! 53%! 60%! 67%! PAKISTAN NEPAL 68%! 73%! INDIA BANGLADESH 77%! 86%! APAC AVERAGE BHUTAN 89%! CHINA 101%! PHILIPPINES 94%! 105%! MONGOLIA SRI LANKA 109%! JAPAN 96%! 110%! SOUTH KOREA FIJI 110%! AUSTRALIA 97%! 112%! INDONESIA LAOS 113%! NEW ZEALAND 125%! THAILAND 113%! 126%! CAMBODIA BRUNEI 126%! 139%! MALAYSIA TAIWAN 142%! 145%! 148%! MALDIVES VIETNAM SINGAPORE HONG KONG MACAU 228%! 277%! JAN 2014 MOBILE SUBSCRIPTION PENETRATION GLOBAL AVERAGE wearesocial.sg • @wearesocialsg • 28
- 29. JAN 2014 MOBILE SUBSCRIPTIONS IN APAC MONGOLIA 3.4M! 54M! CHINA PAKISTAN 130M! INDIA 894M! SRI LANKA 561K! MALDIVES HONG KONG 16M! 111M! THAILAND 20M! MALAYSIA 138M! JAPAN 1.2B! BANGLADESH SOUTH KOREA APAC TOTAL 3.3B! 29M! TAIWAN 84M! 134M! 41M! VIETNAM 107M! PHILIPPINES 8.1M! SINGAPORE 282M! INDONESIA TIMOR621K! LESTE PAPUA 2.7M! NEW GUINEA FIJI 859K! AUSTRALIA 24M! NEW ZEALAND 4.9M! We Are Social • Sources: US Census Bureau, ITU, CIA. Data represent active mobile subscriptions. wearesocial.sg • @wearesocialsg • 29
- 30. JAN 2014 MOBILE BROADBAND PENETRATION MONGOLIA 27%! 106%! CHINA PAKISTAN 0.3%! INDIA SRI LANKA 22%! MALDIVES HONG KONG 74%! 0.2%! THAILAND 113%! JAPAN 17%! BANGLADESH 5%! SOUTH KOREA APAC AVERAGE 17%! 46%! TAIWAN 0.1%! 4%! MALAYSIA 19%! 14%! VIETNAM 4%! PHILIPPINES 123%! SINGAPORE 32%! INDONESIA NA! TIMORLESTE PAPUA NEW GUINEA NA! FIJI 11%! AUSTRALIA 96%! NEW ZEALAND 65%! We Are Social • Sources: US Census Bureau, ITU. Figures are based on number of active subscriptions. wearesocial.sg • @wearesocialsg • 30
- 31. 17%! WEIGHTED We Are Social • Sources: US Census Bureau, ITU. Figures are based on number of active subscriptions. 7%! 5%! 4%! 4%! 3%! 1%! 0.3%! CAMBODIA INDIA SRI LANKA PHILIPPINES BHUTAN LAOS PAKISTAN 0.2%! 8%! 11%! BRUNEI FIJI 0.1%! N/A! N/A! N/A! N/A! N/A! N/A! BANGLADESH THAILAND MYANMAR MACAU NEPAL NORTH KOREA PAPUA NEW GUINEA TIMOR-LESTE 14%! 17%! CHINA MALAYSIA 19%! 32%! 27%! 22%! VIETNAM MALDIVES MONGOLIA INDONESIA TAIWAN NEW ZEALAND HONG KONG AUSTRALIA SOUTH KOREA JAPAN SINGAPORE 46%! 65%! 74%! 96%! 106%! 113%! 123%! JAN 2014 MOBILE BROADBAND PENETRATION GLOBAL AVERAGE wearesocial.sg • @wearesocialsg • 31
- 32. JAN 2014 MOBILE BROADBAND SUBSCRIPTIONS MONGOLIA 861K! 52M! CHINA PAKISTAN 580K! INDIA SRI LANKA 85K! MALDIVES HONG KONG 5.3M! 327K! THAILAND 144M! JAPAN 232M! BANGLADESH 60M! SOUTH KOREA APAC TOTAL 645M! 11M! TAIWAN 953K! 954K! MALAYSIA 18M! 4.0M! 4M! VIETNAM PHILIPPINES 6.7M! SINGAPORE INDONESIA 80M! NA! TIMORLESTE NA! PAPUA NEW GUINEA FIJI 97K! AUSTRALIA 21M! NEW ZEALAND 2.8M! We Are Social • Sources: International Telecoms Union. Figures represent active subscriptions. wearesocial.sg • @wearesocialsg • 32
- 33. JAN 2014 MOBILE SOCIAL PENETRATION (MAU) MONGOLIA 17%! 23%! CHINA PAKISTAN 4%! INDIA 6%! SRI LANKA 34%! MALDIVES HONG KONG 53%! 3%! THAILAND 15%! JAPAN 49%! BANGLADESH SOUTH KOREA APAC AVERAGE 24%! 52%! TAIWAN 33%! 7%! MALAYSIA 18%! 44%! VIETNAM 4%! PHILIPPINES 51%! SINGAPORE 21%! INDONESIA TIMOR7%! LESTE PAPUA 4%! NEW GUINEA FIJI 22%! AUSTRALIA 49%! NEW ZEALAND 44%! We Are Social • Sources: US Census Bureau, Facebook, Tencent. Based on active monthly user figures. wearesocial.sg • @wearesocialsg • 33
- 34. JAN 2014 MOBILE SOCIAL PENETRATION (MAU) 58%! 53%! 52%! 51%! 49%! 49%! 45%! 44%! 44%! 33%! 13%! We Are Social • Sources: US Census Bureau, Facebook, Tencent. Based on active monthly user figures. 0%! NORTH KOREA MYANMAR 4%! 4%! 3%! 2%! BANGLADESH 7%! 7%! 6%! 6%! 5%! PAPUA NEW GUINEA NEPAL BHUTAN JAPAN MONGOLIA VIETNAM INDONESIA FIJI PHILIPPINES SOUTH KOREA APAC AVERAGE THAILAND MALDIVES NEW ZEALAND MALAYSIA MACAU AUSTRALIA CHINA SINGAPORE TAIWAN HONG KONG BRUNEI 9%! PAKISTAN 15%! LAOS 17%! INDIA 18%! TIMOR-LESTE 21%! SRI LANKA 24%! 23%! 23%! 22%! CAMBODIA 34%! wearesocial.sg • @wearesocialsg • 34
- 35. JAN 2014 ACTIVE MOBILE SOCIAL USERS (MAU) MONGOLIA 540K! 11M! CHINA PAKISTAN 7.6M! INDIA 72M! SRI LANKA 134K! MALDIVES HONG KONG 3.8M! 5.0M! THAILAND 1.4M! MALAYSIA 19M! JAPAN 660M! BANGLADESH SOUTH KOREA APAC TOTAL 943M! 12M! TAIWAN 22M! 17M! 13M! VIETNAM 24M! PHILIPPINES 2.8M! SINGAPORE INDONESIA 52M! TIMOR76K! LESTE PAPUA 240K! NEW GUINEA FIJI 198K! AUSTRALIA 11M! NEW ZEALAND 1.9M! We Are Social • Sources: Facebook, Tencent. Active monthly user figures; China figures are for QQ. wearesocial.sg • @wearesocialsg • 35
- 36. JAN 2014 SOCIAL MEDIA USERS BY DEVICE ACTIVE SOCIAL MEDIA USERS IN APAC ACCESSING SOCIAL MEDIA ON ANY DEVICE # 969,140,200 We Are Social • Sources: Facebook, Tencent ACTIVE SOCIAL MEDIA USERS IN APAC ACCESSING SOCIAL MEDIA ON MOBILE DEVICES Q # 943,266,600 wearesocial.sg • @wearesocialsg • 36
- 37. JAN 2014 SOCIAL PENETRATION BY DEVICE ACTIVE SOCIAL MEDIA USERS ACCESSING SOCIAL MEDIA ON ANY DEVICE AS A PERCENTAGE OF THE TOTAL POPULATION ACTIVE MOBILE SOCIAL MEDIA USERS AS A PERCENTAGE OF TOTAL ACTIVE SOCIAL MEDIA USERS Q 25.0% ACTIVE SOCIAL MEDIA USERS ACCESSING SOCIAL MEDIA ON MOBILE AS A PERCENTAGE OF THE TOTAL POPULATION Q 24.3% 97.3% We Are Social • Sources: US Census Bureau, Facebook, Tencent wearesocial.sg • @wearesocialsg • 37
- 38. INDIVIDUAL COUNTRY DATA We Are Social wearesocial.sg • @wearesocialsg • 38
- 39. AUSTRALIA We Are Social wearesocial.sg • @wearesocialsg • 39
- 40. AUSTRALIA: SNAPSHOT 22,262,501 89% TOTAL POPULATION URBAN 11%! JAN 2014 RURAL 18,129,727 INTERNET USERS 12,800,000 ACTIVE FACEBOOK USERS 24,400,000 ACTIVE MOBILE SUBSCRIPTIONS We Are Social • Sources: US Census Bureau, InternetWorldStats, Facebook, ITU 81% INTERNET PENETRATION 57% FACEBOOK PENETRATION 110% MOBILE SUBSCRIPTION PENETRATION wearesocial.sg • @wearesocialsg • 40
- 41. JAN 2014 AUSTRALIA: INTERNET INDICATORS AVERAGE TIME THAT INTERNET USERS SPEND USING THE INTERNET EACH DAY THROUGH A DESKTOP OR LAPTOP MOBILE INTERNET PENETRATION AS A PERCENTAGE OF TOTAL POPULATION AVERAGE TIME THAT MOBILE INTERNET USERS SPEND USING MOBILE INTERNET EACH DAY 4H 30M 59% 1H 40M We Are Social • Sources: US Census Bureau, GlobalWebIndex wearesocial.sg • @wearesocialsg • 41
- 42. JAN 2014 AUSTRALIA: SOCIAL INDICATORS SOCIAL MEDIA PENETRATION AS A PERCENTAGE OF THE TOTAL POPULATION AVERAGE TIME SOCIAL MEDIA USERS SPEND ON SOCIAL MEDIA EACH DAY PERCENTAGE OF MOBILE USERS USING SOCIAL MEDIA APPS ON THEIR PHONE PERCENTAGE OF MOBILE USERS USING LOCATION-BASED SERVICES 73% 2H 05M 55% 14% We Are Social • Sources: US Census Bureau, GlobalWebIndex wearesocial.sg • @wearesocialsg • 42
- 43. JAN 2014 AUSTRALIA: SOCIAL MEDIA USE 89% ANY SOCIAL NETWORK 62% 81% FACEBOOK 53% 42% TWITTER 14% 30% GOOGLE+ LINKEDIN INSTAGRAM 14% 23% 11% 15% 7% We Are Social • Source: GlobalWebIndex. Figures represent percentage of internet users. OWN AN ACCOUNT USED IN THE PAST MONTH wearesocial.sg • @wearesocialsg • 43
- 44. JAN 2014 AUSTRALIA: CONTRACT TYPE PERCENTAGE OF TOTAL MOBILE SUBSCRIPTIONS THAT ARE PRE-PAID PERCENTAGE OF TOTAL MOBILE SUBSCRIPTIONS THAT ARE POST-PAID PERCENTAGE OF MOBILE SUBSCRIPTIONS THAT ARE 3G CONNECTIONS 3G 47% We Are Social • Source: GSMA Intelligence 53% 74% wearesocial.sg • @wearesocialsg • 44
- 45. JAN 2014 AUSTRALIA: SMARTPHONE USAGE SMARTPHONE PENETRATION AS A PERCENTAGE OF THE TOTAL POPULATION SMARTPHONE USERS SEARCHING FOR LOCAL INFORMATION VIA THEIR PHONE SMARTPHONE USERS RESEARCHING PRODUCTS VIA THEIR PHONE SMARTPHONE USERS WHO HAVE MADE A PURCHASE VIA THEIR PHONE 65% 90% 78% 41% We Are Social • Source: Google’s “Our Mobile Planet” Report wearesocial.sg • @wearesocialsg • 45
- 46. JAN 2014 AUSTRALIA: MOBILE STATS NUMBER OF ACTIVE MOBILE BROADBAND SUBSCRIPTIONS MOBILE BROADBAND SUBSCRIPTIONS AS A PERCENTAGE OF THE TOTAL POPULATION # 21.4M ACTIVE SOCIAL MEDIA USERS ACCESSING SOCIAL MEDIA ON A MOBILE DEVICE PENETRATION OF MOBILE SOCIAL AS A PERCENTAGE OF THE TOTAL POPULATION # 96% We Are Social • Sources: US Census Bureau, ITU, Facebook 10.8M 49% wearesocial.sg • @wearesocialsg • 46
- 47. BANGLADESH We Are Social wearesocial.sg • @wearesocialsg • 47
- 48. JAN 2014 BANGLADESH: SNAPSHOT 163,654,860 28% 72% TOTAL POPULATION URBAN RURAL 36,500,000 22% INTERNET USERS 5,800,000 ACTIVE FACEBOOK USERS 110,675,000 ACTIVE MOBILE SUBSCRIPTIONS We Are Social • Sources: US Census Bureau, InternetWorldStats, Facebook, ITU INTERNET PENETRATION 4% FACEBOOK PENETRATION 68% MOBILE SUBSCRIPTION PENETRATION wearesocial.sg • @wearesocialsg • 48
- 49. JAN 2014 BANGLADESH: CONTRACT TYPE PERCENTAGE OF TOTAL MOBILE SUBSCRIPTIONS THAT ARE PRE-PAID PERCENTAGE OF TOTAL MOBILE SUBSCRIPTIONS THAT ARE POST-PAID PERCENTAGE OF MOBILE SUBSCRIPTIONS THAT ARE 3G CONNECTIONS 3G 97% We Are Social • Source: GSMA Intelligence 3% 1% wearesocial.sg • @wearesocialsg • 49
- 50. JAN 2014 BANGLADESH: MOBILE STATS NUMBER OF ACTIVE MOBILE BROADBAND SUBSCRIPTIONS MOBILE BROADBAND SUBSCRIPTIONS AS A PERCENTAGE OF THE TOTAL POPULATION # 327K ACTIVE SOCIAL MEDIA USERS ACCESSING SOCIAL MEDIA ON A MOBILE DEVICE PENETRATION OF MOBILE SOCIAL AS A PERCENTAGE OF THE TOTAL POPULATION # 0.2% We Are Social • Sources: US Census Bureau, ITU, Facebook 5.0M 3.1% wearesocial.sg • @wearesocialsg • 50
- 51. BHUTAN We Are Social wearesocial.sg • @wearesocialsg • 51
- 52. JAN 2014 BHUTAN: SNAPSHOT 725,296 36% 64% TOTAL POPULATION URBAN RURAL 182,338 INTERNET USERS 122,000 ACTIVE FACEBOOK USERS 560,890 ACTIVE MOBILE SUBSCRIPTIONS We Are Social • Sources: US Census Bureau, InternetWorldStats, Facebook, ITU 25% INTERNET PENETRATION 17% FACEBOOK PENETRATION 77% MOBILE SUBSCRIPTION PENETRATION wearesocial.sg • @wearesocialsg • 52
- 53. JAN 2014 BHUTAN: CONTRACT TYPE PERCENTAGE OF TOTAL MOBILE SUBSCRIPTIONS THAT ARE PRE-PAID PERCENTAGE OF TOTAL MOBILE SUBSCRIPTIONS THAT ARE POST-PAID PERCENTAGE OF MOBILE SUBSCRIPTIONS THAT ARE 3G CONNECTIONS 3G 97% We Are Social • Source: GSMA Intelligence 3% 3% wearesocial.sg • @wearesocialsg • 53
- 54. JAN 2014 BHUTAN: MOBILE STATS NUMBER OF ACTIVE MOBILE BROADBAND SUBSCRIPTIONS MOBILE BROADBAND SUBSCRIPTIONS AS A PERCENTAGE OF THE TOTAL POPULATION # 18K ACTIVE SOCIAL MEDIA USERS ACCESSING SOCIAL MEDIA ON A MOBILE DEVICE PENETRATION OF MOBILE SOCIAL AS A PERCENTAGE OF THE TOTAL POPULATION # 2.5% We Are Social • Sources: US Census Bureau, ITU, Facebook 94K 13% wearesocial.sg • @wearesocialsg • 54
- 55. BRUNEI DARUSSALAM We Are Social wearesocial.sg • @wearesocialsg • 55
- 56. JAN 2014 BRUNEI: SNAPSHOT 415,717 76% 24% TOTAL POPULATION URBAN RURAL 246,388 INTERNET USERS 260,000 ACTIVE FACEBOOK USERS 469,740 ACTIVE MOBILE SUBSCRIPTIONS We Are Social • Sources: US Census Bureau, InternetWorldStats, Facebook, ITU 59% INTERNET PENETRATION 63% FACEBOOK PENETRATION 113% MOBILE SUBSCRIPTION PENETRATION wearesocial.sg • @wearesocialsg • 56
- 57. JAN 2014 BRUNEI: CONTRACT TYPE PERCENTAGE OF TOTAL MOBILE SUBSCRIPTIONS THAT ARE PRE-PAID PERCENTAGE OF TOTAL MOBILE SUBSCRIPTIONS THAT ARE POST-PAID PERCENTAGE OF MOBILE SUBSCRIPTIONS THAT ARE 3G CONNECTIONS 3G 83% We Are Social • Source: GSMA Intelligence 17% 42% wearesocial.sg • @wearesocialsg • 57
- 58. JAN 2014 BRUNEI: MOBILE STATS NUMBER OF ACTIVE MOBILE BROADBAND SUBSCRIPTIONS MOBILE BROADBAND SUBSCRIPTIONS AS A PERCENTAGE OF THE TOTAL POPULATION # 32K ACTIVE SOCIAL MEDIA USERS ACCESSING SOCIAL MEDIA ON A MOBILE DEVICE PENETRATION OF MOBILE SOCIAL AS A PERCENTAGE OF THE TOTAL POPULATION # 7.6% We Are Social • Sources: US Census Bureau, ITU, Facebook 240K 58% wearesocial.sg • @wearesocialsg • 58
- 59. CAMBODIA We Are Social wearesocial.sg • @wearesocialsg • 59
- 60. JAN 2014 CAMBODIA: SNAPSHOT 15,205,539 20% 80% TOTAL POPULATION URBAN RURAL 738,641 5% INTERNET USERS 1,200,000 ACTIVE FACEBOOK USERS 19,105,115 ACTIVE MOBILE SUBSCRIPTIONS We Are Social • Sources: US Census Bureau, InternetWorldStats, Facebook, ITU INTERNET PENETRATION 8% FACEBOOK PENETRATION 126% MOBILE SUBSCRIPTION PENETRATION wearesocial.sg • @wearesocialsg • 60
- 61. JAN 2014 CAMBODIA: CONTRACT TYPE PERCENTAGE OF TOTAL MOBILE SUBSCRIPTIONS THAT ARE PRE-PAID PERCENTAGE OF TOTAL MOBILE SUBSCRIPTIONS THAT ARE POST-PAID PERCENTAGE OF MOBILE SUBSCRIPTIONS THAT ARE 3G CONNECTIONS 3G 95% We Are Social • Source: GSMA Intelligence 5% 11% wearesocial.sg • @wearesocialsg • 61
- 62. JAN 2014 CAMBODIA: MOBILE STATS NUMBER OF ACTIVE MOBILE BROADBAND SUBSCRIPTIONS MOBILE BROADBAND SUBSCRIPTIONS AS A PERCENTAGE OF THE TOTAL POPULATION # 1.0M ACTIVE SOCIAL MEDIA USERS ACCESSING SOCIAL MEDIA ON A MOBILE DEVICE PENETRATION OF MOBILE SOCIAL AS A PERCENTAGE OF THE TOTAL POPULATION # 6.9% We Are Social • Sources: US Census Bureau, ITU, Facebook 1.1M 7.0% wearesocial.sg • @wearesocialsg • 62
- 63. CHINA We Are Social wearesocial.sg • @wearesocialsg • 63
- 64. JAN 2014 CHINA: DATA SNAPSHOT 1,349,585,838 51% 49% TOTAL POPULATION URBAN RURAL 590,560,000 INTERNET USERS 623,300,000 ACTIVE QZONE USERS 1,206,553,000 ACTIVE MOBILE SUBSCRIPTIONS We Are Social • Sources: US Census Bureau, CNNIC, Tencent, ITU 44% INTERNET PENETRATION 46% QZONE PENETRATION 89% MOBILE SUBSCRIPTION PENETRATION wearesocial.sg • @wearesocialsg • 64
- 65. JAN 2014 CHINA: INTERNET INDICATORS AVERAGE TIME THAT INTERNET USERS SPEND USING THE INTERNET EACH DAY THROUGH A DESKTOP OR LAPTOP MOBILE INTERNET PENETRATION AS A PERCENTAGE OF TOTAL POPULATION AVERAGE TIME THAT MOBILE INTERNET USERS SPEND USING MOBILE INTERNET EACH DAY 4H 31M 43% 1H 55M We Are Social • Sources: US Census Bureau, GlobalWebIndex wearesocial.sg • @wearesocialsg • 65
- 66. JAN 2014 CHINA: SOCIAL INDICATORS SOCIAL MEDIA PENETRATION AS A PERCENTAGE OF THE TOTAL POPULATION AVERAGE TIME SOCIAL MEDIA USERS SPEND ON SOCIAL MEDIA EACH DAY PERCENTAGE OF MOBILE USERS USING SOCIAL MEDIA APPS ON THEIR PHONE PERCENTAGE OF MOBILE USERS USING LOCATION-BASED SERVICES 42% 1H 30M 51% 24% We Are Social • Sources: US Census Bureau, GlobalWebIndex wearesocial.sg • @wearesocialsg • 66
- 67. JAN 2014 CHINA: SOCIAL MEDIA USE 98% ANY SOCIAL NETWORK 87% 83% SINA WEIBO 62% 76% QZONE 53% 75% TENCENT WEIBO YOUKU RENREN 51% 74% 35% 56% 30% We Are Social • Source: GlobalWebIndex. Figures represent percentage of internet users. OWN AN ACCOUNT USED IN THE PAST MONTH wearesocial.sg • @wearesocialsg • 67
- 68. JAN 2014 CHINA: CONTRACT TYPE PERCENTAGE OF TOTAL MOBILE SUBSCRIPTIONS THAT ARE PRE-PAID PERCENTAGE OF TOTAL MOBILE SUBSCRIPTIONS THAT ARE POST-PAID PERCENTAGE OF MOBILE SUBSCRIPTIONS THAT ARE 3G CONNECTIONS 3G 80% We Are Social • Source: GSMA Intelligence 20% 21% wearesocial.sg • @wearesocialsg • 68
- 69. JAN 2014 CHINA: SMARTPHONE USAGE SMARTPHONE PENETRATION AS A PERCENTAGE OF THE TOTAL POPULATION SMARTPHONE USERS SEARCHING FOR LOCAL INFORMATION VIA THEIR PHONE SMARTPHONE USERS RESEARCHING PRODUCTS VIA THEIR PHONE SMARTPHONE USERS WHO HAVE MADE A PURCHASE VIA THEIR PHONE 47% 96% 98% 69% We Are Social • Source: Google’s “Our Mobile Planet” Report wearesocial.sg • @wearesocialsg • 69
- 70. JAN 2014 CHINA: MOBILE STATS NUMBER OF ACTIVE MOBILE BROADBAND SUBSCRIPTIONS MOBILE BROADBAND SUBSCRIPTIONS AS A PERCENTAGE OF THE TOTAL POPULATION # 232M ACTIVE SOCIAL MEDIA USERS ACCESSING SOCIAL MEDIA ON A MOBILE DEVICE PENETRATION OF MOBILE SOCIAL AS A PERCENTAGE OF THE TOTAL POPULATION # 17% 660M Tencent. ‘Active social media users’ is for QQ platform. We Are Social • Sources: US Census Bureau, ITU, Facebook 49% wearesocial.sg • @wearesocialsg • 70
- 71. FIJI We Are Social wearesocial.sg • @wearesocialsg • 71
- 72. JAN 2014 FIJI: SNAPSHOT 896,758 52% 48% TOTAL POPULATION URBAN RURAL 300,326 INTERNET USERS 260,000 ACTIVE FACEBOOK USERS 858,809 ACTIVE MOBILE SUBSCRIPTIONS We Are Social • Sources: US Census Bureau, InternetWorldStats, Facebook, ITU 33% INTERNET PENETRATION 29% FACEBOOK PENETRATION 96% MOBILE SUBSCRIPTION PENETRATION wearesocial.sg • @wearesocialsg • 72
- 73. JAN 2014 FIJI: CONTRACT TYPE PERCENTAGE OF TOTAL MOBILE SUBSCRIPTIONS THAT ARE PRE-PAID PERCENTAGE OF TOTAL MOBILE SUBSCRIPTIONS THAT ARE POST-PAID PERCENTAGE OF MOBILE SUBSCRIPTIONS THAT ARE 3G CONNECTIONS 3G 95% We Are Social • Source: GSMA Intelligence 5% 8% wearesocial.sg • @wearesocialsg • 73
- 74. JAN 2014 FIJI: MOBILE STATS NUMBER OF ACTIVE MOBILE BROADBAND SUBSCRIPTIONS MOBILE BROADBAND SUBSCRIPTIONS AS A PERCENTAGE OF THE TOTAL POPULATION # 97K ACTIVE SOCIAL MEDIA USERS ACCESSING SOCIAL MEDIA ON A MOBILE DEVICE PENETRATION OF MOBILE SOCIAL AS A PERCENTAGE OF THE TOTAL POPULATION # 11% We Are Social • Sources: US Census Bureau, ITU, Facebook 198K 22% wearesocial.sg • @wearesocialsg • 74
- 75. HONG KONG We Are Social wearesocial.sg • @wearesocialsg • 75
- 76. JAN 2014 HONG KONG: SNAPSHOT 7,182,724 TOTAL POPULATION 5,207,762 INTERNET USERS 4,400,000 ACTIVE FACEBOOK USERS 16,403,076 ACTIVE MOBILE SUBSCRIPTIONS We Are Social • Sources: US Census Bureau, InternetWorldStats, Facebook, ITU 100% URBAN 73% INTERNET PENETRATION 61% FACEBOOK PENETRATION 228% MOBILE SUBSCRIPTION PENETRATION wearesocial.sg • @wearesocialsg • 76
- 77. JAN 2014 HONG KONG: INTERNET INDICATORS AVERAGE TIME THAT INTERNET USERS SPEND USING THE INTERNET EACH DAY THROUGH A DESKTOP OR LAPTOP MOBILE INTERNET PENETRATION AS A PERCENTAGE OF TOTAL POPULATION AVERAGE TIME THAT MOBILE INTERNET USERS SPEND USING MOBILE INTERNET EACH DAY 3H 32M 67% 2H 08M We Are Social • Sources: US Census Bureau, GlobalWebIndex wearesocial.sg • @wearesocialsg • 77
- 78. JAN 2014 HONG KONG: SOCIAL INDICATORS SOCIAL MEDIA PENETRATION AS A PERCENTAGE OF THE TOTAL POPULATION AVERAGE TIME SOCIAL MEDIA USERS SPEND ON SOCIAL MEDIA EACH DAY PERCENTAGE OF MOBILE USERS USING SOCIAL MEDIA APPS ON THEIR PHONE PERCENTAGE OF MOBILE USERS USING LOCATION-BASED SERVICES 71% 2H 01M 45% 17% We Are Social • Sources: US Census Bureau, GlobalWebIndex wearesocial.sg • @wearesocialsg • 78
- 79. JAN 2014 HONG KONG: SOCIAL MEDIA USE 96% ANY SOCIAL NETWORK 64% 91% FACEBOOK 53% 58% GOOGLE+ INSTAGRAM SINA WEIBO TWITTER 15% 32% 10% 29% 10% 22% 8% We Are Social • Source: GlobalWebIndex. Figures represent percentage of internet users. wearesocial.sg • @wearesocialsg • 79
- 80. JAN 2014 HONG KONG: CONTRACT TYPE PERCENTAGE OF TOTAL MOBILE SUBSCRIPTIONS THAT ARE PRE-PAID PERCENTAGE OF TOTAL MOBILE SUBSCRIPTIONS THAT ARE POST-PAID PERCENTAGE OF MOBILE SUBSCRIPTIONS THAT ARE 3G CONNECTIONS 3G 49% We Are Social • Source: GSMA Intelligence 51% 57% wearesocial.sg • @wearesocialsg • 80
- 81. JAN 2014 HONG KONG: SMARTPHONE USAGE SMARTPHONE PENETRATION AS A PERCENTAGE OF THE TOTAL POPULATION SMARTPHONE USERS SEARCHING FOR LOCAL INFORMATION VIA THEIR PHONE SMARTPHONE USERS RESEARCHING PRODUCTS VIA THEIR PHONE SMARTPHONE USERS WHO HAVE MADE A PURCHASE VIA THEIR PHONE 63% 92% 89% 43% We Are Social • Source: Google’s “Our Mobile Planet” Report wearesocial.sg • @wearesocialsg • 81
- 82. JAN 2014 HONG KONG: MOBILE STATS NUMBER OF ACTIVE MOBILE BROADBAND SUBSCRIPTIONS MOBILE BROADBAND SUBSCRIPTIONS AS A PERCENTAGE OF THE TOTAL POPULATION # 5.3M ACTIVE SOCIAL MEDIA USERS ACCESSING SOCIAL MEDIA ON A MOBILE DEVICE PENETRATION OF MOBILE SOCIAL AS A PERCENTAGE OF THE TOTAL POPULATION # 74% We Are Social • Sources: US Census Bureau, ITU, Facebook 3.8M 53% wearesocial.sg • @wearesocialsg • 82
- 83. INDIA We Are Social wearesocial.sg • @wearesocialsg • 83
- 84. JAN 2014 INDIA: SNAPSHOT 1,220,800,359 31% 69% TOTAL POPULATION URBAN RURAL 213,000,000 INTERNET USERS 90,000,000 17% INTERNET PENETRATION 7% ACTIVE FACEBOOK USERS FACEBOOK PENETRATION 893,862,000 73% ACTIVE MOBILE SUBSCRIPTIONS We Are Social • Sources: US Census Bureau, IAMAI, Facebook, CIA Factbook MOBILE SUBSCRIPTION PENETRATION wearesocial.sg • @wearesocialsg • 84
- 85. JAN 2014 INDIA: INTERNET INDICATORS AVERAGE TIME THAT INTERNET USERS SPEND USING THE INTERNET EACH DAY THROUGH A DESKTOP OR LAPTOP MOBILE INTERNET PENETRATION AS A PERCENTAGE OF TOTAL POPULATION AVERAGE TIME THAT MOBILE INTERNET USERS SPEND USING MOBILE INTERNET EACH DAY 4H 54M 11% 2H 36M We Are Social • Sources: US Census Bureau, GlobalWebIndex wearesocial.sg • @wearesocialsg • 85
- 86. JAN 2014 INDIA: SOCIAL INDICATORS SOCIAL MEDIA PENETRATION AS A PERCENTAGE OF THE TOTAL POPULATION AVERAGE TIME SOCIAL MEDIA USERS SPEND ON SOCIAL MEDIA EACH DAY PERCENTAGE OF MOBILE USERS USING SOCIAL MEDIA APPS ON THEIR PHONE PERCENTAGE OF MOBILE USERS USING LOCATION-BASED SERVICES 12% 2H 26M 57% 29% We Are Social • Sources: US Census Bureau, GlobalWebIndex wearesocial.sg • @wearesocialsg • 86
- 87. JAN 2014 INDIA: SOCIAL MEDIA USE 97% ANY SOCIAL NETWORK 72% 94% FACEBOOK 55% 78% GOOGLE+ 35% 67% TWITTER 30% 54% LINKEDIN ORKUT 24% 51% 17% We Are Social • Source: GlobalWebIndex. Figures represent percentage of internet users. OWN AN ACCOUNT USED IN THE PAST MONTH wearesocial.sg • @wearesocialsg • 87
- 88. JAN 2014 INDIA: CONTRACT TYPE PERCENTAGE OF TOTAL MOBILE SUBSCRIPTIONS THAT ARE PRE-PAID PERCENTAGE OF TOTAL MOBILE SUBSCRIPTIONS THAT ARE POST-PAID PERCENTAGE OF MOBILE SUBSCRIPTIONS THAT ARE 3G CONNECTIONS 3G 95% We Are Social • Source: GSMA Intelligence 5% 6% wearesocial.sg • @wearesocialsg • 88
- 89. JAN 2014 INDIA: SMARTPHONE USAGE SMARTPHONE PENETRATION AS A PERCENTAGE OF THE TOTAL POPULATION SMARTPHONE USERS SEARCHING FOR LOCAL INFORMATION VIA THEIR PHONE SMARTPHONE USERS RESEARCHING PRODUCTS VIA THEIR PHONE SMARTPHONE USERS WHO HAVE MADE A PURCHASE VIA THEIR PHONE 13% 95% 91% 54% We Are Social • Source: Google’s “Our Mobile Planet” Report wearesocial.sg • @wearesocialsg • 89
- 90. JAN 2014 INDIA: MOBILE STATS NUMBER OF ACTIVE MOBILE BROADBAND SUBSCRIPTIONS MOBILE BROADBAND SUBSCRIPTIONS AS A PERCENTAGE OF THE TOTAL POPULATION # 59.8M ACTIVE SOCIAL MEDIA USERS ACCESSING SOCIAL MEDIA ON A MOBILE DEVICE PENETRATION OF MOBILE SOCIAL AS A PERCENTAGE OF THE TOTAL POPULATION # 4.9% We Are Social • Sources: US Census Bureau, ITU, Facebook 72M 5.9% wearesocial.sg • @wearesocialsg • 90
- 91. INDONESIA We Are Social wearesocial.sg • @wearesocialsg • 91
- 92. JAN 2014 INDONESIA: SNAPSHOT 251,160,124 51% 49% TOTAL POPULATION URBAN RURAL 72,700,000 INTERNET USERS 62,000,000 ACTIVE FACEBOOK USERS 281,963,665 ACTIVE MOBILE SUBSCRIPTIONS We Are Social • Sources: US Census Bureau, InternetWorldStats, Facebook, ITU 29% INTERNET PENETRATION 25% FACEBOOK PENETRATION 112% MOBILE SUBSCRIPTION PENETRATION wearesocial.sg • @wearesocialsg • 92
- 93. JAN 2014 INDONESIA: INTERNET INDICATORS AVERAGE TIME THAT INTERNET USERS SPEND USING THE INTERNET EACH DAY THROUGH A DESKTOP OR LAPTOP MOBILE INTERNET PENETRATION AS A PERCENTAGE OF TOTAL POPULATION AVERAGE TIME THAT MOBILE INTERNET USERS SPEND USING MOBILE INTERNET EACH DAY 5H 27M 14% 2H 30M We Are Social • Sources: US Census Bureau, GlobalWebIndex wearesocial.sg • @wearesocialsg • 93
- 94. JAN 2014 INDONESIA: SOCIAL INDICATORS SOCIAL MEDIA PENETRATION AS A PERCENTAGE OF THE TOTAL POPULATION AVERAGE TIME SOCIAL MEDIA USERS SPEND ON SOCIAL MEDIA EACH DAY PERCENTAGE OF MOBILE USERS USING SOCIAL MEDIA APPS ON THEIR PHONE PERCENTAGE OF MOBILE USERS USING LOCATION-BASED SERVICES 15% 2H 54M 74% 32% We Are Social • Sources: US Census Bureau, GlobalWebIndex wearesocial.sg • @wearesocialsg • 94
- 95. JAN 2014 INDONESIA: SOCIAL MEDIA USE 98% ANY SOCIAL NETWORK 79% 93% FACEBOOK 59% 80% TWITTER 41% 74% GOOGLE+ LINKEDIN INSTAGRAM 33% 39% 15% 32% 12% We Are Social • Source: GlobalWebIndex . Figures represent percentage of internet users. OWN AN ACCOUNT USED IN THE PAST MONTH wearesocial.sg • @wearesocialsg • 95
- 96. JAN 2014 INDONESIA: CONTRACT TYPE PERCENTAGE OF TOTAL MOBILE SUBSCRIPTIONS THAT ARE PRE-PAID PERCENTAGE OF TOTAL MOBILE SUBSCRIPTIONS THAT ARE POST-PAID PERCENTAGE OF MOBILE SUBSCRIPTIONS THAT ARE 3G CONNECTIONS 3G 99% We Are Social • Source: GSMA Intelligence 1% 22% wearesocial.sg • @wearesocialsg • 96
- 97. JAN 2014 INDONESIA: SMARTPHONE USAGE SMARTPHONE PENETRATION AS A PERCENTAGE OF THE TOTAL POPULATION SMARTPHONE USERS SEARCHING FOR LOCAL INFORMATION VIA THEIR PHONE SMARTPHONE USERS RESEARCHING PRODUCTS VIA THEIR PHONE SMARTPHONE USERS WHO HAVE MADE A PURCHASE VIA THEIR PHONE 14% 94% 95% 57% We Are Social • Source: Google’s “Our Mobile Planet” Report wearesocial.sg • @wearesocialsg • 97
- 98. JAN 2014 INDONESIA: MOBILE STATS NUMBER OF ACTIVE MOBILE BROADBAND SUBSCRIPTIONS MOBILE BROADBAND SUBSCRIPTIONS AS A PERCENTAGE OF THE TOTAL POPULATION # 80.1M ACTIVE SOCIAL MEDIA USERS ACCESSING SOCIAL MEDIA ON A MOBILE DEVICE PENETRATION OF MOBILE SOCIAL AS A PERCENTAGE OF THE TOTAL POPULATION # 32% We Are Social • Sources: US Census Bureau, ITU, Facebook 52M 21% wearesocial.sg • @wearesocialsg • 98
- 99. JAPAN We Are Social wearesocial.sg • @wearesocialsg • 99
- 100. JAPAN: SNAPSHOT 127,253,075 91% 9%! JAN 2014 TOTAL POPULATION URBAN RURAL 100,684,474 INTERNET USERS 22,000,000 ACTIVE FACEBOOK USERS 138,362,823 ACTIVE MOBILE SUBSCRIPTIONS We Are Social • Sources: US Census Bureau, InternetWorldStats, Facebook, ITU 79% INTERNET PENETRATION 17% FACEBOOK PENETRATION 109% MOBILE SUBSCRIPTION PENETRATION wearesocial.sg • @wearesocialsg • 100
- 101. JAN 2014 JAPAN: INTERNET INDICATORS AVERAGE TIME THAT INTERNET USERS SPEND USING THE INTERNET EACH DAY THROUGH A DESKTOP OR LAPTOP MOBILE INTERNET PENETRATION AS A PERCENTAGE OF TOTAL POPULATION AVERAGE TIME THAT MOBILE INTERNET USERS SPEND USING MOBILE INTERNET EACH DAY 3H 27M 48% 1H 01M We Are Social • Sources: US Census Bureau, GlobalWebIndex wearesocial.sg • @wearesocialsg • 101
- 102. JAN 2014 JAPAN: SOCIAL INDICATORS SOCIAL MEDIA PENETRATION AS A PERCENTAGE OF THE TOTAL POPULATION AVERAGE TIME SOCIAL MEDIA USERS SPEND ON SOCIAL MEDIA EACH DAY PERCENTAGE OF MOBILE USERS USING SOCIAL MEDIA APPS ON THEIR PHONE PERCENTAGE OF MOBILE USERS USING LOCATION-BASED SERVICES 58% 0H 45M 11% 5% We Are Social • Sources: US Census Bureau, GlobalWebIndex wearesocial.sg • @wearesocialsg • 102
- 103. JAN 2014 JAPAN: SOCIAL MEDIA USE 66% ANY SOCIAL NETWORK 42% 39% TWITTER 22% 38% FACEBOOK MIXI GOOGLE+ TUMBLR 22% 25% 8% 17% 2% 2% 1% We Are Social • Source: GlobalWebIndex . Figures represent percentage of internet users. OWN AN ACCOUNT USED IN THE PAST MONTH wearesocial.sg • @wearesocialsg • 103
- 104. JAN 2014 JAPAN: CONTRACT TYPE PERCENTAGE OF TOTAL MOBILE SUBSCRIPTIONS THAT ARE PRE-PAID PERCENTAGE OF TOTAL MOBILE SUBSCRIPTIONS THAT ARE POST-PAID PERCENTAGE OF MOBILE SUBSCRIPTIONS THAT ARE 3G CONNECTIONS 3G 1% We Are Social • Source: GSMA Intelligence 99% 86% wearesocial.sg • @wearesocialsg • 104
- 105. JAN 2014 JAPAN: SMARTPHONE USAGE SMARTPHONE PENETRATION AS A PERCENTAGE OF THE TOTAL POPULATION SMARTPHONE USERS SEARCHING FOR LOCAL INFORMATION VIA THEIR PHONE SMARTPHONE USERS RESEARCHING PRODUCTS VIA THEIR PHONE SMARTPHONE USERS WHO HAVE MADE A PURCHASE VIA THEIR PHONE 25% 89% 81% 44% We Are Social • Source: Google’s “Our Mobile Planet” Report wearesocial.sg • @wearesocialsg • 105
- 106. JAN 2014 JAPAN: MOBILE STATS NUMBER OF ACTIVE MOBILE BROADBAND SUBSCRIPTIONS MOBILE BROADBAND SUBSCRIPTIONS AS A PERCENTAGE OF THE TOTAL POPULATION # 144M ACTIVE SOCIAL MEDIA USERS ACCESSING SOCIAL MEDIA ON A MOBILE DEVICE PENETRATION OF MOBILE SOCIAL AS A PERCENTAGE OF THE TOTAL POPULATION # 113% We Are Social • Sources: US Census Bureau, ITU, Facebook 19.2M 15% wearesocial.sg • @wearesocialsg • 106
- 107. LAOS We Are Social wearesocial.sg • @wearesocialsg • 107
- 108. JAN 2014 LAOS: SNAPSHOT 6,695,166 34% 66% TOTAL POPULATION URBAN RURAL 707,871 INTERNET USERS 420,000 ACTIVE FACEBOOK USERS 6,492,000 ACTIVE MOBILE SUBSCRIPTIONS We Are Social • Sources: US Census Bureau, InternetWorldStats, Facebook, ITU 11% INTERNET PENETRATION 6% FACEBOOK PENETRATION 97% MOBILE SUBSCRIPTION PENETRATION wearesocial.sg • @wearesocialsg • 108
- 109. JAN 2014 LAOS: CONTRACT TYPE PERCENTAGE OF TOTAL MOBILE SUBSCRIPTIONS THAT ARE PRE-PAID PERCENTAGE OF TOTAL MOBILE SUBSCRIPTIONS THAT ARE POST-PAID PERCENTAGE OF MOBILE SUBSCRIPTIONS THAT ARE 3G CONNECTIONS 3G 98% We Are Social • Source: GSMA Intelligence 2% 11% wearesocial.sg • @wearesocialsg • 109
- 110. JAN 2014 LAOS: MOBILE STATS NUMBER OF ACTIVE MOBILE BROADBAND SUBSCRIPTIONS MOBILE BROADBAND SUBSCRIPTIONS AS A PERCENTAGE OF THE TOTAL POPULATION # 54K ACTIVE SOCIAL MEDIA USERS ACCESSING SOCIAL MEDIA ON A MOBILE DEVICE PENETRATION OF MOBILE SOCIAL AS A PERCENTAGE OF THE TOTAL POPULATION # 0.8% We Are Social • Sources: US Census Bureau, ITU, Facebook 360K 5.4% wearesocial.sg • @wearesocialsg • 110
- 111. MACAU We Are Social wearesocial.sg • @wearesocialsg • 111
- 112. JAN 2014 MACAU: SNAPSHOT 583,003 TOTAL POPULATION 371,512 INTERNET USERS 300,000 ACTIVE FACEBOOK USERS 1,613,457 ACTIVE MOBILE SUBSCRIPTIONS We Are Social • Sources: US Census Bureau, InternetWorldStats, Facebook, ITU 100% URBAN 34% INTERNET PENETRATION 51% FACEBOOK PENETRATION 277% MOBILE SUBSCRIPTION PENETRATION wearesocial.sg • @wearesocialsg • 112
- 113. JAN 2014 MACAU: CONTRACT TYPE PERCENTAGE OF TOTAL MOBILE SUBSCRIPTIONS THAT ARE PRE-PAID PERCENTAGE OF TOTAL MOBILE SUBSCRIPTIONS THAT ARE POST-PAID PERCENTAGE OF MOBILE SUBSCRIPTIONS THAT ARE 3G CONNECTIONS 3G 63% We Are Social • Source: GSMA Intelligence 37% 98% wearesocial.sg • @wearesocialsg • 113
- 114. JAN 2014 MACAU: MOBILE STATS NUMBER OF ACTIVE MOBILE BROADBAND SUBSCRIPTIONS MOBILE BROADBAND SUBSCRIPTIONS AS A PERCENTAGE OF THE TOTAL POPULATION # N/A ACTIVE SOCIAL MEDIA USERS ACCESSING SOCIAL MEDIA ON A MOBILE DEVICE PENETRATION OF MOBILE SOCIAL AS A PERCENTAGE OF THE TOTAL POPULATION # N/A We Are Social • Sources: US Census Bureau, ITU, Facebook 260K 44.6% wearesocial.sg • @wearesocialsg • 114
- 115. MALAYSIA We Are Social wearesocial.sg • @wearesocialsg • 115
- 116. JAN 2014 MALAYSIA: SNAPSHOT 29,628,392 73% 27% TOTAL POPULATION URBAN RURAL 19,200,408 INTERNET USERS 15,600,000 ACTIVE FACEBOOK USERS 41,324,700 ACTIVE MOBILE SUBSCRIPTIONS We Are Social • Sources: US Census Bureau, InternetWorldStats, Facebook, ITU 65% INTERNET PENETRATION 53% FACEBOOK PENETRATION 139% MOBILE SUBSCRIPTION PENETRATION wearesocial.sg • @wearesocialsg • 116
- 117. JAN 2014 MALAYSIA: INTERNET INDICATORS AVERAGE TIME THAT INTERNET USERS SPEND USING THE INTERNET EACH DAY THROUGH A DESKTOP OR LAPTOP MOBILE INTERNET PENETRATION AS A PERCENTAGE OF TOTAL POPULATION AVERAGE TIME THAT MOBILE INTERNET USERS SPEND USING MOBILE INTERNET EACH DAY 5H 36M 58% 3H 03M We Are Social • Sources: US Census Bureau, GlobalWebIndex wearesocial.sg • @wearesocialsg • 117
- 118. JAN 2014 MALAYSIA: SOCIAL INDICATORS SOCIAL MEDIA PENETRATION AS A PERCENTAGE OF THE TOTAL POPULATION AVERAGE TIME SOCIAL MEDIA USERS SPEND ON SOCIAL MEDIA EACH DAY PERCENTAGE OF MOBILE USERS USING SOCIAL MEDIA APPS ON THEIR PHONE PERCENTAGE OF MOBILE USERS USING LOCATION-BASED SERVICES 64% 3H 17M 58% 28% We Are Social • Sources: US Census Bureau, GlobalWebIndex wearesocial.sg • @wearesocialsg • 118
- 119. JAN 2014 MALAYSIA: SOCIAL MEDIA USE 98% ANY SOCIAL NETWORK 72% 95% FACEBOOK 59% 77% GOOGLE+ 32% 57% TWITTER 23% 40% INSTAGRAM LINKEDIN 16% 32% 9% We Are Social • Source: GlobalWebIndex . Figures represent percentage of internet users. wearesocial.sg • @wearesocialsg • 119
- 120. JAN 2014 MALAYSIA: CONTRACT TYPE PERCENTAGE OF TOTAL MOBILE SUBSCRIPTIONS THAT ARE PRE-PAID PERCENTAGE OF TOTAL MOBILE SUBSCRIPTIONS THAT ARE POST-PAID PERCENTAGE OF MOBILE SUBSCRIPTIONS THAT ARE 3G CONNECTIONS 3G 77% We Are Social • Source: GSMA Intelligence 23% 43% wearesocial.sg • @wearesocialsg • 120
- 121. JAN 2014 MALAYSIA: SMARTPHONE USAGE SMARTPHONE PENETRATION AS A PERCENTAGE OF THE TOTAL POPULATION SMARTPHONE USERS SEARCHING FOR LOCAL INFORMATION VIA THEIR PHONE SMARTPHONE USERS RESEARCHING PRODUCTS VIA THEIR PHONE SMARTPHONE USERS WHO HAVE MADE A PURCHASE VIA THEIR PHONE 35% 94% 91% 42% We Are Social • Source: Google’s “Our Mobile Planet” Report wearesocial.sg • @wearesocialsg • 121
- 122. JAN 2014 MALAYSIA: MOBILE STATS NUMBER OF ACTIVE MOBILE BROADBAND SUBSCRIPTIONS MOBILE BROADBAND SUBSCRIPTIONS AS A PERCENTAGE OF THE TOTAL POPULATION # 4.0M ACTIVE SOCIAL MEDIA USERS ACCESSING SOCIAL MEDIA ON A MOBILE DEVICE PENETRATION OF MOBILE SOCIAL AS A PERCENTAGE OF THE TOTAL POPULATION # 14% We Are Social • Sources: US Census Bureau, ITU, Facebook 13M 44% wearesocial.sg • @wearesocialsg • 122
- 123. MALDIVES We Are Social wearesocial.sg • @wearesocialsg • 123
- 124. JAN 2014 MALDIVES: SNAPSHOT 393,988 41% 59% TOTAL POPULATION URBAN RURAL 153,560 INTERNET USERS 174,000 ACTIVE FACEBOOK USERS 560,547 ACTIVE MOBILE SUBSCRIPTIONS We Are Social • Sources: US Census Bureau, InternetWorldStats, Facebook, ITU 39% INTERNET PENETRATION 44% FACEBOOK PENETRATION 142% MOBILE SUBSCRIPTION PENETRATION wearesocial.sg • @wearesocialsg • 124
- 125. JAN 2014 MALDIVES: CONTRACT TYPE PERCENTAGE OF TOTAL MOBILE SUBSCRIPTIONS THAT ARE PRE-PAID PERCENTAGE OF TOTAL MOBILE SUBSCRIPTIONS THAT ARE POST-PAID PERCENTAGE OF MOBILE SUBSCRIPTIONS THAT ARE 3G CONNECTIONS 3G 87% We Are Social • Source: GSMA Intelligence 13% 10% wearesocial.sg • @wearesocialsg • 125
- 126. JAN 2014 MALDIVES: MOBILE STATS NUMBER OF ACTIVE MOBILE BROADBAND SUBSCRIPTIONS MOBILE BROADBAND SUBSCRIPTIONS AS A PERCENTAGE OF THE TOTAL POPULATION # 85K ACTIVE SOCIAL MEDIA USERS ACCESSING SOCIAL MEDIA ON A MOBILE DEVICE PENETRATION OF MOBILE SOCIAL AS A PERCENTAGE OF THE TOTAL POPULATION # 22% We Are Social • Sources: US Census Bureau, ITU, Facebook 134K 34% wearesocial.sg • @wearesocialsg • 126
- 127. MONGOLIA We Are Social wearesocial.sg • @wearesocialsg • 127
- 128. JAN 2014 MONGOLIA: SNAPSHOT 3,226,516 69% 31% TOTAL POPULATION URBAN RURAL 521,520 INTERNET USERS 720,000 ACTIVE FACEBOOK USERS 3,375,205 ACTIVE MOBILE SUBSCRIPTIONS We Are Social • Sources: US Census Bureau, InternetWorldStats, Facebook, ITU 16% INTERNET PENETRATION 22% FACEBOOK PENETRATION 105% MOBILE SUBSCRIPTION PENETRATION wearesocial.sg • @wearesocialsg • 128
- 129. JAN 2014 MONGOLIA: CONTRACT TYPE PERCENTAGE OF TOTAL MOBILE SUBSCRIPTIONS THAT ARE PRE-PAID PERCENTAGE OF TOTAL MOBILE SUBSCRIPTIONS THAT ARE POST-PAID PERCENTAGE OF MOBILE SUBSCRIPTIONS THAT ARE 3G CONNECTIONS 3G 96% We Are Social • Source: GSMA Intelligence 4% 21% wearesocial.sg • @wearesocialsg • 129
- 130. JAN 2014 MONGOLIA: MOBILE STATS NUMBER OF ACTIVE MOBILE BROADBAND SUBSCRIPTIONS MOBILE BROADBAND SUBSCRIPTIONS AS A PERCENTAGE OF THE TOTAL POPULATION # 861K ACTIVE SOCIAL MEDIA USERS ACCESSING SOCIAL MEDIA ON A MOBILE DEVICE PENETRATION OF MOBILE SOCIAL AS A PERCENTAGE OF THE TOTAL POPULATION # 27% We Are Social • Sources: US Census Bureau, ITU, Facebook 540K 17% wearesocial.sg • @wearesocialsg • 130
- 131. MYANMAR We Are Social wearesocial.sg • @wearesocialsg • 131
- 132. JAN 2014 MYANMAR: SNAPSHOT 55,167,330 33% 67% TOTAL POPULATION URBAN RURAL 583,564 1% INTERNET USERS 1,240,000 ACTIVE FACEBOOK USERS 5,440,000 ACTIVE MOBILE SUBSCRIPTIONS We Are Social • Sources: US Census Bureau, InternetWorldStats, Facebook, ITU INTERNET PENETRATION 2% FACEBOOK PENETRATION 10% MOBILE SUBSCRIPTION PENETRATION wearesocial.sg • @wearesocialsg • 132
- 133. JAN 2014 MYANMAR: CONTRACT TYPE PERCENTAGE OF TOTAL MOBILE SUBSCRIPTIONS THAT ARE PRE-PAID PERCENTAGE OF TOTAL MOBILE SUBSCRIPTIONS THAT ARE POST-PAID PERCENTAGE OF MOBILE SUBSCRIPTIONS THAT ARE 3G CONNECTIONS 3G 99% We Are Social • Source: GSMA Intelligence 1% 14% wearesocial.sg • @wearesocialsg • 133
- 134. JAN 2014 MYANMAR: MOBILE STATS NUMBER OF ACTIVE MOBILE BROADBAND SUBSCRIPTIONS MOBILE BROADBAND SUBSCRIPTIONS AS A PERCENTAGE OF THE TOTAL POPULATION # N/A ACTIVE SOCIAL MEDIA USERS ACCESSING SOCIAL MEDIA ON A MOBILE DEVICE PENETRATION OF MOBILE SOCIAL AS A PERCENTAGE OF THE TOTAL POPULATION # N/A We Are Social • Sources: US Census Bureau, ITU, Facebook 1.1M 2.0% wearesocial.sg • @wearesocialsg • 134
- 135. NEPAL We Are Social wearesocial.sg • @wearesocialsg • 135
- 136. JAN 2014 NEPAL: SNAPSHOT 30,430,267 31% 69% TOTAL POPULATION URBAN RURAL 7,300,000 INTERNET USERS 3,200,000 ACTIVE FACEBOOK USERS 16,380,000 ACTIVE MOBILE SUBSCRIPTIONS We Are Social • Sources: US Census Bureau, InternetWorldStats, Facebook, ITU 24% INTERNET PENETRATION 11% FACEBOOK PENETRATION 54% MOBILE SUBSCRIPTION PENETRATION wearesocial.sg • @wearesocialsg • 136
- 137. JAN 2014 NEPAL: CONTRACT TYPE PERCENTAGE OF TOTAL MOBILE SUBSCRIPTIONS THAT ARE PRE-PAID PERCENTAGE OF TOTAL MOBILE SUBSCRIPTIONS THAT ARE POST-PAID PERCENTAGE OF MOBILE SUBSCRIPTIONS THAT ARE 3G CONNECTIONS 3G 94% We Are Social • Source: GSMA Intelligence 6% 2% wearesocial.sg • @wearesocialsg • 137
- 138. JAN 2014 NEPAL: MOBILE STATS NUMBER OF ACTIVE MOBILE BROADBAND SUBSCRIPTIONS MOBILE BROADBAND SUBSCRIPTIONS AS A PERCENTAGE OF THE TOTAL POPULATION # N/A ACTIVE SOCIAL MEDIA USERS ACCESSING SOCIAL MEDIA ON A MOBILE DEVICE PENETRATION OF MOBILE SOCIAL AS A PERCENTAGE OF THE TOTAL POPULATION # N/A We Are Social • Sources: US Census Bureau, ITU, Facebook 2.8M 9.2% wearesocial.sg • @wearesocialsg • 138
- 139. NEW ZEALAND We Are Social wearesocial.sg • @wearesocialsg • 139
- 140. JAN 2014 NEW ZEALAND: SNAPSHOT 4,365,113 86% 14% TOTAL POPULATION URBAN RURAL 3,873,982 INTERNET USERS 2,400,000 ACTIVE FACEBOOK USERS 4,922,000 ACTIVE MOBILE SUBSCRIPTIONS We Are Social • Sources: US Census Bureau, InternetWorldStats, Facebook, ITU 89% INTERNET PENETRATION 55% FACEBOOK PENETRATION 113% MOBILE SUBSCRIPTION PENETRATION wearesocial.sg • @wearesocialsg • 140
- 141. JAN 2014 NEW ZEALAND: CONTRACT TYPE PERCENTAGE OF TOTAL MOBILE SUBSCRIPTIONS THAT ARE PRE-PAID PERCENTAGE OF TOTAL MOBILE SUBSCRIPTIONS THAT ARE POST-PAID PERCENTAGE OF MOBILE SUBSCRIPTIONS THAT ARE 3G CONNECTIONS 3G 65% We Are Social • Source: GSMA Intelligence 35% 65% wearesocial.sg • @wearesocialsg • 141
- 142. JAN 2014 NEW ZEALAND: SMARTPHONE USAGE SMARTPHONE PENETRATION AS A PERCENTAGE OF THE TOTAL POPULATION SMARTPHONE USERS SEARCHING FOR LOCAL INFORMATION VIA THEIR PHONE SMARTPHONE USERS RESEARCHING PRODUCTS VIA THEIR PHONE SMARTPHONE USERS WHO HAVE MADE A PURCHASE VIA THEIR PHONE 54% 89% 74% 33% We Are Social • Source: Google’s “Our Mobile Planet” Report wearesocial.sg • @wearesocialsg • 142
- 143. JAN 2014 NEW ZEALAND: MOBILE STATS NUMBER OF ACTIVE MOBILE BROADBAND SUBSCRIPTIONS MOBILE BROADBAND SUBSCRIPTIONS AS A PERCENTAGE OF THE TOTAL POPULATION # 2.8M ACTIVE SOCIAL MEDIA USERS ACCESSING SOCIAL MEDIA ON A MOBILE DEVICE PENETRATION OF MOBILE SOCIAL AS A PERCENTAGE OF THE TOTAL POPULATION # 65% We Are Social • Sources: US Census Bureau, ITU, Facebook 1.9M 44% wearesocial.sg • @wearesocialsg • 143
- 144. NORTH KOREA We Are Social wearesocial.sg • @wearesocialsg • 144
- 145. JAN 2014 NORTH KOREA: SNAPSHOT 24,720,407 60% 40% TOTAL POPULATION URBAN RURAL [N/A] [N/A] INTERNET USERS 8,200 ACTIVE FACEBOOK USERS 1,700,000 ACTIVE MOBILE SUBSCRIPTIONS We Are Social • Sources: US Census Bureau, InternetWorldStats, Facebook, ITU INTERNET PENETRATION 0.03% FACEBOOK PENETRATION 7% MOBILE SUBSCRIPTION PENETRATION wearesocial.sg • @wearesocialsg • 145
- 146. JAN 2014 NORTH KOREA: CONTRACT TYPE PERCENTAGE OF TOTAL MOBILE SUBSCRIPTIONS THAT ARE PRE-PAID PERCENTAGE OF TOTAL MOBILE SUBSCRIPTIONS THAT ARE POST-PAID PERCENTAGE OF MOBILE SUBSCRIPTIONS THAT ARE 3G CONNECTIONS 3G 100% We Are Social • Source: GSMA Intelligence 0% 100% wearesocial.sg • @wearesocialsg • 146
- 147. JAN 2014 NORTH KOREA: MOBILE STATS NUMBER OF ACTIVE MOBILE BROADBAND SUBSCRIPTIONS MOBILE BROADBAND SUBSCRIPTIONS AS A PERCENTAGE OF THE TOTAL POPULATION # N/A ACTIVE SOCIAL MEDIA USERS ACCESSING SOCIAL MEDIA ON A MOBILE DEVICE PENETRATION OF MOBILE SOCIAL AS A PERCENTAGE OF THE TOTAL POPULATION # N/A We Are Social • Sources: US Census Bureau, ITU, Facebook 4,600 ~0% wearesocial.sg • @wearesocialsg • 147
- 148. PAKISTAN We Are Social wearesocial.sg • @wearesocialsg • 148
- 149. JAN 2014 PAKISTAN: SNAPSHOT 193,238,868 36% 64% TOTAL POPULATION URBAN RURAL 19,800,000 INTERNET USERS 11,400,000 ACTIVE FACEBOOK USERS 129,583,076 ACTIVE MOBILE SUBSCRIPTIONS We Are Social • Sources: US Census Bureau, InternetWorldStats, Facebook, ITU 10% INTERNET PENETRATION 6% FACEBOOK PENETRATION 67% MOBILE SUBSCRIPTION PENETRATION wearesocial.sg • @wearesocialsg • 149
- 150. JAN 2014 PAKISTAN: CONTRACT TYPE PERCENTAGE OF TOTAL MOBILE SUBSCRIPTIONS THAT ARE PRE-PAID PERCENTAGE OF TOTAL MOBILE SUBSCRIPTIONS THAT ARE POST-PAID PERCENTAGE OF MOBILE SUBSCRIPTIONS THAT ARE 3G CONNECTIONS 3G 97% We Are Social • Source: GSMA Intelligence 3% 3% wearesocial.sg • @wearesocialsg • 150
- 151. JAN 2014 PAKISTAN: MOBILE STATS NUMBER OF ACTIVE MOBILE BROADBAND SUBSCRIPTIONS MOBILE BROADBAND SUBSCRIPTIONS AS A PERCENTAGE OF THE TOTAL POPULATION # 580K ACTIVE SOCIAL MEDIA USERS ACCESSING SOCIAL MEDIA ON A MOBILE DEVICE PENETRATION OF MOBILE SOCIAL AS A PERCENTAGE OF THE TOTAL POPULATION # 0.3% We Are Social • Sources: US Census Bureau, ITU, Facebook 7.6M 3.9% wearesocial.sg • @wearesocialsg • 151
- 152. PAPUA NEW GUINEA We Are Social wearesocial.sg • @wearesocialsg • 152
- 153. JAN 2014 PAPUA NEW GUINEA: SNAPSHOT 6,341,902 13% 87% TOTAL POPULATION URBAN RURAL 145,256 2% INTERNET USERS 260,000 ACTIVE FACEBOOK USERS INTERNET PENETRATION 4% FACEBOOK PENETRATION 2,709,000 ACTIVE MOBILE SUBSCRIPTIONS 42% MOBILE SUBSCRIPTION PENETRATION We Are Social • Sources: US Census Bureau, InternetWorldStats, CNNIC, Tencent, Facebook, ITU, CIA wearesocial.sg • @wearesocialsg • 153
- 154. JAN 2014 PAPUA NEW GUINEA: CONTRACT TYPE PERCENTAGE OF TOTAL MOBILE SUBSCRIPTIONS THAT ARE PRE-PAID PERCENTAGE OF TOTAL MOBILE SUBSCRIPTIONS THAT ARE POST-PAID PERCENTAGE OF MOBILE SUBSCRIPTIONS THAT ARE 3G CONNECTIONS 3G 84% We Are Social • Source: GSMA Intelligence 16% 8% wearesocial.sg • @wearesocialsg • 154
- 155. JAN 2014 PAPUA NEW GUINEA: MOBILE STATS NUMBER OF ACTIVE MOBILE BROADBAND SUBSCRIPTIONS MOBILE BROADBAND SUBSCRIPTIONS AS A PERCENTAGE OF THE TOTAL POPULATION # N/A ACTIVE SOCIAL MEDIA USERS ACCESSING SOCIAL MEDIA ON A MOBILE DEVICE PENETRATION OF MOBILE SOCIAL AS A PERCENTAGE OF THE TOTAL POPULATION # N/A We Are Social • Sources: US Census Bureau, ITU, Facebook 240K 3.7% wearesocial.sg • @wearesocialsg • 155
- 156. PHILIPPINES We Are Social wearesocial.sg • @wearesocialsg • 156
- 157. JAN 2014 PHILIPPINES: SNAPSHOT 105,720,644 49% 51% TOTAL POPULATION URBAN RURAL 37,602,976 INTERNET USERS 34,000,000 ACTIVE FACEBOOK USERS 106,987,098 ACTIVE MOBILE SUBSCRIPTIONS We Are Social • Sources: US Census Bureau, InternetWorldStats, Facebook, ITU 36% INTERNET PENETRATION 32% FACEBOOK PENETRATION 101% MOBILE SUBSCRIPTION PENETRATION wearesocial.sg • @wearesocialsg • 157
- 158. JAN 2014 PHILIPPINES: INTERNET INDICATORS AVERAGE TIME THAT INTERNET USERS SPEND USING THE INTERNET EACH DAY THROUGH A DESKTOP OR LAPTOP MOBILE INTERNET PENETRATION AS A PERCENTAGE OF TOTAL POPULATION AVERAGE TIME THAT MOBILE INTERNET USERS SPEND USING MOBILE INTERNET EACH DAY 6H 12M 31% 2H 48M We Are Social • Sources: US Census Bureau, GlobalWebIndex wearesocial.sg • @wearesocialsg • 158
- 159. JAN 2014 PHILIPPINES: SOCIAL INDICATORS SOCIAL MEDIA PENETRATION AS A PERCENTAGE OF THE TOTAL POPULATION AVERAGE TIME SOCIAL MEDIA USERS SPEND ON SOCIAL MEDIA EACH DAY PERCENTAGE OF MOBILE USERS USING SOCIAL MEDIA APPS ON THEIR PHONE PERCENTAGE OF MOBILE USERS USING LOCATION-BASED SERVICES 35% 4H 01M 62% 29% We Are Social • Sources: US Census Bureau, GlobalWebIndex wearesocial.sg • @wearesocialsg • 159
- 160. JAN 2014 PHILIPPINES: SOCIAL MEDIA USE 98% ANY SOCIAL NETWORK 78% 97% FACEBOOK 69% 81% TWITTER 40% 69% GOOGLE+ 39% 42% INSTAGRAM LINKEDIN 20% 39% 14% We Are Social • Source: GlobalWebIndex . Figures represent percentage of internet users. wearesocial.sg • @wearesocialsg • 160
- 161. JAN 2014 PHILIPPINES: CONTRACT TYPE PERCENTAGE OF TOTAL MOBILE SUBSCRIPTIONS THAT ARE PRE-PAID PERCENTAGE OF TOTAL MOBILE SUBSCRIPTIONS THAT ARE POST-PAID PERCENTAGE OF MOBILE SUBSCRIPTIONS THAT ARE 3G CONNECTIONS 3G 96% We Are Social • Source: GSMA Intelligence 4% 30% wearesocial.sg • @wearesocialsg • 161
- 162. JAN 2014 PHILIPPINES: SMARTPHONE USAGE SMARTPHONE PENETRATION AS A PERCENTAGE OF THE TOTAL POPULATION SMARTPHONE USERS SEARCHING FOR LOCAL INFORMATION VIA THEIR PHONE SMARTPHONE USERS RESEARCHING PRODUCTS VIA THEIR PHONE SMARTPHONE USERS WHO HAVE MADE A PURCHASE VIA THEIR PHONE 39% 93% 88% 32% We Are Social • Source: Google’s “Our Mobile Planet” Report wearesocial.sg • @wearesocialsg • 162
- 163. JAN 2014 PHILIPPINES: MOBILE STATS NUMBER OF ACTIVE MOBILE BROADBAND SUBSCRIPTIONS MOBILE BROADBAND SUBSCRIPTIONS AS A PERCENTAGE OF THE TOTAL POPULATION # 4.0M ACTIVE SOCIAL MEDIA USERS ACCESSING SOCIAL MEDIA ON A MOBILE DEVICE PENETRATION OF MOBILE SOCIAL AS A PERCENTAGE OF THE TOTAL POPULATION # 3.8% We Are Social • Sources: US Census Bureau, ITU, Facebook 24M 23% wearesocial.sg • @wearesocialsg • 163
- 164. SINGAPORE We Are Social wearesocial.sg • @wearesocialsg • 164
- 165. JAN 2014 SINGAPORE: SNAPSHOT 5,460,302 TOTAL POPULATION 100% URBAN 3,971,318 INTERNET USERS 3,200,000 ACTIVE FACEBOOK USERS 8,063,000 ACTIVE MOBILE SUBSCRIPTIONS We Are Social • Sources: US Census Bureau, InternetWorldStats, Facebook, ITU 73% INTERNET PENETRATION 59% FACEBOOK PENETRATION 148% MOBILE SUBSCRIPTION PENETRATION wearesocial.sg • @wearesocialsg • 165
- 166. JAN 2014 SINGAPORE: INTERNET INDICATORS AVERAGE TIME THAT INTERNET USERS SPEND USING THE INTERNET EACH DAY THROUGH A DESKTOP OR LAPTOP MOBILE INTERNET PENETRATION AS A PERCENTAGE OF TOTAL POPULATION AVERAGE TIME THAT MOBILE INTERNET USERS SPEND USING MOBILE INTERNET EACH DAY 5H 16M 64% 1H 57M We Are Social • Sources: US Census Bureau, GlobalWebIndex wearesocial.sg • @wearesocialsg • 166
- 167. JAN 2014 SINGAPORE: SOCIAL INDICATORS SOCIAL MEDIA PENETRATION AS A PERCENTAGE OF THE TOTAL POPULATION AVERAGE TIME SOCIAL MEDIA USERS SPEND ON SOCIAL MEDIA EACH DAY PERCENTAGE OF MOBILE USERS USING SOCIAL MEDIA APPS ON THEIR PHONE PERCENTAGE OF MOBILE USERS USING LOCATION-BASED SERVICES 70% 2H 10M 49% 18% We Are Social • Sources: US Census Bureau, GlobalWebIndex wearesocial.sg • @wearesocialsg • 167
- 168. JAN 2014 SINGAPORE: SOCIAL MEDIA USE 96% ANY SOCIAL NETWORK 68% 92% FACEBOOK 59% 54% TWITTER 19% 45% GOOGLE+ LINKEDIN INSTAGRAM 18% 36% 13% 25% 12% We Are Social • Source: GlobalWebIndex . Figures represent percentage of internet users. OWN AN ACCOUNT USED IN THE PAST MONTH wearesocial.sg • @wearesocialsg • 168
- 169. JAN 2014 SINGAPORE: CONTRACT TYPE PERCENTAGE OF TOTAL MOBILE SUBSCRIPTIONS THAT ARE PRE-PAID PERCENTAGE OF TOTAL MOBILE SUBSCRIPTIONS THAT ARE POST-PAID PERCENTAGE OF MOBILE SUBSCRIPTIONS THAT ARE 3G CONNECTIONS 3G 47% We Are Social • Source: GSMA Intelligence 53% 55% wearesocial.sg • @wearesocialsg • 169
- 170. JAN 2014 SINGAPORE: SMARTPHONE USAGE SMARTPHONE PENETRATION AS A PERCENTAGE OF THE TOTAL POPULATION SMARTPHONE USERS SEARCHING FOR LOCAL INFORMATION VIA THEIR PHONE SMARTPHONE USERS RESEARCHING PRODUCTS VIA THEIR PHONE SMARTPHONE USERS WHO HAVE MADE A PURCHASE VIA THEIR PHONE 72% 96% 87% 44% We Are Social • Source: Google’s “Our Mobile Planet” Report wearesocial.sg • @wearesocialsg • 170
- 171. JAN 2014 SINGAPORE: MOBILE STATS NUMBER OF ACTIVE MOBILE BROADBAND SUBSCRIPTIONS MOBILE BROADBAND SUBSCRIPTIONS AS A PERCENTAGE OF THE TOTAL POPULATION # 6.7M ACTIVE SOCIAL MEDIA USERS ACCESSING SOCIAL MEDIA ON A MOBILE DEVICE PENETRATION OF MOBILE SOCIAL AS A PERCENTAGE OF THE TOTAL POPULATION # 123% We Are Social • Sources: US Census Bureau, ITU, Facebook 2.8M 51% wearesocial.sg • @wearesocialsg • 171
- 172. SOUTH KOREA We Are Social wearesocial.sg • @wearesocialsg • 172
- 173. JAN 2014 SOUTH KOREA: SNAPSHOT 48,955,203 83% 17% TOTAL POPULATION URBAN RURAL 41,091,681 INTERNET USERS 13,000,000 ACTIVE FACEBOOK USERS 53,624,427 ACTIVE MOBILE SUBSCRIPTIONS We Are Social • Sources: US Census Bureau, InternetWorldStats, Facebook, ITU 84% INTERNET PENETRATION 27% FACEBOOK PENETRATION 110% MOBILE SUBSCRIPTION PENETRATION wearesocial.sg • @wearesocialsg • 173
- 174. JAN 2014 SOUTH KOREA: INTERNET INDICATORS AVERAGE TIME THAT INTERNET USERS SPEND USING THE INTERNET EACH DAY THROUGH A DESKTOP OR LAPTOP MOBILE INTERNET PENETRATION AS A PERCENTAGE OF TOTAL POPULATION AVERAGE TIME THAT MOBILE INTERNET USERS SPEND USING MOBILE INTERNET EACH DAY 3H 27M 75% 1H 35M We Are Social • Sources: US Census Bureau, GlobalWebIndex wearesocial.sg • @wearesocialsg • 174
- 175. JAN 2014 SOUTH KOREA: SOCIAL INDICATORS SOCIAL MEDIA PENETRATION AS A PERCENTAGE OF THE TOTAL POPULATION AVERAGE TIME SOCIAL MEDIA USERS SPEND ON SOCIAL MEDIA EACH DAY PERCENTAGE OF MOBILE USERS USING SOCIAL MEDIA APPS ON THEIR PHONE PERCENTAGE OF MOBILE USERS USING LOCATION-BASED SERVICES 74% 1H 01M 37% 17% We Are Social • Sources: US Census Bureau, GlobalWebIndex wearesocial.sg • @wearesocialsg • 175
- 176. JAN 2014 SOUTH KOREA: SOCIAL MEDIA USE 84% ANY SOCIAL NETWORK 48% 75% FACEBOOK 36% 56% TWITTER GOOGLE+ ME2DAY NATE CONNECT 22% 38% 7% 33% 7% 8% 1% We Are Social • Source: GlobalWebIndex . Figures represent percentage of internet users. OWN AN ACCOUNT USED IN THE PAST MONTH wearesocial.sg • @wearesocialsg • 176
- 177. JAN 2014 SOUTH KOREA: CONTRACT TYPE PERCENTAGE OF TOTAL MOBILE SUBSCRIPTIONS THAT ARE PRE-PAID PERCENTAGE OF TOTAL MOBILE SUBSCRIPTIONS THAT ARE POST-PAID PERCENTAGE OF MOBILE SUBSCRIPTIONS THAT ARE 3G CONNECTIONS 3G 3% We Are Social • Source: GSMA Intelligence 97% 64% wearesocial.sg • @wearesocialsg • 177
- 178. JAN 2014 SOUTH KOREA: SMARTPHONE USAGE SMARTPHONE PENETRATION AS A PERCENTAGE OF THE TOTAL POPULATION SMARTPHONE USERS SEARCHING FOR LOCAL INFORMATION VIA THEIR PHONE SMARTPHONE USERS RESEARCHING PRODUCTS VIA THEIR PHONE SMARTPHONE USERS WHO HAVE MADE A PURCHASE VIA THEIR PHONE 73% 94% 94% 56% We Are Social • Source: Google’s “Our Mobile Planet” Report wearesocial.sg • @wearesocialsg • 178
- 179. JAN 2014 SOUTH KOREA: MOBILE STATS NUMBER OF ACTIVE MOBILE BROADBAND SUBSCRIPTIONS MOBILE BROADBAND SUBSCRIPTIONS AS A PERCENTAGE OF THE TOTAL POPULATION # 51.9M ACTIVE SOCIAL MEDIA USERS ACCESSING SOCIAL MEDIA ON A MOBILE DEVICE PENETRATION OF MOBILE SOCIAL AS A PERCENTAGE OF THE TOTAL POPULATION # 106% We Are Social • Sources: US Census Bureau, ITU, Facebook 11.4M 23% wearesocial.sg • @wearesocialsg • 179
- 180. SRI LANKA We Are Social wearesocial.sg • @wearesocialsg • 180
- 181. JAN 2014 SRI LANKA: SNAPSHOT 21,675,648 TOTAL POPULATION 3,927,948 INTERNET USERS 2,000,000 ACTIVE FACEBOOK USERS 20,324,070 ACTIVE MOBILE SUBSCRIPTIONS We Are Social • Sources: US Census Bureau, InternetWorldStats, Facebook, ITU 15% 85% URBAN RURAL 18% INTERNET PENETRATION 9% FACEBOOK PENETRATION 94% MOBILE SUBSCRIPTION PENETRATION wearesocial.sg • @wearesocialsg • 181
- 182. JAN 2014 SRI LANKA: CONTRACT TYPE PERCENTAGE OF TOTAL MOBILE SUBSCRIPTIONS THAT ARE PRE-PAID PERCENTAGE OF TOTAL MOBILE SUBSCRIPTIONS THAT ARE POST-PAID PERCENTAGE OF MOBILE SUBSCRIPTIONS THAT ARE 3G CONNECTIONS 3G 91% We Are Social • Source: GSMA Intelligence 9% 13% wearesocial.sg • @wearesocialsg • 182
- 183. JAN 2014 SRI LANKA: MOBILE STATS NUMBER OF ACTIVE MOBILE BROADBAND SUBSCRIPTIONS MOBILE BROADBAND SUBSCRIPTIONS AS A PERCENTAGE OF THE TOTAL POPULATION # 953K ACTIVE SOCIAL MEDIA USERS ACCESSING SOCIAL MEDIA ON A MOBILE DEVICE PENETRATION OF MOBILE SOCIAL AS A PERCENTAGE OF THE TOTAL POPULATION # 4.4% We Are Social • Sources: US Census Bureau, ITU, Facebook 1.4M 6.6% wearesocial.sg • @wearesocialsg • 183
- 184. TAIWAN We Are Social wearesocial.sg • @wearesocialsg • 184
- 185. JAN 2014 TAIWAN: SNAPSHOT 23,299,716 78% 22% TOTAL POPULATION URBAN RURAL 17,656,414 INTERNET USERS 15,000,000 ACTIVE FACEBOOK USERS 29,455,219 ACTIVE MOBILE SUBSCRIPTIONS We Are Social • Sources: US Census Bureau, InternetWorldStats, Facebook, ITU 76% INTERNET PENETRATION 64% FACEBOOK PENETRATION 126% MOBILE SUBSCRIPTION PENETRATION wearesocial.sg • @wearesocialsg • 185
- 186. JAN 2014 TAIWAN: INTERNET INDICATORS AVERAGE TIME THAT INTERNET USERS SPEND USING THE INTERNET EACH DAY THROUGH A DESKTOP OR LAPTOP MOBILE INTERNET PENETRATION AS A PERCENTAGE OF TOTAL POPULATION AVERAGE TIME THAT MOBILE INTERNET USERS SPEND USING MOBILE INTERNET EACH DAY 4H 40M 62% 2H 19M We Are Social • Sources: US Census Bureau, GlobalWebIndex wearesocial.sg • @wearesocialsg • 186
- 187. JAN 2014 TAIWAN: SOCIAL INDICATORS SOCIAL MEDIA PENETRATION AS A PERCENTAGE OF THE TOTAL POPULATION AVERAGE TIME SOCIAL MEDIA USERS SPEND ON SOCIAL MEDIA EACH DAY PERCENTAGE OF MOBILE USERS USING SOCIAL MEDIA APPS ON THEIR PHONE PERCENTAGE OF MOBILE USERS USING LOCATION-BASED SERVICES 73% 2H 24M 41% 23% We Are Social • Sources: US Census Bureau, GlobalWebIndex wearesocial.sg • @wearesocialsg • 187
- 188. JAN 2014 TAIWAN: SOCIAL MEDIA USE 95% ANY SOCIAL NETWORK 67% 92% FACEBOOK 60% 70% GOOGLE+ TWITTER #N/A PLURK 25% 25% 7% 23% #N/A 18% 5% We Are Social • Source: GlobalWebIndex . Figures represent percentage of internet users. wearesocial.sg • @wearesocialsg • 188
- 189. JAN 2014 TAIWAN: CONTRACT TYPE PERCENTAGE OF TOTAL MOBILE SUBSCRIPTIONS THAT ARE PRE-PAID PERCENTAGE OF TOTAL MOBILE SUBSCRIPTIONS THAT ARE POST-PAID PERCENTAGE OF MOBILE SUBSCRIPTIONS THAT ARE 3G CONNECTIONS 3G 14% We Are Social • Source: GSMA Intelligence 86% 70% wearesocial.sg • @wearesocialsg • 189
- 190. JAN 2014 TAIWAN: SMARTPHONE USAGE SMARTPHONE PENETRATION AS A PERCENTAGE OF THE TOTAL POPULATION SMARTPHONE USERS SEARCHING FOR LOCAL INFORMATION VIA THEIR PHONE SMARTPHONE USERS RESEARCHING PRODUCTS VIA THEIR PHONE SMARTPHONE USERS WHO HAVE MADE A PURCHASE VIA THEIR PHONE 51% 95% 87% 37% We Are Social • Source: Google’s “Our Mobile Planet” Report wearesocial.sg • @wearesocialsg • 190
- 191. JAN 2014 TAIWAN: MOBILE STATS NUMBER OF ACTIVE MOBILE BROADBAND SUBSCRIPTIONS MOBILE BROADBAND SUBSCRIPTIONS AS A PERCENTAGE OF THE TOTAL POPULATION # 10.7M ACTIVE SOCIAL MEDIA USERS ACCESSING SOCIAL MEDIA ON A MOBILE DEVICE PENETRATION OF MOBILE SOCIAL AS A PERCENTAGE OF THE TOTAL POPULATION # 46% We Are Social • Sources: US Census Bureau, ITU, Facebook 12.2M 53% wearesocial.sg • @wearesocialsg • 191
- 192. THAILAND We Are Social wearesocial.sg • @wearesocialsg • 192
- 193. JAN 2014 THAILAND: SNAPSHOT 67,448,120 34% 66% TOTAL POPULATION URBAN RURAL 23,860,000 INTERNET USERS 24,000,000 ACTIVE FACEBOOK USERS 84,075,036 ACTIVE MOBILE SUBSCRIPTIONS We Are Social • Sources: US Census Bureau, InternetWorldStats, Facebook, ITU 35% INTERNET PENETRATION 36% FACEBOOK PENETRATION 125% MOBILE SUBSCRIPTION PENETRATION wearesocial.sg • @wearesocialsg • 193
- 194. JAN 2014 THAILAND: INTERNET INDICATORS AVERAGE TIME THAT INTERNET USERS SPEND USING THE INTERNET EACH DAY THROUGH A DESKTOP OR LAPTOP MOBILE INTERNET PENETRATION AS A PERCENTAGE OF TOTAL POPULATION AVERAGE TIME THAT MOBILE INTERNET USERS SPEND USING MOBILE INTERNET EACH DAY 5H 07M 24% 3H 04M We Are Social • Sources: US Census Bureau, GlobalWebIndex wearesocial.sg • @wearesocialsg • 194
- 195. JAN 2014 THAILAND: SOCIAL INDICATORS SOCIAL MEDIA PENETRATION AS A PERCENTAGE OF THE TOTAL POPULATION AVERAGE TIME SOCIAL MEDIA USERS SPEND ON SOCIAL MEDIA EACH DAY PERCENTAGE OF MOBILE USERS USING SOCIAL MEDIA APPS ON THEIR PHONE PERCENTAGE OF MOBILE USERS USING LOCATION-BASED SERVICES 25% 3H 39M 50% 36% We Are Social • Sources: US Census Bureau, GlobalWebIndex wearesocial.sg • @wearesocialsg • 195
- 196. JAN 2014 THAILAND: SOCIAL MEDIA USE 97% ANY SOCIAL NETWORK 76% 96% FACEBOOK 68% 69% GOOGLE+ 36% 57% TWITTER 32% 40% INSTAGRAM LINKEDIN 22% 23% 7% We Are Social • Source: GlobalWebIndex . Figures represent percentage of internet users. OWN AN ACCOUNT USED IN THE PAST MONTH wearesocial.sg • @wearesocialsg • 196
- 197. JAN 2014 THAILAND: CONTRACT TYPE PERCENTAGE OF TOTAL MOBILE SUBSCRIPTIONS THAT ARE PRE-PAID PERCENTAGE OF TOTAL MOBILE SUBSCRIPTIONS THAT ARE POST-PAID PERCENTAGE OF MOBILE SUBSCRIPTIONS THAT ARE 3G CONNECTIONS 3G 89% We Are Social • Source: GSMA Intelligence 11% 12% wearesocial.sg • @wearesocialsg • 197
- 198. JAN 2014 THAILAND: SMARTPHONE USAGE SMARTPHONE PENETRATION AS A PERCENTAGE OF THE TOTAL POPULATION SMARTPHONE USERS SEARCHING FOR LOCAL INFORMATION VIA THEIR PHONE SMARTPHONE USERS RESEARCHING PRODUCTS VIA THEIR PHONE SMARTPHONE USERS WHO HAVE MADE A PURCHASE VIA THEIR PHONE 31% 95% 94% 51% We Are Social • Source: Google’s “Our Mobile Planet” Report wearesocial.sg • @wearesocialsg • 198
- 199. JAN 2014 THAILAND: MOBILE STATS NUMBER OF ACTIVE MOBILE BROADBAND SUBSCRIPTIONS MOBILE BROADBAND SUBSCRIPTIONS AS A PERCENTAGE OF THE TOTAL POPULATION # 67K ACTIVE SOCIAL MEDIA USERS ACCESSING SOCIAL MEDIA ON A MOBILE DEVICE PENETRATION OF MOBILE SOCIAL AS A PERCENTAGE OF THE TOTAL POPULATION # 0.1% We Are Social • Sources: US Census Bureau, ITU, Facebook 22M 33% wearesocial.sg • @wearesocialsg • 199
- 200. TIMOR-LESTE We Are Social wearesocial.sg • @wearesocialsg • 200
- 201. JAN 2014 TIMOR-LESTE: SNAPSHOT 1,172,390 28% 72% TOTAL POPULATION URBAN RURAL 10,461 INTERNET USERS 76,000 ACTIVE FACEBOOK USERS 621,000 ACTIVE MOBILE SUBSCRIPTIONS We Are Social • Sources: US Census Bureau, InternetWorldStats, Facebook, ITU 1% INTERNET PENETRATION 6% FACEBOOK PENETRATION 53% MOBILE SUBSCRIPTION PENETRATION wearesocial.sg • @wearesocialsg • 201
- 202. JAN 2014 TIMOR-LESTE: CONTRACT TYPE PERCENTAGE OF TOTAL MOBILE SUBSCRIPTIONS THAT ARE PRE-PAID PERCENTAGE OF TOTAL MOBILE SUBSCRIPTIONS THAT ARE POST-PAID PERCENTAGE OF MOBILE SUBSCRIPTIONS THAT ARE 3G CONNECTIONS 3G 98% We Are Social • Source: GSMA Intelligence 2% N/A wearesocial.sg • @wearesocialsg • 202
- 203. JAN 2014 TIMOR-LESTE: MOBILE STATS NUMBER OF ACTIVE MOBILE BROADBAND SUBSCRIPTIONS MOBILE BROADBAND SUBSCRIPTIONS AS A PERCENTAGE OF THE TOTAL POPULATION # N/A ACTIVE SOCIAL MEDIA USERS ACCESSING SOCIAL MEDIA ON A MOBILE DEVICE PENETRATION OF MOBILE SOCIAL AS A PERCENTAGE OF THE TOTAL POPULATION # N/A We Are Social • Sources: US Census Bureau, ITU, Facebook 76K 6.5% wearesocial.sg • @wearesocialsg • 203
- 204. VIETNAM We Are Social wearesocial.sg • @wearesocialsg • 204
- 205. JAN 2014 VIETNAM: SNAPSHOT 92,477,857 31% 69% TOTAL POPULATION URBAN RURAL 36,140,967 INTERNET USERS 20,000,000 ACTIVE FACEBOOK USERS 134,066,000 ACTIVE MOBILE SUBSCRIPTIONS We Are Social • Sources: US Census Bureau, InternetWorldStats, Facebook, ITU 39% INTERNET PENETRATION 22% FACEBOOK PENETRATION 145% MOBILE SUBSCRIPTION PENETRATION wearesocial.sg • @wearesocialsg • 205
- 206. JAN 2014 VIETNAM: INTERNET INDICATORS AVERAGE TIME THAT INTERNET USERS SPEND USING THE INTERNET EACH DAY THROUGH A DESKTOP OR LAPTOP MOBILE INTERNET PENETRATION AS A PERCENTAGE OF TOTAL POPULATION AVERAGE TIME THAT MOBILE INTERNET USERS SPEND USING MOBILE INTERNET EACH DAY 4H 37M 34% 1H 43M We Are Social • Sources: US Census Bureau, GlobalWebIndex wearesocial.sg • @wearesocialsg • 206
- 207. JAN 2014 VIETNAM: SOCIAL INDICATORS SOCIAL MEDIA PENETRATION AS A PERCENTAGE OF THE TOTAL POPULATION AVERAGE TIME SOCIAL MEDIA USERS SPEND ON SOCIAL MEDIA EACH DAY PERCENTAGE OF MOBILE USERS USING SOCIAL MEDIA APPS ON THEIR PHONE PERCENTAGE OF MOBILE USERS USING LOCATION-BASED SERVICES 38% 2H 23M 58% 25% We Are Social • Sources: US Census Bureau, GlobalWebIndex wearesocial.sg • @wearesocialsg • 207
- 208. JAN 2014 VIETNAM: SOCIAL MEDIA USE 97% ANY SOCIAL NETWORK 81% 95% FACEBOOK 67% 76% GOOGLE+ 34% 45% TWITTER LINKEDIN PINTEREST 16% 22% 8% 18% 5% We Are Social • Source: GlobalWebIndex . Figures represent percentage of internet users. wearesocial.sg • @wearesocialsg • 208
- 209. JAN 2014 VIETNAM: CONTRACT TYPE PERCENTAGE OF TOTAL MOBILE SUBSCRIPTIONS THAT ARE PRE-PAID PERCENTAGE OF TOTAL MOBILE SUBSCRIPTIONS THAT ARE POST-PAID PERCENTAGE OF MOBILE SUBSCRIPTIONS THAT ARE 3G CONNECTIONS 3G 89% We Are Social • Source: GSMA Intelligence 11% 16% wearesocial.sg • @wearesocialsg • 209
- 210. JAN 2014 VIETNAM: SMARTPHONE USAGE SMARTPHONE PENETRATION AS A PERCENTAGE OF THE TOTAL POPULATION SMARTPHONE USERS SEARCHING FOR LOCAL INFORMATION VIA THEIR PHONE SMARTPHONE USERS RESEARCHING PRODUCTS VIA THEIR PHONE SMARTPHONE USERS WHO HAVE MADE A PURCHASE VIA THEIR PHONE 20% 97% 95% 60% We Are Social • Source: Google’s “Our Mobile Planet” Report wearesocial.sg • @wearesocialsg • 210
- 211. JAN 2014 VIETNAM: MOBILE STATS NUMBER OF ACTIVE MOBILE BROADBAND SUBSCRIPTIONS MOBILE BROADBAND SUBSCRIPTIONS AS A PERCENTAGE OF THE TOTAL POPULATION # 17.6M ACTIVE SOCIAL MEDIA USERS ACCESSING SOCIAL MEDIA ON A MOBILE DEVICE PENETRATION OF MOBILE SOCIAL AS A PERCENTAGE OF THE TOTAL POPULATION # 19% We Are Social • Sources: US Census Bureau, ITU, Facebook 17M 18% wearesocial.sg • @wearesocialsg • 211
- 212. FIND OUT MORE AT WEARESOCIAL.SG We Are Social wearesocial.sg • @wearesocialsg • 250
- 213. DATA SOURCES USED IN THIS REPORT Population data Latest available data from the United States Census Bureau (mid-2013 data), correct as at January 2014. Internet user data Latest available data from InternetWorldStats.com and the China Internet Network Information Centre, correct as at January 2014; usage data extrapolated from GlobalWebIndex (Q3 2013). Social media user data Latest site-reported monthly active user data from Facebook, Google+, Qzone, Sina Weibo, Tencent Weibo, Twitter, and VKontakte, correct as at January 2014; usage data extrapolated from GlobalWebIndex’s Active Usage: Social Platforms(Q3 2013). Mobile phone user data Latest available data from Ericsson Mobility Report (November 2013), the International Telecommunication Union (ITU), The GSM Association (Q4 2013), and the CIA Government Factbook, correct as at January 2014; usage data extrapolated from GlobalWebIndex’s Active Usage: Social Platforms (Q3 2013), and Google’s Our Mobile Planet Report (May 2013). We Are Social wearesocial.sg • @wearesocialsg • 213
- 214. WE ARE SOCIAL IS A GLOBAL CONVERSATION AGENCY. WE HELP BRANDS TO LISTEN TO, UNDERSTAND, AND ENGAGE IN CONVERSATIONS IN SOCIAL MEDIA. WE’RE ALREADY HELPING MANY OF THE WORLD’S TOP BRANDS, INCLUDING ADIDAS, UNILEVER, DIAGEO, NESTLÉ, HEINZ, AND LVMH. IF YOU’D LIKE TO CHAT ABOUT US HELPING YOU TOO, CALL US ON +65 6423 1051, OR EMAIL US AT SAYHELLO@WEARESOCIAL.SG. FIND OUT MORE AT WEARESOCIAL.SG. We Are Social Making Friends & Influencing People • 45
- 215. WE ARE SOCIAL SINGAPORE SIMON KEMP, MANAGING DIRECTOR @WEARESOCIALSG SAYHELLO@WEARESOCIAL.SG +65 6423 1051 HTTP://WEARESOCIAL.SG We Are Social Making Friends & Influencing People • 46