SlideShare uma empresa Scribd logo
1 de 22
Baixar para ler offline
Profits uncontained
An analysis of container shipping ETS surcharges
March 2024
Summary
The world’s first carbon market for shipping, the EU shipping ETS, entered into force on 1 January
2024. Initially, shipowners will purchase emission allowances for 40% of their emissions, increasing to
70% in 2025 and 100% in 2026. In response, the largest shipping companies - all specialised in
transporting containers - announced that they would pass on the ETS costs to their customers in the
form of surcharges. In order to compare each company’s expected ETS costs to the announced
surcharges, this analysis examines over 560 single journeys from 20 ships of each of the four big EU
shipping companies: MSC, Maersk, Hapag-Lloyd and CMA CGM. T&E found that European container
shipping companies are likely to make significant windfall profits by setting these surcharges higher
than their ETS costs.
Figure E.1: Maersk to make over €300,000 from just one journey
On a single journey from China to
Germany, one Maersk ship will make
over €325,000 in windfall profits. A
single ship, the Elly Maersk, is forecast
to make profits of €1.76 million each
year. Significant windfall profits are not
limited to a single operator. Of the 565
journeys analysed, 486, or 86%, are
estimated to make windfall profits.
Hapag Lloyd’s most profitable single
journey is forecast to earn €204,000,
MSC’s €125,000 and CMA CGM’s
€139 000. On individual ship earnings
over a year, MSC’s Benedikt is forecast
to earn €1,371,000, CMA CGM’s Alexis
€818,000, and Hapag Lloyd’s Al
Jmelyiyah €639,000 from the ETS
surcharges.
A briefing by 1
The findings come not long after the disruptions in world trade caused by Covid, where container
carriers made profits higher than those of the big tech giants.1
They are relevant in the context of
attacks from the shipping industry on environmental legislation. Firstly, container companies have
argued that the EU’s shipping ETS will cause a loss in traffic for European ports.2
This analysis
demonstrates the contrary: carriers may actually have more of an incentive to visit European ports as
they could make money out of it. Secondly, the shipping industry has argued that future legislation
from the IMO should get rid of global energy efficiency indicators, such as the carbon intensity
indicator (CII).3
Our analysis demonstrates that emissions pricing alone will not lead to effective price
signals in the shipping industry. As such, bespoke energy efficiency legislation at both EU and IMO
level is needed alongside emissions pricing.
1. Context
From 1 January 2024, the EU’s Emission Trading System (ETS) covers emissions from shipping, for the first
time applying the 'polluter pays’ principle to shipping companies. The law marks the first ambitious
pricing mechanism to regulate international shipping’s climate impact and a significant step in the
sector’s journey towards decarbonisation. The ETS puts a cap on the total amount of pollution for sectors
it regulates, which descends over time, eventually forcing those sectors to decarbonise. It will cover 100%
of emissions from voyages between European ports and 50% of emissions between EU and non-EU ports.
In late 2023, all major container shipping companies announced that they would charge additional costs
to their clients in response to the ETS. These ‘ETS-’ or ‘emissions -surcharges’ are ostensibly to cover the
costs that the shipping companies will be liable for under the ETS. They apply on a container level, differ
for each journey and are higher for refrigerated containers (‘reefers’), which require onboard electrical
energy. For example, a client that wants to send a standard (non-refrigerated) twenty-foot equivalent
(TEU) container from North Europe to North America will have to pay an extra €24 to Hapag-Lloyd, €37 to
MSC, €40 to CMA CGM or €40.5 to Maersk.
In order to evaluate the validity of these extra costs, this analysis compares the expected ETS cost for
these large European shipping companies to the revenues they will raise from their announced ETS
surcharges. In 2024, shipping companies will only be liable to pay for 40% of their ETS-covered emissions.
This will increase to 70% in 2025, and 100% from 2026 onwards. Therefore, a further increase in
surcharges - and profits - can be expected after 2024.
2. Methodology
This analysis focuses on a total of 80 ships operated by Maersk, CMA CGM, Hapag-Lloyd, and MSC, 20 ships
by each company. These ships carried out a total of 565 individual journeys (e.g. from the Far East to
3
Resolution to the IMO’s Marine Environment Protection Committee (MEPC)’s 81st Session (December 2023).
Resolution clarifying the current status of the CII rating system. Retrieved from https://www.imo.org/
2
World Shipping Council (ongoing). The EU ETS. Retrieved at https://www.worldshipping.org/the-eu-ets
1
Bloomberg (August 2021). Container Shipping Earnings Now Rival Apple. It’s Not a Good Look. Retrieved at
https://www.bloomberg.com/opinion/articles/2021-08-19/container-shipping-is-making-a-killing-this-year-but
-will-we-have-christmas
A briefing by 2
North Europe, or the Mediterranean to North America) during the period 18/06/2023 - 18/12/2023. Ships
in the sample were selected to be representative of the energy efficiency of each company’s overall fleet
operated under the stope of the ETS Directive.
We define a windfall profit as the difference between the ETS surcharges levied by the shipping
companies and the expected ETS costs that they incur. We calculate this using 2023 real operational
routes and mapped the journeys made by each ship that correspond to the routes for which each
company has announced a surcharge. We multiplied each ship’s average emissions per nautical mile,
which were derived from the EU MRV regulation, by the distance travelled on each journey.4
The resulting
emissions are multiplied by the ETS prices assumed by the carriers,5
producing the total emission costs
for each journey. These were then converted to per-container ETS costs using load factors also derived
from transport work data available in the 2022 MRV database. Finally, total emission costs were
subtracted from the ETS emissions surcharge revenue - derived by multiplying the announced
route-specific surcharges with the utilised container capacity - to find the ETS profit margin for each
journey.
The results from this analysis should be considered conservative for several reasons. Firstly, our
emissions efficiency data comes from 2022 annual averages, which will be lower than 2024, especially in
the context of new ships running on alternatives to HFO. Secondly, our load factors are lower than the
accepted industry average of 70% and we use the same carbon price estimated by the carriers, which is
much higher than the actual ETS price. Full methodology and all assumptions can be found in Annex 1.
3. Results
The results clearly show that surcharge pricing systematically outstrips the expected emission cost. On
the most profitable journey overall, Maersk’s Elly Maersk will likely generate €325,000 in windfall profits.
The most profitable ship for MSC is Conti Courage, generating €125,000 on a journey between Sines,
Portugal and Savannah, US. For CMA CGM’s, it is APL New Jersey earning €139,000 in profits between
Bremerhaven, Germany and New Orleans, US. Finally, Hapag-Lloyd’s CAl Jimeliyah is estimated to make
€204,000 on a journey from Yantian, China and Wilhelmshaven, Germany. Figure 1 shows the ten most
profitable journeys in our sample.
5
€90/t CO2 in the case of MSC, Maersk, and Hapag-Lloyd,€80/t CO2 for CMA CGM
4
A journey is defined as a one-way trip (most often calling at multiple ports) by a ship between the
two most distant ports in terms of nautical miles along one route.
A briefing by 3
Figure 1: Most profitable individual journeys
Looking at profits over one year in our sample, Maersk’s Elly Maersk ranks as the most profitable ship
overall, projected to make €1,765,000 in windfall ETS profits in 2024.6
For the other carriers, MSC’s
Benedikt CMA CGM’s Alexis, and Hapag-Lloyd’s Al Jameliyah follow with substantial additional annual
profits of €1,371,000, €818,000, and €639,000 respectively, as shown in Figure 2. In our sample, the 6 most
profitable ships - 5 of which are operated by Maersk - generate annual cumulative profits exceeding
€1,000,000. An overview of the most and least profitable ships and journeys can be found in Annex 2.
6
Yearly profits calculating scaling 2023 AIS data from a 6-month sample.
A briefing by 4
Figure 2: Most profitable vessel for four large container ship operators
Out of a total of 565 journeys, only 79, or 14%, did not produce profits in our analysis. 5 of the 10 most
loss-generating journeys were operated by CMA CGM, followed by MSC (4) and Maersk (1). On the other
hand, 9 of the 10 most profitable journeys belong to Maersk, one being operated by Hapag-Lloyd.
Comparing the volume of the loss-making journeys shows that they are far outstripped by their profitable
counterparts. Aggregated, the 25 largest losses account for -€934,000. In comparison, the 4 most
profitable journeys alone generate €996,000 in windfall profits. Total cumulative windfall profits are
€15,156,000 across our sample. Given that our sample only is a small share of each company’s fleet that
will call in Europe and charge surcharges, this will only be a small part of the windfall profits earned by
carriers.
Looking at company averages, Maersk is projected to gain the highest profits across our sample, at
€59,909, followed by Hapag-Lloyd (€23,000), MSC (€16,000) and CMA CGM (€14,000). The average profits
for each journey in our sample was €25,000 in windfall profits (Figure 3).
A briefing by 5
Figure 3: Average journey profits for each company across all routes
Looking at the routes where all carriers trade and have announced profit, there is strong variation in the
windfall profits earned (Figures 2.1, 2.2 and 2.3 in Annex 2). On the route from West Africa to Europe,
Maersk earns €53,000, while Haag-Lloyd incurs losses of -€3,000. However, on routes between
Mediterranean ports, Hapag-Lloyd generates the highest average profits of €75,000 per journey compared
to CMA CGM’s lowest €5,000. On journeys from North Europe to the Mediterranean, CMA CGM generates
windfall profits of €25,000 per journey, with Maersk leading the field with €83,000 on average. From the
sampled journeys, we found that the company with the largest windfall profits on average per journey is
Maersk, with €60,000, followed by Hapag-Lloyd (€23,000), MSC (€16,000) and CMA CGM (€14,000) for every
single one of their many journeys to and from the EU.7
7
Beyond these routes, our sample allows the estimation of profits on the level of individual journeys and ships.
Company-level figures and their comparison are limited, as different surcharge schemes and operating profiles
may favor specific routes not covered by this analysis.
A briefing by 6
Our analysis also considered the fluctuating price of the EU’s ETS. While the carriers all assumed prices of
€90/tCO2 (or €80tCO2 in the case of CMA CGM), these prices are all notably higher than the current ETS
price, of €56.75/tonne CO2.8
Figure 4 shows that windfall profits would be much higher than previously
analysed if we take into account the currently lower ETS price. Given that entities can buy ETS allowances
on the ETS spot market at even lower prices than this, it is likely that the carriers wait for favourable ETS
prices to buy their EUAs for the first quarter and have made profits far above those analysed above. If
Maersk bought their EUAs for the first quarter of 2024 at the ETS price at the time of writing of €56,75,
their average profits for each journey would increase by 18% (€60,000 to €71,000). For Hapag-Lloyd,
profits would increase 74% (€23,000 to €40,000), for MSC, profits would increase 54% (€16,000 to €35,000)
and for CMA CGM - who estimate a lower ETS price of €80 than their competitors - the increase would be
43% from €14,000 to average profits per journey to €20,000.
Figure 4: Comparison of company average windfall profits per journey across all routes for emission prices of €90/t CO2
and €56,75/t CO2
8
*as of the 12/03/2024, retrieved from https://sandbag.be/carbon-price-viewer/
A briefing by 7
In our analysis, we also considered the possibility of varying load factors, i.e. that the containerships will
not always carry the same amount of containers. Although the container industry uses default load
factors of 70% cargo load,9
our main analysis considered load factors calculated from reported values for
transport work under the EU’s MRV and default reefer load factors of 25%, making our analysis
conservative. A sensitivity analysis provided in Annex 2.4 found that even at lower load factors of 35% -
i.e. half the agreed industry default value - carriers would generate windfall profits on two-thirds (i.e. in
371) of journeys, with average profits of just under €4,000 per journey.
4. Conclusions
Our analysis shows that profits from the ETS surcharges are likely to outstrip shipping companies’ actual
ETS costs. Based on these findings, container liners are projected to generate considerable windfall profits
up to €325,000 per journey. Annually, some ships will bring in more than €1 million in windfall profits.
Their clients and final consumers bear not only the emissions costs, while the carriers earn substantial
new profits. The economies of scale with which shipping operates enable this type of cost pass-through;
consumers would pay negligible amounts for final products while shipping companies increase their
margins.10
This conclusion is conservative, as it follows the container carriers' assumed emission cost of
90€/tCO2, almost twice the current ETS price of €56,75 (as of 12/03/2024). While carriers may argue that
these costs will be distributed across different routes and through their whole fleet, our results
demonstrate that loss-making ships and routes are only a small minority of each company’s fleet. As such,
it is clear that the ETS surcharges will be profit-making - rather than a cost pass-through - exercise.
This analysis has a number of implications for policy-makers. Firstly, it shows that fears that the ETS will
lead to ‘business leakage’ or the transfer of port activity from European to non-European ports is
unfounded. Carriers will have an incentive to call at European ports, in order to make surcharge profits,
rather than avoid European ports.
Secondly, it suggests that emission pricing on its own may not completely decarbonise the shipping
industry. The ETS will be important in implementing the ‘polluter pays principle’ and in raising revenues
for public authorities to reinvest in public services and decarbonisation projects that may otherwise not
receive funding. Moreover, the difference in ETS surcharges per company suggests that the ETS introduces
an element of competition for emissions efficiency between carriers. This is, however, limited by the
concentrated nature of container shipping and the ease at which the shipping industry can pass on costs
to their clients and the final customer (that is, maritime shipping’s low price elasticity of demand).
Therefore, bespoke additional legislation is needed in addition to the ETS to ensure operational and
technical energy efficiency improvements are made. This is highly relevant in the context of the shipping
10
Transport & Environment (June 28, 2022). The small price to pay to clean up shipping. Retrieved from
https://www.transportenvironment.org/discover/the-small-price-to-pay-to-clean-up-shipping/
9
All major container companies are part of the Clean Cargo Working Group, whose methodology for ascribing
emissions to individual containers states that ‘ Historical analysis of carrier-reported vessel utilization data reflected
an average capacity utilization of 70% across the largest historical Clean Cargo tradelanes.’ Smart Frieght Centre
(January, 2024). Clean Cargo GHG Emission INtensity Calculation Methods. Retrieved from
https://www.smartfreightcentre.org/en/our-programs/clean-cargo-1/clean-cargo/
A briefing by 8
industry lobbying against energy efficiency measures (the CII) at the IMO.11
Policy-makers must recognise
that shipping decarbonisation is not simple; it will need multiple measures (such as emissions pricing,
fuel standards, energy efficiency measures and subsidies) working at the same time to chart the path to
green shipping.
Further information
Jacob Armstrong
Shipping Policy Manager
Transport & Environment
jacob.armstrong@transportenvironment.org
Felix Klann
Junior Shipping Policy Analyst
felix.klann@transportenvironment.org
Mobile: +32 (0) 470 83 55 17
11
Resolution to the IMO’s Marine Environment Protection Committee (MEPC)’s 81st Session (December 2023).
Resolution clarifying the current status of the CII rating system. Retrieved from https://www.imo.org/
A briefing by 9
Annex 1: Full methodology
This analysis considers a total of 80 ships in operation for the companies Maersk, CMA CGM, Hapag-Lloyd,
and MSC. To ensure the selected ships do not only represent company fleets, but their fleet operating in
the EEA, we first cross-referenced data on ship operation from Alphaliner with the ships in the EU MRV
THETIS database12
. From those that did, the sample was drawn to represent each operator’s respective
fleets according to their energy efficiency per container. In line with the scope of the current shipping
MRV, we only considered ships above 5,000 gross tonnage. Since container shipping companies charges
are higher for more energy-intensive refrigerated containers13
, the ‘reefer capacity’ on each ship was
added separately from Clarksons World Fleet Register.14
Thus, we selected a sample of 20 ships for each
company (see Table A.1).
Company Energy efficiency of fleet that
called in EU/EEA in 2022 (in kg
CO2/TEU-nm)
Energy efficiency of 20
sampled ships (in kg
CO2/TEU-nm)
Hapag-Lloyd 0.11 0.10
MSC 0.13 0.14
Maersk 0.10 0.10
CMA CGM 0.15 0.15
Table A.1: carbon intensity of ships in our sample compared to that of the fleet that visited EU/EEA ports in 2022
We calculated emissions based on a ship’s journeys, defined as one-way trips by a ship between two most
distant ports in terms of nautical miles along one route.15
They correspond to the routes for which the
container companies have announced surcharges. Additionally, journeys closely represent the origin and
destination of containers shipped along global trade lanes. The journeys in this analysis rely on simplified
assumptions to the origin and destination of carried containers, namely calculating surcharges for
utilised container capacity on the full journey, not accounting for cargo discharge and loading on
intermediary port calls. Our use of annual average emissions and used cargo capacity of each individual
ship mitigates its impact, as those represent the true annual cargo load factor and emissions spread of a
vessel. In our analysis, we included the distances16
between all port calls17
within a 6-month window from
17
All port calls within the date range were extracted from https://marinetraffic.com
16
Port-to-port distances were extracted from https://sea-distances.org and http://ports.com/
15
In our analysis we differentiate between a journey - a full, end to end, route between two regions which may have
multiple port calls in between - and a voyage, defined by the EU as ‘the last berth or ship-to-ship transfer within a
port of call to the first berth or ship-to-ship transfer in the following port of call’. Retrieved from
https://climate.ec.europa.eu/system/files/2017-06/20170517_voyages_in_ports_en.pdf
14
Clarksons Research (2023). Clarksons World Fleet register. Retrieved from https://www.clarksons.net/wfr/
13
Smart Freight Centre (2024). Clean Cargo Ocean Containership Greenhouse Gas Emission Intensity Calculation
Methods. Retrieved from https://www.smartfreightcentre.org/en/our-programs/clean-cargo-1/clean-cargo/
12
EMSA (2023). 2022-v111-22112023-EU MRV. Retrieved from https://mrv.emsa.europa.eu/#public/faq
A briefing by 10
June 18, 2023, to December 18, 2023, for each ship to ensure a sufficient amount of journeys on longer
routes are covered. In line with ETS maritime coverage, anchorages were not considered. Figure A.2
shows a full overview of our approach.
Figure A.2: Our approach to calculating windfall profits
The emissions considered under the ETS were then calculated by multiplying a ship’s average emissions
per nautical mile by the miles travelled on each journey, with respect to the specific rules on the coverage
of voyages. In line with the coverage of the ETS, we counted 50% of the emissions from voyages between
EEA and non-EEA ports (Figure A.3). The resulting emissions were then multiplied by the expected carbon
A briefing by 11
price announced by each carrier: €90 for each tonne of CO2 for Maersk,18
Hapag-Lloyd19
and MSC,20
€80 for
CMA CGM.21
As this is now above current carbon price levels, a sensitivity analysis using a price of €53 per
tonne of CO2 Is provided in Annex 2.
As the shipping sector benefits from a ‘phase-in’ of their ETS liabilities (companies will only have to pay
for 40% of their total ETS-covered emissions in 2024 and 70% in 2025), we have adjusted each journey’s
emissions to reflect their lesser liabilities in 2024. The resulting emissions are multiplied by the ETS price
announced by each carrier,22
producing the per-container and total emission costs for each journey. The
emission costs were subtracted from the ETS emissions surcharge revenue to assess the windfall profits
resulting from container operators' ETS surcharges.
Figure A.3: Geographical scope of ETS emissions
This analysis produces conservative profit estimates, as it uses emission efficiency data from 2022 (the
most recently available through the EU’s MRV). Efficiency improvements since then - and in particular the
uptake of new vessels that do not use HFO and have lower emissions factors, like LNG - mean that 2024
22
€90/t CO2 in the case of MSC, Maersk, and Hapag-Lloyd and €80/t CO2 for CMA CGM.
21
CMA CGM (1 December 2023). Launching of EU Emissions Trading System application to shipping. Retrieved from
https://www.cma-cgm.com/local/vietnam/news/187/launching-of-eu-emissions-trading-system-application-to-ship
ping
20
MSC (10 November 2023). Implementing EU Emissions Trading System (ETS) from 1 January 2024. Retrieved from
https://www.msc.com/en/newsroom/customer-advisories/2023/october/implementing-eu-ets-from-1-january-2024
19
Hapag-Lloyd (1 December 2023). Here's an update on the EU Emission Trading System (ETS) and Emission
Allowance Surcharge. Retrieved from
https://www.hapag-lloyd.com/en/services-information/news/2023/12/here-s-an-update-on-ets.html
18
Maersk (15 September 2023). EU Emissions Trading System (ETS) effective January 1, 2024. Retrieved from
https://www.maersk.com/news/articles/2023/09/15/eu-emissions-trading-system-ets
A briefing by 12
emissions efficiency will be greater. This would tend to reduce carriers’ ETS liabilities and increase
surcharge profits.
Additionally, the shipping ETS has specific rules for certain neighbouring transhipment ports. Under the
legislation, port calls in Tanger Med in Morocco and Port Said in Egypt will not be considered port calls.
This means that, for example, a journey from Singapore (non-EU) to Valencia (EU) through (only) Tanger
Med (non-EU neighbouring port) is considered to be one inbound voyage from Singapore to Valencia, as if
the stop in Tanger Med did not take place. Similarly, specific rules for journeys to, from, and within EU
outermost regions were applied to the analysis.23
Our analysis also takes into account the fact that container vessels rarely use their full cargo capacity, as
well as the phase-in period of the shipping ETS. We calculated each ship’s load factor using data reported
by each company to the European Commission.24
In addition to average emissions per nautical mile,
shipping companies also report total annual CO2 emissions, and CO2 emissions per transport work
(measured in tonne-nautical miles). From this data, it is possible to calculate the average tonnes of cargo
and thus the number of containers onboard (Figure A.4). Where no ship-based load factor was found,25
we
assumed a load factor of 70%, as per the standard agreed by container companies themselves based on
historical capacity. The load factors we use in our analysis are typically lower than 70% and therefore lead
to lower surcharge profits than what would be generated under the carriers' own assumptions. This
buffer in used capacity accounts for containers that do not travel the full journey distance. For
refrigerated “reefer” containers, we used a fixed load factor of 25% (which is also an industry standard).26
26
Smart Freight Centre (2024) Ocean Containership Greenhouse Gas Emission
Intensity Calculation Methods. Retrieved from:
https://smart-freight-centre-media.s3.amazonaws.com/documents/Clean_Cargo_GHG_Emission_Intensity_Ca
lculation_Methods_2024-01-12_yyIIsag.pdf
25
This exception exclusively applies to the AMALTHEA.
24
For the conversion of cargo in tonnes to 20-foot-containers assuming a default weight of 12 tonnes in line
with the Shipping MRV Monitoring sub-group of the European Sustainable Shipping Forum (2017). Retrieved
from https://climate.ec.europa.eu/system/files/2017-06/20170517_guidance_cargo_en.pdf
23
In line with EU ETS maritime guidelines’ specific rules and derogations. Retrieved from
https://climate.ec.europa.eu/eu-action/transport/reducing-emissions-shipping-sector/faq-maritime-transport
-eu-emissions-trading-system-ets_en
A briefing by 13
Figure A.4: Our approach to calculating utilized container capacity (load factors)
A briefing by 14
Annex 2: Additional data
Most profitable journeys
Vessel Journey Port Of Origin Country of Origin Total Profit Company
ELLY MAERSK Far East to North Europe Port SHANGHAI China €325,000 Maersk
ELLY MAERSK North Europe to Far East Port HAMBURG Germany €233,000 Maersk
AL JMELIYAH East Asia - North Europe Port YANTIAN China €204,000 Hapag-Lloyd
EDITH MAERSK Far East to North Europe Port YANTIAN China €190,000 Maersk
EDITH MAERSK North Europe to Far East Port HAMBURG Germany €185,000 Maersk
EBBA MAERSK North Europe to Far East Port HAMBURG Germany €166,000 Maersk
ELEONORA MAERSK Far East to North Europe Port QINGDAO China €151,000 Maersk
APL NEW JERSEY North Europe to USA Port BREMERHAVEN Germany €139,000 CMA CGM
APL NEW JERSEY North Europe to USA Port BREMERHAVEN Germany €135,000 CMA CGM
ELEONORA MAERSK North Europe to Far East Port ANTWERP Belgium €134,000 Maersk
CAP SAN TAINARO Europe to East Coast South America Port HAMBURG Germany €128,000 Maersk
CONTI COURAGE Europe to NAM (USA, Canada & Mexico) Port SINES Portugal €125,000 MSC
A briefing by 15
CAP SAN JUAN Mediterranean to Middle East & Indian Subcontinent Port ALGECIRAS Spain €125,000 Maersk
CAP SAN LAZARO Mediterranean to Middle East & Indian Subcontinent Port ALGECIRAS Spain €124,000 Maersk
LE HAVRE Europe to Oceania & Indian Ocean Islands Port HAMBURG Germany €122,000 MSC
APL FULLERTON Asia to North Europe Port BUSAN NEW PORT South Korea €120,000 CMA CGM
Table 2.1: 25 most profitable journeys
Least profitable journeys
Vessel Journey Port Of Origin Country of Origin Total Profit Company
LE HAVRE Oceania & Indian Ocean Islands to Europe Port ADELAIDE Australia - €185,000 MSC
APL NEW YORK Oceania to Europe Port ADELAIDE Australia - €79,000 CMA CGM
APL MEXICO CITY Oceania to Europe Port ADELAIDE Australia - €69,000 CMA CGM
C HAMBURG Oceania & Indian Ocean Islands to Europe Port ADELAIDE Australia - €61,000 MSC
APL MEXICO CITY Oceania to Europe Port BOTANY Australia - €58,000 CMA CGM
APL FULLERTON North Europe to Far East Port ROTTERDAM MAASVLAKTE Netherlands - €56,000 CMA CGM
CONTI CORTESIA NAM (USA, Canada & Mexico) to Europe Port LOS ANGELES United States - €46,000 MSC
A briefing by 16
GSL KALLIOPI North Europe to Middle East & Indian Subcontinent Port THAMES United Kingdom - €41,000 Maersk
CONTI CORTESIA Oceania & Indian Ocean Islands to Europe Port MELBOURNE Australia - €33,000 MSC
APL NEW YORK North Europe to Far East Port ROTTERDAM MAASVLAKTE Netherlands - €30,000 CMA CGM
C HAMBURG Oceania & Indian Ocean Islands to Europe Port ADELAIDE Australia - €29,000 MSC
GSL KALLIOPI North Europe to Middle East & Indian Subcontinent Port BREMERHAVEN Germany - €28,000 Maersk
MSC AJACCIO South America East Coast to Europe Port SANTOS Brazil - €27,000 MSC
CSL MANHATTAN North Am East Coast incl MX East Coast - South Europe Port HOUSTON United States - €12,000 Hapag-Lloyd
CHACABUCO North Am East Coast incl MX East Coast - North Europe Port ALTAMIRA Mexico - €11,000 Hapag-Lloyd
MSC AJACCIO Europe to South America East Coast Port LIVORNO Italy - €10,000 MSC
EMMA A Central America / Caribbean - South Europe Port PANAMA ATLANTIC Panama - €10,000 Hapag-Lloyd
MSC ADELAIDE Mediterranean to North Europe Port NAPOLI Italy - €10,000 MSC
CELSIUS LONDON Middle East & Indian Subcontinent to North Europe Port ALEXANDRIA Egypt - €9,000 Maersk
MSC AJACCIO South America East Coast to Europe Port RIO DE JANEIRO Brazil - €8,000 MSC
DALLAS EXPRESS West Africa - Europe Port LUANDA Angola - €8,000 Hapag-Lloyd
Table 2.2: 25 least profitable journeys
A briefing by 17
Most profitable ships
Company Vessel Name Annual Profit
Maersk ELLY MAERSK €1,766,000
Maersk EDITH MAERSK €1,500,000
Maersk CAP SAN JUAN €1,436,000
MSC BENEDIKT €1,371,000
Maersk CAP SAN LAZARO €1,255,000
Maersk EBBA MAERSK €1,027,000
Maersk
CAP SAN
ANTONIO €912,000
CMA CGM ALEXIS €818,000
MSC CAPE SOUNIO €752,000
MSC CONTI COURAGE €746,000
Table 2.3: 10 Most profitable ships
Least profitable ships
Company Vessel Name Annual Profit
CMA CGM APL NEW YORK - €375,000
CMA CGM APL MEXICO CITY - €205,000
MSC LE HAVRE - €127,000
Hapag-Lloyd CHACABUCO - €66,000
Maersk CELSIUS LONDON - €47,000
MSC C HAMBURG - €42,000
CMA CGM ATLANTIC GENEVA - €32,000
Maersk AS PALINA - €15,000
Hapag-Lloyd EMMA A - €9,000
MSC MSC AGADIR €11,000
Hapag-Lloyd EMOTION €28,000
Table 2.4: 10 least profitable ships
A briefing by 18
Sensitivity analysis
Company
Baseline average windfall
profits per journey
Average windfall profits per
journey at €53/tCO2
Average windfall profits per
journey at 35% load factor
Hapag-Lloyd €23,000 €40,000 -€5,000
MSC €16,000 €35,000 €4,000
Maersk €60,000 €71,000 €25,000
CMA CGM €14,000 €20,000 €2,000
All sampled ships €25,000 €35,000 €4,000
Profitable journeys 486 (86%) 553 (98%) 371 (66%)
Loss-making journeys 79 (14%) 12 (2%) 194 (34%)
Profitable ships 71 (89%) 79 (99%) 51 (64%)
Loss-making ships 9 (11%) 1 (1%) 29 (36%)
Table 2.5: Sensitivity analysis for ETS price. The companys’ estimated price of €90/tCO2 for Maersk, Hapag-Lloyd and
MSC, €80/tCO2 for CMA CGM. €56.75/tCO2 (ETS price on 20/02/2024). Load factor of 35% half of accepted industry
average of 70%.
A briefing by 19
Route comparisons
Figure 2.1: Average journey profits for each company from West Africa to Europe; “Abidjan to Antwerp”, “Abidjan to
Marseille”, and “Nouakchott to Lisbon” for CMA CGM
A briefing by 20
Figure 2.2: Average journey profits for each company within the Mediterranean; “Middle East to South Europe” for
Hapag-Lloyd
A briefing by 21
Figure 2.3: Average journey profits for each company from North Europe to the Mediterranean; “Intra”-EU for
Hapag-Lloyd
A briefing by 22

Mais conteúdo relacionado

Semelhante a EED - Profits uncontained. An analysis of container shipping ETS surcharges

Wcn march 2013 p22
Wcn march 2013 p22Wcn march 2013 p22
Wcn march 2013 p22Don Miller
 
Sustainable Terminals: How Private Port Operators and Terminals invest in Sus...
Sustainable Terminals: How Private Port Operators and Terminals invest in Sus...Sustainable Terminals: How Private Port Operators and Terminals invest in Sus...
Sustainable Terminals: How Private Port Operators and Terminals invest in Sus...Katarzyna Paw?owska
 
So Update January 2007
So Update January 2007So Update January 2007
So Update January 2007GryKB
 
Clean Fleets - case studies
Clean Fleets - case studiesClean Fleets - case studies
Clean Fleets - case studiesHelen_ICLEI
 
Capacity charging mechanism for shared CO2 transportation and storage infrast...
Capacity charging mechanism for shared CO2 transportation and storage infrast...Capacity charging mechanism for shared CO2 transportation and storage infrast...
Capacity charging mechanism for shared CO2 transportation and storage infrast...Global CCS Institute
 
Dr Michael Bull, Arup - How much do shipping and ports contribute to air qual...
Dr Michael Bull, Arup - How much do shipping and ports contribute to air qual...Dr Michael Bull, Arup - How much do shipping and ports contribute to air qual...
Dr Michael Bull, Arup - How much do shipping and ports contribute to air qual...IES / IAQM
 
New trends on MODERN Shipping & Transhipment Port (eng) danny diep to (f)
New trends on MODERN Shipping & Transhipment Port (eng) danny diep to (f)New trends on MODERN Shipping & Transhipment Port (eng) danny diep to (f)
New trends on MODERN Shipping & Transhipment Port (eng) danny diep to (f)Danny Diep To
 
Analysis of the potential for electric buses
Analysis of the potential for electric busesAnalysis of the potential for electric buses
Analysis of the potential for electric busesLeonardo ENERGY
 
OM Concepts for Near and Far Offshore Wind Farms
OM Concepts for Near and Far Offshore Wind FarmsOM Concepts for Near and Far Offshore Wind Farms
OM Concepts for Near and Far Offshore Wind FarmsAshish Dewan
 
Ce delft -_historical_trends_in_ship_design_efficiency[1]
Ce delft -_historical_trends_in_ship_design_efficiency[1]Ce delft -_historical_trends_in_ship_design_efficiency[1]
Ce delft -_historical_trends_in_ship_design_efficiency[1]John Kokarakis
 
Global Container Pooling Sept 2009
Global Container Pooling   Sept 2009Global Container Pooling   Sept 2009
Global Container Pooling Sept 2009rab2020
 
Air Freight And Airport Regions Ppt
Air Freight And Airport Regions PptAir Freight And Airport Regions Ppt
Air Freight And Airport Regions PptWJ
 
Air freight and_airport_regions_ppt
Air freight and_airport_regions_pptAir freight and_airport_regions_ppt
Air freight and_airport_regions_pptWJ
 

Semelhante a EED - Profits uncontained. An analysis of container shipping ETS surcharges (20)

Wcn march 2013 p22
Wcn march 2013 p22Wcn march 2013 p22
Wcn march 2013 p22
 
Sustainable Terminals: How Private Port Operators and Terminals invest in Sus...
Sustainable Terminals: How Private Port Operators and Terminals invest in Sus...Sustainable Terminals: How Private Port Operators and Terminals invest in Sus...
Sustainable Terminals: How Private Port Operators and Terminals invest in Sus...
 
Stellungnahme ACI
Stellungnahme ACIStellungnahme ACI
Stellungnahme ACI
 
So Update January 2007
So Update January 2007So Update January 2007
So Update January 2007
 
Clean Fleets - case studies
Clean Fleets - case studiesClean Fleets - case studies
Clean Fleets - case studies
 
Capacity charging mechanism for shared CO2 transportation and storage infrast...
Capacity charging mechanism for shared CO2 transportation and storage infrast...Capacity charging mechanism for shared CO2 transportation and storage infrast...
Capacity charging mechanism for shared CO2 transportation and storage infrast...
 
Dr Michael Bull, Arup - How much do shipping and ports contribute to air qual...
Dr Michael Bull, Arup - How much do shipping and ports contribute to air qual...Dr Michael Bull, Arup - How much do shipping and ports contribute to air qual...
Dr Michael Bull, Arup - How much do shipping and ports contribute to air qual...
 
New trends on MODERN Shipping & Transhipment Port (eng) danny diep to (f)
New trends on MODERN Shipping & Transhipment Port (eng) danny diep to (f)New trends on MODERN Shipping & Transhipment Port (eng) danny diep to (f)
New trends on MODERN Shipping & Transhipment Port (eng) danny diep to (f)
 
Analysis of the potential for electric buses
Analysis of the potential for electric busesAnalysis of the potential for electric buses
Analysis of the potential for electric buses
 
An economic assessment of low carbon vehicles
An economic assessment of low carbon vehiclesAn economic assessment of low carbon vehicles
An economic assessment of low carbon vehicles
 
OM Concepts for Near and Far Offshore Wind Farms
OM Concepts for Near and Far Offshore Wind FarmsOM Concepts for Near and Far Offshore Wind Farms
OM Concepts for Near and Far Offshore Wind Farms
 
SETPOS-project-handbook.pdf
SETPOS-project-handbook.pdfSETPOS-project-handbook.pdf
SETPOS-project-handbook.pdf
 
MRV regulation
MRV regulationMRV regulation
MRV regulation
 
Ce delft -_historical_trends_in_ship_design_efficiency[1]
Ce delft -_historical_trends_in_ship_design_efficiency[1]Ce delft -_historical_trends_in_ship_design_efficiency[1]
Ce delft -_historical_trends_in_ship_design_efficiency[1]
 
Marpol annex 3& 6
Marpol annex 3& 6Marpol annex 3& 6
Marpol annex 3& 6
 
Global Container Pooling Sept 2009
Global Container Pooling   Sept 2009Global Container Pooling   Sept 2009
Global Container Pooling Sept 2009
 
Air Freight And Airport Regions Ppt
Air Freight And Airport Regions PptAir Freight And Airport Regions Ppt
Air Freight And Airport Regions Ppt
 
Air freight and_airport_regions_ppt
Air freight and_airport_regions_pptAir freight and_airport_regions_ppt
Air freight and_airport_regions_ppt
 
Do we have a Deal?
Do we have a Deal?Do we have a Deal?
Do we have a Deal?
 
29 32
29 3229 32
29 32
 

Mais de El Estrecho Digital

EED - La UNCTAD publica su informe anual sobre el transporte marítimo
EED - La UNCTAD publica su informe anual sobre el transporte marítimoEED - La UNCTAD publica su informe anual sobre el transporte marítimo
EED - La UNCTAD publica su informe anual sobre el transporte marítimoEl Estrecho Digital
 
APBA: Memoria Anual de I+D+i 2022
APBA: Memoria Anual de I+D+i 2022APBA: Memoria Anual de I+D+i 2022
APBA: Memoria Anual de I+D+i 2022El Estrecho Digital
 
Container Port Performance Index 2022.pdf
Container Port Performance Index 2022.pdfContainer Port Performance Index 2022.pdf
Container Port Performance Index 2022.pdfEl Estrecho Digital
 
EL CMMA propone un decálogo de medidas para impulsar la Economía Azul
EL CMMA propone un decálogo de medidas para impulsar la Economía Azul EL CMMA propone un decálogo de medidas para impulsar la Economía Azul
EL CMMA propone un decálogo de medidas para impulsar la Economía Azul El Estrecho Digital
 
EED - FETEIA-OLTRA propone, a la Ministra de Sanidad, soluciones para el PCF ...
EED - FETEIA-OLTRA propone, a la Ministra de Sanidad, soluciones para el PCF ...EED - FETEIA-OLTRA propone, a la Ministra de Sanidad, soluciones para el PCF ...
EED - FETEIA-OLTRA propone, a la Ministra de Sanidad, soluciones para el PCF ...El Estrecho Digital
 
EED - La Audiencia Nacional desestima la demanda de Asoport contra el V Acuer...
EED - La Audiencia Nacional desestima la demanda de Asoport contra el V Acuer...EED - La Audiencia Nacional desestima la demanda de Asoport contra el V Acuer...
EED - La Audiencia Nacional desestima la demanda de Asoport contra el V Acuer...El Estrecho Digital
 
EED - Marco Estratégico del Sistema Portuario de interés general
EED - Marco Estratégico del Sistema Portuario de interés generalEED - Marco Estratégico del Sistema Portuario de interés general
EED - Marco Estratégico del Sistema Portuario de interés generalEl Estrecho Digital
 
La APBA presenta la tercera edición de su Memoria Anual de I+D+i
La APBA presenta la tercera edición de su Memoria Anual de I+D+iLa APBA presenta la tercera edición de su Memoria Anual de I+D+i
La APBA presenta la tercera edición de su Memoria Anual de I+D+iEl Estrecho Digital
 
EED - MEMORIA ANUAL SOCIEDAD DE ESTIBA ALGECIRAS 2011-2021
EED - MEMORIA ANUAL SOCIEDAD DE ESTIBA ALGECIRAS 2011-2021EED - MEMORIA ANUAL SOCIEDAD DE ESTIBA ALGECIRAS 2011-2021
EED - MEMORIA ANUAL SOCIEDAD DE ESTIBA ALGECIRAS 2011-2021El Estrecho Digital
 
EED - Container Port Performance Index 2021
EED - Container Port Performance Index 2021EED - Container Port Performance Index 2021
EED - Container Port Performance Index 2021El Estrecho Digital
 
EED - El BOE publica el V Acuerdo Marco de la estiba
EED - El BOE publica el V Acuerdo Marco de la estibaEED - El BOE publica el V Acuerdo Marco de la estiba
EED - El BOE publica el V Acuerdo Marco de la estibaEl Estrecho Digital
 
EED - Informe anual del Observatorio Estadístico del TMCD 2021
EED - Informe anual del Observatorio Estadístico del TMCD 2021EED - Informe anual del Observatorio Estadístico del TMCD 2021
EED - Informe anual del Observatorio Estadístico del TMCD 2021El Estrecho Digital
 
EED - La APB muestra a través de un cómic la actividad esencial de los puertos
EED - La APB muestra a través de un cómic la actividad esencial de los puertosEED - La APB muestra a través de un cómic la actividad esencial de los puertos
EED - La APB muestra a través de un cómic la actividad esencial de los puertosEl Estrecho Digital
 
EED - Carta Algeciras Bobadilla Andalucía Bay
EED - Carta Algeciras Bobadilla Andalucía BayEED - Carta Algeciras Bobadilla Andalucía Bay
EED - Carta Algeciras Bobadilla Andalucía BayEl Estrecho Digital
 
EED - UN CEFACT recommendation 45 - october 2021
EED - UN CEFACT recommendation 45 - october 2021EED - UN CEFACT recommendation 45 - october 2021
EED - UN CEFACT recommendation 45 - october 2021El Estrecho Digital
 
EED - European Maritime Transport Environmental Report 2021
EED - European Maritime Transport Environmental Report 2021EED - European Maritime Transport Environmental Report 2021
EED - European Maritime Transport Environmental Report 2021El Estrecho Digital
 
EED - El Puerto Teleférico de Vicente Caffarena en Sidi Ifni
EED - El Puerto Teleférico de Vicente Caffarena en Sidi IfniEED - El Puerto Teleférico de Vicente Caffarena en Sidi Ifni
EED - El Puerto Teleférico de Vicente Caffarena en Sidi IfniEl Estrecho Digital
 
EED - Medidas para el impulso de la competitividad del sistema portuario español
EED - Medidas para el impulso de la competitividad del sistema portuario españolEED - Medidas para el impulso de la competitividad del sistema portuario español
EED - Medidas para el impulso de la competitividad del sistema portuario españolEl Estrecho Digital
 
EED - Memoria Anual de I+D+i 2020 de la APBA
EED - Memoria Anual de I+D+i 2020 de la APBAEED - Memoria Anual de I+D+i 2020 de la APBA
EED - Memoria Anual de I+D+i 2020 de la APBAEl Estrecho Digital
 

Mais de El Estrecho Digital (20)

EED - La UNCTAD publica su informe anual sobre el transporte marítimo
EED - La UNCTAD publica su informe anual sobre el transporte marítimoEED - La UNCTAD publica su informe anual sobre el transporte marítimo
EED - La UNCTAD publica su informe anual sobre el transporte marítimo
 
APBA: Memoria Anual de I+D+i 2022
APBA: Memoria Anual de I+D+i 2022APBA: Memoria Anual de I+D+i 2022
APBA: Memoria Anual de I+D+i 2022
 
Container Port Performance Index 2022.pdf
Container Port Performance Index 2022.pdfContainer Port Performance Index 2022.pdf
Container Port Performance Index 2022.pdf
 
EL CMMA propone un decálogo de medidas para impulsar la Economía Azul
EL CMMA propone un decálogo de medidas para impulsar la Economía Azul EL CMMA propone un decálogo de medidas para impulsar la Economía Azul
EL CMMA propone un decálogo de medidas para impulsar la Economía Azul
 
EED - FETEIA-OLTRA propone, a la Ministra de Sanidad, soluciones para el PCF ...
EED - FETEIA-OLTRA propone, a la Ministra de Sanidad, soluciones para el PCF ...EED - FETEIA-OLTRA propone, a la Ministra de Sanidad, soluciones para el PCF ...
EED - FETEIA-OLTRA propone, a la Ministra de Sanidad, soluciones para el PCF ...
 
EED - La Audiencia Nacional desestima la demanda de Asoport contra el V Acuer...
EED - La Audiencia Nacional desestima la demanda de Asoport contra el V Acuer...EED - La Audiencia Nacional desestima la demanda de Asoport contra el V Acuer...
EED - La Audiencia Nacional desestima la demanda de Asoport contra el V Acuer...
 
EED - Informa estadístico TMCD
EED - Informa estadístico TMCDEED - Informa estadístico TMCD
EED - Informa estadístico TMCD
 
EED - Marco Estratégico del Sistema Portuario de interés general
EED - Marco Estratégico del Sistema Portuario de interés generalEED - Marco Estratégico del Sistema Portuario de interés general
EED - Marco Estratégico del Sistema Portuario de interés general
 
La APBA presenta la tercera edición de su Memoria Anual de I+D+i
La APBA presenta la tercera edición de su Memoria Anual de I+D+iLa APBA presenta la tercera edición de su Memoria Anual de I+D+i
La APBA presenta la tercera edición de su Memoria Anual de I+D+i
 
EED - MEMORIA ANUAL SOCIEDAD DE ESTIBA ALGECIRAS 2011-2021
EED - MEMORIA ANUAL SOCIEDAD DE ESTIBA ALGECIRAS 2011-2021EED - MEMORIA ANUAL SOCIEDAD DE ESTIBA ALGECIRAS 2011-2021
EED - MEMORIA ANUAL SOCIEDAD DE ESTIBA ALGECIRAS 2011-2021
 
EED - Container Port Performance Index 2021
EED - Container Port Performance Index 2021EED - Container Port Performance Index 2021
EED - Container Port Performance Index 2021
 
EED - El BOE publica el V Acuerdo Marco de la estiba
EED - El BOE publica el V Acuerdo Marco de la estibaEED - El BOE publica el V Acuerdo Marco de la estiba
EED - El BOE publica el V Acuerdo Marco de la estiba
 
EED - Informe anual del Observatorio Estadístico del TMCD 2021
EED - Informe anual del Observatorio Estadístico del TMCD 2021EED - Informe anual del Observatorio Estadístico del TMCD 2021
EED - Informe anual del Observatorio Estadístico del TMCD 2021
 
EED - La APB muestra a través de un cómic la actividad esencial de los puertos
EED - La APB muestra a través de un cómic la actividad esencial de los puertosEED - La APB muestra a través de un cómic la actividad esencial de los puertos
EED - La APB muestra a través de un cómic la actividad esencial de los puertos
 
EED - Carta Algeciras Bobadilla Andalucía Bay
EED - Carta Algeciras Bobadilla Andalucía BayEED - Carta Algeciras Bobadilla Andalucía Bay
EED - Carta Algeciras Bobadilla Andalucía Bay
 
EED - UN CEFACT recommendation 45 - october 2021
EED - UN CEFACT recommendation 45 - october 2021EED - UN CEFACT recommendation 45 - october 2021
EED - UN CEFACT recommendation 45 - october 2021
 
EED - European Maritime Transport Environmental Report 2021
EED - European Maritime Transport Environmental Report 2021EED - European Maritime Transport Environmental Report 2021
EED - European Maritime Transport Environmental Report 2021
 
EED - El Puerto Teleférico de Vicente Caffarena en Sidi Ifni
EED - El Puerto Teleférico de Vicente Caffarena en Sidi IfniEED - El Puerto Teleférico de Vicente Caffarena en Sidi Ifni
EED - El Puerto Teleférico de Vicente Caffarena en Sidi Ifni
 
EED - Medidas para el impulso de la competitividad del sistema portuario español
EED - Medidas para el impulso de la competitividad del sistema portuario españolEED - Medidas para el impulso de la competitividad del sistema portuario español
EED - Medidas para el impulso de la competitividad del sistema portuario español
 
EED - Memoria Anual de I+D+i 2020 de la APBA
EED - Memoria Anual de I+D+i 2020 de la APBAEED - Memoria Anual de I+D+i 2020 de la APBA
EED - Memoria Anual de I+D+i 2020 de la APBA
 

Último

30042024_First India Newspaper Jaipur.pdf
30042024_First India Newspaper Jaipur.pdf30042024_First India Newspaper Jaipur.pdf
30042024_First India Newspaper Jaipur.pdfFIRST INDIA
 
26042024_First India Newspaper Jaipur.pdf
26042024_First India Newspaper Jaipur.pdf26042024_First India Newspaper Jaipur.pdf
26042024_First India Newspaper Jaipur.pdfFIRST INDIA
 
Nurturing Families, Empowering Lives: TDP's Vision for Family Welfare in Andh...
Nurturing Families, Empowering Lives: TDP's Vision for Family Welfare in Andh...Nurturing Families, Empowering Lives: TDP's Vision for Family Welfare in Andh...
Nurturing Families, Empowering Lives: TDP's Vision for Family Welfare in Andh...narsireddynannuri1
 
Defensa de JOH insiste que testimonio de analista de la DEA es falso y solici...
Defensa de JOH insiste que testimonio de analista de la DEA es falso y solici...Defensa de JOH insiste que testimonio de analista de la DEA es falso y solici...
Defensa de JOH insiste que testimonio de analista de la DEA es falso y solici...AlexisTorres963861
 
BDSM⚡Call Girls in Indirapuram Escorts >༒8448380779 Escort Service
BDSM⚡Call Girls in Indirapuram Escorts >༒8448380779 Escort ServiceBDSM⚡Call Girls in Indirapuram Escorts >༒8448380779 Escort Service
BDSM⚡Call Girls in Indirapuram Escorts >༒8448380779 Escort ServiceDelhi Call girls
 
Enjoy Night⚡Call Girls Rajokri Delhi >༒8448380779 Escort Service
Enjoy Night⚡Call Girls Rajokri Delhi >༒8448380779 Escort ServiceEnjoy Night⚡Call Girls Rajokri Delhi >༒8448380779 Escort Service
Enjoy Night⚡Call Girls Rajokri Delhi >༒8448380779 Escort ServiceDelhi Call girls
 
Roberts Rules Cheat Sheet for LD4 Precinct Commiteemen
Roberts Rules Cheat Sheet for LD4 Precinct CommiteemenRoberts Rules Cheat Sheet for LD4 Precinct Commiteemen
Roberts Rules Cheat Sheet for LD4 Precinct Commiteemenkfjstone13
 
Kishan Reddy Report To People (2019-24).pdf
Kishan Reddy Report To People (2019-24).pdfKishan Reddy Report To People (2019-24).pdf
Kishan Reddy Report To People (2019-24).pdfKISHAN REDDY OFFICE
 
2024 04 03 AZ GOP LD4 Gen Meeting Minutes FINAL.docx
2024 04 03 AZ GOP LD4 Gen Meeting Minutes FINAL.docx2024 04 03 AZ GOP LD4 Gen Meeting Minutes FINAL.docx
2024 04 03 AZ GOP LD4 Gen Meeting Minutes FINAL.docxkfjstone13
 
2024 02 15 AZ GOP LD4 Gen Meeting Minutes_FINAL_20240228.docx
2024 02 15 AZ GOP LD4 Gen Meeting Minutes_FINAL_20240228.docx2024 02 15 AZ GOP LD4 Gen Meeting Minutes_FINAL_20240228.docx
2024 02 15 AZ GOP LD4 Gen Meeting Minutes_FINAL_20240228.docxkfjstone13
 
KAHULUGAN AT KAHALAGAHAN NG GAWAING PANSIBIKO.pptx
KAHULUGAN AT KAHALAGAHAN NG GAWAING PANSIBIKO.pptxKAHULUGAN AT KAHALAGAHAN NG GAWAING PANSIBIKO.pptx
KAHULUGAN AT KAHALAGAHAN NG GAWAING PANSIBIKO.pptxjohnandrewcarlos
 
Vashi Escorts, {Pooja 09892124323}, Vashi Call Girls
Vashi Escorts, {Pooja 09892124323}, Vashi Call GirlsVashi Escorts, {Pooja 09892124323}, Vashi Call Girls
Vashi Escorts, {Pooja 09892124323}, Vashi Call GirlsPooja Nehwal
 
N. Chandrababu Naidu Receives Global Agriculture Policy Leadership Award
N. Chandrababu Naidu Receives Global Agriculture Policy Leadership AwardN. Chandrababu Naidu Receives Global Agriculture Policy Leadership Award
N. Chandrababu Naidu Receives Global Agriculture Policy Leadership Awardsrinuseo15
 
Pakistan PMLN Election Manifesto 2024.pdf
Pakistan PMLN Election Manifesto 2024.pdfPakistan PMLN Election Manifesto 2024.pdf
Pakistan PMLN Election Manifesto 2024.pdfFahimUddin61
 
Beyond Afrocentrism: Prerequisites for Somalia to lead African de-colonizatio...
Beyond Afrocentrism: Prerequisites for Somalia to lead African de-colonizatio...Beyond Afrocentrism: Prerequisites for Somalia to lead African de-colonizatio...
Beyond Afrocentrism: Prerequisites for Somalia to lead African de-colonizatio...Muhammad Shamsaddin Megalommatis
 
Verified Love Spells in Little Rock, AR (310) 882-6330 Get My Ex-Lover Back
Verified Love Spells in Little Rock, AR (310) 882-6330 Get My Ex-Lover BackVerified Love Spells in Little Rock, AR (310) 882-6330 Get My Ex-Lover Back
Verified Love Spells in Little Rock, AR (310) 882-6330 Get My Ex-Lover BackPsychicRuben LoveSpells
 
Israel Palestine Conflict, The issue and historical context!
Israel Palestine Conflict, The issue and historical context!Israel Palestine Conflict, The issue and historical context!
Israel Palestine Conflict, The issue and historical context!Krish109503
 
TDP As the Party of Hope For AP Youth Under N Chandrababu Naidu’s Leadership
TDP As the Party of Hope For AP Youth Under N Chandrababu Naidu’s LeadershipTDP As the Party of Hope For AP Youth Under N Chandrababu Naidu’s Leadership
TDP As the Party of Hope For AP Youth Under N Chandrababu Naidu’s Leadershipanjanibaddipudi1
 
29042024_First India Newspaper Jaipur.pdf
29042024_First India Newspaper Jaipur.pdf29042024_First India Newspaper Jaipur.pdf
29042024_First India Newspaper Jaipur.pdfFIRST INDIA
 
AI as Research Assistant: Upscaling Content Analysis to Identify Patterns of ...
AI as Research Assistant: Upscaling Content Analysis to Identify Patterns of ...AI as Research Assistant: Upscaling Content Analysis to Identify Patterns of ...
AI as Research Assistant: Upscaling Content Analysis to Identify Patterns of ...Axel Bruns
 

Último (20)

30042024_First India Newspaper Jaipur.pdf
30042024_First India Newspaper Jaipur.pdf30042024_First India Newspaper Jaipur.pdf
30042024_First India Newspaper Jaipur.pdf
 
26042024_First India Newspaper Jaipur.pdf
26042024_First India Newspaper Jaipur.pdf26042024_First India Newspaper Jaipur.pdf
26042024_First India Newspaper Jaipur.pdf
 
Nurturing Families, Empowering Lives: TDP's Vision for Family Welfare in Andh...
Nurturing Families, Empowering Lives: TDP's Vision for Family Welfare in Andh...Nurturing Families, Empowering Lives: TDP's Vision for Family Welfare in Andh...
Nurturing Families, Empowering Lives: TDP's Vision for Family Welfare in Andh...
 
Defensa de JOH insiste que testimonio de analista de la DEA es falso y solici...
Defensa de JOH insiste que testimonio de analista de la DEA es falso y solici...Defensa de JOH insiste que testimonio de analista de la DEA es falso y solici...
Defensa de JOH insiste que testimonio de analista de la DEA es falso y solici...
 
BDSM⚡Call Girls in Indirapuram Escorts >༒8448380779 Escort Service
BDSM⚡Call Girls in Indirapuram Escorts >༒8448380779 Escort ServiceBDSM⚡Call Girls in Indirapuram Escorts >༒8448380779 Escort Service
BDSM⚡Call Girls in Indirapuram Escorts >༒8448380779 Escort Service
 
Enjoy Night⚡Call Girls Rajokri Delhi >༒8448380779 Escort Service
Enjoy Night⚡Call Girls Rajokri Delhi >༒8448380779 Escort ServiceEnjoy Night⚡Call Girls Rajokri Delhi >༒8448380779 Escort Service
Enjoy Night⚡Call Girls Rajokri Delhi >༒8448380779 Escort Service
 
Roberts Rules Cheat Sheet for LD4 Precinct Commiteemen
Roberts Rules Cheat Sheet for LD4 Precinct CommiteemenRoberts Rules Cheat Sheet for LD4 Precinct Commiteemen
Roberts Rules Cheat Sheet for LD4 Precinct Commiteemen
 
Kishan Reddy Report To People (2019-24).pdf
Kishan Reddy Report To People (2019-24).pdfKishan Reddy Report To People (2019-24).pdf
Kishan Reddy Report To People (2019-24).pdf
 
2024 04 03 AZ GOP LD4 Gen Meeting Minutes FINAL.docx
2024 04 03 AZ GOP LD4 Gen Meeting Minutes FINAL.docx2024 04 03 AZ GOP LD4 Gen Meeting Minutes FINAL.docx
2024 04 03 AZ GOP LD4 Gen Meeting Minutes FINAL.docx
 
2024 02 15 AZ GOP LD4 Gen Meeting Minutes_FINAL_20240228.docx
2024 02 15 AZ GOP LD4 Gen Meeting Minutes_FINAL_20240228.docx2024 02 15 AZ GOP LD4 Gen Meeting Minutes_FINAL_20240228.docx
2024 02 15 AZ GOP LD4 Gen Meeting Minutes_FINAL_20240228.docx
 
KAHULUGAN AT KAHALAGAHAN NG GAWAING PANSIBIKO.pptx
KAHULUGAN AT KAHALAGAHAN NG GAWAING PANSIBIKO.pptxKAHULUGAN AT KAHALAGAHAN NG GAWAING PANSIBIKO.pptx
KAHULUGAN AT KAHALAGAHAN NG GAWAING PANSIBIKO.pptx
 
Vashi Escorts, {Pooja 09892124323}, Vashi Call Girls
Vashi Escorts, {Pooja 09892124323}, Vashi Call GirlsVashi Escorts, {Pooja 09892124323}, Vashi Call Girls
Vashi Escorts, {Pooja 09892124323}, Vashi Call Girls
 
N. Chandrababu Naidu Receives Global Agriculture Policy Leadership Award
N. Chandrababu Naidu Receives Global Agriculture Policy Leadership AwardN. Chandrababu Naidu Receives Global Agriculture Policy Leadership Award
N. Chandrababu Naidu Receives Global Agriculture Policy Leadership Award
 
Pakistan PMLN Election Manifesto 2024.pdf
Pakistan PMLN Election Manifesto 2024.pdfPakistan PMLN Election Manifesto 2024.pdf
Pakistan PMLN Election Manifesto 2024.pdf
 
Beyond Afrocentrism: Prerequisites for Somalia to lead African de-colonizatio...
Beyond Afrocentrism: Prerequisites for Somalia to lead African de-colonizatio...Beyond Afrocentrism: Prerequisites for Somalia to lead African de-colonizatio...
Beyond Afrocentrism: Prerequisites for Somalia to lead African de-colonizatio...
 
Verified Love Spells in Little Rock, AR (310) 882-6330 Get My Ex-Lover Back
Verified Love Spells in Little Rock, AR (310) 882-6330 Get My Ex-Lover BackVerified Love Spells in Little Rock, AR (310) 882-6330 Get My Ex-Lover Back
Verified Love Spells in Little Rock, AR (310) 882-6330 Get My Ex-Lover Back
 
Israel Palestine Conflict, The issue and historical context!
Israel Palestine Conflict, The issue and historical context!Israel Palestine Conflict, The issue and historical context!
Israel Palestine Conflict, The issue and historical context!
 
TDP As the Party of Hope For AP Youth Under N Chandrababu Naidu’s Leadership
TDP As the Party of Hope For AP Youth Under N Chandrababu Naidu’s LeadershipTDP As the Party of Hope For AP Youth Under N Chandrababu Naidu’s Leadership
TDP As the Party of Hope For AP Youth Under N Chandrababu Naidu’s Leadership
 
29042024_First India Newspaper Jaipur.pdf
29042024_First India Newspaper Jaipur.pdf29042024_First India Newspaper Jaipur.pdf
29042024_First India Newspaper Jaipur.pdf
 
AI as Research Assistant: Upscaling Content Analysis to Identify Patterns of ...
AI as Research Assistant: Upscaling Content Analysis to Identify Patterns of ...AI as Research Assistant: Upscaling Content Analysis to Identify Patterns of ...
AI as Research Assistant: Upscaling Content Analysis to Identify Patterns of ...
 

EED - Profits uncontained. An analysis of container shipping ETS surcharges

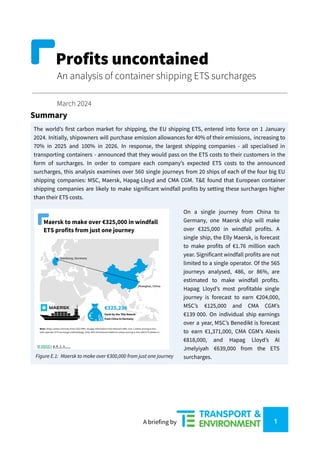
  • 1. Profits uncontained An analysis of container shipping ETS surcharges March 2024 Summary The world’s first carbon market for shipping, the EU shipping ETS, entered into force on 1 January 2024. Initially, shipowners will purchase emission allowances for 40% of their emissions, increasing to 70% in 2025 and 100% in 2026. In response, the largest shipping companies - all specialised in transporting containers - announced that they would pass on the ETS costs to their customers in the form of surcharges. In order to compare each company’s expected ETS costs to the announced surcharges, this analysis examines over 560 single journeys from 20 ships of each of the four big EU shipping companies: MSC, Maersk, Hapag-Lloyd and CMA CGM. T&E found that European container shipping companies are likely to make significant windfall profits by setting these surcharges higher than their ETS costs. Figure E.1: Maersk to make over €300,000 from just one journey On a single journey from China to Germany, one Maersk ship will make over €325,000 in windfall profits. A single ship, the Elly Maersk, is forecast to make profits of €1.76 million each year. Significant windfall profits are not limited to a single operator. Of the 565 journeys analysed, 486, or 86%, are estimated to make windfall profits. Hapag Lloyd’s most profitable single journey is forecast to earn €204,000, MSC’s €125,000 and CMA CGM’s €139 000. On individual ship earnings over a year, MSC’s Benedikt is forecast to earn €1,371,000, CMA CGM’s Alexis €818,000, and Hapag Lloyd’s Al Jmelyiyah €639,000 from the ETS surcharges. A briefing by 1
  • 2. The findings come not long after the disruptions in world trade caused by Covid, where container carriers made profits higher than those of the big tech giants.1 They are relevant in the context of attacks from the shipping industry on environmental legislation. Firstly, container companies have argued that the EU’s shipping ETS will cause a loss in traffic for European ports.2 This analysis demonstrates the contrary: carriers may actually have more of an incentive to visit European ports as they could make money out of it. Secondly, the shipping industry has argued that future legislation from the IMO should get rid of global energy efficiency indicators, such as the carbon intensity indicator (CII).3 Our analysis demonstrates that emissions pricing alone will not lead to effective price signals in the shipping industry. As such, bespoke energy efficiency legislation at both EU and IMO level is needed alongside emissions pricing. 1. Context From 1 January 2024, the EU’s Emission Trading System (ETS) covers emissions from shipping, for the first time applying the 'polluter pays’ principle to shipping companies. The law marks the first ambitious pricing mechanism to regulate international shipping’s climate impact and a significant step in the sector’s journey towards decarbonisation. The ETS puts a cap on the total amount of pollution for sectors it regulates, which descends over time, eventually forcing those sectors to decarbonise. It will cover 100% of emissions from voyages between European ports and 50% of emissions between EU and non-EU ports. In late 2023, all major container shipping companies announced that they would charge additional costs to their clients in response to the ETS. These ‘ETS-’ or ‘emissions -surcharges’ are ostensibly to cover the costs that the shipping companies will be liable for under the ETS. They apply on a container level, differ for each journey and are higher for refrigerated containers (‘reefers’), which require onboard electrical energy. For example, a client that wants to send a standard (non-refrigerated) twenty-foot equivalent (TEU) container from North Europe to North America will have to pay an extra €24 to Hapag-Lloyd, €37 to MSC, €40 to CMA CGM or €40.5 to Maersk. In order to evaluate the validity of these extra costs, this analysis compares the expected ETS cost for these large European shipping companies to the revenues they will raise from their announced ETS surcharges. In 2024, shipping companies will only be liable to pay for 40% of their ETS-covered emissions. This will increase to 70% in 2025, and 100% from 2026 onwards. Therefore, a further increase in surcharges - and profits - can be expected after 2024. 2. Methodology This analysis focuses on a total of 80 ships operated by Maersk, CMA CGM, Hapag-Lloyd, and MSC, 20 ships by each company. These ships carried out a total of 565 individual journeys (e.g. from the Far East to 3 Resolution to the IMO’s Marine Environment Protection Committee (MEPC)’s 81st Session (December 2023). Resolution clarifying the current status of the CII rating system. Retrieved from https://www.imo.org/ 2 World Shipping Council (ongoing). The EU ETS. Retrieved at https://www.worldshipping.org/the-eu-ets 1 Bloomberg (August 2021). Container Shipping Earnings Now Rival Apple. It’s Not a Good Look. Retrieved at https://www.bloomberg.com/opinion/articles/2021-08-19/container-shipping-is-making-a-killing-this-year-but -will-we-have-christmas A briefing by 2
  • 3. North Europe, or the Mediterranean to North America) during the period 18/06/2023 - 18/12/2023. Ships in the sample were selected to be representative of the energy efficiency of each company’s overall fleet operated under the stope of the ETS Directive. We define a windfall profit as the difference between the ETS surcharges levied by the shipping companies and the expected ETS costs that they incur. We calculate this using 2023 real operational routes and mapped the journeys made by each ship that correspond to the routes for which each company has announced a surcharge. We multiplied each ship’s average emissions per nautical mile, which were derived from the EU MRV regulation, by the distance travelled on each journey.4 The resulting emissions are multiplied by the ETS prices assumed by the carriers,5 producing the total emission costs for each journey. These were then converted to per-container ETS costs using load factors also derived from transport work data available in the 2022 MRV database. Finally, total emission costs were subtracted from the ETS emissions surcharge revenue - derived by multiplying the announced route-specific surcharges with the utilised container capacity - to find the ETS profit margin for each journey. The results from this analysis should be considered conservative for several reasons. Firstly, our emissions efficiency data comes from 2022 annual averages, which will be lower than 2024, especially in the context of new ships running on alternatives to HFO. Secondly, our load factors are lower than the accepted industry average of 70% and we use the same carbon price estimated by the carriers, which is much higher than the actual ETS price. Full methodology and all assumptions can be found in Annex 1. 3. Results The results clearly show that surcharge pricing systematically outstrips the expected emission cost. On the most profitable journey overall, Maersk’s Elly Maersk will likely generate €325,000 in windfall profits. The most profitable ship for MSC is Conti Courage, generating €125,000 on a journey between Sines, Portugal and Savannah, US. For CMA CGM’s, it is APL New Jersey earning €139,000 in profits between Bremerhaven, Germany and New Orleans, US. Finally, Hapag-Lloyd’s CAl Jimeliyah is estimated to make €204,000 on a journey from Yantian, China and Wilhelmshaven, Germany. Figure 1 shows the ten most profitable journeys in our sample. 5 €90/t CO2 in the case of MSC, Maersk, and Hapag-Lloyd,€80/t CO2 for CMA CGM 4 A journey is defined as a one-way trip (most often calling at multiple ports) by a ship between the two most distant ports in terms of nautical miles along one route. A briefing by 3
  • 4. Figure 1: Most profitable individual journeys Looking at profits over one year in our sample, Maersk’s Elly Maersk ranks as the most profitable ship overall, projected to make €1,765,000 in windfall ETS profits in 2024.6 For the other carriers, MSC’s Benedikt CMA CGM’s Alexis, and Hapag-Lloyd’s Al Jameliyah follow with substantial additional annual profits of €1,371,000, €818,000, and €639,000 respectively, as shown in Figure 2. In our sample, the 6 most profitable ships - 5 of which are operated by Maersk - generate annual cumulative profits exceeding €1,000,000. An overview of the most and least profitable ships and journeys can be found in Annex 2. 6 Yearly profits calculating scaling 2023 AIS data from a 6-month sample. A briefing by 4
  • 5. Figure 2: Most profitable vessel for four large container ship operators Out of a total of 565 journeys, only 79, or 14%, did not produce profits in our analysis. 5 of the 10 most loss-generating journeys were operated by CMA CGM, followed by MSC (4) and Maersk (1). On the other hand, 9 of the 10 most profitable journeys belong to Maersk, one being operated by Hapag-Lloyd. Comparing the volume of the loss-making journeys shows that they are far outstripped by their profitable counterparts. Aggregated, the 25 largest losses account for -€934,000. In comparison, the 4 most profitable journeys alone generate €996,000 in windfall profits. Total cumulative windfall profits are €15,156,000 across our sample. Given that our sample only is a small share of each company’s fleet that will call in Europe and charge surcharges, this will only be a small part of the windfall profits earned by carriers. Looking at company averages, Maersk is projected to gain the highest profits across our sample, at €59,909, followed by Hapag-Lloyd (€23,000), MSC (€16,000) and CMA CGM (€14,000). The average profits for each journey in our sample was €25,000 in windfall profits (Figure 3). A briefing by 5
  • 6. Figure 3: Average journey profits for each company across all routes Looking at the routes where all carriers trade and have announced profit, there is strong variation in the windfall profits earned (Figures 2.1, 2.2 and 2.3 in Annex 2). On the route from West Africa to Europe, Maersk earns €53,000, while Haag-Lloyd incurs losses of -€3,000. However, on routes between Mediterranean ports, Hapag-Lloyd generates the highest average profits of €75,000 per journey compared to CMA CGM’s lowest €5,000. On journeys from North Europe to the Mediterranean, CMA CGM generates windfall profits of €25,000 per journey, with Maersk leading the field with €83,000 on average. From the sampled journeys, we found that the company with the largest windfall profits on average per journey is Maersk, with €60,000, followed by Hapag-Lloyd (€23,000), MSC (€16,000) and CMA CGM (€14,000) for every single one of their many journeys to and from the EU.7 7 Beyond these routes, our sample allows the estimation of profits on the level of individual journeys and ships. Company-level figures and their comparison are limited, as different surcharge schemes and operating profiles may favor specific routes not covered by this analysis. A briefing by 6
  • 7. Our analysis also considered the fluctuating price of the EU’s ETS. While the carriers all assumed prices of €90/tCO2 (or €80tCO2 in the case of CMA CGM), these prices are all notably higher than the current ETS price, of €56.75/tonne CO2.8 Figure 4 shows that windfall profits would be much higher than previously analysed if we take into account the currently lower ETS price. Given that entities can buy ETS allowances on the ETS spot market at even lower prices than this, it is likely that the carriers wait for favourable ETS prices to buy their EUAs for the first quarter and have made profits far above those analysed above. If Maersk bought their EUAs for the first quarter of 2024 at the ETS price at the time of writing of €56,75, their average profits for each journey would increase by 18% (€60,000 to €71,000). For Hapag-Lloyd, profits would increase 74% (€23,000 to €40,000), for MSC, profits would increase 54% (€16,000 to €35,000) and for CMA CGM - who estimate a lower ETS price of €80 than their competitors - the increase would be 43% from €14,000 to average profits per journey to €20,000. Figure 4: Comparison of company average windfall profits per journey across all routes for emission prices of €90/t CO2 and €56,75/t CO2 8 *as of the 12/03/2024, retrieved from https://sandbag.be/carbon-price-viewer/ A briefing by 7
  • 8. In our analysis, we also considered the possibility of varying load factors, i.e. that the containerships will not always carry the same amount of containers. Although the container industry uses default load factors of 70% cargo load,9 our main analysis considered load factors calculated from reported values for transport work under the EU’s MRV and default reefer load factors of 25%, making our analysis conservative. A sensitivity analysis provided in Annex 2.4 found that even at lower load factors of 35% - i.e. half the agreed industry default value - carriers would generate windfall profits on two-thirds (i.e. in 371) of journeys, with average profits of just under €4,000 per journey. 4. Conclusions Our analysis shows that profits from the ETS surcharges are likely to outstrip shipping companies’ actual ETS costs. Based on these findings, container liners are projected to generate considerable windfall profits up to €325,000 per journey. Annually, some ships will bring in more than €1 million in windfall profits. Their clients and final consumers bear not only the emissions costs, while the carriers earn substantial new profits. The economies of scale with which shipping operates enable this type of cost pass-through; consumers would pay negligible amounts for final products while shipping companies increase their margins.10 This conclusion is conservative, as it follows the container carriers' assumed emission cost of 90€/tCO2, almost twice the current ETS price of €56,75 (as of 12/03/2024). While carriers may argue that these costs will be distributed across different routes and through their whole fleet, our results demonstrate that loss-making ships and routes are only a small minority of each company’s fleet. As such, it is clear that the ETS surcharges will be profit-making - rather than a cost pass-through - exercise. This analysis has a number of implications for policy-makers. Firstly, it shows that fears that the ETS will lead to ‘business leakage’ or the transfer of port activity from European to non-European ports is unfounded. Carriers will have an incentive to call at European ports, in order to make surcharge profits, rather than avoid European ports. Secondly, it suggests that emission pricing on its own may not completely decarbonise the shipping industry. The ETS will be important in implementing the ‘polluter pays principle’ and in raising revenues for public authorities to reinvest in public services and decarbonisation projects that may otherwise not receive funding. Moreover, the difference in ETS surcharges per company suggests that the ETS introduces an element of competition for emissions efficiency between carriers. This is, however, limited by the concentrated nature of container shipping and the ease at which the shipping industry can pass on costs to their clients and the final customer (that is, maritime shipping’s low price elasticity of demand). Therefore, bespoke additional legislation is needed in addition to the ETS to ensure operational and technical energy efficiency improvements are made. This is highly relevant in the context of the shipping 10 Transport & Environment (June 28, 2022). The small price to pay to clean up shipping. Retrieved from https://www.transportenvironment.org/discover/the-small-price-to-pay-to-clean-up-shipping/ 9 All major container companies are part of the Clean Cargo Working Group, whose methodology for ascribing emissions to individual containers states that ‘ Historical analysis of carrier-reported vessel utilization data reflected an average capacity utilization of 70% across the largest historical Clean Cargo tradelanes.’ Smart Frieght Centre (January, 2024). Clean Cargo GHG Emission INtensity Calculation Methods. Retrieved from https://www.smartfreightcentre.org/en/our-programs/clean-cargo-1/clean-cargo/ A briefing by 8
  • 9. industry lobbying against energy efficiency measures (the CII) at the IMO.11 Policy-makers must recognise that shipping decarbonisation is not simple; it will need multiple measures (such as emissions pricing, fuel standards, energy efficiency measures and subsidies) working at the same time to chart the path to green shipping. Further information Jacob Armstrong Shipping Policy Manager Transport & Environment jacob.armstrong@transportenvironment.org Felix Klann Junior Shipping Policy Analyst felix.klann@transportenvironment.org Mobile: +32 (0) 470 83 55 17 11 Resolution to the IMO’s Marine Environment Protection Committee (MEPC)’s 81st Session (December 2023). Resolution clarifying the current status of the CII rating system. Retrieved from https://www.imo.org/ A briefing by 9
  • 10. Annex 1: Full methodology This analysis considers a total of 80 ships in operation for the companies Maersk, CMA CGM, Hapag-Lloyd, and MSC. To ensure the selected ships do not only represent company fleets, but their fleet operating in the EEA, we first cross-referenced data on ship operation from Alphaliner with the ships in the EU MRV THETIS database12 . From those that did, the sample was drawn to represent each operator’s respective fleets according to their energy efficiency per container. In line with the scope of the current shipping MRV, we only considered ships above 5,000 gross tonnage. Since container shipping companies charges are higher for more energy-intensive refrigerated containers13 , the ‘reefer capacity’ on each ship was added separately from Clarksons World Fleet Register.14 Thus, we selected a sample of 20 ships for each company (see Table A.1). Company Energy efficiency of fleet that called in EU/EEA in 2022 (in kg CO2/TEU-nm) Energy efficiency of 20 sampled ships (in kg CO2/TEU-nm) Hapag-Lloyd 0.11 0.10 MSC 0.13 0.14 Maersk 0.10 0.10 CMA CGM 0.15 0.15 Table A.1: carbon intensity of ships in our sample compared to that of the fleet that visited EU/EEA ports in 2022 We calculated emissions based on a ship’s journeys, defined as one-way trips by a ship between two most distant ports in terms of nautical miles along one route.15 They correspond to the routes for which the container companies have announced surcharges. Additionally, journeys closely represent the origin and destination of containers shipped along global trade lanes. The journeys in this analysis rely on simplified assumptions to the origin and destination of carried containers, namely calculating surcharges for utilised container capacity on the full journey, not accounting for cargo discharge and loading on intermediary port calls. Our use of annual average emissions and used cargo capacity of each individual ship mitigates its impact, as those represent the true annual cargo load factor and emissions spread of a vessel. In our analysis, we included the distances16 between all port calls17 within a 6-month window from 17 All port calls within the date range were extracted from https://marinetraffic.com 16 Port-to-port distances were extracted from https://sea-distances.org and http://ports.com/ 15 In our analysis we differentiate between a journey - a full, end to end, route between two regions which may have multiple port calls in between - and a voyage, defined by the EU as ‘the last berth or ship-to-ship transfer within a port of call to the first berth or ship-to-ship transfer in the following port of call’. Retrieved from https://climate.ec.europa.eu/system/files/2017-06/20170517_voyages_in_ports_en.pdf 14 Clarksons Research (2023). Clarksons World Fleet register. Retrieved from https://www.clarksons.net/wfr/ 13 Smart Freight Centre (2024). Clean Cargo Ocean Containership Greenhouse Gas Emission Intensity Calculation Methods. Retrieved from https://www.smartfreightcentre.org/en/our-programs/clean-cargo-1/clean-cargo/ 12 EMSA (2023). 2022-v111-22112023-EU MRV. Retrieved from https://mrv.emsa.europa.eu/#public/faq A briefing by 10
  • 11. June 18, 2023, to December 18, 2023, for each ship to ensure a sufficient amount of journeys on longer routes are covered. In line with ETS maritime coverage, anchorages were not considered. Figure A.2 shows a full overview of our approach. Figure A.2: Our approach to calculating windfall profits The emissions considered under the ETS were then calculated by multiplying a ship’s average emissions per nautical mile by the miles travelled on each journey, with respect to the specific rules on the coverage of voyages. In line with the coverage of the ETS, we counted 50% of the emissions from voyages between EEA and non-EEA ports (Figure A.3). The resulting emissions were then multiplied by the expected carbon A briefing by 11
  • 12. price announced by each carrier: €90 for each tonne of CO2 for Maersk,18 Hapag-Lloyd19 and MSC,20 €80 for CMA CGM.21 As this is now above current carbon price levels, a sensitivity analysis using a price of €53 per tonne of CO2 Is provided in Annex 2. As the shipping sector benefits from a ‘phase-in’ of their ETS liabilities (companies will only have to pay for 40% of their total ETS-covered emissions in 2024 and 70% in 2025), we have adjusted each journey’s emissions to reflect their lesser liabilities in 2024. The resulting emissions are multiplied by the ETS price announced by each carrier,22 producing the per-container and total emission costs for each journey. The emission costs were subtracted from the ETS emissions surcharge revenue to assess the windfall profits resulting from container operators' ETS surcharges. Figure A.3: Geographical scope of ETS emissions This analysis produces conservative profit estimates, as it uses emission efficiency data from 2022 (the most recently available through the EU’s MRV). Efficiency improvements since then - and in particular the uptake of new vessels that do not use HFO and have lower emissions factors, like LNG - mean that 2024 22 €90/t CO2 in the case of MSC, Maersk, and Hapag-Lloyd and €80/t CO2 for CMA CGM. 21 CMA CGM (1 December 2023). Launching of EU Emissions Trading System application to shipping. Retrieved from https://www.cma-cgm.com/local/vietnam/news/187/launching-of-eu-emissions-trading-system-application-to-ship ping 20 MSC (10 November 2023). Implementing EU Emissions Trading System (ETS) from 1 January 2024. Retrieved from https://www.msc.com/en/newsroom/customer-advisories/2023/october/implementing-eu-ets-from-1-january-2024 19 Hapag-Lloyd (1 December 2023). Here's an update on the EU Emission Trading System (ETS) and Emission Allowance Surcharge. Retrieved from https://www.hapag-lloyd.com/en/services-information/news/2023/12/here-s-an-update-on-ets.html 18 Maersk (15 September 2023). EU Emissions Trading System (ETS) effective January 1, 2024. Retrieved from https://www.maersk.com/news/articles/2023/09/15/eu-emissions-trading-system-ets A briefing by 12
  • 13. emissions efficiency will be greater. This would tend to reduce carriers’ ETS liabilities and increase surcharge profits. Additionally, the shipping ETS has specific rules for certain neighbouring transhipment ports. Under the legislation, port calls in Tanger Med in Morocco and Port Said in Egypt will not be considered port calls. This means that, for example, a journey from Singapore (non-EU) to Valencia (EU) through (only) Tanger Med (non-EU neighbouring port) is considered to be one inbound voyage from Singapore to Valencia, as if the stop in Tanger Med did not take place. Similarly, specific rules for journeys to, from, and within EU outermost regions were applied to the analysis.23 Our analysis also takes into account the fact that container vessels rarely use their full cargo capacity, as well as the phase-in period of the shipping ETS. We calculated each ship’s load factor using data reported by each company to the European Commission.24 In addition to average emissions per nautical mile, shipping companies also report total annual CO2 emissions, and CO2 emissions per transport work (measured in tonne-nautical miles). From this data, it is possible to calculate the average tonnes of cargo and thus the number of containers onboard (Figure A.4). Where no ship-based load factor was found,25 we assumed a load factor of 70%, as per the standard agreed by container companies themselves based on historical capacity. The load factors we use in our analysis are typically lower than 70% and therefore lead to lower surcharge profits than what would be generated under the carriers' own assumptions. This buffer in used capacity accounts for containers that do not travel the full journey distance. For refrigerated “reefer” containers, we used a fixed load factor of 25% (which is also an industry standard).26 26 Smart Freight Centre (2024) Ocean Containership Greenhouse Gas Emission Intensity Calculation Methods. Retrieved from: https://smart-freight-centre-media.s3.amazonaws.com/documents/Clean_Cargo_GHG_Emission_Intensity_Ca lculation_Methods_2024-01-12_yyIIsag.pdf 25 This exception exclusively applies to the AMALTHEA. 24 For the conversion of cargo in tonnes to 20-foot-containers assuming a default weight of 12 tonnes in line with the Shipping MRV Monitoring sub-group of the European Sustainable Shipping Forum (2017). Retrieved from https://climate.ec.europa.eu/system/files/2017-06/20170517_guidance_cargo_en.pdf 23 In line with EU ETS maritime guidelines’ specific rules and derogations. Retrieved from https://climate.ec.europa.eu/eu-action/transport/reducing-emissions-shipping-sector/faq-maritime-transport -eu-emissions-trading-system-ets_en A briefing by 13
  • 14. Figure A.4: Our approach to calculating utilized container capacity (load factors) A briefing by 14
  • 15. Annex 2: Additional data Most profitable journeys Vessel Journey Port Of Origin Country of Origin Total Profit Company ELLY MAERSK Far East to North Europe Port SHANGHAI China €325,000 Maersk ELLY MAERSK North Europe to Far East Port HAMBURG Germany €233,000 Maersk ELLY MAERSK North Europe to Far East Port HAMBURG Germany €233,000 Maersk AL JMELIYAH East Asia - North Europe Port YANTIAN China €204,000 Hapag-Lloyd EDITH MAERSK Far East to North Europe Port YANTIAN China €190,000 Maersk EDITH MAERSK Far East to North Europe Port YANTIAN China €190,000 Maersk EDITH MAERSK North Europe to Far East Port HAMBURG Germany €185,000 Maersk EDITH MAERSK North Europe to Far East Port HAMBURG Germany €185,000 Maersk EBBA MAERSK North Europe to Far East Port HAMBURG Germany €166,000 Maersk EBBA MAERSK North Europe to Far East Port HAMBURG Germany €166,000 Maersk ELEONORA MAERSK Far East to North Europe Port QINGDAO China €151,000 Maersk APL NEW JERSEY North Europe to USA Port BREMERHAVEN Germany €139,000 CMA CGM APL NEW JERSEY North Europe to USA Port BREMERHAVEN Germany €135,000 CMA CGM ELEONORA MAERSK North Europe to Far East Port ANTWERP Belgium €134,000 Maersk CAP SAN TAINARO Europe to East Coast South America Port HAMBURG Germany €128,000 Maersk CONTI COURAGE Europe to NAM (USA, Canada & Mexico) Port SINES Portugal €125,000 MSC A briefing by 15
  • 16. CAP SAN JUAN Mediterranean to Middle East & Indian Subcontinent Port ALGECIRAS Spain €125,000 Maersk CAP SAN JUAN Mediterranean to Middle East & Indian Subcontinent Port ALGECIRAS Spain €125,000 Maersk CAP SAN JUAN Mediterranean to Middle East & Indian Subcontinent Port ALGECIRAS Spain €125,000 Maersk CAP SAN LAZARO Mediterranean to Middle East & Indian Subcontinent Port ALGECIRAS Spain €124,000 Maersk CAP SAN LAZARO Mediterranean to Middle East & Indian Subcontinent Port ALGECIRAS Spain €124,000 Maersk CAP SAN LAZARO Mediterranean to Middle East & Indian Subcontinent Port ALGECIRAS Spain €124,000 Maersk LE HAVRE Europe to Oceania & Indian Ocean Islands Port HAMBURG Germany €122,000 MSC APL FULLERTON Asia to North Europe Port BUSAN NEW PORT South Korea €120,000 CMA CGM APL FULLERTON Asia to North Europe Port BUSAN NEW PORT South Korea €120,000 CMA CGM Table 2.1: 25 most profitable journeys Least profitable journeys Vessel Journey Port Of Origin Country of Origin Total Profit Company LE HAVRE Oceania & Indian Ocean Islands to Europe Port ADELAIDE Australia - €185,000 MSC APL NEW YORK Oceania to Europe Port ADELAIDE Australia - €79,000 CMA CGM APL NEW YORK Oceania to Europe Port ADELAIDE Australia - €79,000 CMA CGM APL MEXICO CITY Oceania to Europe Port ADELAIDE Australia - €69,000 CMA CGM C HAMBURG Oceania & Indian Ocean Islands to Europe Port ADELAIDE Australia - €61,000 MSC APL MEXICO CITY Oceania to Europe Port BOTANY Australia - €58,000 CMA CGM APL FULLERTON North Europe to Far East Port ROTTERDAM MAASVLAKTE Netherlands - €56,000 CMA CGM CONTI CORTESIA NAM (USA, Canada & Mexico) to Europe Port LOS ANGELES United States - €46,000 MSC A briefing by 16
  • 17. GSL KALLIOPI North Europe to Middle East & Indian Subcontinent Port THAMES United Kingdom - €41,000 Maersk CONTI CORTESIA Oceania & Indian Ocean Islands to Europe Port MELBOURNE Australia - €33,000 MSC APL NEW YORK North Europe to Far East Port ROTTERDAM MAASVLAKTE Netherlands - €30,000 CMA CGM C HAMBURG Oceania & Indian Ocean Islands to Europe Port ADELAIDE Australia - €29,000 MSC GSL KALLIOPI North Europe to Middle East & Indian Subcontinent Port BREMERHAVEN Germany - €28,000 Maersk MSC AJACCIO South America East Coast to Europe Port SANTOS Brazil - €27,000 MSC CSL MANHATTAN North Am East Coast incl MX East Coast - South Europe Port HOUSTON United States - €12,000 Hapag-Lloyd CHACABUCO North Am East Coast incl MX East Coast - North Europe Port ALTAMIRA Mexico - €11,000 Hapag-Lloyd CHACABUCO North Am East Coast incl MX East Coast - North Europe Port ALTAMIRA Mexico - €11,000 Hapag-Lloyd CHACABUCO North Am East Coast incl MX East Coast - North Europe Port ALTAMIRA Mexico - €11,000 Hapag-Lloyd CHACABUCO North Am East Coast incl MX East Coast - North Europe Port ALTAMIRA Mexico - €11,000 Hapag-Lloyd MSC AJACCIO Europe to South America East Coast Port LIVORNO Italy - €10,000 MSC EMMA A Central America / Caribbean - South Europe Port PANAMA ATLANTIC Panama - €10,000 Hapag-Lloyd MSC ADELAIDE Mediterranean to North Europe Port NAPOLI Italy - €10,000 MSC CELSIUS LONDON Middle East & Indian Subcontinent to North Europe Port ALEXANDRIA Egypt - €9,000 Maersk MSC AJACCIO South America East Coast to Europe Port RIO DE JANEIRO Brazil - €8,000 MSC DALLAS EXPRESS West Africa - Europe Port LUANDA Angola - €8,000 Hapag-Lloyd Table 2.2: 25 least profitable journeys A briefing by 17
  • 18. Most profitable ships Company Vessel Name Annual Profit Maersk ELLY MAERSK €1,766,000 Maersk EDITH MAERSK €1,500,000 Maersk CAP SAN JUAN €1,436,000 MSC BENEDIKT €1,371,000 Maersk CAP SAN LAZARO €1,255,000 Maersk EBBA MAERSK €1,027,000 Maersk CAP SAN ANTONIO €912,000 CMA CGM ALEXIS €818,000 MSC CAPE SOUNIO €752,000 MSC CONTI COURAGE €746,000 Table 2.3: 10 Most profitable ships Least profitable ships Company Vessel Name Annual Profit CMA CGM APL NEW YORK - €375,000 CMA CGM APL MEXICO CITY - €205,000 MSC LE HAVRE - €127,000 Hapag-Lloyd CHACABUCO - €66,000 Maersk CELSIUS LONDON - €47,000 MSC C HAMBURG - €42,000 CMA CGM ATLANTIC GENEVA - €32,000 Maersk AS PALINA - €15,000 Hapag-Lloyd EMMA A - €9,000 MSC MSC AGADIR €11,000 Hapag-Lloyd EMOTION €28,000 Table 2.4: 10 least profitable ships A briefing by 18
  • 19. Sensitivity analysis Company Baseline average windfall profits per journey Average windfall profits per journey at €53/tCO2 Average windfall profits per journey at 35% load factor Hapag-Lloyd €23,000 €40,000 -€5,000 MSC €16,000 €35,000 €4,000 Maersk €60,000 €71,000 €25,000 CMA CGM €14,000 €20,000 €2,000 All sampled ships €25,000 €35,000 €4,000 Profitable journeys 486 (86%) 553 (98%) 371 (66%) Loss-making journeys 79 (14%) 12 (2%) 194 (34%) Profitable ships 71 (89%) 79 (99%) 51 (64%) Loss-making ships 9 (11%) 1 (1%) 29 (36%) Table 2.5: Sensitivity analysis for ETS price. The companys’ estimated price of €90/tCO2 for Maersk, Hapag-Lloyd and MSC, €80/tCO2 for CMA CGM. €56.75/tCO2 (ETS price on 20/02/2024). Load factor of 35% half of accepted industry average of 70%. A briefing by 19
  • 20. Route comparisons Figure 2.1: Average journey profits for each company from West Africa to Europe; “Abidjan to Antwerp”, “Abidjan to Marseille”, and “Nouakchott to Lisbon” for CMA CGM A briefing by 20
  • 21. Figure 2.2: Average journey profits for each company within the Mediterranean; “Middle East to South Europe” for Hapag-Lloyd A briefing by 21
  • 22. Figure 2.3: Average journey profits for each company from North Europe to the Mediterranean; “Intra”-EU for Hapag-Lloyd A briefing by 22