TRB 2014 - OneBusAway Multi-region - Rapidly Expanding Mobile Transit Apps to New Cities - Poster

Presented at Transportation Research Board 2014 - Real-time transit information offers many benefits to transit riders, including reduced wait times and increased customer satisfaction. However, offering real-time transit services has been challenging for many transit agencies. While mobile apps have emerged as a preferred dissemination method for real-time information, it is typically cost-prohibitive for transit agencies to fund custom development of native mobile apps for all popular smartphone platforms. Third-party developers can offer services if an agency openly shares real-time data, but these individuals are volunteers whose priorities and deadlines may not be the same as the agency’s. As a result, few cities have full app portfolios that cover all smartphone platforms. This paper presents the OneBusAway multi-region project, a collaborative effort that is enabling the rapid expansion of native mobile transit apps to new cities. OneBusAway is an open-source transit information system that has provided real-time transit services to the Puget Sound, WA area since 2008. The new OneBusAway multi-region feature expands the coverage of the existing Android, iPhone, Windows Phone, and Windows 8 apps for OneBusAway to new cities including Tampa and Atlanta. The multi-region system architecture, collaborative design and development process, and lessons learned from this ground-breaking project are discussed. The fundamental shift from proprietary to open-source software in the transit industry that has made this type of project possible is also examined.
Recomendados

Recomendados
Mais conteúdo relacionado
Mais de Sean Barbeau
Mais de Sean Barbeau (20)
Último
Último (20)
TRB 2014 - OneBusAway Multi-region - Rapidly Expanding Mobile Transit Apps to New Cities - Poster
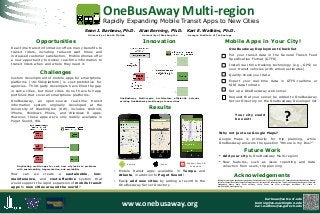
- 1. OneBusAway Multi-region Rapidly Expanding Mobile Transit Apps to New Cities Sean J. Barbeau, Ph.D. University of South Florida Alan Borning, Ph.D. Kari E. Watkins, Ph.D. University of Washington Georgia Institute of Technology Mobile Apps in Your City! Innovation Opportunities Real-time transit information offers many benefits to transit riders, including reduced wait times and increased customer satisfaction. Mobile phones offer a new opportunity to deliver real-time information to transit riders when and where they need it. OneBusAway Deployment Checklist Put your transit data in the General Transit Feed Specification Format (GTFS) Install real-time tracking technology (e.g., GPS) on your transit vehicles (with arrival estimates) Challenges Quality-check your data Custom development of mobile apps for smartphone platforms (~$150k/platform) is cost-prohibitive for agencies. Third-party developers have filled the gap in some cities, but most cities do not have full app portfolios that cover all smartphone platforms. OneBusAway, an open-source real-time transit information system originally developed at the University of Washington (UW), includes Android, iPhone, Windows Phone, and Windows 8 apps. However, these apps were only readily available in Puget Sound, WA. Export your real-time data in GTFS-realtime or SIRI data formats Set up a OneBusAway web server OneBusAway Multi-region Architecture efficiently existing OneBusAway mobile apps to new cities extends Request that your server be added to OneBusAway Server Directory on the OneBusAway Developer list Results Your city could be next! ? Why not just use Google Maps? Google Maps is primarily for trip planning, while OneBusAway answers the question “Where is my Bus?” Future Work • Add your city to OneBusAway Multi-region! Duplicating mobile apps for each new city leads to problems with sustainability, fragmentation, and scalability How can we create a sustainable, lowmaintenance, and cost-effective system that would support the rapid expansion of mobile transit apps to new cities around the world? Android iPhone Windows Phone & Windows 8 • Mobile transit apps available in Tampa and Atlanta, in addition to Puget Sound! • Easily add new cities by adding a record to the OneBusAway Server Directory www.onebusaway.org • New features, such as issue reporting and data collection from users, trip planning Acknowledgements Funding for multi-region development provided by the National Center for Transit Research at USF. Atlanta deployment funded by the National Center for Transportation Productivity and Management, GVU Center and IPAT at Georgia Tech. Thanks to Hillsborough Area Regional Transit, and Metropolitan Atlanta Rapid Transit Authority, Sound Transit, and other multi-region contributors. Full credits at http://bit.ly/OBA_multiregion_blog. barbeau@cutr.usf.edu borning@cs.washington.edu kari.watkins@ce.gatech.edu Scan for full paper
Notas do Editor
- Poster advice from TRB (and others)The goals in designing a poster should be:i) To attract attention,ii) To provide a clear overview of your work,iii) To provide enough material to explain the research without an oral explanation, andiv) To provide enough material to initiate discussion and questions.Suggestions from Poster Authors, Viewers, and Other Conferences (1)Simplicity and clarity are the keys to an effective poster. Simplicity - Avoid overwhelming viewers with too much information, the casual viewer should be able to identify the main messages after a quick look at the poster. Remember the full paper is on the meeting DVD-ROM and handouts may be provided. Clarity - Identify a limited number of messages viewers should take away – 3 is about the maximum number possible. The messages should be clear, novel, and important.General Design Suggestions Viewers find it easier to follow a poster printed on one large sheet with the material arranged in columns. Arrange material in a logical sequence that is clear to readers (typically starting at top left and ending at bottom right.) Strong visual contrast is critical – many people have trouble distinguishing between closely related colors. For example approximately 7 percent of the male population—either cannot distinguish red from green, or see red and green differently. Text and illustrations should be easily readable from 3 feet away. Color is a good tool to highlight important points, however too many colors make poster look “busy” and make it difficult for viewers to find the critical points. Use pictures, graphs, and tables instead of text where possible – try for 50% graphics. Text- Text should be dark on white or light paper- Long paragraphs will not be read – use short statements or bullet points.-Avoid abbreviations, acronyms, and jargon-Try to state your main results in 6 lines or less-Use sans serif fonts (ex. Arial or Helvetica) not serif fonts (ex. Times Roman)Illustrations-Charts, drawings, and illustrations should be similar to those used in PowerPoint presentations but simpler and more heavily drawn-Illustrations should include titles or labels, labeled axes and identified units****Poster Content– the specific elements will depend on the research Title, poster and paper number, author names, institutional affiliation - Letters 1 - 2” high – across the top of the poster Introduction / Objectives Statistical or Analytical Methods Summary / Results Conclusions Future Directions Acknowledgements