Overview of mit sloan case study on ge data and analytics initiative titled gone fishing - for data
•
1 gostou•344 visualizações

MITSloan case study on data and analytics at GE

Recomendados
Recomendados
Mais conteúdo relacionado
Mais procurados
Mais procurados (20)
Semelhante a Overview of mit sloan case study on ge data and analytics initiative titled gone fishing - for data
Semelhante a Overview of mit sloan case study on ge data and analytics initiative titled gone fishing - for data (20)
Mais de Gregg Barrett
Mais de Gregg Barrett (20)
Último
Último (20)
Overview of mit sloan case study on ge data and analytics initiative titled gone fishing - for data
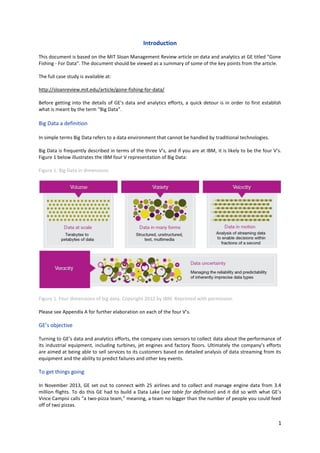
- 1. 1 Introduction This document is based on the MIT Sloan Management Review article on data and analytics at GE titled “Gone Fishing - For Data”. The document should be viewed as a summary of some of the key points from the article. The full case study is available at: http://sloanreview.mit.edu/article/gone-fishing-for-data/ Before getting into the details of GE’s data and analytics efforts, a quick detour is in order to first establish what is meant by the term “Big Data”. Big Data a definition In simple terms Big Data refers to a data environment that cannot be handled by traditional technologies. Big Data is frequently described in terms of the three V’s, and if you are at IBM, it is likely to be the four V’s. Figure 1 below illustrates the IBM four V representation of Big Data: Figure 1: Big Data in dimensions Figure 1. Four dimensions of big data. Copyright 2012 by IBM. Reprinted with permission. Please see Appendix A for further elaboration on each of the four V’s. GE’s objective Turning to GE’s data and analytics efforts, the company uses sensors to collect data about the performance of its industrial equipment, including turbines, jet engines and factory floors. Ultimately the company’s efforts are aimed at being able to sell services to its customers based on detailed analysis of data streaming from its equipment and the ability to predict failures and other key events. To get things going In November 2013, GE set out to connect with 25 airlines and to collect and manage engine data from 3.4 million flights. To do this GE had to build a Data Lake (see table for definition) and it did so with what GE’s Vince Campisi calls “a two-pizza team,” meaning, a team no bigger than the number of people you could feed off of two pizzas.
- 2. 2 Seventy days later GE had created a Data Lake which provided the company with the ability to ingest and connect the full flight data from the engines, and also integrate the engine data with maintenance visits and parts information. This data was then provided to GE’s data science community to look at things that were reducing time on wing for customers. What is a Data Lake? A Data Lake is a central source in which data can be used in a variety of ways for many different internal customers, some currently of interest, others to be discovered in the future. Importantly a Data Lake provides the organisation with the centralization of data, a capability required in order to break down unwanted data silos. The growing use of Data Lakes has been made possible by the relatively low cost of large-scale storage on Hadoop. A Data Lake brings a different paradigm As articulated in the article, when using a Data Lake, the data is collected in its raw format and there is no modelling (structuring) of the data up front like what would be done in a traditional data warehouse. Using such an approach GE takes the position that they don’t understand the relationships that matter and don’t understand fully what they are going to find when they bring all of these data sets together. In summary GE’s Data Lake approach is all about collecting data in its raw format, pumping it into one place in order to break down data silos, and then modelling the data based on the outcome they are trying to solve for. More than just a technology solution Moving beyond merely the technology solution GE also addressed organisational culture as well as the hiring and development of analytics talent. According to Campisi GE’s talent resides in three communities which have different data usage patterns. 1) The data science community. This community is focused on a very specific item or outcome they are trying to solve, or a question they are trying to answer. The objective of the data science community is to leverage the Data Lake to look for the answer to the specific problem. 2) The software engineering community. This community will operationalise the models created by the data science community into an analytic application. 3) The traditional business intelligence community, which connects to the Data Lake in order to unlock and answer questions that are more traditional in nature. Getting all the plumbing right with Data Engineers An important component to the functioning of data and analytics within an organisation are capabilities to bridge the data management/IT group and the data science group. These capabilities are provided by Data Engineers and as articulated in the article; “Data engineering is a discipline that sits in between the two, makes data more accessible and provides the tools a data scientist would want to have. It allows the data scientist to focus more on developing the model, developing the insight, not on how to stitch the information or stitch the toolset to make it productive.” Organisations lacking the combination of a Data Lake and Data Engineering capability all too often become bogged down in data preparation efforts. The harsh reality is that Big Data is messy data and there is no quick and easy way around it. People often think that because the data is there, it is ready to be used - but that is seldom the case. Campisi provided a good example of this; “You go out and hunt for these coveted data scientists and bring them in, only to frustrate them. They spend 80% of time trying to organize the
- 3. 3 information. One of our first use cases, before using our current approach with the data lake plus data engineering we went through 10 months of organizing data and figuring out where it existed and breaking down silos, in order for someone to actually go after the outcome. It’s not effective.” To paraphrase the Ancient Mariner, without a Data Lake and Data Engineering capability organisations can easily find themselves in the situation of; Data, data, every where, Nor any drop to drink. Finding people is a challenge One of GE’s major challenges has been acquiring capable people in the data and analytics domain. This is made worse by the scale at which GE is doing things. As stated in the article; “Anybody who can spell “Hadoop” is heavily recruited. It’s hard to find people who’ve really done it at the scale we’re talking about and looking to do it, so even in the data management space, it’s hard to find talent at the levels we’re constantly searching for.” Organisations considering undertaking efforts in the data and analytics space clearly should not refrain from doing so, but are well advised to spend as much consideration on the human talent component as on the technology component. Data governance not to be underestimated Aside from the challenges of finding the right people, being awash with data brings its own set of challenges. According to the article these data governance challenges are dictating GE’s speed at which it is able to scale its data and analytics initiative. Also worth noting is that many of these challenges are being brought on by technology that is so new that there is no precedent on how they should be addressed. Addressing these data governance challenges for the first time and doing so consistently is a critical consideration for organisations looking to exploit opportunities in data and analytics – where the difference between those that succeed and those that fail could well rest on the strength or weakness of the organisations data governance foundation. Summary The article clearly demonstrates the opportunities opening to organisation pursuing data and analytics initiatives. While Big Data has been enabled by technologies like Hadoop, challenges are arising on two fronts. Firstly organisations face challenges finding people skilled in this environment. Secondly data governance challenges are increasing in number and evolving in complexity. While these challenges are not trivial, those organisations that successfully navigate these challenges will be rewarded with opportunities yet to be discovered.
- 4. 4 Appendix: Volume refers to the quantity (gigabytes, terabytes, petabytes etc.) of data that organizations are trying to harness. Importantly there is no specific measure of volume that defines Big Data, as what constitutes truly “high” volume varies by industry and even geography. What is clear is that data volumes continue to rise. Variety refers to different types (forms) of data and data sources. When referring to data types this includes; numeric, text, image, audio, web, log files etc., whether structured or unstructured. The growth of data sources such as social media, smart devices, sensors and the Internet of Things has not only resulted in increases in the volume of data but increases in the types of data as well. Velocity refers to speed at which data is created, processed and analysed. Velocity impacts latency, which is the lag time between when data is created or captured, and when it is processed into an output form for decision making purposes. Importantly, certain types of data must be analysed in real-time to be of value to the business, a task that places impossible demands on traditional systems where the ability to capture, store and analyse data in real-time is severely limited. Veracity refers to the level of reliability associated with certain types of data. According to IBM some data is inherently uncertain, for example: sentiment and truthfulness in humans; GPS sensors bouncing among the skyscrapers of Manhattan; weather conditions; economic factors; and the future. When dealing with these types of data, no amount of data cleansing can correct for it. Yet despite uncertainty, the data still contains valuable information. The need to acknowledge and embrace this uncertainty is a hallmark of Big Data. (IBM, 2012, pg. 5)
- 5. 5 Reference: IBM. (2012). Four dimensions of big data. [Diagram] Retrieved from IBM, (2012). Analytics: the real-world use of big data. [pdf]. Retrieved from http://public.dhe.ibm.com/common/ssi/ecm/en/gbe03519usen/GBE03519USEN.PDF IBM. (2012). Analytics: the real-world use of big data. [pdf]. Retrieved from http://public.dhe.ibm.com/common/ssi/ecm/en/gbe03519usen/GBE03519USEN.PDF