Unconventional phase transitions in frustrated systems (March, 2014)

Presentation file using the workshop which was held at the University of Tokyo (March 26, 2014). The presentation was based on two papers: - Physical Review B Vol. 87, 214401 (2013) http://journals.aps.org/prb/abstract/10.1103/PhysRevB.87.214401 (preprint: http://arxiv.org/abs/1209.2520) (A brief explanation: http://www.slideshare.net/shu-t/prb-87214401slideshare) - Physical Review E Vol. 88, 052138 (2013) http://journals.aps.org/pre/abstract/10.1103/PhysRevE.88.052138 (preprint: http://arxiv.org/abs/1308.2467) (A brief explanation: http://www.slideshare.net/shu-t/interlayerinteraction-dependence-of-latent-heat-in-the-heisenberg-model-on-a-stacked-triangular-lattice-with-competing-interactions) 2014年3月26日に東京大学で開催された「統計物理学の新しい潮流」での講演スライドです。この講演は、以下の2つの論文に関係するものです。 - Physical Review B Vol. 87, 214401 (2013) http://journals.aps.org/prb/abstract/10.1103/PhysRevB.87.214401 (preprint: http://arxiv.org/abs/1209.2520) (A brief explanation: http://www.slideshare.net/shu-t/prb-87214401slideshare) - Physical Review E Vol. 88, 052138 (2013) http://journals.aps.org/pre/abstract/10.1103/PhysRevE.88.052138 (preprint: http://arxiv.org/abs/1308.2467) (A brief explanation: http://www.slideshare.net/shu-t/interlayerinteraction-dependence-of-latent-heat-in-the-heisenberg-model-on-a-stacked-triangular-lattice-with-competing-interactions)

Recomendados
Recomendados
Mais conteúdo relacionado
Mais procurados
Mais procurados (19)
Semelhante a Unconventional phase transitions in frustrated systems (March, 2014)
Semelhante a Unconventional phase transitions in frustrated systems (March, 2014) (20)
Mais de Shu Tanaka
Último
Último (20)
Unconventional phase transitions in frustrated systems (March, 2014)
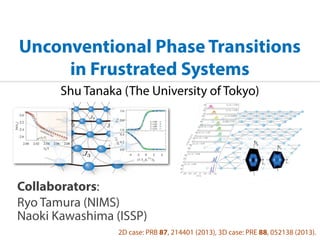
- 1. Unconventional Phase Transitions in Frustrated Systems Shu Tanaka (The University of Tokyo) Collaborators: Ryo Tamura (NIMS) Naoki Kawashima (ISSP) 2D case: PRB 87, 214401 (2013), 3D case: PRE 88, 052138 (2013).
- 2. Main results To investigate unconventional phase transition behavior in geometrically frustrated systems. 2D 3D SO(3)xZ2 SO(3)xC3 - Z2 vortex dissociation - 2nd-order PT w/ Z2 breaking (2-dim. Ising universality) at the same temperature. - 1st-order PT w/ SO(3)xC3 breaking - increases, decreases.J E
- 3. Conventional phase transitions Ferromagnets Antiferromagnets In the ground state, all spin pairs form stable spin configurations. Type Order parameter space 1D 2D 3D Ising Z2 × √ √ XY U(1) × KT √ Heisenberg S2 × × √ Temperature Ordered phase Tc Disordered phase Phase transition occurs.
- 4. Frustration: random spin systems E. Vincent, Lecture Notes in Physics 716 (2007), Slow relaxation Novel order We study the universality classes of phase transitions of our model. In the phase diagram (see Fig. 5), there are two types of phase boundaries. To make clear the universality classes of each phase transition, x is set to 3/16 = 0.1875 such that transition temperatures are separated sufficiently. For this parameter, the intermediate phase is the (πππ) ordered phase (see the dotted arrow in Fig. 5). First, we investigate the higher-temperature phase transition from the paramagnetic phase to the (πππ) ordered phase. From the Harris criterion,36 we expect that the higher- temperature phase transition belongs to the three-dimensional Heisenberg universality class. This is because the critical exponent α is negative in the three-dimensional Heisenberg model, and thus the disorder should not affect the universality class. To obtain the transition temperature and confirm the critical exponents, we calculate the correlation function Gc (rc), a b c (a) (b) Random Fan-Out State θ θ FIG. 9. (Color online) (a) “Average” spin directions in the spin configuration of the random fan-out state. In each layer (ab plane), R. Tamura, N. Kawashima, H. Kageyama et al., PRB 84, 214408 (2011) Ferromagnetic interaction Antiferromagnetic interaction Even in the GS, locally unstable spin state appears due to frustration. layered perovskite SrFe1-xMnxO2 H. Takano and S. Miyashita, JPSJ 64, 423 (1995).
- 5. Frustration: geometrically frustrated systems Ising model Heisenberg model Residual entropy (macroscopically degenerated states) Single-q state (120-degree structure, spiral spin texture) Antiferromagnets on triangle-based lattice structures Geometrical frustration
- 6. Unconventional behaviors in GFMs Chirality and Z2 vortex Reentrant phase transition ParaAntiferroParaFerro Temperature Slow relaxation T ! 0þ, we expect that nloop must be the maximum value and the spin structure becomes the so-called ffiffiffi 3 p  ffiffiffi 3 p structure. Next, we study the relaxation of magnetization and nloop. We ready the three types of initial configurations, i.e., (a) theffiffiffi 3 p  ffiffiffi 3 p structure, (b) the q ¼ 0 structure, and (c) a random structure. The configurations (a) and (b) are typical ground states of the present model, and the configuration (c) corresponds to a state just after quench the temperature from a high temperature. In Fig. 4, the relaxation processes at T ¼ 0:05J are plotted. In the cases (a) and (b), the magnetization is maximum at t ¼ 0, and it relaxes very fast to uniformly magnetized ordered state. The relaxation of magnetization to the equilibrium is depicted in the inset. In contrast, in the case (c), i.e., from a random state, it takes some time to realize the uniformly magnetized state. Thus we regard the relaxation time in the case (c) as the intrinsic relaxation time of the magnetization mag. 0 [×10 +7 ] 0 0.04 0.08 0.12 0.16 0 5000 10000 0 0.04 0.08 0.12 0.16 Monte Carlo Step (MCS) Magnetization Monte Carlo Step (MCS) Magnetization 0 [×10 +7 ] 0 0.5 1 Monte Carlo Step (MCS) NumberofWeathervaneLoops (a) (c) (b) 54321 54321 Fig. 4. (Color online) Relaxation of the magnetization and nloop at T ¼ 0:05J from (a) ffiffiffi 3 p  ffiffiffi 3 p configuration, (b) q ¼ 0 configuration, and (c) random configuration. 10 0 10 2 10 4 10 6 10 8 10 10 0 0.5 1 NumberofWeathervaneloops Monte Carlo Step (MCS) T=0.0425J T=0.04J T=0.045J T=0.0475J T=0.05J T=0.055J T=0.06J T=0.065J T=0.07J T=0.1J T=0.09J T=0.08J Fig. 5. (Color online) Relaxation of nloop from ffiffiffi 3 p  ffiffiffi 3 p structure at several temperatures. Dashed lines denote the fittling curves estimated by eq. (2). J. Phys. Soc. Jpn., Vol. 76, No. 10 LETTERS S. TANAKA and S. MIYASHITA A. Kuroda and S. Miyashita, JPSJ 64, 4509 (1995). S. Tanaka and S. Miyashita, JPSJ 76, 103001 (2007). S. Miyashita and H. Shiba, JPSJ 53, 1145 (1984). H. Kawamura and S. Miyashita, JPSJ 53, 4138 (1984). X. Hu, S. Miyashita, and M. Tachiki, PRL 79, 3498 (1997). R. Tamura, S. Tanaka, and N. Kawashima, PRB 87, 214401 (2013). H. Kitatani, S. Miyashita, and M. Suzuki, JPSJ 55, 865 (1986). S. Miyashita, S. Tanaka, and M. Hirano, JPSJ 76, 083001 (2007). Successive phase transitions MoO4)3 featuring (a) MnO5 polyhedra, (b) equilateral triangular lattices rlayer distances between Mn2+ ions are given by a = 6.099 ˚Aand c/2 = S. Miyashita and H. Kawamura, JPSJ 54, 3385 (1985). S. Miyashita, JPSJ 55, 3605 (1986). R. Ishii, S. Tanaka, S. Nakatsuji et al. EPL 94, 17001 (2011).
- 7. Phase transition in 2D GFMs H = J1 i,j si · sj J3 i,j 3 si · sj The 1st n.n. interaction The 3rd n.n. interaction J3/J10-1/4 Ferromagnetic (S2) Spiral-spin structure (SO(3)xC3) J1: Ferro J3/J10-1/9 Degenerated GSs 120-degree structure (SO(3)) Order by disorder J1: Antiferro 2D triangular lattice NiGa2S4 S. Nakatsuji, Y. Nambu, Y. Maeno et al., Science 309, 1697 (2005). 1st-order PT w/ 3-fold symmetry breaking and Z2 vortex dissociation occur. R. Tamura and N. Kawashima, JPSJ 77, 103002 (2008), JPSJ 80, 074008 (2011). Z2 vortex dissociation
- 8. Main results To investigate unconventional phase transition behavior in geometrically frustrated systems. 2D 3D SO(3)xZ2 SO(3)xC3 - Z2 vortex dissociation - 2nd-order PT w/ Z2 breaking (2-dim. Ising universality) at the same temperature. - 1st-order PT w/ SO(3)xC3 breaking - increases, decreases.J E
- 9. Model H = J1 i,j axis 1 si · sj J1 i,j axis 2,3 si · sj J3 i,j 3 si · sj The 1st n.n. interaction along axes 2 and 3 The 3rd n.n. interactionThe 1st n.n. interaction along axis 1
- 10. Model H = J1 i,j axis 1 si · sj J1 i,j axis 2,3 si · sj J3 i,j 3 si · sj The 1st n.n. interaction along axes 2 and 3 The 3rd n.n. interactionThe 1st n.n. interaction along axis 1 4 types of ground states for ferromagnetic J1 1. Ferromagnetic state (S2) 2. Single-q spiral state (SO(3)) 3. double-q spiral state (SO(3)xZ2) 4. triple-q spiral state (SO(3)xC3) No phase transition occurs at finite T (Mermin-Wagner theorem). Z2 vortex dissociation occurs at finite T. 1st-order PT and Z2 vortex dissociation occur at the same T. N. D. Mermin and H. Wagner, PRL 17, 1133 (1966). H. Kawamura and S. Miyashita, JPSJ 53, 4138 (1984). R. Tamura and N. Kawashima, JPSJ 77, 103002 (2008). R. Tamura and N. Kawashima, JPSJ 80, 074008 (2011).
- 11. Ground state phase diagram SO(3)xC3 SO(3)xZ2 (i) ferromagnetic (ii) single-k spiral (iii) double-k spiral (iv)triple-kspiral (ii) single-k spiral 4 independent sublattices structure structure H = J1 i,j axis 1 si · sj J1 i,j axis 2,3 si · sj J3 i,j 3 si · sj The 1st n.n. interaction along axes 2 and 3 The 3rd n.n. interactionThe 1st n.n. interaction along axis 1
- 12. Model H = J1 i,j axis 1 si · sj J1 i,j axis 2,3 si · sj J3 i,j 3 si · sj axis 1 axis2 axis3 The 1st n.n. interaction along axes 2 and 3 The 3rd n.n. interactionThe 1st n.n. interaction along axis 1 Order parameter space: SO(3)xZ2 J1/J3 = 0.4926 · · · , = 1.308 · · ·
- 13. Physical quantities SECOND-ORDER PHASE TRANSITION IN THE . . . 1 2 3 0.49 0.495 0.5 U4 T/J3 (c) 0 0.05 0.1 m 2 (b) 0 5 10 15 20 C (a) L=144 L=216 L=288 0 0.2 0.4 0.6 -1.5 -1.0 -0.5 0 0.5 1.0 1.5 χLη-2 (T-Tc)L1/ν /J3 (f) 1 2 3 U4 (e) -2.6 -2.4 -2.2 -2.0 2.00 2.02 2.04 2.06 2.08 ln(nv) J3/T Arrhenius law (d) 0 0.2 0.4 0.6 1 Tc/J3 ( FIG. model fo open squ first-orde solid circ specific heat order parameter Binder ratio H = J1 i,j axis 1 si · sj J1 i,j axis 2,3 si · sj J3 i,j 3 si · sj axis 1 axis2 axis3 SECOND-ORDER PHASE TRANSITION IN THE . . . 3 4 0 0.05 0.1 m 2 (b) 0 5 10 15 20 C (a) L=144 L=216 L=288 0.6 (f) 1 2 3U4 (e) -2.6 -2.4 -2.2 -2.0 2.00 2.02 2.04 2.06 2 ln(nv) J3/T Arrhenius law (d) (t) := s (t) 1 · s (t) 2 s (t) 3 , m := t (t) /N J1/J3 = 0.4926 · · · , = 1.308 · · · Order parameter detecting Z2 breaking U4 := m4 m2 2 Binder ratio Crossing point
- 14. Z2 vortex dissociation -2.6 -2.4 -2.2 -2.0 2.00 2.02 2.04 2.06 2.08 ln(nv) J3/T Arrhenius law H = J1 i,j axis 1 si · sj J1 i,j axis 2,3 si · sj J3 i,j 3 si · sj The 1st n.n. interaction along axes 2 and 3 The 3rd n.n. interactionThe 1st n.n. interaction along axis 1 J1/J3 = 0.4926 · · · , = 1.308 · · · No phase transition w/ SO(3) breaking occurs at finite T. (Mermin-Wagner theorem) Point defect: 1(SO(3)) = Z2 Z2 vortex dissociation can occur at finite T. Z2 vortex density Z2 vortex dissociation occurs at the 2nd-order PT point (Tc).
- 15. Finite size scaling 0 0.2 0.4 0.6 -1.5 -1.0 -0.5 0 0.5 1.0 1.5 L -2 (T-Tc)L 1/ /J3 1 2 3 U4 = 1, = 1/4 H = J1 i,j axis 1 si · sj J1 i,j axis 2,3 si · sj J3 i,j 3 si · sj The 1st n.n. interaction along axes 2 and 3 The 3rd n.n. interactionThe 1st n.n. interaction along axis 1 J1/J3 = 0.4926 · · · , = 1.308 · · · Binder ratio Susceptibility Finite size scaling relations U4 f (T Tc)L1/ L2 g (T Tc)L1/ 2D Ising universality class = 1, = 1/4 Z2 vortex dissociation does not affect the phase transition nature.
- 16. Phase diagram E . . . PHYSICAL REVIEW B 87, 214401 (f) (e) 2.04 2.06 2.08 J3/T rhenius law (d) 0 0.2 0.4 0.6 1 1.5 2 2.5 3 Tc/J3 λ (a) 0.48 0.5 0.52 1 1.1 1.2 1.0 2.0 3.0 U4 (b) L=108 L=144 L=180 L=216 0.0 0.2 0.4 -4 -2 0 2 χL η-2 (T-Tc)L1/ν /J3 (c) FIG. 3. (Color online) (a) Phase diagram of the distorted H = J1 i,j axis 1 si · sj J1 i,j axis 2,3 si · sj J3 i,j 3 si · sj The 1st n.n. interaction along axes 2 and 3 The 3rd n.n. interactionThe 1st n.n. interaction along axis 1 J1/J3 = 0.7342 · · · SO(3)xC3 1st-order PT w/ C3 breaking Z2 vortex dissociation occur at the same T. SO(3)xZ2 SO(3) R. Tamura and N. Kawashima, JPSJ 77, 103002 (2008). JPSJ 80, 074008 (2011). SO(3)xZ2 2nd-order PT w/ Z2 breaking Z2 vortex dissociation occur at the same T. 2D Ising universality SO(3) Z2 vortex dissociation occur at finite T. H. Kawamura and S. Miyashita, JPSJ 53, 4138 (1984).
- 17. Main results To investigate unconventional phase transition behavior in geometrically frustrated systems. 2D 3D SO(3)xZ2 SO(3)xC3 - Z2 vortex dissociation - 2nd-order PT w/ Z2 breaking (2-dim. Ising universality) at the same temperature. - 1st-order PT w/ SO(3)xC3 breaking - increases, decreases.J E
- 18. Model H = J1 i,j si · sj J3 i,j 3 si · sj J i,j si · sj The 3rd n.n. interaction intralayer The 1st n.n. interaction interlayer The 1st n.n. interaction intralayer
- 19. Ground state H = J1 i,j si · sj J3 i,j 3 si · sj J i,j si · sj /2 /2 /2 /2 /2 /2 Order parameter space: SO(3)xC3 The 3rd n.n. interaction intralayer The 1st n.n. interaction interlayer The 1st n.n. interaction intralayer
- 20. Internal energy and specific heat H = J1 i,j si · sj J3 i,j 3 si · sj J i,j si · sj J3/J1 = 0.85355 · · · , J /J1 = 2INTERLAYER-INTERACTION DEPENDENCE OF LATENT . . 20 30 40 -2.3 -2.2 -2.1 (a) (d) (b) 0 0.05 0.1 0 15 30 45 0 5 10 15 20 25 30 INTERLAYER-INTERACTION D 0.02 0 10 20 30 40 -2.3 -2.2 -2.1 (a) (b) (c) INTERLAYER-INTERACTION DEPENDENCE OF LATENT . . 0 10 20 30 40 -2.3 -2.2 -2.1 1.53 1.54 1.55 0 0.00004 0.000 (a) (d) (e) (b) (c) 0 0.05 0.1 0 15 30 45 0 5 10 15 20 25 30 -2.3 -2.2 -2.1 Internal energy Specific heat Phase transition occurs at finite T. 0 0.01 0.02 1.52 1.53 1.54 1.55 0 10 20 30 40 -2.3 1.53 1.54 1.55 0 0.00004 0.0000 0 20 40 60 0 20000 40000 60000 (a) (e) (f) (b) (c) 0 5 10 15 -2.3 -2.2 -2.1 FIG. 4. (Color online) Temperature dependence of (a) intern 0 0.01 0.02 1.52 1.53 1.54 1.55 0 10 20 30 40 -2.3 -2.2 (a) (b) (c) The 3rd n.n. interaction intralayer The 1st n.n. interaction interlayer The 1st n.n. interaction intralayer
- 21. Order parameter (C3 and SO(3)) H = J1 i,j si · sj J3 i,j 3 si · sj J i,j si · sj J3/J1 = 0.85355 · · · , J /J1 = 2 0 0.01 0.02 1.52 1.53 1.54 1.55 0 10 20 30 1.53 1.54 1.55 0 0.00004 0.0 0 20 40 60 0 20000 40000 60000 (e) (f) (b) (c) 0 5 10 -2.3 -2.2 -2 FIG. 4. (Color online) Temperature dependence of (a) inte energy per site E/J1, (b) specific heat C, and (c) order par 2 INTERLAYER-INTERACTION DEPENDENCE OF LATENT . . 0 10 20 30 40 -2.3 -2.2 -2.1 1.54 1.55 (a) (d) (e) (b) 0 0.05 0.1 0 15 30 45 0 5 10 15 20 25 30 -2.3 -2.2 -2.1 C3 symmetry breaks at Tc. Order parameter (C3) peaks E(L)/J1. (e) Plot of Tc(L)/J1 as a function of L−3 . (f) Plot of Cmax(L) as a function of L3 . Lines are just visual guides and error bars in all figures are omitted for clarity since their sizes are smaller than the symbol size. of analysis. One is the finite-size scaling and the other is a naive analysis of the probability distribution P(E; Tc(L)). The scaling relations for the first-order phase transition in d-dimensional systems [82] are given by Tc(L) = aL−d + Tc, (9) Cmax(L) ∝ ( E)2 Ld 4T 2 c , (10) where Tc and E are, respectively, the transition temperature and the latent heat in the thermodynamic limit. The coefficient of the first term in Eq. (9), a, is a constant. Figures 4(e) and 4(f) show the scaling plots for Tc(L)/J1 and Cmax(L), respectively. Figure 4(e) indicates that Tc is a nonzero value in the thermodynamic limit. Figure 4(f) shows an almost linear dependence of Cmax(L) as a function of L3 . However, using the finite-size scaling, we cannot obtain the transition temperature and latent heat in the thermodynamic limit with high accuracy because of the strong finite-size effect. Next we directly calculate the size dependence of the width between bimodal peaks of the energy distribution shown in Fig. 4(d). The width for the system size L is represented by E(L) = E+(L) − E−(L), where E+(L) and E−(L) are the averages of the Gaussian function in the high-temperature phase and that in the low-temperature phase, respectively. In the thermodynamic limit, each Gaussian function becomes the δ function and then E(L) converges to E [82]. The inset of Fig. 4(d) shows the size dependence of the width E(L)/J1. The width enlarges as value in the thermodynamic limit. Figure 5(a) shows the temperature dependence of the largest value of structure factors S(k∗ ) calculated by six wave vectors in Eq. (4). Here S(k∗ ) becomes zero in the thermodynamic limit above the first- order phase transition temperature. The structure factor S(k∗ ) becomes a nonzero value at the first-order phase transition temperature. Moreover, as temperature decreases, the structure factor S(k∗ ) increases. The structure factors at kz = 0 in the first Brillouin zone at several temperatures for L = 40 are also shown in Fig. 5(b). As mentioned in Sec. II, the spiral-spin structure represented by k is the same as that represented by −k in the Heisenberg models. Figure 5(b) confirms that one distinct wave vector is chosen from three types of ordered (a) (b) 0 0.1 0.2 0.3 0.4 0.5 0 0.5 1 1.5 2 10-5 10-4 10-3 10-2 10-1 FIG. 5. (Color online) (a) Temperature dependence of the largest value of structure factors S(k∗ ) calculated by six wave vectors in Eq. (4) for J3/J1 = −0.853 55 . . . and J⊥/J1 = 2. Error bars are Order parameter (SO(3)) SO(3) symmetry breaks at Tc. The 3rd n.n. interaction intralayer The 1st n.n. interaction interlayer The 1st n.n. interaction intralayer
- 22. Energy histogram H = J1 i,j si · sj J3 i,j 3 si · sj J i,j si · sj J3/J1 = 0.85355 · · · , J /J1 = 2 N DEPENDENCE OF LATENT . . . (d) 0 0.05 0.1 0 15 30 45 0 5 10 15 20 25 30 -2.3 -2.2 -2.1 first-order phase tr finite temperature. We further inv mentioned above, SO(3) × C3. It was the first-order phas Heisenberg model a nearest-neighbor space is SO(3), a s0.01 0.02 0 10 20 30 40 -2.3 -2.2 -2.1 1.53 1.54 1.55 0 40 60 (a) (e) (f) (b) (c) 0 0.05 0.1 0 1 0 5 10 15 20 25 30 -2.3 P(E; T) = D(E)e E/kBT D(E) : density of states E(L) : width between two peaks Bimodal distribution 1st-order PT w/ SO(3)xC3 breaking occurs. The 3rd n.n. interaction intralayer The 1st n.n. interaction interlayer The 1st n.n. interaction intralayer
- 23. Finite size scaling H = J1 i,j si · sj J3 i,j 3 si · sj J i,j si · sj J3/J1 = 0.85355 · · · , J /J1 = 2 5 1.53 1.54 1.55 0 0.00004 0.00008 0 20 40 60 0 20000 40000 60000 (d) (e) (f) 0 0.05 0 15 30 45 0 5 10 15 20 25 -2.3 -2.2 -2.1 mperature dependence of (a) internal finite temperature. We further investigate th mentioned above, the order pa SO(3) × C3. It was confirmed the first-order phase transition Heisenberg model on a stack a nearest-neighbor interactio space is SO(3), a single peak i dependence of the specific heat finite-temperature phase transi state and magnetic ordered sta is broken. Then, in our mode break at the first-order phase tr heat has a single peak corresp transition. To confirm this w dependence of the structure fac 1 0 0.01 0.02 1.52 1.53 1.54 1.55 0 10 20 30 40 1.53 1.54 1.55 0 0.00004 0.00008 0 20 40 60 0 20000 40000 60000 (e) (f) (b) (c) 0 5 10 -2.3 -2.2 -2.1 FIG. 4. (Color online) Temperature dependence of (a) internal energy per site E/J1, (b) specific heat C, and (c) order param- eter |µ|2 , which can detect the C3 symmetry breaking of the model with J3/J1 = −0.853 55 . . . and J⊥/J1 = 2 for L = 24,32,40. (d) Probability distribution of the internal energy P(E; T (L)). The Max of specific heatTc(L) Tc(L) = aL d + Tc Cmax(L) ( E)2 Ld 4T2 c M. S. S. Challa, D. P. Landau, and K. Binder, PRB 34, 1841 (1986). 1st-order PT w/ SO(3)xC3 breaking occurs. The 3rd n.n. interaction intralayer The 1st n.n. interaction interlayer The 1st n.n. interaction intralayer
- 24. Interlayer interaction dependence fixing J3/J1PHYSICAL REVIEW E 88, 052138 (2013) 0 0.1 0.2 0 0.05 0.1 0.15 0.7 0.75 0.8 0.85 0 20 40 -3 -2.5 -2 -1.5 0.6 0.7 0.8 0.9 1 1.1 1.2 1.3 1.4 1.5 1.6 1.7 1.8 (a) (b) (c) (d) (e) 0.25 0.50 0.75 1.00 1.25 1.50 1.75 2.00 2.25 2.50 0.25 0.50 0.75 1.00 1.25 1.50 1.75 2.00 2.25 2.50 0.25 0.25 0.50 0.75 1.00 1.25 1.50 1.75 2.00 2.25 2.50 0.50 0.75 1.00 1.25 1.50 1.75 2.00 2.25 2.50 0.25 0.50 0.75 1.00 1.25 1.50 1.75 2.00 2.25 2.50 FIG. 6. (Color online) Interlayer-interaction J⊥/J1 dependence of (a) internal energy per site E/J1, (b) specific heat C, (c) uniform magnetic susceptibility χ, (d) order parameter |µ|2 , which can detect the C3 symmetry breaking, and (e) largest value of structure factors S(k∗ ) calculated by six wave vectors in Eq. (4) for L = 24. Error bars in all figures are omitted for clarity since their sizes are J /J1 increases INTERLAYER-INTERACTION DEPENDENCE OF LATENT . . . 0 10 20 -2.6 -2.4 -2.2 -2 -1.8 -1.6 -1.4 0 10 20 0 10 20 0 10 0 10 0 10 0 10 0 10 0 10 0 10 0 0.04 0.08 0 1 2 0.5 1 1.5 (a) (b) (c) FIG. 7. (Color online) (a) Interlayer-interaction J⊥/J1 depen- dence of the probability distribution of internal energy P(E; Tc(L)) when the specific heat becomes the maximum value for L = 24. on fir J3 no fo In ity be de la tri or bu ob th Fo in m tra fie in an in ju th INTERLAYER-INTERACTION DEPENDENCE OF LATENT . . . 0 10 20 -2.6 -2.4 -2.2 -2 -1.8 -1.6 -1.4 0 10 20 0 10 20 0 10 0 10 0 10 0 10 0 10 0 10 0 10 0 0.04 0.08 0 1 2 0.5 1 1.5 (a) (b) (c) FIG. 7. (Color online) (a) Interlayer-interaction J⊥/J1 depen- dence of the probability distribution of internal energy P(E; Tc(L)) when the specific heat becomes the maximum value for L = 24. o fi J n fo In it b d la tr o b o th F in m tr fi in an in ju th Transition temperature Latent heat As the interlayer interaction increases, transition temperature increases but latent heat decreases.
- 25. Conclusion We investigated unconventional phase transition behavior in geometrically frustrated systems. 2D 3D SO(3)xZ2 SO(3)xC3 - Z2 vortex dissociation - 2nd-order PT w/ Z2 breaking (2-dim. Ising universality) at the same temperature. - 1st-order PT w/ SO(3)xC3 breaking - increases, decreases.J E
- 26. Thank you for your attention!! 2D case: PRB 87, 214401 (2013), 3D case: PRE 88, 052138 (2013).