Financial Analysis - Commerzbank AG attracts deposits and offers retail an…
•
1 gostou•354 visualizações


Recomendados
Recomendados
Mais conteúdo relacionado
Mais procurados
Mais procurados (11)
Semelhante a Financial Analysis - Commerzbank AG attracts deposits and offers retail an…
Semelhante a Financial Analysis - Commerzbank AG attracts deposits and offers retail an… (20)
Mais de BCV
Mais de BCV (20)
Financial Analysis - Commerzbank AG attracts deposits and offers retail an…
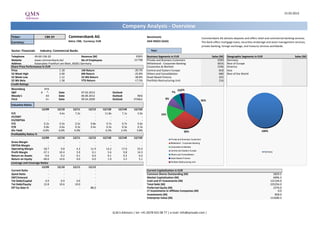
- 1. 15.03.2013 Company Analysis - Overview Ticker: CBK GY Commerzbank AG Benchmark: Commerzbank AG attracts deposits and offers retail and commercial banking services. Currency: Xetra: CBK, Currency: EUR DAX INDEX (DAX) The Bank offers mortgage loans, securities brokerage and asset management services, private banking, foreign exchange, and treasury services worldwide. Sector: Financials Industry: Commercial Banks Year: Telephone 49-69-136-20 Revenue (M) 9'855 Business Segments in EUR Sales (M) Geographic Segments in EUR Sales (M) Website www.commerzbank.de/ No of Employees 53'798 Private and Business Customers 3350 Germany 1 Address Kaiserplatz Frankfurt am Main, 60261 Germany Mittelstand - Corporate Banking 3016 Rest of Europe Share Price Performance in EUR Corporates & Markets 1596 America Price 1.18 1M Return -20.7% Central and Eastern Europe 818 Asia 52 Week High 2.00 6M Return -25.8% Others and Consolidation 680 Rest of the World 52 Week Low 1.12 52 Wk Return -38.8% Asset Based Finance 225 52 Wk Beta 1.58 YTD Return -17.5% Portfolio Restructuring Unit 216 Credit Ratings Bloomberg HY4 2%2% S&P A *- Date 07.02.2013 Outlook - 7% Moody's A3 Date 06.06.2012 Outlook NEG Fitch A+ Date 09.04.2009 Outlook STABLE 8% 35% Valuation Ratios 12/09 12/10 12/11 12/12 12/13E 12/14E 12/15E P/E - 4.6x 7.2x - 11.8x 7.1x 5.0x 16% EV/EBIT - - - - - - - EV/EBITDA - - - - - - - P/S 0.2x 0.3x 0.2x 0.8x 0.7x 0.7x 0.6x P/B 0.8x 0.6x 0.3x 0.4x 0.3x 0.3x 0.3x Div Yield 0.0% 0.0% 0.0% - 0.3% 2.4% 3.8% 30% 100% Profitability Ratios % 12/09 12/10 12/11 12/12 12/13E 12/14E 12/15E Private and Business Customers Gross Margin - - - - - - - Mittelstand - Corporate Banking EBITDA Margin - - - - - - - Corporates & Markets Operating Margin -18.7 9.8 4.3 11.9 14.2 17.0 23.3 Central and Eastern Europe Profit Margin -37.1 10.4 5.9 0.1 5.6 9.8 14.3 Germany Others and Consolidation Return on Assets -0.6 0.2 0.1 0.0 0.1 0.2 0.2 Return on Equity -48.6 14.6 4.0 0.0 1.9 3.5 5.1 Asset Based Finance Portfolio Restructuring Unit Leverage and Coverage Ratios 12/09 12/10 12/11 12/12 Current Ratio - - - - Current Capitalization in EUR Quick Ratio - - - - Common Shares Outstanding (M) 5829.5 EBIT/Interest - - - - Market Capitalization (M) 6896.3 Tot Debt/Capital 0.9 0.9 0.9 - Cash and ST Investments (M) 121104.0 Tot Debt/Equity 12.8 10.6 10.0 - Total Debt (M) 225254.0 Eff Tax Rate % - - - 88.0 Preferred Equity (M) 2376.0 LT Investments in Affiliate Companies (M) 0.0 Investments (M) 858.0 Enterprise Value (M) 114280.3 Q.M.S Advisors | tel: +41 (0)78 922 08 77 | e-mail: info@qmsadv.com |
- 2. Company Analysis - Analysts Ratings Commerzbank AG Target price in EUR Broker Recommendation Buy and Sell Recommendations vs Price and Target Price Price Brokers' Target Price 4 3 100% 3 2 29% 29% 28% 26% 29% 80% 37% 42% 44% 44% 44% 44% 50% 2 3 1 60% 2 42% 44% 40% 1 43% 43% 2 40% 49% 0 44% 41% Morgan Stanley Barclays Bankhaus Metzler Kepler Capital Markets RBC Capital Markets Main First Bank AG Equinet Institutional S&P Capital IQ CA Cheuvreux Natixis Credit Suisse JPMorgan Macquarie Oddo & Cie Exane BNP Paribas Nord/LB DZ Bank AG Grupo Santander Nomura Societe Generale M.M. Warburg Investment HSBC Mediobanca SpA EVA Dimensions AlphaValue Berenberg Bank Goldman Sachs Hamburger Sparkasse Independent Research GmbH Deutsche Bank Landesbank Baden- Keefe, Bruyette & Woods 44% 44% 44% 35% Services(ESN) 1 Wuerttemberg 20% Research 29% 29% 31% 29% 31% 1 14% 14% 11% 11% 12% 15% 15% 0% 0 mars.12 avr.12 mai.12 juin.12 juil.12 août.12 sept.12 oct.12 nov.12 déc.12 janv.13 févr.13 Buy Hold Sell Price Target Price Date Buy Hold Sell Date Price Target Price Broker Analyst Recommendation Target Date 28-Feb-13 15% 35% 50% 15-Mar-13 1.18 1.36 DZ Bank AG CHRISTOPH BAST sell 1.00 15-Mar-13 31-Jan-13 15% 41% 44% 14-Mar-13 1.20 1.37 Barclays KIRI VIJAYARAJAH underweight 1.10 15-Mar-13 31-Dec-12 12% 44% 44% 13-Mar-13 1.26 1.43 Grupo Santander TANIA GOLD underweight 1.15 14-Mar-13 30-Nov-12 11% 44% 44% 12-Mar-13 1.40 1.50 Morgan Stanley FRANCESCA TONDI Underwt/In-Line 1.10 14-Mar-13 31-Oct-12 11% 44% 44% 11-Mar-13 1.44 1.50 Goldman Sachs MARTIN LEITGEB neutral/neutral 1.55 14-Mar-13 28-Sep-12 14% 44% 42% 8-Mar-13 1.45 1.50 RBC Capital Markets ANKE REINGEN underperform 1.20 14-Mar-13 31-Aug-12 14% 49% 37% 7-Mar-13 1.42 1.50 Credit Suisse MAXENCE LE GOUVELLO outperform 2.00 14-Mar-13 31-Jul-12 31% 40% 29% 6-Mar-13 1.43 1.50 JPMorgan JAIME BECERRIL neutral 1.02 14-Mar-13 29-Jun-12 29% 44% 26% 5-Mar-13 1.41 1.50 Macquarie THOMAS STOEGNER neutral 1.20 14-Mar-13 31-May-12 31% 42% 28% 4-Mar-13 1.40 1.50 Landesbank Baden-Wuerttemberg INGO FROMMEN hold 1.30 14-Mar-13 30-Apr-12 29% 43% 29% 1-Mar-13 1.40 1.51 Independent Research GmbH STEFAN BONGARDT sell 1.10 14-Mar-13 30-Mar-12 29% 43% 29% 28-Feb-13 1.41 1.51 Oddo & Cie JEAN SASSUS reduce 1.40 14-Mar-13 27-Feb-13 1.42 1.50 Bankhaus Metzler GUIDO HOYMANN sell 1.30 14-Mar-13 26-Feb-13 1.40 1.50 Exane BNP Paribas GUILLAUME TIBERGHIEN underperform 1.30 14-Mar-13 25-Feb-13 1.45 1.50 Nord/LB MICHAEL SEUFERT hold 1.25 13-Mar-13 22-Feb-13 1.41 1.50 Keefe, Bruyette & Woods RONNY REHN underperform 1.20 13-Mar-13 21-Feb-13 1.43 1.50 Kepler Capital Markets DIRK BECKER reduce 0.70 13-Mar-13 20-Feb-13 1.47 1.50 Nomura OMAR KEENAN reduce 1.50 13-Mar-13 19-Feb-13 1.51 1.50 Equinet Institutional Services(ESN) PHILIPP HAESSLER sell 1.00 13-Mar-13 18-Feb-13 1.53 1.50 S&P Capital IQ FRANK BRADEN hold 1.55 13-Mar-13 15-Feb-13 1.49 1.48 Main First Bank AG KILIAN MAIER underperform 1.20 13-Mar-13 14-Feb-13 1.47 1.49 AlphaValue DIETER HEIN add 1.65 7-Mar-13 13-Feb-13 1.50 1.49 Societe Generale PHILIP RICHARDS sell 1.10 5-Mar-13 12-Feb-13 1.51 1.49 Hamburger Sparkasse CHRISTIAN HAMANN sell 15-Feb-13 11-Feb-13 1.51 1.49 M.M. Warburg Investment Research ANDREAS PLAESIER hold 1.45 15-Feb-13 8-Feb-13 1.49 1.49 Berenberg Bank NICK ANDERSON sell 1.00 15-Feb-13 7-Feb-13 1.46 1.49 HSBC JOHANNES THORMANN overweight 1.90 31-Jan-13 6-Feb-13 1.49 1.49 EVA Dimensions AUSTIN BURKETT underweight 17-Jan-13 5-Feb-13 1.51 1.49 Deutsche Bank ALEXANDER HENDRICKS hold 1.50 1-Nov-12 4-Feb-13 1.52 1.49 CA Cheuvreux CYRIL MEILLAND underperform 1.30 10-Aug-12 Q.M.S Advisors | tel: +41 (0)78 922 08 77 | e-mail: info@qmsadv.com |
- 3. 15.03.2013 Commerzbank AG Company Analysis - Ownership Ownership Type Ownership Statistics Geographic Ownership Distribution Geographic Ownership 0% Shares Outstanding (M) 5829.5 Germany 81.67% Float 74.9% United States 14.08% 1% 1%1% 0% 1% 1% Short Interest (M) Luxembourg 1.01% 38% Short Interest as % of Float France 0.80% 14% Days to Cover Shorts Britain 0.54% Institutional Ownership 37.91% Switzerland 0.51% Retail Ownership 62.09% Ireland 0.38% 62% Insider Ownership 0.00% Others 1.01% Institutional Ownership Distribution 81% Government 65.95% Investment Advisor 22.97% Insurance Company 7.19% Institutional Ownership Retail Ownership Insider Ownership Mutual Fund Manager 3.66% Germany United States Luxembourg France Pricing data is in EUR Others 0.23% Britain Switzerland Ireland Others Top 20 Owners: TOP 20 ALL Institutional Ownership Holder Name Position Position Change Market Value % of Ownership Report Date Source Country FEDERAL REPUBLIC OF 1'457'378'418 0 1'724'078'668 25.00% 31.01.2013 Research GERMANY 4% 0% BLACKROCK 313'123'539 90'512 370'425'147 5.37% 13.03.2013 ULT-AGG UNITED STATES 7% ALLIANZ SE 158'754'249 0 187'806'277 2.72% 07.03.2012 Research GERMANY VANGUARD GROUP INC 68'996'872 2'722'059 81'623'300 1.18% 31.12.2012 MF-AGG UNITED STATES MARSHALL WACE LLP -50'133'818 -9'910'174 -59'308'307 -0.86% 13.03.2013 Short BRITAIN FRANKFURT TRUST INVE 22'030'550 0 26'062'141 0.38% 28.12.2012 MF-AGG GERMANY UNION INVESTMENT GMB 21'236'463 2'131'853 25'122'736 0.36% 28.09.2012 MF-AGG GERMANY 23% THRIVENT FINANCIAL F 11'346'050 -67'100 13'422'377 0.19% 31.12.2012 MF-AGG UNITED STATES 66% DEUTSCHE BANK AG 8'132'683 2'552'512 9'620'964 0.14% 31.01.2013 MF-AGG GERMANY ADIG INVESTMENT 7'263'550 0 8'592'780 0.12% 30.11.2012 MF-AGG GERMANY DEKA INVESTMENT GMBH 6'635'014 -2'979'650 7'849'222 0.11% 28.12.2012 MF-AGG GERMANY ETFLAB INVESTMENT GM 6'242'873 0 7'385'319 0.11% 14.03.2013 MF-AGG GERMANY CREDIT SUISSE ASSET 5'847'747 286'355 6'917'885 0.10% 28.12.2012 MF-AGG SWITZERLAND VERITAS SG INVESTMEN 5'221'900 -864'000 6'177'508 0.09% 30.11.2012 MF-AGG GERMANY Government Investment Advisor Insurance Company Mutual Fund Manager Others COMMERZBANK AG 5'113'429 0 6'049'187 0.09% 31.12.2011 Co File GERMANY STATE STREET BANQUE 4'692'099 -91'050 5'550'753 0.08% 31.01.2013 MF-AGG FRANCE DWS INVESTMENT S A 4'627'388 826'488 5'474'200 0.08% 31.01.2013 MF-AGG LUXEMBOURG FMR LLC 4'282'228 -7'720'168 5'065'876 0.07% 31.01.2013 ULT-AGG UNITED STATES DIMENSIONAL FUND ADV 3'348'946 0 3'961'803 0.06% 31.07.2012 MF-AGG UNITED STATES UNIVERSAL INVESTMENT 3'339'250 198'105 3'950'333 0.06% 02.10.2012 MF-AGG GERMANY Top 5 Insiders: Holder Name Position Position Change Market Value % of Ownership Report Date Source Q.M.S Advisors | tel: +41 (0)78 922 08 77 | e-mail: info@qmsadv.com |
- 4. Company Analysis - Financials I/IV Commerzbank AG Financial information is in EUR (M) Equivalent Estimates Periodicity: Fiscal Year 12/02 12/03 12/04 12/05 12/06 12/07 12/08 12/09 12/10 12/11 12/12 12/13E 12/14E 12/15E Income Statement Revenue 21'148 15'635 15'115 16'666 24'340 27'339 24'181 25'393 25'027 21'462 9'855 9'945 10'305 10'679 - Cost of Goods Sold Gross Income - Selling, General & Admin Expenses 5'451 4'845 4'746 4'808 5'425 5'611 5'418 9'511 9'335 8'428 7'025 (Research & Dev Costs) Operating Income -819 346 835 1'535 2'559 2'477 -418 -2'285 1'351 465 1'170 1'410 1'748 2'485 - Interest Expense - Foreign Exchange Losses (Gains) - Net Non-Operating Losses (Gains) -447 2'326 39 -145 163 -28 -15 2'374 -2 -42 265 Pretax Income -372 -1'980 796 1'680 2'396 2'505 -403 -4'659 1'353 507 905 937 1'564 2'021 - Income Tax Expense -103 249 353 409 595 580 -465 -26 -136 -240 796 Income Before XO Items -269 -2'229 443 1'271 1'801 1'925 62 -4'633 1'489 747 109 - Extraordinary Loss Net of Tax 0 0 0 0 0 0 0 0 0 0 0 - Minority Interests 29 91 81 106 197 8 59 -96 59 109 103 Diluted EPS Before XO Items 1.96 2.34 0.00 (3.53) 0.97 0.18 0.18 Net Income Adjusted* -298 -2'320 393 1'165 1'597 1'917 22 -2'865 1'405 1'409 986 555 1'014 1'527 EPS Adjusted (0.45) (3.41) 0.53 1.55 1.95 2.34 0.02 (2.22) 0.95 0.40 0.18 0.10 0.17 0.24 Dividends Per Share 0.08 0.00 0.20 0.40 0.60 0.80 0.00 0.00 0.00 0.00 0.00 0.03 0.05 Payout Ratio % 41.4 28.2 30.7 34.3 0.0 0.0 0.0 0.03 0.17 0.19 Total Shares Outstanding 677 746 742 818 820 820 901 1'473 1'463 5'113 5'830 Diluted Shares Outstanding 666 679 740 754 819 819 845 1'288 1'471 3'460 5'612 EBITDA *Net income excludes extraordinary gains and losses and one-time charges. Q.M.S Advisors | tel: +41 (0)78 922 08 77 | e-mail: info@qmsadv.com |
- 5. Company Analysis - Financials II/IV Periodicity: 12/02 12/03 12/04 12/05 12/06 12/07 12/08 12/09 12/10 12/11 12/12 12/13E 12/14E 12/15E Balance Sheet Total Current Assets + Cash & Near Cash Items 6'612 5'711 3'634 5'465 5'129 4'962 6'566 10'329 8'053 6'075 + Short Term Investments 121'834 91'563 175'219 189'323 99'340 114'154 136'856 239'655 183'515 165'993 + Accounts & Notes Receivable + Inventories + Other Current Assets Total Long-Term Assets + Long Term Investments 80'974 85'542 2'379 3'643 121'469 115'595 108'867 111'246 101'210 85'038 Gross Fixed Assets Accumulated Depreciation + Net Fixed Assets 2'505 2'063 1'766 1'525 1'388 1'293 1'240 1'779 1'590 1'399 + Other Long Term Assets 12'385 11'786 9'879 9'807 18'670 22'958 23'883 22'211 21'560 18'882 Total Current Liabilities + Accounts Payable + Short Term Borrowings 140'750 110'383 132'391 151'388 131'769 126'081 128'656 142'123 110'629 72'740 + Other Short Term Liabilities 92'497 74'981 89'091 30'573 78'752 91'925 121'407 224'971 172'280 158'489 Total Long Term Liabilities + Long Term Borrowings 76'203 78'269 79'165 83'575 197'120 179'601 149'649 148'663 131'428 127'889 + Other Long Term Borrowings 6'914 7'648 8'143 8'335 3'662 4'001 4'369 5'596 4'461 3'513 Total Liabilities 412'064 371'281 413'854 431'211 593'020 600'342 605'292 817'527 725'641 636'960 + Long Preferred Equity 0 0 0 0 0 0 8'200 17'178 17'178 2'687 2'376 + Minority Interest 1'262 1'213 1'269 947 1'023 997 1'877 570 785 699 858 + Share Capital & APIC 7'541 6'020 6'027 7'391 7'381 7'417 7'276 4'405 4'349 16'271 17'509 + Retained Earnings & Other Equity 1'267 3'071 3'727 5'312 6'854 7'718 2'551 4'423 6'346 5'146 4'496 Total Shareholders Equity 10'070 10'304 11'023 13'650 15'258 16'132 19'904 26'576 28'658 24'803 25'239 Total Liabilities & Equity 422'134 381'585 424'877 444'861 608'278 616'474 625'196 844'103 754'299 661'763 Book Value Per Share 13.02 12.19 13.15 15.53 17.36 18.46 10.90 5.99 7.31 4.19 3.77 4.15 4.44 4.58 Tangible Book Value Per Share 11.32 11.11 12.07 14.34 15.31 16.91 9.42 3.81 5.19 3.59 Q.M.S Advisors | tel: +41 (0)78 922 08 77 | e-mail: info@qmsadv.com |
- 6. Company Analysis - Financials III/IV Periodicity: 12/02 12/03 12/04 12/05 12/06 12/07 12/08 12/09 12/10 12/11 12/12 12/13E 12/14E 12/15E Cash Flows Net Income -298 -2'320 362 1'165 1'604 1'917 3 -4'537 1'430 638 260 922 1'353 + Depreciation & Amortization 1'114 929 1'551 1'288 4'093 -156 520 743 4'101 4'006 + Other Non-Cash Adjustments 615 1'293 1'843 -3'161 1'403 -2'289 -424 6'542 2'685 -11'771 + Changes in Non-Cash Capital 21'741 17'010 -30'763 -1'050 4'212 -1'372 15'863 -32'794 -45'202 -32'544 Cash From Operating Activities 23'172 16'912 -27'007 -1'758 11'312 -1'900 15'962 -30'046 -36'986 -39'671 + Disposal of Fixed Assets 1'955 424 285 66 334 467 293 663 187 74 + Capital Expenditures -738 -317 -505 -429 -1'212 -275 -624 -4'426 -492 -296 + Increase in Investments -47'039 -52'351 -45'806 -57'560 -104'227 -385 -4 -5'240 -504 -335 + Decrease in Investments 65'905 48'593 39'720 44'045 55'894 2'874 2'999 858 15'274 17'783 + Other Investing Activities -238 68 -3 333 3'579 -71 2'453 298 83 Cash From Investing Activities 91'710 6'493 -3'496 -16'942 -186'429 7'743 1'854 -77'027 39'374 49'682 + Dividends Paid -217 -54 0 -150 -328 -493 -657 + Change in Short Term Borrowings 5'898 -19'735 20'181 14'470 -4'075 -705 3'372 + Increase in Long Term Borrowings 0 0 3'258 9'670 138'504 8'734 + Decrease in Long Term Borrowings -97'938 -8'740 -529 -733 -23'422 -39'822 + Increase in Capital Stocks 0 831 1 1'364 1'079 2'528 + Decrease in Capital Stocks -82 0 -10 0 -56 -2'774 + Other Financing Activities -1'181 -908 -13 37 -3 -6 -129 13'893 -2'817 -1'732 Cash From Financing Activities -114'218 -24'306 27'962 22'440 172'456 -6'653 -16'407 110'836 -4'664 -11'989 Net Changes in Cash 664 -901 -2'541 3'740 -2'661 -810 1'409 3'763 -2'276 -1'978 Free Cash Flow (CFO-CAPEX) 22'434 16'595 -27'512 -2'187 10'100 -2'175 15'338 -34'472 -37'478 -39'967 Free Cash Flow To Firm Free Cash Flow To Equity -67'651 -11'456 -4'317 21'286 144'863 -25'835 -3'885 Free Cash Flow per Share 33.69 24.44 -37.16 -2.90 12.33 -2.65 18.16 -26.77 -25.48 -11.55 Q.M.S Advisors | tel: +41 (0)78 922 08 77 | e-mail: info@qmsadv.com |
- 7. Company Analysis - Financials IV/IV Periodicity: 12/02 12/03 12/04 12/05 12/06 12/07 12/08 12/09 12/10 12/11 12/12 12/13E 12/14E 12/15E Ratio Analysis Valuation Ratios Price Earnings 24.9x 13.5x 11.8x 9.0x 1'870.4x 4.6x 7.2x 11.8x 7.1x 5.0x EV to EBIT EV to EBITDA Price to Sales 0.2x 0.5x 0.6x 0.9x 0.8x 0.6x 0.2x 0.2x 0.3x 0.2x 0.8x 0.7x 0.7x 0.6x Price to Book 0.5x 1.0x 0.9x 1.3x 1.3x 1.1x 0.5x 0.8x 0.6x 0.3x 0.4x 0.3x 0.3x 0.3x Dividend Yield 1.3% 0.0% 1.6% 1.9% 2.6% 3.8% 0.0% 0.0% 0.0% 0.0% 0.3% 2.4% 3.8% Profitability Ratios Gross Margin EBITDA Margin - - - Operating Margin -13.1% 5.2% 12.4% 21.0% 27.2% 26.8% -5.5% -18.7% 9.8% 4.3% 11.9% 14.2% 17.0% 23.3% Profit Margin -4.8% -34.9% 5.4% 15.9% 17.0% 20.7% 0.0% -37.1% 10.4% 5.9% 0.1% 5.6% 9.8% 14.3% Return on Assets -0.1% -0.6% 0.1% 0.3% 0.3% 0.3% 0.0% -0.6% 0.2% 0.1% 0.0% 0.1% 0.2% 0.2% Return on Equity -2.9% -25.9% 3.8% 10.4% 11.9% 13.1% 0.0% -48.6% 14.6% 4.0% 0.0% 1.9% 3.5% 5.1% Leverage & Coverage Ratios Current Ratio Quick Ratio Interest Coverage Ratio (EBIT/I) Tot Debt/Capital 0.96 0.95 0.95 0.95 0.96 0.96 0.94 0.93 0.91 0.91 Tot Debt/Equity 21.54 18.31 19.19 21.21 24.92 21.85 15.99 12.79 10.61 9.99 Others Asset Turnover 0.05 0.04 0.04 0.04 0.05 0.04 0.04 0.03 0.03 0.03 0.02 Accounts Receivable Turnover Accounts Payable Turnover Inventory Turnover Effective Tax Rate 44.3% 24.3% 24.8% 23.2% 88.0% Q.M.S Advisors | tel: +41 (0)78 922 08 77 | e-mail: info@qmsadv.com |
- 8. Company Analysis - Peers Comparision DEUTSCHE BANK- DEUTSCHE IKB DEUT COMMERZBANK UBS AG-REG CREDIT SUISS-REG CREDIT AGRICOLE SOC GENERALE BNP PARIBAS AAREAL BANK AG UNICREDIT SPA COMDIRECT BANK NATIXIS DEUTSCHE BOERSE INTESA SANPAOLO RG POSTBAN INDBANK Latest Fiscal Year: 12/2012 12/2012 12/2011 12/2012 12/2012 12/2012 03/2012 12/2012 12/2012 12/2012 12/2011 12/2012 12/2012 12/2012 12/2012 52-Week High 2.00 39.58 35.30 16.39 27.85 8.00 0.72 34.40 47.92 18.49 4.88 8.90 3.69 52.30 1.59 52-Week High Date 19.03.2012 19.03.2012 18.02.2013 25.01.2013 07.02.2013 20.02.2013 07.11.2012 14.01.2013 29.01.2013 20.02.2013 30.01.2013 27.03.2012 18.02.2013 25.02.2013 16.03.2012 52-Week Low 1.12 22.11 26.83 9.69 15.97 2.84 0.18 15.10 24.54 11.42 2.25 6.73 1.76 36.05 0.85 52-Week Low Date 23.07.2012 26.07.2012 23.07.2012 24.07.2012 03.08.2012 01.06.2012 18.07.2012 18.05.2012 30.05.2012 04.06.2012 23.07.2012 07.06.2012 24.07.2012 04.06.2012 23.07.2012 Daily Volume 28'766'124 895'052 2'980 11'343'526 4'013'246 1'278'999 0 573'381 532'412 28'687 25'115'807 8'041 850'478 113'905 41'004'664 Current Price (3/dd/yy) 1.18 34.39 32.27 15.45 26.88 7.27 0.43 30.51 44.29 18.14 3.88 8.36 3.29 51.13 1.25 52-Week High % Change -40.7% -13.1% -8.6% -5.7% -3.5% -9.0% -39.6% -11.3% -7.6% -1.9% -20.5% -6.1% -10.9% -2.2% -21.2% 52-Week Low % Change 5.9% 55.5% 20.3% 59.5% 68.3% 156.0% 141.1% 102.0% 80.5% 58.8% 72.1% 24.3% 86.9% 41.8% 46.3% Total Common Shares (M) 5'829.5 929.0 218.8 3'747.4 1'292.7 2'490.7 633.4 754.0 1'240.1 59.9 2'930.0 141.2 3'079.4 183.4 16'434.0 Market Capitalization 6'896.3 31'960.8 7'059.6 59'273.4 35'503.9 18'165.6 274.9 23'802.3 55'013.6 1'085.8 22'473.8 1'180.5 10'153.6 9'868.1 20'349.8 Total Debt 247'823.0 284'516.0 38'189.0 267'401.0 330'510.0 936'095.0 16'516.7 740'837.0 1'012'615.0 27'489.0 334'658.3 1.9 251'200.0 1'775.4 114'813.0 Preferred Stock 2'376.0 - - - - 2'104.0 - 5'270.0 7'241.0 300.0 - - - - - Minority Interest 858.0 1'270.0 4.0 4'353.0 6'786.0 5'505.0 - 4'288.0 8'536.0 243.0 3'318.2 - 500.0 212.6 586.0 Cash and Equivalents 42'259.0 177'928.0 23'974.0 66'383.0 63'708.0 428'281.0 19.1 110'225.0 139'568.0 588.0 56'215.5 551.8 34'700.0 1'223.5 39'926.0 Enterprise Value - - - 264'644.4 - - 15'222.1 - - 26'114.8 - 630.6 - 10'937.0 - Valuation Total Revenue LFY 9'855.0 33'582.0 8'015.0 37'754.0 38'313.0 39'785.0 1'633.8 43'733.0 97'525.0 1'347.0 41'968.2 566.1 6'264.0 2'209.0 17'813.0 LTM 17'595.0 47'151.0 10'204.0 37'758.0 38'313.0 - 1'891.3 - 97'525.0 1'263.0 26'215.4 566.1 6'264.0 2'143.5 17'685.0 CY+1 9'945.4 33'832.3 4'002.0 26'694.4 26'555.5 17'385.2 - 23'928.8 40'090.3 673.0 25'442.2 326.4 6'836.9 2'150.9 16'777.4 CY+2 10'305.4 34'823.9 4'036.0 27'388.4 27'486.4 17'979.9 221.0 24'751.5 41'256.8 710.0 24'912.8 346.5 7'211.5 2'263.7 17'212.7 EV/Total Revenue LFY - - - 6.9x - - 9.3x - - 19.3x - 1.0x - 4.1x - LTM - - - 6.9x - - 8.0x - - 20.6x - 1.0x - 4.1x - CY+1 - 2.0x - - 35.0x -1.0x - - - - - - - 5.0x - CY+2 - 2.0x - - 33.8x -0.9x - - - - - - - 4.7x - EBITDA LFY - - - 15'529.0 - - 1'108.8 - - 787.0 - 233.6 - 1'229.4 - LTM - - - 15'530.0 - - - - - - - - - 1'108.5 - CY+1 - - - - - - - - - - - - - 1'151.6 - CY+2 - - - - - - - - - - - - - 1'258.5 - EV/EBITDA LFY - - - 16.7x - - 13.7x - - 33.0x - 2.4x - 7.4x - LTM - - - 16.7x - - - - - - - - - 8.2x - CY+1 - - - - - - - - - - - - - 9.4x - CY+2 - - - - - - - - - - - - - 8.4x - EPS LFY 0.34 3.18 0.51 0.52 0.77 -0.14 -0.82 4.02 5.47 1.75 -0.03 0.52 0.27 4.54 0.10 LTM 0.19 0.68 1.98 -0.67 0.84 -2.31 -0.45 0.95 5.33 1.75 -2.50 0.52 0.27 3.44 0.13 CY+1 0.10 3.96 1.66 0.91 2.66 0.99 - 3.60 5.10 1.71 0.14 0.45 0.32 3.86 0.12 CY+2 0.17 5.10 1.69 1.20 3.14 1.23 (0.17) 4.32 5.77 2.21 0.27 0.52 0.37 4.30 0.16 P/E LFY 6.2x 50.6x 16.3x - 32.0x - - 32.0x 8.3x 10.3x - 16.1x 12.2x 14.9x 9.6x LTM 3.4x 9.0x 16.3x 30.2x 12.1x 17.7x - 11.1x 7.9x 10.3x - 16.1x 12.0x 15.2x 13.7x CY+1 11.8x 8.7x 19.5x 17.0x 10.1x 7.3x - 8.5x 8.7x 10.6x 27.1x 18.4x 10.3x 13.2x 10.8x CY+2 7.1x 6.7x 19.1x 12.9x 8.6x 5.9x - 7.1x 7.7x 8.2x 14.4x 16.0x 8.8x 11.9x 8.1x Revenue Growth 1 Year (54.1%) (36.2%) (5.6%) (7.6%) (10.3%) (14.1%) (34.3%) (9.9%) 37.3% - 1.8% (0.6%) (51.9%) (4.3%) (29.5%) 5 Year (13.8%) (5.8%) (9.6%) (10.1%) 30.2% - - - 11.4% (13.3%) 1.7% 8.2% (10.2%) (6.8%) (11.8%) EBITDA Growth 1 Year - - - (11.1%) - - (39.1%) - - - - (11.0%) - - - 5 Year - - - (31.3%) - - (20.8%) - - (12.2%) - (1.8%) - 1.8% - EBITDA Margin LTM - - - 41.1% - - - - - - - - - 50.1% - CY+1 - - - - - - - - - - - - - 53.5% - CY+2 - - - - - - - - - - - - - 55.6% - Leverage/Coverage Ratios Total Debt / Equity % 0.0% 0.0% 669.4% 582.6% 927.6% 2488.1% 3888.1% 1663.3% 1287.6% 1690.6% 650.1% 0.3% 1288.2% 60.1% 231.4% Total Debt / Capital % 90.9% 83.9% 87.0% 84.2% 88.6% 95.4% 97.5% 93.2% 91.5% 92.7% 85.9% 0.3% 92.6% 35.9% 84.8% Total Debt / EBITDA - - - 17.218x - - - - - - - - - 1.317x - Net Debt / EBITDA - - - 10.520x - - - - - - - - - 0.775x - EBITDA / Int. Expense - - - - - - - - - - - - - 14.082x - Credit Ratings S&P LT Credit Rating A *- A+ NR A A A - A A+ - BBB+ - A AA BBB+ S&P LT Credit Rating Date 07.02.2013 25.01.2012 04.01.2013 29.11.2011 19.12.2008 23.01.2012 - 23.01.2012 25.10.2012 - 10.02.2012 - 23.01.2012 13.02.2012 10.02.2012 Moody's LT Credit Rating A3 A2 A2 A2 (P)A2 A2 NR A2 A2 - Baa2 - A2 WR Baa2 Moody's LT Credit Rating Date 06.06.2012 21.06.2012 22.06.2012 21.06.2012 21.06.2012 21.06.2012 12.09.2012 21.06.2012 21.06.2012 - 16.07.2012 - 15.06.2012 17.05.2006 16.07.2012 Q.M.S Advisors | tel: +41 (0)78 922 08 77 | e-mail: info@qmsadv.com |