Financial Analysis - China State Construction Engineering Corporation Limited is a state-owned enterprise. The Company engages in housing construction, international building contracting
•
1 gostou•893 visualizações

Financial Analysis - China State Construction Engineering Corporation Limited is a state-owned enterprise. The Company engages in housing construction, international building contracting

Recomendados
Recomendados
Mais conteúdo relacionado
Mais procurados
Mais procurados (19)
Semelhante a Financial Analysis - China State Construction Engineering Corporation Limited is a state-owned enterprise. The Company engages in housing construction, international building contracting
Semelhante a Financial Analysis - China State Construction Engineering Corporation Limited is a state-owned enterprise. The Company engages in housing construction, international building contracting (20)
Mais de BCV
Mais de BCV (20)
Financial Analysis - China State Construction Engineering Corporation Limited is a state-owned enterprise. The Company engages in housing construction, international building contracting
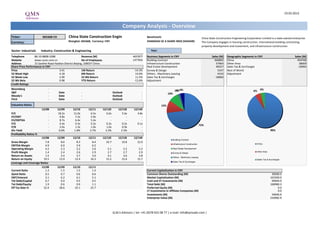
- 1. 19.03.2013 Company Analysis - Overview Ticker: 601668 CH China State Construction Engin Benchmark: China State Construction Engineering Corporation Limited is a state-owned enterprise. Currency: Shanghai: 601668, Currency: CNY SHANGHAI SE A SHARE INDX (SHASHR) The Company engages in housing construction, international building contracting, property development and investment, and infrastructure construction. Sector: Industrials Industry: Construction & Engineering Year: Telephone 86-10-8808-3288 Revenue (M) 463'877 Business Segments in CNY Sales (M) Geographic Segments in CNY Sales (M) Website www.cscec.com.cn No of Employees 147'856 Building Contract 366892 China 454768 Address 15 Sanlihe Road Haidian District Beijing, 100037 China Infrastructure Construction 57964 Other Area 28069 Share Price Performance in CNY Real Estate Development 48327 Sales Tax & Surcharges -18960 Price 3.41 1M Return -14.3% Survey & Design 5337 Rest of World 52 Week High 4.18 6M Return 14.0% Others - Machinery Leasing 4316 Adjustment 52 Week Low 2.90 52 Wk Return 11.5% Sales Tax & Surcharges -18960 52 Wk Beta 0.98 YTD Return -12.6% Adjustment Credit Ratings Bloomberg - 1% 4% 1% 6% 4% S&P - Date - Outlook - 10% Moody's - Date - Outlook - Fitch - Date - Outlook - Valuation Ratios 12% 12/08 12/09 12/10 12/11 12/12E 12/13E 12/14E P/E - 18.2x 11.0x 6.5x 6.6x 5.6x 4.8x EV/EBIT - 9.8x 7.2x 5.9x - - - EV/EBITDA - 8.7x 6.4x 5.4x - - - P/S - 0.4x 0.3x 0.2x 0.2x 0.2x 0.1x 72% P/B - 2.0x 1.3x 1.0x 1.0x 0.9x - Div Yield - 0.6% 1.8% 2.7% 2.3% 2.3% - 90% Profitability Ratios % 12/08 12/09 12/10 12/11 12/12E 12/13E 12/14E Building Contract Gross Margin 7.8 8.6 8.3 8.4 10.7 10.8 12.0 Infrastructure Construction China EBITDA Margin 4.9 6.0 5.9 6.2 - - - Operating Margin 4.2 5.3 5.2 5.6 5.1 5.2 5.2 Real Estate Development Profit Margin 1.4 2.4 2.6 2.9 2.7 2.7 2.9 Other Area Survey & Design Return on Assets 1.5 2.4 2.7 3.0 4.1 3.6 3.8 Others - Machinery Leasing Return on Equity 19.5 13.9 12.4 16.3 15.2 15.6 15.7 Sales Tax & Surcharges Sales Tax & Surcharges Leverage and Coverage Ratios 12/08 12/09 12/10 12/11 Current Ratio 1.3 1.5 1.5 1.4 Current Capitalization in CNY Quick Ratio 0.5 0.7 0.6 0.6 Common Shares Outstanding (M) 30000.0 EBIT/Interest 3.1 6.2 6.1 5.1 Market Capitalization (M) 102300.0 Tot Debt/Capital 0.7 0.4 0.5 0.5 Cash and ST Investments (M) 94944.0 Tot Debt/Equity 1.9 0.6 0.9 1.1 Total Debt (M) 168980.3 Eff Tax Rate % 32.4 28.6 25.1 25.7 Preferred Equity (M) 0.0 LT Investments in Affiliate Companies (M) 0.0 Investments (M) 34646.6 Enterprise Value (M) 210982.9 Q.M.S Advisors | tel: +41 (0)78 922 08 77 | e-mail: info@qmsadv.com |
- 2. Company Analysis - Analysts Ratings China State Construction Engin Target price in CNY Broker Recommendation Buy and Sell Recommendations vs Price and Target Price Price Brokers' Target Price 7 6 100% 0% 0% 0% 0% 0% 0% 0% 0% 0% 0% 0% 0% 5 6 80% 4 5 3 60% 4 2 100% 100% 100% 100% 100% 100% 100% 100% 100% 100% 100% 100% 1 3 40% 0 China Minzu Securities Co Ltd China Galaxy Securities Citic Securities Co., Ltd China International Capital Hong Yuan Securities China Securities Co., Ltd China Investment Securities GuoYuan Securities Capital Securities Corp Northeast Securities Co Ltd China Merchants Securities Industrial Securities AJ Securities Founder Securities Guotai Junan HuaChuang Securities SWS Research Co Ltd 2 20% 1 Corp 0% 0 mars.12 avr.12 mai.12 juin.12 juil.12 août.12 sept.12 oct.12 nov.12 déc.12 janv.13 févr.13 Buy Hold Sell Price Target Price Date Buy Hold Sell Date Price Target Price Broker Analyst Recommendation Target Date 28-Feb-13 100% 0% 0% 19-Mar-13 3.41 4.00 SWS Research Co Ltd ELLIE LU outperform 15-Mar-13 31-Jan-13 100% 0% 0% 18-Mar-13 3.35 4.00 China International Capital Corp YUE DING buy 12-Mar-13 31-Dec-12 100% 0% 0% 15-Mar-13 3.50 4.00 Guotai Junan ZHANG KUN buy 8-Mar-13 30-Nov-12 100% 0% 0% 14-Mar-13 3.47 4.00 Citic Securities Co., Ltd YANG TAO buy 29-Jan-13 31-Oct-12 100% 0% 0% 13-Mar-13 3.48 4.00 Capital Securities Corp ZHU JIXIANG buy 4.00 31-Oct-12 28-Sep-12 100% 0% 0% 12-Mar-13 3.53 4.00 Hong Yuan Securities ZHOU RONGZI buy 30-Oct-12 31-Aug-12 100% 0% 0% 11-Mar-13 3.55 4.00 China Securities Co., Ltd TIAN DONGHONG buy 4.50 25-Jun-12 31-Jul-12 100% 0% 0% 8-Mar-13 3.53 4.00 Northeast Securities Co Ltd XIE WENJIE buy 20-Jun-12 29-Jun-12 100% 0% 0% 7-Mar-13 3.53 4.00 China Merchants Securities MENG QUN strong buy 11-Jun-12 31-May-12 100% 0% 0% 6-Mar-13 3.56 4.00 AJ Securities ZUO HONGYING buy 5.00 14-Oct-11 30-Apr-12 100% 0% 0% 5-Mar-13 3.53 4.00 Industrial Securities WANG SHUANG strong buy 5-Sep-11 30-Mar-12 100% 0% 0% 4-Mar-13 3.46 4.00 HuaChuang Securities ZHANG CHI strong buy 31-Aug-11 1-Mar-13 3.83 4.00 China Investment Securities LI FAN strong buy 3-Aug-11 28-Feb-13 3.89 4.00 GuoYuan Securities BAO SHE buy 29-Oct-10 27-Feb-13 3.76 4.00 China Minzu Securities Co Ltd XU YONGCHAO add 4.50 31-Aug-10 26-Feb-13 3.71 4.00 China Galaxy Securities HAO FEIFEI speculative buy 21-Jun-10 25-Feb-13 3.83 4.00 Founder Securities WEI ZHOU add 14-Oct-09 22-Feb-13 3.82 4.00 21-Feb-13 3.86 4.00 20-Feb-13 3.99 4.00 19-Feb-13 3.98 4.00 18-Feb-13 4.14 4.00 15-Feb-13 4.06 4.00 14-Feb-13 4.06 4.00 13-Feb-13 4.06 4.00 12-Feb-13 4.06 4.00 11-Feb-13 4.06 4.00 8-Feb-13 4.06 4.00 7-Feb-13 4.00 4.00 6-Feb-13 3.96 4.00 Q.M.S Advisors | tel: +41 (0)78 922 08 77 | e-mail: info@qmsadv.com |
- 3. 19.03.2013 China State Construction Engin Company Analysis - Ownership Ownership Type Ownership Statistics Geographic Ownership Distribution Geographic Ownership 0% Shares Outstanding (M) 30000.0 China 98.91% 0% 0% 0% 0% 0% Float 37.7% 27% Hong Kong 0.88% 1% 0% Short Interest (M) Luxembourg 0.16% Short Interest as % of Float Japan 0.05% Days to Cover Shorts South Korea 0.01% Institutional Ownership 73.08% Britain 0.00% Retail Ownership 26.92% Belgium 0.00% Insider Ownership 0.00% Others 0.00% 73% Institutional Ownership Distribution Government 87.75% 99% Investment Advisor 10.75% Insurance Company 1.32% Institutional Ownership Retail Ownership Insider Ownership Mutual Fund Manager 0.18% China Hong Kong Luxembourg Japan Pricing data is in CNY Others 0.00% South Korea Britain Belgium Others Top 20 Owners: TOP 20 ALL Institutional Ownership Holder Name Position Position Change Market Value % of Ownership Report Date Source Country CHINA STATE CONSTRUC 16'471'970'518 3'000'000 56'169'419'466 54.91% 28.09.2012 EXCH CHINA 0% 1% 0% SOCIAL SECURITY FUND 1'200'000'000 0 4'092'000'000 4.00% 31.12.2011 Co File CHINA CHINA LIFE INSURANCE 557'980'401 0 1'902'713'167 1.86% 31.12.2011 Co File CHINA 11% BOSHI FUND MANAGEMEN 343'116'392 105'421'047 1'170'026'897 1.14% 30.06.2012 MF-AGG CHINA SINOCHEM CORP 336'000'000 0 1'145'760'000 1.12% 31.12.2011 Co File CHINA BAOSTEEL GROUP CORP 336'000'000 0 1'145'760'000 1.12% 31.12.2011 Co File CHINA CHINA NATIONAL PETRO 336'000'000 0 1'145'760'000 1.12% 31.12.2011 Co File CHINA CHINA PACIFIC INSURA 289'353'252 0 986'694'589 0.96% 31.12.2011 Co File CHINA PENGHUA FUND MANAGEM 257'045'523 -19'309'772 876'525'233 0.86% 30.06.2012 MF-AGG CHINA CHINA ASSET MANAGEME 230'690'643 10'926'369 786'655'093 0.77% 30.06.2012 MF-AGG CHINA 88% HARVEST FUND MANAGEM 188'339'726 -82'075'229 642'238'466 0.63% 30.06.2012 MF-AGG CHINA E FUND MANAGEMENT 179'279'412 -9'400 611'342'795 0.60% 30.06.2012 MF-AGG CHINA YINHUA FUND MANAGEME 133'923'925 83'478'397 456'680'584 0.45% 30.06.2012 MF-AGG CHINA CHINA SOUTHERN FUND 119'275'977 -6'851'701 406'731'082 0.40% 30.06.2012 MF-AGG CHINA Government Investment Advisor Insurance Company Mutual Fund Manager Others CSOP ASSET MANAGEMEN 89'956'686 0 306'752'299 0.30% 19.03.2013 MF-AGG HONG KONG ORIENT FUND MANAGEME 80'009'989 54'009'989 272'834'062 0.27% 30.06.2012 MF-AGG CHINA HUAAN FUND MANAGEMEN 78'496'035 -4'449'779 267'671'479 0.26% 30.06.2012 MF-AGG CHINA CHINA MERCHANTS FUND 67'597'316 67'597'316 230'506'848 0.23% 30.06.2012 MF-AGG CHINA ICBC CREDIT SUISSE A 48'026'882 26'777'444 163'771'668 0.16% 30.06.2012 MF-AGG CHINA FULLGOAL FUND MANAGE 47'999'110 17'690'794 163'676'965 0.16% 30.06.2012 MF-AGG CHINA Top 5 Insiders: Holder Name Position Position Change Market Value % of Ownership Report Date Source Q.M.S Advisors | tel: +41 (0)78 922 08 77 | e-mail: info@qmsadv.com |
- 4. Company Analysis - Financials I/IV China State Construction Engin Financial information is in CNY (M) Equivalent Estimates Periodicity: Fiscal Year 12/01 12/02 12/03 12/04 12/05 12/06 12/07 12/08 12/09 12/10 12/11 12/12E 12/13E 12/14E Income Statement Revenue 128'850 161'942 194'407 250'346 355'531 463'877 576'125 671'681 773'051 - Cost of Goods Sold 119'419 147'199 179'208 228'768 325'883 424'704 Gross Income 9'431 14'743 15'199 21'578 29'648 39'173 61'686 72'340 92'766 - Selling, General & Admin Expenses 5'060 4'720 7'010 8'219 11'130 12'964 (Research & Dev Costs) 0 98 168 Operating Income 4'371 10'024 8'189 13'359 18'518 26'209 29'159 34'756 40'298 - Interest Expense 1'155 1'435 1'702 1'514 2'096 3'800 - Foreign Exchange Losses (Gains) 48 19 -82 -23 -17 -27 - Net Non-Operating Losses (Gains) -1'628 -1'086 -293 -1'449 -3'204 -3'456 Pretax Income 4'796 9'656 6'863 13'317 19'644 25'892 29'811 35'404 40'970 - Income Tax Expense 1'207 2'590 2'223 3'810 4'924 6'654 Income Before XO Items 3'589 7'065 4'640 9'506 14'720 19'239 - Extraordinary Loss Net of Tax 0 0 0 0 0 0 - Minority Interests 1'178 2'148 1'894 3'414 5'480 5'702 Diluted EPS Before XO Items 0.15 0.26 0.31 0.45 Net Income Adjusted* 5'730 9'237 13'537 15'474 18'241 22'117 EPS Adjusted 0.25 0.31 0.45 0.52 0.61 0.71 Dividends Per Share 0.00 0.00 0.02 0.03 0.06 0.08 0.08 0.08 Payout Ratio % 0.0 0.0 14.4 14.3 20.1 17.7 0.15 0.13 Total Shares Outstanding 18'000 18'000 30'000 30'000 30'000 Diluted Shares Outstanding 16'920 16'982 18'000 23'000 30'000 30'000 EBITDA 5'308 11'365 9'524 15'041 20'823 28'914 *Net income excludes extraordinary gains and losses and one-time charges. Q.M.S Advisors | tel: +41 (0)78 922 08 77 | e-mail: info@qmsadv.com |
- 5. Company Analysis - Financials II/IV Periodicity: 12/01 12/02 12/03 12/04 12/05 12/06 12/07 12/08 12/09 12/10 12/11 12/12E 12/13E 12/14E Balance Sheet Total Current Assets 101059.154 142016.344 174926.276 254071.829 325391.345 409400.591 + Cash & Near Cash Items 15'682 25'988 34'156 79'206 82'121 88'157 + Short Term Investments 1'016 1'037 2'257 3'534 4'296 6'224 + Accounts & Notes Receivable 27'388 31'049 32'998 39'543 48'750 68'149 + Inventories 26'891 43'194 57'104 58'653 115'701 150'342 + Other Current Assets 30'082 40'748 48'411 73'137 74'522 96'529 Total Long-Term Assets 15'378 23'923 29'249 42'067 72'435 96'429 + Long Term Investments 1'575 2'417 3'560 6'365 25'236 30'664 Gross Fixed Assets 11'701 15'166 18'827 20'216 23'840 27'024 Accumulated Depreciation 3'977 3'784 4'603 5'807 7'131 8'631 + Net Fixed Assets 7'725 11'382 14'224 14'409 16'709 18'393 + Other Long Term Assets 6'078 10'123 11'464 21'292 30'490 47'372 Total Current Liabilities 86'250 113'260 133'698 164'932 221'449 295'311 + Accounts Payable 37'416 47'572 54'218 72'258 100'517 136'313 + Short Term Borrowings 10'861 18'328 23'590 20'504 28'942 51'248 + Other Short Term Liabilities 37'974 47'361 55'889 72'171 91'990 107'751 Total Long Term Liabilities 17'319 26'659 39'758 40'018 73'096 92'082 + Long Term Borrowings 11'336 20'919 34'106 33'168 61'747 81'774 + Other Long Term Borrowings 5'982 5'740 5'651 6'850 11'350 10'308 Total Liabilities 103'569 139'919 173'456 204'950 294'545 387'393 + Long Preferred Equity 0 0 0 0 0 0 + Minority Interest 7'975 13'219 15'332 18'880 26'059 29'332 + Share Capital & APIC 18'000 12'211 62'867 59'712 59'700 + Retained Earnings & Other Equity 4'893 -5'198 3'177 9'441 17'510 29'404 Total Shareholders Equity 12'869 26'020 30'719 91'188 103'281 118'436 Total Liabilities & Equity 116'437 165'939 204'175 296'139 397'826 505'829 Book Value Per Share 0.71 0.85 2.41 2.57 2.97 3.37 3.85 Tangible Book Value Per Share 0.70 0.84 2.36 2.45 2.84 Q.M.S Advisors | tel: +41 (0)78 922 08 77 | e-mail: info@qmsadv.com |
- 6. Company Analysis - Financials III/IV Periodicity: 12/01 12/02 12/03 12/04 12/05 12/06 12/07 12/08 12/09 12/10 12/11 12/12E 12/13E 12/14E Cash Flows Net Income 2'412 4'917 2'746 6'092 9'240 13'537 15'474 18'241 22'117 + Depreciation & Amortization 937 1'341 1'335 1'682 2'305 2'706 + Other Non-Cash Adjustments -3'435 -5'355 -1'570 -1'599 -5'502 -8'107 + Changes in Non-Cash Capital 501 -3'547 -1'563 5'306 -10'612 -19'640 Cash From Operating Activities 415 -2'644 949 11'481 -4'569 -11'505 + Disposal of Fixed Assets 296 753 529 304 544 663 + Capital Expenditures -2'577 -3'354 -4'596 -5'056 -16'158 -18'841 + Increase in Investments + Decrease in Investments + Other Investing Activities -1'365 -1'869 -4'759 -4'667 -11'715 -5'778 Cash From Investing Activities -3'645 -4'471 -8'826 -9'420 -27'330 -23'956 + Dividends Paid -335 -585 + Change in Short Term Borrowings + Increase in Long Term Borrowings 45'631 24'628 29'340 26'227 70'233 69'924 + Decrease in Long Term Borrowings -43'696 -13'856 -18'128 -32'778 -34'872 -29'728 + Increase in Capital Stocks 0 0 0 0 0 0 + Decrease in Capital Stocks 0 0 0 0 0 0 + Other Financing Activities 3'661 6'008 5'020 49'353 -751 32 Cash From Financing Activities 5'596 16'780 16'231 42'801 34'276 39'643 Net Changes in Cash 2'365 9'665 8'355 44'863 2'377 4'182 Free Cash Flow (CFO-CAPEX) -2'162 -5'999 -3'647 6'425 -20'727 -30'346 Free Cash Flow To Firm -1'298 -4'949 -2'497 7'506 -19'157 -27'523 Free Cash Flow To Equity 5'526 8'094 177 15'177 10'513 Free Cash Flow per Share -0.13 -0.35 -0.20 0.28 -0.69 -1.01 Q.M.S Advisors | tel: +41 (0)78 922 08 77 | e-mail: info@qmsadv.com |
- 7. Company Analysis - Financials IV/IV Periodicity: 12/01 12/02 12/03 12/04 12/05 12/06 12/07 12/08 12/09 12/10 12/11 12/12E 12/13E 12/14E Ratio Analysis Valuation Ratios Price Earnings 18.2x 11.0x 6.5x 6.6x 5.6x 4.8x EV to EBIT 9.8x 7.2x 5.9x EV to EBITDA 8.7x 6.4x 5.4x Price to Sales 0.4x 0.3x 0.2x 0.2x 0.2x 0.1x Price to Book 2.0x 1.3x 1.0x 1.0x 0.9x Dividend Yield 0.6% 1.8% 2.7% 2.3% 2.3% Profitability Ratios Gross Margin 7.3% 9.1% 7.8% 8.6% 8.3% 8.4% 10.7% 10.8% 12.0% EBITDA Margin 4.1% 7.0% 4.9% 6.0% 5.9% 6.2% - - - Operating Margin 3.4% 6.2% 4.2% 5.3% 5.2% 5.6% 5.1% 5.2% 5.2% Profit Margin 1.9% 3.0% 1.4% 2.4% 2.6% 2.9% 2.7% 2.7% 2.9% Return on Assets 3.5% 1.5% 2.4% 2.7% 3.0% 4.1% 3.6% 3.8% Return on Equity 55.6% 19.5% 13.9% 12.4% 16.3% 15.2% 15.6% 15.7% Leverage & Coverage Ratios Current Ratio 1.17 1.25 1.31 1.54 1.47 1.39 Quick Ratio 0.51 0.51 0.52 0.74 0.61 0.55 Interest Coverage Ratio (EBIT/I) 3.15 5.90 3.10 6.16 6.14 5.09 Tot Debt/Capital 0.63 0.60 0.65 0.37 0.47 0.53 Tot Debt/Equity 1.72 1.51 1.88 0.59 0.88 1.12 Others Asset Turnover 1.15 1.05 1.00 1.02 1.03 Accounts Receivable Turnover 5.54 6.07 6.90 8.05 7.94 Accounts Payable Turnover 3.85 3.79 3.64 4.43 3.88 Inventory Turnover 4.20 3.57 3.95 3.74 3.19 Effective Tax Rate 25.2% 26.8% 32.4% 28.6% 25.1% 25.7% Q.M.S Advisors | tel: +41 (0)78 922 08 77 | e-mail: info@qmsadv.com |
- 8. Company Analysis - Peers Comparision HYUNDAI CHANGJIANG & J- CHINA STATE -A BOUYGUES SA KAJIMA CORP OBAYASHI CORP SHIMIZU CORP TODA CORP HOPEWELL HLDGS HOCHTIEF AG BILFINGER SE SKANSKA AB-B PYI CORP LTD SEMBCORP INDUS FLUOR CORP ENG&CONS A Latest Fiscal Year: 12/2011 12/2012 03/2012 03/2012 03/2012 03/2012 06/2012 12/2012 12/2012 12/2012 12/2012 03/2012 12/2012 12/2012 12/2011 52-Week High 4.18 24.33 299.00 533.00 341.00 296.00 35.30 55.65 82.43 120.00 86'200.00 0.25 5.79 66.67 9.21 52-Week High Date 18.02.2013 19.03.2012 11.01.2013 11.01.2013 15.01.2013 21.03.2012 18.02.2013 27.02.2013 20.02.2013 19.03.2012 20.03.2012 17.01.2013 14.08.2012 28.01.2013 29.05.2012 52-Week Low 2.90 17.54 191.00 295.00 223.00 183.00 19.05 34.64 58.82 93.30 55'600.00 0.16 4.63 44.99 5.77 52-Week Low Date 24.09.2012 16.11.2012 04.06.2012 04.06.2012 14.11.2012 13.11.2012 31.05.2012 06.09.2012 05.06.2012 01.06.2012 26.07.2012 11.06.2012 11.05.2012 25.06.2012 04.12.2012 Daily Volume 96'668'255 442'593 13'646'000 5'052'000 2'076'000 528'000 926'923 29'320 19'967 707'857 381'724 8'280'000 4'052'000 1'506'224 3'329'763 Current Price (3/dd/yy) 3.41 22.27 258.00 457.00 309.00 223.00 32.15 54.49 82.12 116.00 64'200.00 0.20 5.22 63.55 6.74 52-Week High % Change -18.4% -8.5% -13.7% -14.3% -9.4% -24.7% -8.9% -2.1% -0.4% -3.3% -25.5% -21.7% -9.8% -4.7% -26.8% 52-Week Low % Change 17.6% 27.0% 35.1% 54.9% 38.6% 21.9% 68.8% 57.3% 39.6% 24.3% 15.5% 25.0% 12.7% 41.3% 16.8% Total Common Shares (M) 30'000.0 324.0 1'038.8 718.3 784.7 311.4 871.9 73.6 46.0 411.8 111.4 4'558.5 1'785.9 162.4 586.6 Market Capitalization 102'300 7'108 272'787 329'730 243'651 71'952 28'130 4'196 3'780 51'312 7'149'040 893 9'311 10'348 3'953 Total Debt 133'022.5 8'642.0 585'370.0 405'658.0 375'812.0 57'654.0 5'512.7 4'456.5 1'180.9 11'103.0 1'566'738.0 2'699.6 2'319.8 541.0 1'337.6 Preferred Stock - - - - - - - - - - 494.0 - - - - Minority Interest 29'331.8 1'500.0 (9.0) 25'028.0 2'738.0 4'172.0 2'784.0 1'603.4 8.0 166.0 - 678.3 1'141.1 85.8 4.7 Cash and Equivalents 94'380.3 4'487.0 179'098.0 124'497.0 209'793.0 52'934.0 7'975.9 3'143.6 1'087.2 5'770.0 1'260'966.0 1'068.7 2'101.3 2'610.0 461.9 Enterprise Value 210'983 12'763 617'372 721'474 452'356 121'906 33'097 7'112 3'881 56'811 7'455'306 3'415 10'671 8'365 5'719 Valuation Total Revenue LFY 463'876.8 33'547.0 1'457'754.0 1'245'772.0 1'336'194.0 489'385.0 1'757.9 25'527.7 8'508.8 129'350.0 10'433'442.0 5'207.9 10'189.1 27'577.1 5'625.9 LTM 463'876.8 33'547.0 1'483'907.0 1'354'265.0 1'374'435.0 520'781.0 1'910.7 25'527.7 8'508.8 129'350.0 10'433'442.0 6'262.1 10'189.1 27'577.1 5'650.6 CY+1 576'124.5 33'516.2 1'443'660.7 1'403'382.8 1'407'840.0 502'190.6 2'000.7 26'295.3 8'788.6 129'702.9 12'580'089.0 - 11'306.0 29'087.4 5'107.0 CY+2 671'681.0 33'717.1 1'475'598.0 1'432'734.1 1'387'306.8 423'840.0 2'345.7 27'382.4 9'209.0 132'874.7 14'137'208.7 - 12'838.1 30'313.9 6'165.0 EV/Total Revenue LFY 0.3x 0.4x 0.4x 0.5x 0.3x 0.2x 19.4x 0.2x 0.4x 0.4x 0.8x 0.6x 1.1x 0.3x 1.0x LTM 0.3x 0.4x 0.4x 0.4x 0.3x 0.2x 17.8x 0.2x 0.4x 0.4x 0.8x 0.5x 1.1x 0.3x 1.0x CY+1 - 0.4x 0.4x 0.5x 0.3x 0.2x 15.5x 0.3x 0.4x 0.4x 0.5x - 0.9x 0.3x - CY+2 - 0.4x 0.4x 0.4x 0.3x 0.3x 13.3x 0.2x 0.4x 0.4x 0.5x - 0.8x 0.3x - EBITDA LFY 28'914.4 2'890.0 47'238.0 43'099.0 27'006.0 (5'851.0) 761.8 1'477.3 577.5 4'462.0 433'227.0 98.5 1'415.4 946.4 429.2 LTM 28'914.4 2'890.0 49'975.0 48'077.0 21'238.0 (20'252.0) 840.6 1'477.3 577.5 4'462.0 433'227.0 9.1 1'448.3 946.4 - CY+1 - 2'884.9 43'949.7 46'749.4 24'397.0 (40'602.7) 965.3 1'639.9 582.0 6'151.7 932'080.5 - 1'552.3 1'345.9 - CY+2 - 2'939.0 48'798.3 48'699.4 27'690.7 667.7 1'076.9 1'788.4 624.0 6'526.5 1'091'510.0 - 1'750.4 1'482.9 - EV/EBITDA LFY 5.4x 4.5x 12.5x 13.6x 14.9x -13.4x 44.7x 4.2x 6.0x 11.0x 18.7x 33.8x 7.6x 8.0x 12.8x LTM 5.4x 4.5x 11.8x 12.2x 19.0x - 40.5x 4.2x 6.0x 11.0x 18.7x 364.2x 7.4x 8.0x - CY+1 - 4.6x 13.6x 13.6x 18.4x - 32.1x 4.2x 6.4x 8.7x 7.3x - 6.7x 6.2x - CY+2 - 4.5x 12.1x 13.0x 16.0x 160.3x 28.9x 3.8x 5.8x 8.2x 5.9x - 5.7x 5.3x - EPS LFY 0.43 2.00 4.87 9.67 1.54 - 4.13 1.41 6.23 - - - 0.42 4.28 0.46 LTM 0.45 2.01 6.60 -0.94 -1.87 -173.03 13.97 2.15 6.23 6.93 3'116.00 0.02 0.42 4.30 0.33 CY+1 0.52 2.46 20.45 17.09 7.54 (199.66) 1.52 3.31 5.72 8.35 5'294.18 - 0.45 4.16 0.49 CY+2 0.61 2.71 16.91 28.54 11.59 (6.47) 1.57 4.04 6.41 8.94 6'912.81 - 0.50 4.68 0.63 P/E LFY 7.6x 11.1x 39.1x - - - 2.3x 25.3x 13.2x 16.7x 20.6x 10.4x 12.4x 14.8x 20.5x LTM 7.9x 11.1x - - - - - 25.3x 13.2x - - - 12.3x 14.8x - CY+1 6.6x 9.0x 12.6x 26.7x 41.0x - 21.2x 16.5x 14.4x 13.9x 12.1x - 11.7x 15.3x 13.8x CY+2 5.6x 8.2x 15.3x 16.0x 26.7x - 20.5x 13.5x 12.8x 13.0x 9.3x - 10.5x 13.6x 10.7x Revenue Growth 1 Year 30.5% 2.6% 10.0% 10.1% 2.5% 8.2% 14.0% 9.6% 3.7% 8.9% 3.3% (2.8%) 12.6% 17.9% 7.0% 5 Year 29.4% 1.6% (2.6%) 1.8% 1.4% 5.9% 12.3% 12.5% 0.7% (1.1%) 13.7% 11.3% 3.2% 9.2% 16.0% EBITDA Growth 1 Year 38.9% (10.5%) 30.5% 24.7% (11.7%) - 37.1% (11.8%) 13.6% (8.3%) (15.7%) (49.9%) 4.2% (20.3%) 26.9% 5 Year 40.4% (3.3%) (7.9%) (5.7%) (14.6%) - 40.3% 32.7% 12.2% (6.6%) 2.4% 90.4% 13.2% 4.6% 18.1% EBITDA Margin LTM 6.2% 8.6% 3.4% 3.6% 1.5% (3.9%) 44.0% 5.8% 6.8% 3.4% 4.2% 0.1% 14.2% 3.4% - CY+1 - 8.6% 3.0% 3.3% 1.7% (8.1%) 48.2% 6.2% 6.6% 4.7% 7.4% - 13.7% 4.6% - CY+2 - 8.7% 3.3% 3.4% 2.0% 0.2% 45.9% 6.5% 6.8% 4.9% 7.7% - 13.6% 4.9% - Leverage/Coverage Ratios Total Debt / Equity % 149.3% 100.7% 228.0% 119.1% 123.5% 34.4% 17.3% 168.8% 58.2% 57.9% 34.7% 58.6% 51.5% 16.2% 69.3% Total Debt / Capital % 52.9% 46.2% 69.5% 52.6% 55.0% 25.2% 13.7% 51.2% 36.7% 36.5% 25.8% 33.8% 29.1% 13.6% 40.9% Total Debt / EBITDA 4.601x 2.990x 10.435x 8.309x 16.394x - 9.273x 3.017x 2.045x 2.488x 3.616x 319.137x 1.602x 0.572x - Net Debt / EBITDA 1.336x 1.438x 7.380x 6.358x 9.154x - 2.084x 0.889x 0.162x 1.195x 0.706x 195.857x 0.151x -2.186x - EBITDA / Int. Expense 5.620x 8.210x 6.389x 11.091x 6.084x -7.618x 9.951x 4.546x 14.259x 9.637x 7.115x 0.741x 10.110x 33.514x 7.261x Credit Ratings S&P LT Credit Rating - BBB+ NR NR NR NR NR - BBB+ - - - - A- - S&P LT Credit Rating Date - 30.11.2011 10.04.2009 10.04.2009 09.01.2007 11.05.2005 19.01.2005 - 23.10.2012 - - - - 22.01.2004 - Moody's LT Credit Rating - (P)A3 WR WR - WR - - - - - - - A3 - Moody's LT Credit Rating Date - 26.01.2012 03.04.2009 18.08.2006 - 01.03.2004 - - - - - - - 29.11.2000 - Q.M.S Advisors | tel: +41 (0)78 922 08 77 | e-mail: info@qmsadv.com |