SlideShare uma empresa Scribd logo
1 de 36
Baixar para ler offline
Technology Evolution and Demand Heterogeneity:

                      Implications for product and process innovation


                                           Ron Adner

                                          INSEAD
                                  Boulevard de Constance
                              77350 Fontainbleau Cedex, France
                                    adner@econ.insead.fr


                                        Daniel Levinthal

                       University of Pennsylvania, The Wharton School
                                 2000 Steinberg Dietrich Hall
                                   Philadelphia, PA 19104
                              levinthal@management.wharton.upenn.edu


                                  DRAFT – September 1999


We thank George Day, Connie Helfat, John Kimberly, Bruce Kogut, Hans Pennings, Christophe
Van Den Bulte, and Sid Winter as well as seminar participants at the University of Pennsylvania,
  Insead, the University of Michigan, and London Business School. We thank the Hunstman
       Center for Emerging Technology at the University of Pennsylvania for funding.
2


                                           Abstract

    While research on the evolution of new technologies has emphasized the “supply side”
activities of firms, there is growing recognition that the external demand environment can
exercise significant influence over these activities. This paper presents a demand-based view of
technology evolution that is focused on the interaction between technology development and the
demand environment in which the technology is ultimately evaluated.
         We develop a formal model that explicitly considers the influence of heterogeneity in
market demand – the presence of consumers with different needs and requirements – on firms’
innovation choices. The model is analyzed using computer simulation. The model is used to
examine the dynamics of product and process innovation (Utterback and Abernathy, 1975). The
analysis reveals that demand heterogeneity offers an alternative to supply-side explanations of the
technology life cycle. Further, by considering the possibility of technologically satisfied
consumers, the model also suggests a rationale for a new stage in the technology life cycle
characterized by increasing performance at a stable price. This stage has not yet been treated
formally in the literature, but is increasingly evident in digital and information based
technologies.
3


1. Introduction

       The challenge of understanding the dynamics of technological development has long been

a concern of the management field. Two dominant approaches inform the discussion of

technological change: one suggests that innovation is driven by the external requirements of the

market (Schmookler, 1966), while the other views the activities and internal capabilities of firms

as the primary drivers of innovation (Dosi, 1982). Taken in isolation, each approach highlights

key aspects of technological development but, as many have argued, the greatest insight derives

from their joint consideration (Mowery and Rosenberg, 1979).

       Despite this call for balance, by far the larger portion of work on technological change is

concentrated on the ‘supply-side’ dynamics --- whether at the macro level of technological

trajectories (Dosi, 1982; Sahal, 1985) or the path dependent nature of individual firm capabilities

(Helfat, 1996). Relatively under explored in these discussions of innovation is the effect of the

demand environment on the development and evolution of technology (though see Clark, 1985;

von Hippel, 1988; Christensen, 1997 for important exceptions). Technical developments are a

function of the opportunity structure that firms perceive. This opportunity structure, in turn, is a

function of the firm’s current set of capabilities (Dosi, 1982; Neslon and Winter, 1982; Cohen

and Levinthal, 1989), the inherent possibilities offered by the alternative technologies (Sahal,

1985), and the market context in which the firm operates (Christensen, 1997).

       We develop a demand-based view of technology evolution that is focused on the

interaction between technology development and the demand environment in which the

technology is ultimately evaluated. A critical element in our framework is the inherent diversity

that underlies the notion of ‘market’ demand. The latent set of consumers may have widely
4


differing needs and requirements. We characterize consumers by two attributes: the minimum

performance requirements that a product technology must satisfy in order for the consumer to be

willing to consider purchasing a good, and the consumer’s willingness to pay for product

performance. We examine the evolution of a technology whose development is locally

constrained, and in turn path dependent, but globally unconstrained regarding the absolute, or

asymptotic, limits to its progress.

       The model is used to examine the dynamics of product and process development

throughout the technology life cycle. Currently, the pattern of product and process innovation is

understood as the result of the emergence of dominant designs (Utterback and Abernathy, 1978;

Anderson and Tushman, 1990) and of shifting appropriability regimes (Cohen and Klepper,

1996). In contrast, we suggest that this pattern may be an outcome of locally adaptive behavior of

firms in a heterogeneous demand environment.

       In a heterogeneous demand environment, early technological development is motivated

by the drive to meet market requirements. Depending on the initial functionality and cost of the

technology, this may lead to an early emphasis on product technology to enhance the

functionality of the technology in order to meet the demand requirements of users or on process

technology to reduce the price to a level that corresponds to consumers’ willingness to pay. In

later stages of development, when the technology has surpassed market requirements, technical

developments are driven by the desires of competitive firms to maximize their profits in the face

of ‘technologically satisfied’ consumers.

       This latter stage of development suggested by the model implies the existence of a new

stage in the technology life cycle characterized by increasing performance at a relatively stable

product price. This stage has not yet been treated in the literature, but is increasingly evident in
5


electronic based product technologies. As firms operating in these industries benefit from the

biannual doubling of performance predicted by Moore’s Law (The Economist, 1997), their

technology management challenge shifts from the focused pursuit of performance improvement

to include the ways in which these improvements are valued and applied by their customers. In

settings in which the rate of technological improvement outpaces the demand for this

improvement, consumers’ marginal utility from performance increases plays a critical role in

shaping firms’ pricing and development choices.

       Consider the price performance histories of videocassette recorders and personal

computers shown in Figures 1 and 2. A striking similarity between them is the stability of

product price in the later stages of product evolution, even as their objective performance

continues to increase. While computing power more than quadrupled between 1992 and 1996,

the average unit price for a personal computer remained stable at around $2000 throughout the

period (Computer Intelligence Info Corp, 1996).1 Similarly, VCR prices remained relatively

stable from 1990 to 1997, even as new features were introduced yearly (Consumer Reports,

1990-97). Thus, rather than price increasing to

reflect a premium that suppliers can extract for the greater functionality delivered, or stable

functionality at decreasing prices, we observe functionality increases at stable prices. Similar

histories could be compiled for fax machines, modems, copiers, and numerous other products

whose core technology are digital logic circuits.

       The remainder of the paper is structured as follows. We first explore existing approaches

to the technology life cycle and the treatment of market demand in the literature on technology

evolution. We then develop the conceptual framework of demand heterogeneity. In section 4,
6


the model is analyzed using a computer simulation. We conclude by examining the distinctive

implications that derive from a view of technological development that is informed by this more

detailed consideration of market demand.


2. Dynamics of Product and Product Innovation

           The technology life cycle describes the dynamics of product and process innovation and

has long held a central place in the literature on technology management (Meuller and Tilton,

1969; Utterback and Abernathy, 1975; Clark, 1985; Utterback, 1994; Klepper, 1996). The

pattern that has been widely described is illustrated in Figure 3. Porter (1983:22) provides a

succinct summary of the dominant explanation for this behavior:

                    Initially, . . . product design is fluid, and substantial product variety is present.
           Product innovation is the dominant mode of innovation and aims primarily at improving
           product performance. Successive product innovations ultimately yield a “dominant
           design” where the optimal product configuration is reached. Process innovation is
           initially minor in significance, and early production processes are characterized by small
           scale, flexibility, and high labor skill levels. As product design stabilizes, increasingly
           automated production methods are employed and process innovation to lower costs takes
           over as the dominant innovation mode. Ultimately, innovation of both types begins to
           slow down.


           The primary focus of the dominant design approach is on the supply side coordination of

uncertainty reduction that allows for investment in specialized production equipment. While this

approach recognizes that consumer requirements influence the establishment of a dominant

design, it is silent on the role of demand on post-dominant design developments. Several of the

assumptions underlying the dominant design explanation are problematic. First is the

assumption of a clear ordering between product and process innovation which posits that firms

will tend to ignore the production process and control of costs until the product design has been

1
    This price has dropped significantly since 1997 with the introduction of $1000 desktop computers. The implication
7


fixed (DeBresson and Townsend, 1985). While design improvements are a primary driver of

market acceptance, in many instances cost savings provide the critical motivation for

technological substitution and are therefore an early focus of innovative effort. A second

problem is the assumption of the depletion of product improvement opportunities. The

generalizability of claims of diminishing technological opportunities, however, is refuted in

several studies that closely examine this issue (e.g. Christensen, 1992; Henderson, 1995).

         An alternative explanation for the technology life cycle (Cohen and Klepper,) suggests

that the shift in innovative focus from product to process development is driven by changes in the

ability of innovating firms to appropriate returns on their investments in innovation. According

to this perspective, the value of process innovation is proportional to the level of output produced

by a given firm. Thus, as an industry matures and firms get bigger, firms have increasing

incentives to pursue process innovations. In contrast, since returns to product innovations are

related to the acquisition of new customers rather than the magnitude of the existing customer

base, the relative return to product innovation declines over time.

         This scale-appropriability approach predicts the rise of process innovation without

placing exogenous limits on opportunities for product innovation or interdependence between

innovation regimes. However, it does not address the continued pursuit of product innovation

that is exhibited in industries such as consumer electronics and computers, which are dominated

by the large firms that are predicted to shy away from product innovation. Indeed, in reviewing

the patent counts compiled by Gort and Klepper (1982) for over 46 product classes, Klepper

himself states that “neither series reflects the decline over time in product innovation conjectured

in the PLC [product life cycle]...” (1997: 167).


of this change for the arguments presented here are discussed later in the paper.
8


       Common to both the dominant design and the scale-appropriability approaches is a focus

on the dynamics of supply without an explicit examination of the demand context in which the

innovating firm operates. We develop a finer grained consideration of the demand context and

how this can inform our understanding of the evolution of technology in general, and the

technology life cycle in particular.


3. Heterogeneity and Markets

       Demand is not homogenous, rather it varies within a market comprised of individual

consumers. This assertion is not novel. Indeed, it is present in any consideration of strategy that

differentiates between niche segments and mainstream markets (Kotler, 1991; Porter, 1980).

Consumers can be distinguished by their preference structures and the relative value they place

on different product attributes. A key element in such a preference structure in the context of

emerging technologies is the minimum performance threshold that a product must reach if it is to

be of value to a given consumer.

       The focus in this analysis is heterogeneity in the minimum performance threshold among

consumers and in consumers’ willingness to pay for products that meet this performance

threshold.


Thresholds

       The notion of heterogeneous thresholds is well established in a variety of literatures

including consumer choice (McFadden, 1986; Green and Wind, 1973), the diffusion of

innovation (Stoneman, 1987; Thirtle and Ruttan, 1987), and is embodied in the notion of

reservation prices in microeconomic models (Varian, 1978). The basic notion common to these
9


applications is that the adoption of a technology or the purchase of a good is a discrete decision

that is prompted by some threshold of “attractiveness” being surpassed.

       We define a consumer’s functionality threshold as the minimum objective performance

(independent of price) that a given product must deliver in order for the consumer to consider it.

Associated with this functionality threshold is a consumer’s net utility threshold which specifies

the highest price that a consumer is willing to pay for a product that just satisfies his or her

functionality requirements. The value of considering the two thresholds jointly, rather than

combining them both into a single construct, is that it allows for an explicit consideration of

technology improvements in both performance and price.

       A functionality threshold specifies the performance level below which a consumer will

not accept a product, regardless of its price. A product that falls below a given consumer’s

functionality threshold is, for that consumer, ‘junk’ and would not be accepted at any positive

price. The same product, however, may well be acceptable to a consumer with a different

functionality threshold.

       Functionality thresholds are determined, in part, by inherent task requirements and, in

part, by context. Thus, a machinist drilling high precision parts cannot make use of a drill press

with loose tolerances, no matter how low its selling price, because such a machine is not able to

support the intended application. Alternatively, functionality requirements can be externally

imposed, by the demands of downstream customers (e.g., producers of goods for the luxury

market will need higher quality materials than those producing for the economy market) or by

externally imposed regulations (e.g., electricity producers in California require cleaner generating

stations than producers in North Dakota in order to be certified for operation).
10


        Net utility thresholds capture the interaction of product performance and price. The net

utility reflects the highest price a consumer is willing to pay for a product that just meets his or

her requirements. Consumers with the same functionality threshold may have different net utility

thresholds. Variation in willingness to pay may be driven by differences in budget constraints,

but more importantly, particularly in the context of firms, by non-budgetary differences as well.

        Consumers may differ in the value they derive from the product for a number of reasons.

Consumers may differ in their ability to exploit the product as a result of heterogeneity in internal

resources and capabilities, or human capital. For instance, a skilled programmer may be able to

derive more benefit from a given computer system than a less skilled one. Alternatively,

differences in net utility thresholds may stem from the scale at which the buyer can apply the

product. A firm that can apply the product toward the production of a good that it can then sell to

a large downstream customer base would be willing to pay more for the product than a potential

buyer with a smaller customer base. Finally, differences in willingness to pay may reflect

variation in the availability and presence of a substitute product or service. A firm that has

previously invested in a substitute good will benefit from the new product only to the extent that

the product provides an improvement relative to the existing substitute; alternatively, a similar

firm, not in possession of a substitute, will value the product on the basis of the absolute benefit

it provides.


Diminishing Returns

        While consumers have a minimum threshold for acceptable performance, there is no

analogous boundary that specifies a maximum limit to the functionality that a consumer would

be willing to accept. At the same time, it is reasonable to assume that there is diminishing
11


marginal utility to increases in functionality (Meyer and Johnson, 1995). Correspondingly, it is

reasonable to assume that consumers show a positive, but decreasing, willingness to pay for

improvements beyond their requirements.

        Thus, as consumer requirements are exceeded, their willingness to pay for improvement

will become increasingly small to the point that firms will be unable to extract any meaningful

premium for further improvement. However, even if consumers place little value on

performance differences at sufficiently high absolute levels of functionality, they will still, all

else being equal, choose the more advanced product. As a result, in a competitive context this

responsiveness to functionality improvements forces firms to continue to enhance functionality

even when such enhancements have little effect on consumers’ willingness to pay.


Dynamics of Technology in Heterogeneous Markets

        The presence of different threshold levels for both functionality and net utility implies

that consumers will vary in the degree to which a product technology at a given state is capable

of satisfying their requirements. In turn, there will be variation in the type, and amount, of

development that is required before the product becomes relevant to a given consumer. While

models of the diffusion of innovation explicitly consider demand heterogeneity in explaining the

differences in adoption rates and decisions, they tend to focus on the diffusion of a fixed

innovation (Brown, 1981; Rogers 1994), and thus fail to consider the interaction between

changes in the innovation that result from further development and consumers’ adoption

decisions (Thirtle and Ruttan, 1989; Rogers, 1994; Reingenum, 1989).2


2
  Those few models that do examine a changing innovation (Stoneman, 1987; Jensen, 1982) do so in the context of
two period models which do not really speak to an evolutionary pattern, and address product changes of only one
type (either price decrease or quality improvement) but not both simultaneously.
12


       In mature markets, functionality and price are often confounded as consumers with high

(low) functionality requirements generally buy more (less) expensive products. However,

functionality and price need not be coupled. In markets for emerging technologies, potential

consumers with a high willingness to pay for the product who have, at the same time, low

functionality requirements, play an important role in both the development and adoption of an

innovation. The military has been the quintessential example of this sort of early purchaser who

is willing to cover development costs (Klein, 1977). Early in a technology’s development, high

performance products may not be available, not because of the absence of willing purchasers, but

because of still unsurmounted difficulties with the technology itself (e.g. consider the case of

superconductors or solar energy). As such, early consumers may also be individuals who are

characterized by their low-functionality requirements, or, their ability to derive unusual benefit

from products of objectively low functionality.

       For instance, the early market for xerography was comprised of firms that made original

master plates for offset printing. Because these firms were able to integrate the machine into a

specialized activity, they were able to benefit from it at a time when other potential consumers

found them unacceptably complex and unreliable. It was only after extensive further

development that Xerox machines were able to satisfy the much higher functionality demands of

the mainstream office market (Dessauer, 1971). In such cases, finding consumers who are

willing to pay a high price for a relatively crude product may

be critical to firms’ ability to engage in the development effort.

       In the context of emerging technologies, firms do not have the option of positioning

themselves anywhere in the attribute-price space. This contrasts with the spirit of the classic

segment-target-position (STP) marketing paradigm (Kotler, 1991), in which firms are told to first
13


segment the market, then examine the characteristics of consumers in these individual segments

and then consider ways of tailoring the product to meet segment specific needs. Such an

approach is appropriate when firms can manipulate product attributes at will, as in typical

marketing examples of varying sweetness, saltiness, and tartness in a food product.

       When the manipulation involves challenging performance attributes which cannot be

easily or quickly changed, such as reliability, size, and speed, this tailoring approach becomes

less managerially tractable. In such situations, an approach which considers the interaction of

consumer needs with both short and long term technological possibilities may be more

informative. We explore the path-dependent development of technology, where path dependence

results from both the “supply-side” constraints of technical change at any moment in time, and

the history of feedback from the demand contexts in which the technology has been applied.


4. Model Structure

       The model structure has two basic components -- a characterization of consumers and

consumer preferences which comprises the demand environment, and a mechanism by which

products move through this market space. The market space is defined by a functionality

dimension and a price dimension. In every period, firms make development decisions that affect

the location of the product technology in this space; consumers, in turn, respond to the product

offerings by either purchasing or not a unit quantity of the product.

       It is assumed that consumers engage in repeat purchasing behavior such that the entire

population of consumers considers making a purchase in every period and that consumer
14


preferences are stable over time.3 Although preferences are stable, consumer purchase decisions

vary as product performance and price vary over time. Consumers are assumed to be well

informed4, in that they have accurate information about product performance each period. Firms

are assumed to maximize current period profits.5

         In the model, consumers are characterized by two basic factors. The first factor, Fi0 ,

specifies individual i’s minimum functionality requirement. The second factor, Ui0 , specifies

consumer i’s minimum utility requirement, which determines the price, Pi0, that consumer i

would be willing to pay for a minimally acceptable product. The population of consumers is

specified by independently drawing values of Fi0 and Ui0 from a uniform distribution of sufficient

range such that multiple innovation attempts are required to reach all consumers in the market.

The functional benefit, Bij, that consumer i derives from product j is determined by the

functionality offered by the product in excess of the consumer’s minimum functionality

threshold:

3
  This situation is characteristic of a market for durable goods with regular entry of consumers, such as the entry of
some fixed number of new households into an economy every year. Alternatively, this type of repeat purchasing
behavior could characterize a fixed population purchasing a non-durable good. The assumption of some sort of
continuing purchase, whether through a renewing population of single good purchasers or a fixed population of
repeat purchasers, is important to the model in that it is the potential of attracting existing as well as new customers
that drives firms to innovate. As a result, a single purchase, fixed population model would not generate the behavior
observed in the last phase of the current model because, in effect, such a model stipulates the ‘end of history’ after
full penetration. A less extreme model, however, such as one in which goods face obsolescence after some number
of periods would generate incentives for continued innovation on the part of firms as they compete for whichever
consumers are active in the market in each period.
4
  The current model makes the simplifying assumption that consumers are perfectly informed regarding product
performance. Because the interest is in the qualitative pattern of behavior, consumer uncertainty would be a relevant
factor if it were to affect firms’ development decisions in a systematic way. With no compelling reason to bias
consumers’ assessment of product performance in either the positive or negative direction, the error in the
assessment would have to be modeled as a symmetric distribution around the true value. Such an error, while
affecting the absolute values associated with the observed outcomes, would not affect the qualitative nature of the
results and would thus only be an unnecessary complication.
5
 This can be thought of as price skimming behavior (Kotler, 1991) and is the same assumption made in Klepper
(1996).
15


                                 Fj – Foi + 1       if Fj – Foi ≥ 0
(1)           Bi(Fj) =
                                                    0          otherwise

            The utility, Uij, that consumer i derives from product j is specified as a Cobb-Douglas

utility function which trades off price and functionality as6:

                                     α        1-α
(2)         Ui(Fj , Pj) = Bi(Fj)         (1/Pi)         , where 0 < α < 1.

            Consumers will reject any product that does not meet both their functionality and utility

requirements, such that Bi ≥ 1, and Uij ≥ Ui0. Thus, Pi0, is the highest price a consumer will be

willing to pay for a product that just satisfies his or her functionality requirement, (i.e., Bij = 1)

and is characterized as:

(3)         Pio = ( Uio )1/(α - 1)

            As discussed above, consumers value functionality improvements beyond their threshold

requirements, ∂Uij/∂Bij > 0, but at a decreasing rate, ∂2Uij/∂Bij2 < 0. This property of diminishing

returns to improvements holds for α values below 0.5. From the utility function we solve for Pij,

the maximum price a consumer would be willing to pay for a product that meets his or her

functionality requirements, as7:


                                  α/
            Pij = Pio ( Bi(Fj) )
                                       1-α
(4)


6
  Note that [logU]/(1-α) = α/(1-α)logB – logP. Hence, our model is a monotonic transformation of the utility
function of standard vertical differentiation models, where U=KB - P (Tirole, 1988). The current model differs from
the standard model in that it introduces minimum thresholds for functionality and diminishing returns to functional
improvements.
7
    To find Pij we identify the product j such that Ui (Fj , Pj ) = Uo.
16


       Given a choice among a set of acceptable products, a consumer will select the product

that maximizes his or her utility. In every period, the entire population of consumers is exposed

to the available products and each consumer selects his or her own best choice.


Evolution of Product Technology

       Products are represented by their functional performance and by a cost of production.

Following the characterization used in previous analytical models (Cohen and Klepper, 1996;

Klepper, 1996), the effect of product and process innovations is reflected in changes in the

product’s functional performance and cost. Product innovation enhances functionality by a fixed

amount, Fprod, and leads to a fixed production cost increase, Cprod. Thus, a product innovation

affects product j in the following manner:

       (5)     Fj, t+1 = Fj,t + Fprod

       (6)     Cj, t+1 = Cj,t + Cprod


       Process innovation leaves product functionality unchanged, while lowering the cost of

production by a constant percentage, ∆c. Thus, a process innovation affects product j as follows:

       (7)     Fj,t+1 = Fj,t

       (8)     Cj, t+1 = Cj,t (1 - ∆c)


       The geometric decrease in cost due to process innovation has an empirical basis, as

discussed in the learning curve literature (Boston Consulting Group, 1972). On the product

innovation side, modeling product improvement as an arithmetic increase implies that the rate at

which firms can pursue improvement is fixed --- firms can’t engage in time compression by

executing two innovations in a single period.
17


           In reality, the rate of innovative improvement is a function of the resources devoted to

innovation, as well as technological possibilities. The S-curve literature (Foster, 1986) shows

that, at later stages of development, increasingly larger resource investments are required to

maintain a constant rate of performance improvement. Often, these investments are justified by

the (expected) growth of the market in which the innovations are deployed. Because the purpose

of this model is to examine the effects of demand heterogeneity on technology development, and

not the technological limits to development themselves, the simplifying assumption of linear

improvements is used.

           In every period firms can choose to pursue a mix of product and process innovation or to

forgo innovative activity. The current state of the product is determined by the entire history of

development activity and is therefore path dependent. Innovative outcomes are cumulative and

therefore product cost and functionality cannot be manipulated instantaneously.

           In the model, firms choose innovative activity on the basis of local search. Firms are

assumed to be able to predict consumer reaction to each incremental change to the product (i.e.

development outcomes that will ensue within a single product or process innovation). However,

firms do not make evaluations of potential consumer demand further away from their current

product offering.

           We explore behavior that corresponds to a symmetric Nash Equilibrium of a series of

one-shot games among firms with firms choosing innovation activity and price so as to maximize

their own payoff assuming that their competitors’ behavior remains constant. Thus, firms are

modeled as making profit-maximizing choices, but based only on next period’s payoff. Finally,

we make the simplifying assumption that firms’ initial product offerings are the same. 8

8
    In the current modeling effort, we are trying to understand the effect of consumer heterogeneity on the pattern of
18


         The model is analyzed under two different product pricing regimes. The first pricing

regime, ‘market pricing’, posits that firms are fully informed regarding consumers’ responses to

pricing and that the firms can, given their product’s performance and production cost, determine

the price point which will yield them the greatest profit. The second pricing regime, ‘heuristic

pricing’, assumes that firms price at a fixed markup over costs. This simplified pricing structure,

while clearly non-optimizing, is the most common form of pricing rule employed by businesses

today (Monroe, 1990: 143).

         The model results, discussed below , are remarkable for their robustness given that these

two pricing regimes represent polar cases of firm pricing decisions. While the choice of pricing

regime affects the absolute values of the simulation results, the pattern of product and process

innovation behaviors that is the focus of this analysis is consistent for both settings.9 To facilitate

the exposition of the results, we present figures from the heuristic pricing case.


5. Analysis

         The model is analyzed using a computer simulation programmed in Pascal. The first

procedures of the simulation initialize both the population of consumers and the initial

characteristics of the product technologies. The population of consumers is composed of one

hundred individuals, with each individual characterized by a minimum functionality requirement

and a minimum utility level. The values of individual consumers’ Fi0 are uniformly distributed

from 1 to 20 and Pi0 values range from 1 to 7. The range of consumers’ minimum functional


product and process innovation for a single technological trajectory. A separate question is how different
technological trajectories may compete with one another.
9
  Because the market pricing regime allows for behavior that is more sensitive to immediate market opportunities
(i.e., the particular preferences among consumers considering purchasing the product), the price patterns display
greater variance than those observed under the heuristic pricing. The relative pattern of product and process
innovation, however, holds true for both cases.
19


thresholds is such that approximately twenty product innovation attempts are necessary to span

the distance between the minimum requirements of the least and most demanding customer in the

market.

       Product technologies are introduced to the market at different points of functional

development. We characterize two different settings of product entry. One is a “new to the world

technology”. This is the typical setting examined in technology life cycle studies in which the

initial product technology is functionally crude. With this initial setting, we observe the

conventional technology life cycle in which product development is initially emphasized with a

later shift in emphasis towards process innovation.

       The other setting is a “new to the market” technology. Product technologies can be

introduced in forms that are, relative to market demands, functionally advanced. This situation is

characteristic of product technologies that are being modified for application in a new task

setting, after having been previously introduced to other application domains. In this setting, the

initial emphasis is on process innovations in order to lower the costs of the product sufficiently to

penetrate larger segments of the latent market.

       “New to the world” technologies are introduced at an initial performance level of 2 and

an initial cost of 4. ‘New to the market’ technologies are introduced at an initial cost of 10 and an

initial performance of 15. For all the runs shown, α = 0.2, Cprod = 0.2, Fprod = 1, ∆c = 0.05, and

the heuristic markup is 20 percent. The firms’ choice set for allocating development effort

between product and process innovation is: pure product; 75% product, 25% process; 50%

product and process; 25% product, 75% process; and pure process.

       After this initialization, the following sequence of events is repeated for one hundred

periods. First, each firm independently surveys its demand environment to determine the profit
20


expectations for each possible development action. Second, the firms commit to the activity that

will the yield highest expected profit. Third, every consumer then independently evaluates the

available product offerings and decides whether any product satisifies their minimum

functionality and utility requirements and, if so, what product provides them the maximum utility

level. Finally, market outcomes are tallied and firms experience their actual market payoffs.

       To test for stochastic robustness, the simulation was run fifty times with different

randomly drawn populations. While the duration of each of the distinct phases of technology

evolution varied with each specific population draw, the relative rates of innovation followed a

similar pattern.

       The absolute and relative attractiveness of product and process innovation is determined

by the relationship among Fprod , Cprod, and ∆c. These variables affect the qualitative results in a

straightforward manner (increasing Fprod or decreasing Cprod makes product innovation more

attractive, while increasing ∆c makes process innovation relatively more attractive). The value of

parameter α, affects the price trends observed when in the mature demand phase (as discussed

below). The parameters which most dramatically affected the qualitative pattern of behavior are

the initial cost and performance attributes of the product. These variables affect the early stage

dynamics of how consumer thresholds are met.


6. Results

       Three canonical phases of development activity can be identified during the course of the

simulation according to their relative rates of product and process innovation. In the first phase,

which is termed attribute equalization, development actions are focused on achieving a balance

between price and performance relative to the demands of the market. In this phase, one of the
21


two innovation types is the dominant development mode. In the second phase, termed market

expansion, development activities serve to expand market penetration through reductions in

price, and thus process innovations are dominant. Finally, in the third phase of demand maturity,

innovation activity alternates between product and process innovation so that price remains

relatively stable as product functionality increases.

       The phases are identified by observing inflections in product pricing behavior. The

boundary between the first and second stages is defined as the point of greatest negative change

in the price slope. The boundary between the second stage and third stage is defined as the point

of greatest positive change in the price slope. A representative simulation run for new to the

world introductions isshown in Figure 4. The figures graph the levels of functional performance

and price over time. The pattern of product and process innovation is most readily observed by

following changes in product price, since in the case of heuristic pricing price is coupled to

production cost and thereby directly reflects firms’ innovation choices. Price increases signal a

focus on product development, while price decreases signal a focus on process development.

       The first phase is characterized by an increase in product price, reflecting a focus on

product development. The second phase in which price decreases, reflecting the dominance of

process development begins at period 12 and ends at period 33. It is followed by the third phase

is characterizedby relative price stability in the face of performance improvements.

       Figure 5 depicts the dynamics of technology development for products that are introduced

to the market at a relatively advanced state of product development. In this case the attribute

equalization stage focuses on price reduction that not only balances the relative value of price

and performance to meet market preferences, but at the same time also results in increased

market penetration. As a result, the stages of attribute equalization and market penetration are
22


effectively collapsed onto one stage. The third phase, demand maturity, begins in period 23 and

has the same characteristics depicted for the case of ‘new to the world’ product technology.

        Examples of such ‘new to the market’ technologies are the commercialization of space

technology, or the ‘consumerization’ of industrial goods. The development of home video

cassette recorders, which built on a related product technology developed for industrial

applications (Cusumano and Rosenbloom, 1987), falls into this category; indeed, the price-

performance history presented for VCRs in Figure 2 is similar to the these simulations results.


Attribute equalization

        Recall that for a consumer to purchase a product, the product must satisfy or exceed the

consumer’s threshold functionality and the product’s price must be such that the net utility will

satisfy or exceed the consumer’s threshold utility level. At the early stage of market penetration,

the innovation effort that will yield the greatest increases in sales and profit is the one that will

meet the threshold requirements of the greatest number of current non-buyers. This attribute,

whether functionality or price, will be the focus of the initial innovative efforts.

        The attribute equalization phase of innovative activity ends when the relative values of

market price and product functionality correspond to consumers’ preferences regarding the

tradeoff between price and functionality. Development efforts face a tension between attracting

new customers through engaging in product development and losing satisfied customers who are

unwilling to pay the higher price charged for an improved product. In the conventional setting in

which early innovative efforts focus on product innovation, this loss of established consumers

due to price increases associated with product development is initially offset by the addition of

new consumers with higher quality thresholds and greater revenue per product associated with
23


their purchases. After a certain point, however, efforts at market penetration via product

enhancements become self-defeating as large numbers of former purchasers find the new price-

performance combination unattractive.

        Clearly, the product’s initial cost and performance will determine the dimension on which

initial innovative efforts are directed. In the traditional technology life cycle, this initial phase is

dominated by product development activity. In the new to the world case, the model predicts an

early focus on product development when the market penetration of the initial embodiment of a

product is limited by its performance. Consider for example the market for early personal

computers. The initial penetration of PCs was limited largely by the low functionality of the

early PCs, rather than a prohibitive price. Early automobiles also suffered from an initial

performance crisis: a car that breaks down every fifteen miles is no substitute for a horse,

regardless of price.

        In contrast, for product technologies that are introduced to the market at a functionality

level that is high compared to their affordability, price is the primary barrier to market

penetration and, as a result, process development is the primary focus of early development

efforts. Commercial applications of space technologies provide a clear example of such

products. For example, the critical task for the commercialization of the Global Positioning

System was not to improve the precision of the transmitter, but rather to lower the cost of the

system from the thousands of dollars paid by government agencies to the $500 price range at

which commercial introduction was feasible (Pearce, 1994).
24


Market penetration

       The next phase of innovative activity is dominated by process developments which serve

to ‘fill in’ the market via price reductions. Some of these ‘fill in’ customers are former

customers who stopped purchasing when the product became too expensive. Others are ‘bargain

hunters’, consumers whose functionality thresholds are relatively high, but who are unwilling to

pay the high early market price. Product price is reduced until the sales increases due to lower

price no longer offset the revenue lost per product.


Demand maturity

       Eventually firms’ development efforts yield a product whose functionality satisfies the

core of the market to the point where performance improvements no longer attract a price

premium from a significant part of the market. At this point, consumers’ diminished valuation of

performance improvements would seem to reduce the appeal of product innovation. However,

despite the reduction in willingness to pay for improvement on the part of consumers, firms,

driven by competitive pressures, engage in significant levels of product innovation.

       Although the market as a whole is ‘satiated’ with the existing quality of product offerings,

in that the prospect of incremental performance improvements will not significantly affect buying

behavior with regards to either willingness to pay or number of active buyers, individual firms

still perceive opportunities for market share gains through offering consumers better products.

Because each firm evaluates its development options with regards to it’s rival’s existing rather

than potential product, each firm believes that market share gains will ensue if it offers a better

product than was previously available to consumers. In the context of the model, a superior
25


product is one of equivalent performance at a lower price or of higher performance at a similar

price, than the products offered in the previous period.

         Consider the firm’s opportunities at the point at which consumer willingness to pay for

performance improvement has diminished. If the firm chooses a to focus on product innovation,

its production costs will increase. As it attempts to pass these increases onto the market,

consumers at the low end will begin to drop out. As the market shrinks, the gains from higher

product prices becomes insufficient to offset the loss of buyers and process innovation becomes

the more attractive alternative. If the firm chooses to focus on process innovation and thereby

reduces its production costs, competitive pressures will force the firm to pass some of these

savings on to consumers. Successive process innovations lead to reductions in both the cost and

the price of the product, eventually leading to pressure on profit levels and, in turn, increasing

the attractiveness of product innovation.

         Thus, at the point at which consumer willingness to pay for performance improvements is

relatively low, innovating firms face a tension between the loss of revenue due to decreases in

unit volume associated with the higher prices that result from product development efforts and

the loss of revenue due to the price decreases associated with process development. In the

model, firms manage this tension by choosing to balance product and process innovation ,

keeping product price in a critical range that corresponds to the way that the aggregate market

trades off the value of product performance and price. This tradeoff is determined by the value

of the parameter α in consumers’ utility function. Lower (higher) values of α lead to a lower

(higher) price level at maturity.10


10
  Since α effectively represents consumers’ preference for the product relative to all other uses for money (i.e. all
other goods and services in the economy), its empirical value is likely to be quite low.
26


       At this stage, product development becomes a way of maintaining product price rather

than satisfying the needs of new customers. As a result of competition in the face of mature

demand product price remains relatively stable while product functionality experiences a steady

rate of improvement.

       The competitive dynamics underlying this third stage can be further illustrated by

considering the observed development pattern under the case of a monopolist firm. Figure 6

illustrates representative results under a monopolist regime for a new to the world product

introduction. Because the monopolist firm is not forced to offer consumers a more attractive

product than its rival, it need only offer a product that satisfies consumers’ minimum

requirements. As such, the demand landscape which the monopolist faces is a rather different

one than that faced by a competitive firm leaving the monopolist freer to initially exploit

willingness to pay higher prices for higher performance among higher end consumers.

Significantly, however, when demand matures the monopolist ceases to innovate entirely, and the

sustained improvement observed under the competitive regime is absent. Indeed, for the case

shown in Figure 6 all innovative activity ends in period 50.

       The early phases of technology development are motivated by the drive to meet market

requirements. In contrast, after the onset of demand maturity, development is driven by

competition among firms for the same consumers. When there is only one firm in the market,

there is no contention for its consumers; in the absence of a rival product offering the consumers

will stay with the firm. Therefore when innovation ceases to expand the market and consumers’

willingness to pay for improvements declines, the monopolist ceases innovation activity and

consumers are faced with a static product. This qualitative pattern holds for both pricing regimes.
27


       Firms in competitive situations seek to differentiate themselves from rivals in order to

gain market advantage (Porter, 1980). This need for differentiation continues as a function of

rivalry, independently of the state of consumer satisfaction. The question still remains as to why

producers do not offer lower priced products at the functionality level at which consumer

willingness to pay is largely exhausted, rather than improving functionality beyond this point.

       Price reductions are attractive only to the extent that they attract new customers. After a

certain point, the returns to market expansion via greater price reduction are outweighed by the

foregone revenues from existing customers. As the product price falls below consumers’

willingness to pay, the consumers’ purchasing behavior is not changed. There is simply an

increase in consumer surplus. Certainly price competition is a powerful driver of firm behavior,

but to the extent that other avenues for attracting and retaining customers are available to firms,

price competition will be attenuated.

       The issue of satisfied demand raises the related question of why consumers would

purchase advanced products that are clearly beyond their needs rather than holding out for more

primitive products with lower prices. Ultimately, what the market dynamics generate is

consumer surplus in the form of ‘luxurious bargains’. As long as the magnitude of the

incremental quality improvements that derive from product development offset any associated

price change, there will be a net increase in consumer surplus and the luxury of increased

functionality will indeed be a bargain.

       Another issue, outside the structure of the model, is the prospect that consumers’

minimum functional requirements may rise with time. Such a dynamic would necessitate the
28


purchase of increasingly advanced products. Changes in minimum thresholds can result from

changing expectations or from changing objective requirements.11


        The sudden appearance of sub $1000 personal computers in 1997 presents a different sort

of complication (Ramstad, 1997) – the emergence of a new application domain, the Internet,

which (1) posed a lower performance requiremennt than the existing competitive threshold; and

(2) introduced a large number of new price sensitive consumers into the market (purchasers of

2nd computers and first time lower income buyers spurred by announcements of the importance to

their future of ‘getting wired’.


6. Discussion

        The model developed in this essay explores the interaction of innovation choices and

consumer demand during the course of a technology’s development. It shows that consideration

of demand offers an alternative to supply side explanations of the technology life cycle. Early in

a technology’s development, innovation is guided by a drive to meet market requirements. In the

later stages of development, after the market’s price and performance requirements are met,

innovation is driven by competition among suppliers faced with ‘technologically satisfied’

consumers.

        Under conventional (‘new to the world’) initial conditions, the demand based model

generates behaviors that are highly consistent with those documented in technology life cycle

studies (e.g., Utterback and Abernathy, 1978; DeBresson and Lampel, 1985). Both approaches

11
  The quintessential example of evolving minimum thresholds is found in the context of personal computers. The
minimum requirements of computers are continually ratcheted up as new software programs become more
demanding of the technical requirements of the machines. The introduction of a new standard platform such as
Windows95, which provides consumers with the motivation to demand more powerful hardware, demonstrates how
the presence of complementary goods can act to raise threshold requirements.
29


predict a product development focus and low market volumes in the early phases of

development, with a process development focus in the intermediate stage accompanied by high

market growth, and slower market growth in the final stage. While these patterns have been

generally explained in terms of production technologies and producer entry (see Klepper, 1997

for a review), the logic which drives the present results has a very different basis and is rooted in

the underlying heterogeneity of the market environment.

       The demand-based model developed here also offers insight into the development

patterns of products introduced under less conventional conditions which do not follow the

traditional technology life cycle. Furthermore, while previous models (Gort and Klepper, 1982;

Utterback and Abernathy, 1975; Abernathy, 1978; Klepper and Graddy, 1990) of the product life

cycle predict decreased innovation activity in later stages of the life cycle, the model developed

here suggests the possibility of high levels of innovative activity for mature product classes,

consistent with a number of empirical findings (Henderson, 1995; Christensen, 1992; Klepper,

1997). By introducing demand-based factors, the current model sheds new light on this

observed, but previously unexplained behavior in the product life cycle.

       While price trends similar to those predicted by the model for later stages of development

are suggested by production experience curves (Boston Consulting Group, 1972), experience

curve explanations do not substitute for the demand-based framework presented here but rather

complements it. The present argument differs from experience curves in that it is concerned with

an evolving product technology, whereas experience curve arguments focus on the perfection of

manufacturing techniques for a generally static product (Grant, 1995). As a result, experience

curve arguments do not speak to the relative intensity of product and process innovation.
30


       In addition to abstracting from possible learning curve effects on product cost, the model

also does not explore possible consumption or network externalities that might influence

purchase behavior (Arthur, 1989; David, 1985). To the extent that such externalities are present,

they would allow consumers to derive greater utility from a given product as the user base, the

number of consumers already purchasing, increases. This increase in utility would result in a

downward shift of individual consumer’s F0i. This lowering of consumers’ functional

requirements would, in turn, allow firms to satisfy consumers’ requirements earlier and with less

development effort, but should not affect the qualitative dynamics of the innovative process.

       The model also does not explore the effects of product line strategies on firms’

development decisions. While outside the scope of the current model, we can leverage our

understanding of the current baseline dynamics to shed some light on the expected dynamics of

product lines. The key point of differentiation between the single product setting and that of a

multi-product product line occurs when early consumers threaten to stop purchasing the product

because its price is rising due to improvements which they do not particularly value. At this

point, a firm might offer a ‘basic’ product to maintain its existing customer base and a higher end

‘advanced’ product, which it would actively improve, to capture new customers. The market

would thus be segmented according to functionality and price. However, competitive pressure

would force firms to improve their product in all market segments in order to maintain their share

within each segment. Thus, the basic dynamics characterized here should hold in the presence of

product line strategies.

       The central assumption underlying the result of “luxurious bargans” is that the potential

for technological progress remains unexhausted even after the population’s willingness to pay for

improvement is largely exhausted. While the potential of technology performance relative to
31


demand requirements can only be assessed on a case specific basis, the rising dominance of

electronic, computer, and information technology that has heralded the dawn of the ‘information

age’ suggests that the prevalence of such settings may be increasing (Kelly, 1997). It is no

coincidence that the price histories of Figures 1 and 2 are drawn from the realm of electronics.

Electronic product technologies have demonstrated a seeming inexhaustible potential for

improvement, both on the product performance side, with increases in speed, compactness, and

reliability, as well as on the production process side, with tremendous reductions in the cost of

obtaining these levels of performance. As such, they provide an ideal setting to study the

dynamics of technology development where exogenous limits to development are not a primary

constraint.

       Viewing the evolution of technology through a demand-based lens suggests that the early

evolution of technologies is guided by responding to the unsatisfied needs of the market. After

sufficient development however, firms face the intriguing possibility that these guiding needs

have largely been satisfied. The framework developed here suggests that product maturity may

be as much a function of satiated needs as it is of exhausted technologies. The dynamics

highlighted by the model suggest that price sensitivity to technological improvements can be a

strong signal of the state of demand satisfaction. Highlighting the role of demand heterogeneity,

adds to our understanding of the role of selection forces on the evolution of product technology.

While the exploration of path dependence has motivated a significant volume of work on

technology evolution, the role of the demand context in which firms operate has received less

attention. This bias in the literature has undermined our appreciation of the complexity of the

demand environment and its potential for enriching our understanding of technology evolution.
32


                                               References

Abernathy, William. 1978. The productivity dilemma. Baltimore: Johns Hopkins University
Press.

Arthur, W. Brian. 1989.
Bass, Frank M. 1980. The relationship between diffusion rates, experience curves and emand
elasticities for consumer durable technological innovations. Journal of Business, Part II, 53, 551-
567.

Boston Consulting Group. 1972. Perspectives on Experience. Bostong Consulting Group:
Boston, MA.

Brown, Lawrence A. 1981. Innovation Diffusion: a new perspective. New York: Metheun & Co.

Christensen, Clayton M. 1997. The Innovator’s Dillemma. Boston, MA: Harvard Business
School Press.

Christensen, Clayton. 1992. Exploring the limits of the technology S-cure. Production and
Operations Management. vol 1(4).

Clark, Kim B. 1985. The interaction of design hierarchies and market concepts in technological
evolution. Research Policy, v14,n5 p.235-251.

Cohen, Wesley and Klepper, Steven. 1996. Firm size and the nature of innovation within
industries: the case of process and product R&D. Review of Economics and Statistics, vol. 78(2),
232-43.

Cohen, Wesley M. Levinthal, Daniel A Innovation and Learning: The Two Faces of R&D.
Economic Journal. 99(397): 569-596. 1989

Cooper, Arnold and Schendel, Dan. 1976. Strategic responses to technological threats. Business
Horizons. vol 19, 61-69.

Cusumano, Michaell A. and Rosenbloom, Richard S. (1987) Technological pioneering and
competitive advantage: the birth of the VCR industry. California Management Revie. 1,4: 51-76.

David, Paul. 1985. Clio and the economics of QWERTY. American Economic Review. May

DeBresson, Chris and J. Townsend. 1981. Multivariate models for innovation - looking at the
Abernathy-Utterback model with other data. Omega. vol. 9(4), 429-36.

Dessauer, John H. 1971. My years with xerox; the billions nobody wanted. Garden City, NY:
Doubleday.
33


Dosi, Giovanni.1982. Technological paradigms and technological trajectories. Research Policy,
11, 147-62.

Economist, The. 1997. Magnetic storage: not Moore’s Law. July 12. page 72-73.

Foster, Richard. 1986. Innovation, the attacker’s advantage. Simon and Schuster: New York.

Gort, Michael and Steven Klepper. 1982. Time paths in the diffusion of product innovations.
Economic Journal. 92 p. 630-53.

Grant, Robert M. 1995. Contemporary Strategy Analysis. 2ed. Blackwell Business Press:
Cambridge. Mass.

Green, Paul E. and Wind, Yoram. 1973. Multiattribute Decisions in Marketing: A measurement
approach. The Dryden Press. Hinsdale, Ill.

Henderson, Rebecca. 1995. Of life cycles real and imaginary: The unexpectedly long old age of
optical lithography. Research Policy, 24, 631-643.

Hippel, Eric von. 1988. The Sources of Innovation. New York: Oxford University Press.

Jensen, R. 1982. Adoption and diffusion of an innovation of uncertain profitability. Journal of
Economic Theory. 27,, 182-193.

Kelly, Kevin. 1997. New rules for the New Economy. Wired. September.

Klein, Burton. 1977. Dynamic Economics. Cambridge, Mass: Harvard University Press.

Klepper, Steven. 1997. Industry life cycles. Industrial and Corporate Change, V6n1. p.144-81.

Kotler, Philip. 1991. Marketing management: analysis, planning, implementation and control.
Englewood Cliffs, NJ: Prentice Hall Inc.

McFadden, Daniel. 1986. The choice theory approach to marketing research. Marketing Science,
5 (Fall): 297-297.

Meyer, Robert. And Eric J. Johnson. 1995. Empirical generalizations in the modeling of
consumer choice. Marketing Science. Summer 1995, v14n3(Part 2), p. G180-G189

Monroe, Kent B. 1990. Pricing: Making profitable decisions. 2ed. McGraw-Hill. NY.

Mowery, David and Rosenberg, Nathan. 1979. The influence of market demand on innovation: a
critical review of some recent empirical studies. Research Policy, 8, 103-53.

Mueller, D.C., and John E. Tilton. 1969. R&D costs as a barrier to entry. Canadian Journal of
34


Economics. vol 2. p570-79.

Nelson, Richard and Winter, Sidney. 1982. An Evolutionary Theory of Economic Change.
Cambridge, MA: Harvard University Press.

Pearce, Michael (1994) “An answer to the age-old cry: where on Earth am I?” Wall Street
Journal, March 24, section A, p.12.

Porter, Michael E. 1980. Competitive Strategy. New York, NY: The Free Press.

Porter, Michael. 1983. The technological dimension of competitive strategy. Research on
Technological Innovation, Management and Policy, Vol 1. JAI Press Inc. p.1-33.

Prokesch, Steven E Battling bigness. Harvard Business Review. 71(6): 143. 1993

Ramstad, Evan. 1997. Low-cost PCs made gains over holiday. Wall Street Journal. Dec 31. p.a3.

Rogers, Everett M. 1995. Diffusion of innovations. 4th ed. New York : Free Press, c1995.

Sahal, Devendra. 1985. Technological guideposts and innovation avenues. Research Policy, 14,
61-82.

Schmookler, Jacob. 1966. Invention and Economic Growth. Cambridge, MA: Harvard University
Press.

Thirtle, Colin G. and Ruttan, Vernon W. 1987. The Role of Demand and Supply in the
Generation and Diffusion of Technical Change. Harwood Academic Publishers: London.

Tirole, Jean. 1988. The Theory of Industrial Organization. Cambridge, Mass: MIT Press.

Utterback, James and Abernathy, William. 1975. A dynamic model of process and product
innovation. Omega. vol 3(6) 639-56.

Utterback, James M. 1994. Mastering the Dynamics of Innovation. Boston, Mass.: Harvard
Business School Press.

Varian, Hal .1978. Microeconomic Analysis. W.W. Norton and Co. NY.
35


                                                       Figure 2: VCR Price History
                          1977
                          black and white
                   1400   60 min record

                                                   1980
                                                   timed programming
                   1200
                              1978
                              41 lbs                    1982
                              cb interference;          25 lbs; auto record;
                   1000       humidity light;           counter
                              jack for wired                 1983
   price (1982$)


                              remote; resolution             wireless remote; cable tv tuning
                              250 lines
                    800                                        1985 - varactor tuning (presets); 4/12 programming
                                                                  1987- 1 touch record; intr. hi fi models
                                                                    1988-editing features; 5.4/72 prg; on screen prg.
                    600                                                  1990-5.3/155 prg; 70 cable channels
                                                                                  1993-6.5/264 programming
                                                                                      ‘94-digital tuner standard; 8/365prg
                    400                                                                     ‘95-VCRplus; 4 heads
                                                                                                universal remote
                                                                                                                1996- menu driven,
                    200                                                                                          remote prog; 125 channels

                                                         1997-childproof; self setting clock; go-to search

                      0
                       1975              1980              1985                 1990                1995                2000
compiled from data on models featured in Consumer Reports.


                          Product Innovation

                                                                                            Process Innovation
 Rate of
 Innovation


                                                                                                  Time

                   Figure 3: Dynamics of Product and Process Innovation
36

                                                 Figure 4: New to the World Technology with Competition
                                                     (Markup 20%, Initial cost 4, Initial performance 2)

                     45                                                                                                               7
                     40
                                                                                                                                      6
                     35
                                                                                                                                      5
                     30
Performance


                     25                                                                                                               4


                                                                                                                                          Price
                                                                                                                                                  Performance
                     20                                                                                                               3           Price
                     15
                                                                                                                                      2
                     10
                                                                                                                                      1
                     5
                     0                                                                                                                0
                          1

                              6

                                  11

                                       16

                                            21

                                                  26

                                                        31

                                                             36

                                                                  41

                                                                       46

                                                                            51

                                                                                  56

                                                                                       61

                                                                                            66

                                                                                                 71

                                                                                                      76

                                                                                                           81

                                                                                                                 86

                                                                                                                       91

                                                                                                                             96
                                                                        Period


                                                  Figure 5: New to Market Technology with Competition
                                                   (Markup 20%, Initial cost 10, Initial performance 15)

                     50                                                                                                           12
                     45
                                                                                                                                  10
                     40
                     35
                                                                                                                                  8
   Performance


                     30

                                                                                                                                          Price
                                                                                                                                                  Performance
                     25                                                                                                           6
                                                                                                                                                  Price
                     20
                                                                                                                                  4
                     15
                     10
                                                                                                                                  2
                      5
                      0                                                                                                           0
                          1
                              6
                                  11

                                       16
                                            21

                                                  26
                                                        31
                                                             36

                                                                  41
                                                                       46

                                                                            51
                                                                                  56
                                                                                       61

                                                                                            66
                                                                                                 71

                                                                                                      76
                                                                                                           81
                                                                                                                86

                                                                                                                      91
                                                                                                                            96


                                                                        Period


                                                 Figure 6: New to World T echnology with no Competition
                                                    (M arkup 20%, Initial cost 4, Initial performance 2)

                     35                                                                                                           10
                                                                                                                                  9
                     30
                                                                                                                                  8
                     25                                                                                                           7
       Performance


                     20                                                                                                           6
                                                                                                                                          Price


                                                                                                                                                  Perform ance
                                                                                                                                  5
                     15                                                                                                                           Price
                                                                                                                                  4

                     10                                                                                                           3
                                                                                                                                  2
                      5
                                                                                                                                  1
                      0                                                                                                           0
                                  11

                                       16

                                            21

                                                   26

                                                        31

                                                             36

                                                                  41

                                                                       46

                                                                            51

                                                                                  56

                                                                                       61

                                                                                            66

                                                                                                 71

                                                                                                      76

                                                                                                           81

                                                                                                                86

                                                                                                                      91

                                                                                                                            96
                          1

                              6


                                                                        Pe riod

Mais conteúdo relacionado

Mais procurados

THE JAPANESE TRANSFORMER INDUSTRY A CASE STUDY OF ITS COMPETITIVENESS
THE JAPANESE TRANSFORMER INDUSTRY A CASE STUDY OF ITS COMPETITIVENESSTHE JAPANESE TRANSFORMER INDUSTRY A CASE STUDY OF ITS COMPETITIVENESS
THE JAPANESE TRANSFORMER INDUSTRY A CASE STUDY OF ITS COMPETITIVENESSijcsit
 
Environmental Factors Affecting Procurement Performance in County Government...
	Environmental Factors Affecting Procurement Performance in County Government...	Environmental Factors Affecting Procurement Performance in County Government...
Environmental Factors Affecting Procurement Performance in County Government...inventionjournals
 
Ec Bbl3 Palmade Jan 08 Presentation
Ec Bbl3 Palmade Jan 08 PresentationEc Bbl3 Palmade Jan 08 Presentation
Ec Bbl3 Palmade Jan 08 PresentationFNian
 
A Taxonomy Of Logistics Innovations
A Taxonomy Of Logistics InnovationsA Taxonomy Of Logistics Innovations
A Taxonomy Of Logistics Innovationsertekg
 
Market Structures and its Composition of Individual Firms
Market Structures and its Composition of Individual FirmsMarket Structures and its Composition of Individual Firms
Market Structures and its Composition of Individual FirmsAaron Showers
 
Factors affecting the use of Public Procurement and Disposal Act of 2005 in P...
Factors affecting the use of Public Procurement and Disposal Act of 2005 in P...Factors affecting the use of Public Procurement and Disposal Act of 2005 in P...
Factors affecting the use of Public Procurement and Disposal Act of 2005 in P...paperpublications3
 
Etop analysis on monster energy drink
Etop analysis on monster energy drinkEtop analysis on monster energy drink
Etop analysis on monster energy drinkRAVI SINGH
 
Technological factors affecting business
Technological factors affecting businessTechnological factors affecting business
Technological factors affecting businessSaiManoj65
 
Cefis marsili
Cefis marsiliCefis marsili
Cefis marsiliwolanita
 
A taxonomy of supply chain innovations
A taxonomy of supply chain innovationsA taxonomy of supply chain innovations
A taxonomy of supply chain innovationsertekg
 
Operation Management Lecture 2.pdf
Operation Management Lecture 2.pdfOperation Management Lecture 2.pdf
Operation Management Lecture 2.pdfeslamhamdy43
 
Marketing mix strategies using methods of 4 ps, 7ps, 4cs and indian cement se...
Marketing mix strategies using methods of 4 ps, 7ps, 4cs and indian cement se...Marketing mix strategies using methods of 4 ps, 7ps, 4cs and indian cement se...
Marketing mix strategies using methods of 4 ps, 7ps, 4cs and indian cement se...IAEME Publication
 
ey-pulse-of-the-industry-report
ey-pulse-of-the-industry-reportey-pulse-of-the-industry-report
ey-pulse-of-the-industry-reportIain Scott
 
IJERD (www.ijerd.com) International Journal of Engineering Research and Devel...
IJERD (www.ijerd.com) International Journal of Engineering Research and Devel...IJERD (www.ijerd.com) International Journal of Engineering Research and Devel...
IJERD (www.ijerd.com) International Journal of Engineering Research and Devel...IJERD Editor
 

Mais procurados (19)

THE JAPANESE TRANSFORMER INDUSTRY A CASE STUDY OF ITS COMPETITIVENESS
THE JAPANESE TRANSFORMER INDUSTRY A CASE STUDY OF ITS COMPETITIVENESSTHE JAPANESE TRANSFORMER INDUSTRY A CASE STUDY OF ITS COMPETITIVENESS
THE JAPANESE TRANSFORMER INDUSTRY A CASE STUDY OF ITS COMPETITIVENESS
 
Environmental Factors Affecting Procurement Performance in County Government...
	Environmental Factors Affecting Procurement Performance in County Government...	Environmental Factors Affecting Procurement Performance in County Government...
Environmental Factors Affecting Procurement Performance in County Government...
 
Ec Bbl3 Palmade Jan 08 Presentation
Ec Bbl3 Palmade Jan 08 PresentationEc Bbl3 Palmade Jan 08 Presentation
Ec Bbl3 Palmade Jan 08 Presentation
 
A Taxonomy Of Logistics Innovations
A Taxonomy Of Logistics InnovationsA Taxonomy Of Logistics Innovations
A Taxonomy Of Logistics Innovations
 
The context of strategic hrm
The context of strategic hrmThe context of strategic hrm
The context of strategic hrm
 
Market Structures and its Composition of Individual Firms
Market Structures and its Composition of Individual FirmsMarket Structures and its Composition of Individual Firms
Market Structures and its Composition of Individual Firms
 
Artigo toddy
Artigo toddyArtigo toddy
Artigo toddy
 
Factors affecting the use of Public Procurement and Disposal Act of 2005 in P...
Factors affecting the use of Public Procurement and Disposal Act of 2005 in P...Factors affecting the use of Public Procurement and Disposal Act of 2005 in P...
Factors affecting the use of Public Procurement and Disposal Act of 2005 in P...
 
Etop analysis on monster energy drink
Etop analysis on monster energy drinkEtop analysis on monster energy drink
Etop analysis on monster energy drink
 
Technological factors affecting business
Technological factors affecting businessTechnological factors affecting business
Technological factors affecting business
 
Eae 408
Eae 408Eae 408
Eae 408
 
Cefis marsili
Cefis marsiliCefis marsili
Cefis marsili
 
A taxonomy of supply chain innovations
A taxonomy of supply chain innovationsA taxonomy of supply chain innovations
A taxonomy of supply chain innovations
 
L2
L2L2
L2
 
Operation Management Lecture 2.pdf
Operation Management Lecture 2.pdfOperation Management Lecture 2.pdf
Operation Management Lecture 2.pdf
 
Made in China 2.0
Made in China 2.0Made in China 2.0
Made in China 2.0
 
Marketing mix strategies using methods of 4 ps, 7ps, 4cs and indian cement se...
Marketing mix strategies using methods of 4 ps, 7ps, 4cs and indian cement se...Marketing mix strategies using methods of 4 ps, 7ps, 4cs and indian cement se...
Marketing mix strategies using methods of 4 ps, 7ps, 4cs and indian cement se...
 
ey-pulse-of-the-industry-report
ey-pulse-of-the-industry-reportey-pulse-of-the-industry-report
ey-pulse-of-the-industry-report
 
IJERD (www.ijerd.com) International Journal of Engineering Research and Devel...
IJERD (www.ijerd.com) International Journal of Engineering Research and Devel...IJERD (www.ijerd.com) International Journal of Engineering Research and Devel...
IJERD (www.ijerd.com) International Journal of Engineering Research and Devel...
 

Semelhante a Heterogenity of demand

Technology Change, Creative Destruction, and Economic Feasibilty
Technology Change, Creative Destruction, and Economic FeasibiltyTechnology Change, Creative Destruction, and Economic Feasibilty
Technology Change, Creative Destruction, and Economic FeasibiltyJeffrey Funk
 
Creative destrution, Economic Feasibility, and Creative Destruction: The Case...
Creative destrution, Economic Feasibility, and Creative Destruction: The Case...Creative destrution, Economic Feasibility, and Creative Destruction: The Case...
Creative destrution, Economic Feasibility, and Creative Destruction: The Case...Jeffrey Funk
 
Trends in Advanced Manufacturing
Trends in Advanced ManufacturingTrends in Advanced Manufacturing
Trends in Advanced Manufacturingumesh chikhale
 
Angga efriansyah schilling
Angga efriansyah schillingAngga efriansyah schilling
Angga efriansyah schillinganggaefriansyah
 
Economics of Technology
Economics of Technology Economics of Technology
Economics of Technology OntarioEast
 
How and When do New Technologies Become Economically Feasible
How and When do New Technologies Become Economically FeasibleHow and When do New Technologies Become Economically Feasible
How and When do New Technologies Become Economically FeasibleJeffrey Funk
 
Exploring the use of signals in the venture emergence of new technology-based...
Exploring the use of signals in the venture emergence of new technology-based...Exploring the use of signals in the venture emergence of new technology-based...
Exploring the use of signals in the venture emergence of new technology-based...University of Stuttgart
 
Bill Wicksteed
Bill WicksteedBill Wicksteed
Bill Wicksteedgratsaniti
 
Innovation in manufacturing as an evolutionary complex system
Innovation in manufacturing as an evolutionary complex systemInnovation in manufacturing as an evolutionary complex system
Innovation in manufacturing as an evolutionary complex systemIan McCarthy
 
Conjoint analysis a perfect link between
Conjoint analysis  a perfect link betweenConjoint analysis  a perfect link between
Conjoint analysis a perfect link betweenprj_publication
 
Conjoint analysis a perfect link between
Conjoint analysis  a perfect link betweenConjoint analysis  a perfect link between
Conjoint analysis a perfect link betweenprj_publication
 
Horizon Scan: ICT and the Future of Retail
Horizon Scan: ICT and the Future of RetailHorizon Scan: ICT and the Future of Retail
Horizon Scan: ICT and the Future of RetailEricsson
 
Bus_transformation Session 1 ( LECTURE 1).pdf
Bus_transformation Session 1 ( LECTURE 1).pdfBus_transformation Session 1 ( LECTURE 1).pdf
Bus_transformation Session 1 ( LECTURE 1).pdfNellyELHassani
 
Market Transformation &amp; NYSERDA
Market Transformation &amp; NYSERDAMarket Transformation &amp; NYSERDA
Market Transformation &amp; NYSERDAMTColgrove
 
Current Trends in Product Development during COVID-19
Current Trends in Product Development during COVID-19Current Trends in Product Development during COVID-19
Current Trends in Product Development during COVID-19vivatechijri
 
DESIGN, DEVELOPMENT & IMPLEMENTATION OF ONTOLOGICAL KNOWLEDGE BASED SYSTEM FO...
DESIGN, DEVELOPMENT & IMPLEMENTATION OF ONTOLOGICAL KNOWLEDGE BASED SYSTEM FO...DESIGN, DEVELOPMENT & IMPLEMENTATION OF ONTOLOGICAL KNOWLEDGE BASED SYSTEM FO...
DESIGN, DEVELOPMENT & IMPLEMENTATION OF ONTOLOGICAL KNOWLEDGE BASED SYSTEM FO...IJDKP
 

Semelhante a Heterogenity of demand (20)

Technology Change, Creative Destruction, and Economic Feasibilty
Technology Change, Creative Destruction, and Economic FeasibiltyTechnology Change, Creative Destruction, and Economic Feasibilty
Technology Change, Creative Destruction, and Economic Feasibilty
 
Creative destrution, Economic Feasibility, and Creative Destruction: The Case...
Creative destrution, Economic Feasibility, and Creative Destruction: The Case...Creative destrution, Economic Feasibility, and Creative Destruction: The Case...
Creative destrution, Economic Feasibility, and Creative Destruction: The Case...
 
Trends in Advanced Manufacturing
Trends in Advanced ManufacturingTrends in Advanced Manufacturing
Trends in Advanced Manufacturing
 
Angga efriansyah schilling
Angga efriansyah schillingAngga efriansyah schilling
Angga efriansyah schilling
 
Management Strategic Part One
Management Strategic Part OneManagement Strategic Part One
Management Strategic Part One
 
Economics of Technology
Economics of Technology Economics of Technology
Economics of Technology
 
How and When do New Technologies Become Economically Feasible
How and When do New Technologies Become Economically FeasibleHow and When do New Technologies Become Economically Feasible
How and When do New Technologies Become Economically Feasible
 
Innovation and its Importance for Competitiveness in Mexico
Innovation and its Importance for Competitiveness in MexicoInnovation and its Importance for Competitiveness in Mexico
Innovation and its Importance for Competitiveness in Mexico
 
Exploring the use of signals in the venture emergence of new technology-based...
Exploring the use of signals in the venture emergence of new technology-based...Exploring the use of signals in the venture emergence of new technology-based...
Exploring the use of signals in the venture emergence of new technology-based...
 
Bill Wicksteed
Bill WicksteedBill Wicksteed
Bill Wicksteed
 
Innovation in the new ICT ecosystem
Innovation in the new ICT ecosystemInnovation in the new ICT ecosystem
Innovation in the new ICT ecosystem
 
Innovation in manufacturing as an evolutionary complex system
Innovation in manufacturing as an evolutionary complex systemInnovation in manufacturing as an evolutionary complex system
Innovation in manufacturing as an evolutionary complex system
 
Conjoint analysis a perfect link between
Conjoint analysis  a perfect link betweenConjoint analysis  a perfect link between
Conjoint analysis a perfect link between
 
Conjoint analysis a perfect link between
Conjoint analysis  a perfect link betweenConjoint analysis  a perfect link between
Conjoint analysis a perfect link between
 
Horizon Scan: ICT and the Future of Retail
Horizon Scan: ICT and the Future of RetailHorizon Scan: ICT and the Future of Retail
Horizon Scan: ICT and the Future of Retail
 
6. clark 1985
6. clark 19856. clark 1985
6. clark 1985
 
Bus_transformation Session 1 ( LECTURE 1).pdf
Bus_transformation Session 1 ( LECTURE 1).pdfBus_transformation Session 1 ( LECTURE 1).pdf
Bus_transformation Session 1 ( LECTURE 1).pdf
 
Market Transformation &amp; NYSERDA
Market Transformation &amp; NYSERDAMarket Transformation &amp; NYSERDA
Market Transformation &amp; NYSERDA
 
Current Trends in Product Development during COVID-19
Current Trends in Product Development during COVID-19Current Trends in Product Development during COVID-19
Current Trends in Product Development during COVID-19
 
DESIGN, DEVELOPMENT & IMPLEMENTATION OF ONTOLOGICAL KNOWLEDGE BASED SYSTEM FO...
DESIGN, DEVELOPMENT & IMPLEMENTATION OF ONTOLOGICAL KNOWLEDGE BASED SYSTEM FO...DESIGN, DEVELOPMENT & IMPLEMENTATION OF ONTOLOGICAL KNOWLEDGE BASED SYSTEM FO...
DESIGN, DEVELOPMENT & IMPLEMENTATION OF ONTOLOGICAL KNOWLEDGE BASED SYSTEM FO...
 

Heterogenity of demand

  • 1. Technology Evolution and Demand Heterogeneity: Implications for product and process innovation Ron Adner INSEAD Boulevard de Constance 77350 Fontainbleau Cedex, France adner@econ.insead.fr Daniel Levinthal University of Pennsylvania, The Wharton School 2000 Steinberg Dietrich Hall Philadelphia, PA 19104 levinthal@management.wharton.upenn.edu DRAFT – September 1999 We thank George Day, Connie Helfat, John Kimberly, Bruce Kogut, Hans Pennings, Christophe Van Den Bulte, and Sid Winter as well as seminar participants at the University of Pennsylvania, Insead, the University of Michigan, and London Business School. We thank the Hunstman Center for Emerging Technology at the University of Pennsylvania for funding.
  • 2. 2 Abstract While research on the evolution of new technologies has emphasized the “supply side” activities of firms, there is growing recognition that the external demand environment can exercise significant influence over these activities. This paper presents a demand-based view of technology evolution that is focused on the interaction between technology development and the demand environment in which the technology is ultimately evaluated. We develop a formal model that explicitly considers the influence of heterogeneity in market demand – the presence of consumers with different needs and requirements – on firms’ innovation choices. The model is analyzed using computer simulation. The model is used to examine the dynamics of product and process innovation (Utterback and Abernathy, 1975). The analysis reveals that demand heterogeneity offers an alternative to supply-side explanations of the technology life cycle. Further, by considering the possibility of technologically satisfied consumers, the model also suggests a rationale for a new stage in the technology life cycle characterized by increasing performance at a stable price. This stage has not yet been treated formally in the literature, but is increasingly evident in digital and information based technologies.
  • 3. 3 1. Introduction The challenge of understanding the dynamics of technological development has long been a concern of the management field. Two dominant approaches inform the discussion of technological change: one suggests that innovation is driven by the external requirements of the market (Schmookler, 1966), while the other views the activities and internal capabilities of firms as the primary drivers of innovation (Dosi, 1982). Taken in isolation, each approach highlights key aspects of technological development but, as many have argued, the greatest insight derives from their joint consideration (Mowery and Rosenberg, 1979). Despite this call for balance, by far the larger portion of work on technological change is concentrated on the ‘supply-side’ dynamics --- whether at the macro level of technological trajectories (Dosi, 1982; Sahal, 1985) or the path dependent nature of individual firm capabilities (Helfat, 1996). Relatively under explored in these discussions of innovation is the effect of the demand environment on the development and evolution of technology (though see Clark, 1985; von Hippel, 1988; Christensen, 1997 for important exceptions). Technical developments are a function of the opportunity structure that firms perceive. This opportunity structure, in turn, is a function of the firm’s current set of capabilities (Dosi, 1982; Neslon and Winter, 1982; Cohen and Levinthal, 1989), the inherent possibilities offered by the alternative technologies (Sahal, 1985), and the market context in which the firm operates (Christensen, 1997). We develop a demand-based view of technology evolution that is focused on the interaction between technology development and the demand environment in which the technology is ultimately evaluated. A critical element in our framework is the inherent diversity that underlies the notion of ‘market’ demand. The latent set of consumers may have widely
  • 4. 4 differing needs and requirements. We characterize consumers by two attributes: the minimum performance requirements that a product technology must satisfy in order for the consumer to be willing to consider purchasing a good, and the consumer’s willingness to pay for product performance. We examine the evolution of a technology whose development is locally constrained, and in turn path dependent, but globally unconstrained regarding the absolute, or asymptotic, limits to its progress. The model is used to examine the dynamics of product and process development throughout the technology life cycle. Currently, the pattern of product and process innovation is understood as the result of the emergence of dominant designs (Utterback and Abernathy, 1978; Anderson and Tushman, 1990) and of shifting appropriability regimes (Cohen and Klepper, 1996). In contrast, we suggest that this pattern may be an outcome of locally adaptive behavior of firms in a heterogeneous demand environment. In a heterogeneous demand environment, early technological development is motivated by the drive to meet market requirements. Depending on the initial functionality and cost of the technology, this may lead to an early emphasis on product technology to enhance the functionality of the technology in order to meet the demand requirements of users or on process technology to reduce the price to a level that corresponds to consumers’ willingness to pay. In later stages of development, when the technology has surpassed market requirements, technical developments are driven by the desires of competitive firms to maximize their profits in the face of ‘technologically satisfied’ consumers. This latter stage of development suggested by the model implies the existence of a new stage in the technology life cycle characterized by increasing performance at a relatively stable product price. This stage has not yet been treated in the literature, but is increasingly evident in
  • 5. 5 electronic based product technologies. As firms operating in these industries benefit from the biannual doubling of performance predicted by Moore’s Law (The Economist, 1997), their technology management challenge shifts from the focused pursuit of performance improvement to include the ways in which these improvements are valued and applied by their customers. In settings in which the rate of technological improvement outpaces the demand for this improvement, consumers’ marginal utility from performance increases plays a critical role in shaping firms’ pricing and development choices. Consider the price performance histories of videocassette recorders and personal computers shown in Figures 1 and 2. A striking similarity between them is the stability of product price in the later stages of product evolution, even as their objective performance continues to increase. While computing power more than quadrupled between 1992 and 1996, the average unit price for a personal computer remained stable at around $2000 throughout the period (Computer Intelligence Info Corp, 1996).1 Similarly, VCR prices remained relatively stable from 1990 to 1997, even as new features were introduced yearly (Consumer Reports, 1990-97). Thus, rather than price increasing to reflect a premium that suppliers can extract for the greater functionality delivered, or stable functionality at decreasing prices, we observe functionality increases at stable prices. Similar histories could be compiled for fax machines, modems, copiers, and numerous other products whose core technology are digital logic circuits. The remainder of the paper is structured as follows. We first explore existing approaches to the technology life cycle and the treatment of market demand in the literature on technology evolution. We then develop the conceptual framework of demand heterogeneity. In section 4,
  • 6. 6 the model is analyzed using a computer simulation. We conclude by examining the distinctive implications that derive from a view of technological development that is informed by this more detailed consideration of market demand. 2. Dynamics of Product and Product Innovation The technology life cycle describes the dynamics of product and process innovation and has long held a central place in the literature on technology management (Meuller and Tilton, 1969; Utterback and Abernathy, 1975; Clark, 1985; Utterback, 1994; Klepper, 1996). The pattern that has been widely described is illustrated in Figure 3. Porter (1983:22) provides a succinct summary of the dominant explanation for this behavior: Initially, . . . product design is fluid, and substantial product variety is present. Product innovation is the dominant mode of innovation and aims primarily at improving product performance. Successive product innovations ultimately yield a “dominant design” where the optimal product configuration is reached. Process innovation is initially minor in significance, and early production processes are characterized by small scale, flexibility, and high labor skill levels. As product design stabilizes, increasingly automated production methods are employed and process innovation to lower costs takes over as the dominant innovation mode. Ultimately, innovation of both types begins to slow down. The primary focus of the dominant design approach is on the supply side coordination of uncertainty reduction that allows for investment in specialized production equipment. While this approach recognizes that consumer requirements influence the establishment of a dominant design, it is silent on the role of demand on post-dominant design developments. Several of the assumptions underlying the dominant design explanation are problematic. First is the assumption of a clear ordering between product and process innovation which posits that firms will tend to ignore the production process and control of costs until the product design has been 1 This price has dropped significantly since 1997 with the introduction of $1000 desktop computers. The implication
  • 7. 7 fixed (DeBresson and Townsend, 1985). While design improvements are a primary driver of market acceptance, in many instances cost savings provide the critical motivation for technological substitution and are therefore an early focus of innovative effort. A second problem is the assumption of the depletion of product improvement opportunities. The generalizability of claims of diminishing technological opportunities, however, is refuted in several studies that closely examine this issue (e.g. Christensen, 1992; Henderson, 1995). An alternative explanation for the technology life cycle (Cohen and Klepper,) suggests that the shift in innovative focus from product to process development is driven by changes in the ability of innovating firms to appropriate returns on their investments in innovation. According to this perspective, the value of process innovation is proportional to the level of output produced by a given firm. Thus, as an industry matures and firms get bigger, firms have increasing incentives to pursue process innovations. In contrast, since returns to product innovations are related to the acquisition of new customers rather than the magnitude of the existing customer base, the relative return to product innovation declines over time. This scale-appropriability approach predicts the rise of process innovation without placing exogenous limits on opportunities for product innovation or interdependence between innovation regimes. However, it does not address the continued pursuit of product innovation that is exhibited in industries such as consumer electronics and computers, which are dominated by the large firms that are predicted to shy away from product innovation. Indeed, in reviewing the patent counts compiled by Gort and Klepper (1982) for over 46 product classes, Klepper himself states that “neither series reflects the decline over time in product innovation conjectured in the PLC [product life cycle]...” (1997: 167). of this change for the arguments presented here are discussed later in the paper.
  • 8. 8 Common to both the dominant design and the scale-appropriability approaches is a focus on the dynamics of supply without an explicit examination of the demand context in which the innovating firm operates. We develop a finer grained consideration of the demand context and how this can inform our understanding of the evolution of technology in general, and the technology life cycle in particular. 3. Heterogeneity and Markets Demand is not homogenous, rather it varies within a market comprised of individual consumers. This assertion is not novel. Indeed, it is present in any consideration of strategy that differentiates between niche segments and mainstream markets (Kotler, 1991; Porter, 1980). Consumers can be distinguished by their preference structures and the relative value they place on different product attributes. A key element in such a preference structure in the context of emerging technologies is the minimum performance threshold that a product must reach if it is to be of value to a given consumer. The focus in this analysis is heterogeneity in the minimum performance threshold among consumers and in consumers’ willingness to pay for products that meet this performance threshold. Thresholds The notion of heterogeneous thresholds is well established in a variety of literatures including consumer choice (McFadden, 1986; Green and Wind, 1973), the diffusion of innovation (Stoneman, 1987; Thirtle and Ruttan, 1987), and is embodied in the notion of reservation prices in microeconomic models (Varian, 1978). The basic notion common to these
  • 9. 9 applications is that the adoption of a technology or the purchase of a good is a discrete decision that is prompted by some threshold of “attractiveness” being surpassed. We define a consumer’s functionality threshold as the minimum objective performance (independent of price) that a given product must deliver in order for the consumer to consider it. Associated with this functionality threshold is a consumer’s net utility threshold which specifies the highest price that a consumer is willing to pay for a product that just satisfies his or her functionality requirements. The value of considering the two thresholds jointly, rather than combining them both into a single construct, is that it allows for an explicit consideration of technology improvements in both performance and price. A functionality threshold specifies the performance level below which a consumer will not accept a product, regardless of its price. A product that falls below a given consumer’s functionality threshold is, for that consumer, ‘junk’ and would not be accepted at any positive price. The same product, however, may well be acceptable to a consumer with a different functionality threshold. Functionality thresholds are determined, in part, by inherent task requirements and, in part, by context. Thus, a machinist drilling high precision parts cannot make use of a drill press with loose tolerances, no matter how low its selling price, because such a machine is not able to support the intended application. Alternatively, functionality requirements can be externally imposed, by the demands of downstream customers (e.g., producers of goods for the luxury market will need higher quality materials than those producing for the economy market) or by externally imposed regulations (e.g., electricity producers in California require cleaner generating stations than producers in North Dakota in order to be certified for operation).
  • 10. 10 Net utility thresholds capture the interaction of product performance and price. The net utility reflects the highest price a consumer is willing to pay for a product that just meets his or her requirements. Consumers with the same functionality threshold may have different net utility thresholds. Variation in willingness to pay may be driven by differences in budget constraints, but more importantly, particularly in the context of firms, by non-budgetary differences as well. Consumers may differ in the value they derive from the product for a number of reasons. Consumers may differ in their ability to exploit the product as a result of heterogeneity in internal resources and capabilities, or human capital. For instance, a skilled programmer may be able to derive more benefit from a given computer system than a less skilled one. Alternatively, differences in net utility thresholds may stem from the scale at which the buyer can apply the product. A firm that can apply the product toward the production of a good that it can then sell to a large downstream customer base would be willing to pay more for the product than a potential buyer with a smaller customer base. Finally, differences in willingness to pay may reflect variation in the availability and presence of a substitute product or service. A firm that has previously invested in a substitute good will benefit from the new product only to the extent that the product provides an improvement relative to the existing substitute; alternatively, a similar firm, not in possession of a substitute, will value the product on the basis of the absolute benefit it provides. Diminishing Returns While consumers have a minimum threshold for acceptable performance, there is no analogous boundary that specifies a maximum limit to the functionality that a consumer would be willing to accept. At the same time, it is reasonable to assume that there is diminishing
  • 11. 11 marginal utility to increases in functionality (Meyer and Johnson, 1995). Correspondingly, it is reasonable to assume that consumers show a positive, but decreasing, willingness to pay for improvements beyond their requirements. Thus, as consumer requirements are exceeded, their willingness to pay for improvement will become increasingly small to the point that firms will be unable to extract any meaningful premium for further improvement. However, even if consumers place little value on performance differences at sufficiently high absolute levels of functionality, they will still, all else being equal, choose the more advanced product. As a result, in a competitive context this responsiveness to functionality improvements forces firms to continue to enhance functionality even when such enhancements have little effect on consumers’ willingness to pay. Dynamics of Technology in Heterogeneous Markets The presence of different threshold levels for both functionality and net utility implies that consumers will vary in the degree to which a product technology at a given state is capable of satisfying their requirements. In turn, there will be variation in the type, and amount, of development that is required before the product becomes relevant to a given consumer. While models of the diffusion of innovation explicitly consider demand heterogeneity in explaining the differences in adoption rates and decisions, they tend to focus on the diffusion of a fixed innovation (Brown, 1981; Rogers 1994), and thus fail to consider the interaction between changes in the innovation that result from further development and consumers’ adoption decisions (Thirtle and Ruttan, 1989; Rogers, 1994; Reingenum, 1989).2 2 Those few models that do examine a changing innovation (Stoneman, 1987; Jensen, 1982) do so in the context of two period models which do not really speak to an evolutionary pattern, and address product changes of only one type (either price decrease or quality improvement) but not both simultaneously.
  • 12. 12 In mature markets, functionality and price are often confounded as consumers with high (low) functionality requirements generally buy more (less) expensive products. However, functionality and price need not be coupled. In markets for emerging technologies, potential consumers with a high willingness to pay for the product who have, at the same time, low functionality requirements, play an important role in both the development and adoption of an innovation. The military has been the quintessential example of this sort of early purchaser who is willing to cover development costs (Klein, 1977). Early in a technology’s development, high performance products may not be available, not because of the absence of willing purchasers, but because of still unsurmounted difficulties with the technology itself (e.g. consider the case of superconductors or solar energy). As such, early consumers may also be individuals who are characterized by their low-functionality requirements, or, their ability to derive unusual benefit from products of objectively low functionality. For instance, the early market for xerography was comprised of firms that made original master plates for offset printing. Because these firms were able to integrate the machine into a specialized activity, they were able to benefit from it at a time when other potential consumers found them unacceptably complex and unreliable. It was only after extensive further development that Xerox machines were able to satisfy the much higher functionality demands of the mainstream office market (Dessauer, 1971). In such cases, finding consumers who are willing to pay a high price for a relatively crude product may be critical to firms’ ability to engage in the development effort. In the context of emerging technologies, firms do not have the option of positioning themselves anywhere in the attribute-price space. This contrasts with the spirit of the classic segment-target-position (STP) marketing paradigm (Kotler, 1991), in which firms are told to first
  • 13. 13 segment the market, then examine the characteristics of consumers in these individual segments and then consider ways of tailoring the product to meet segment specific needs. Such an approach is appropriate when firms can manipulate product attributes at will, as in typical marketing examples of varying sweetness, saltiness, and tartness in a food product. When the manipulation involves challenging performance attributes which cannot be easily or quickly changed, such as reliability, size, and speed, this tailoring approach becomes less managerially tractable. In such situations, an approach which considers the interaction of consumer needs with both short and long term technological possibilities may be more informative. We explore the path-dependent development of technology, where path dependence results from both the “supply-side” constraints of technical change at any moment in time, and the history of feedback from the demand contexts in which the technology has been applied. 4. Model Structure The model structure has two basic components -- a characterization of consumers and consumer preferences which comprises the demand environment, and a mechanism by which products move through this market space. The market space is defined by a functionality dimension and a price dimension. In every period, firms make development decisions that affect the location of the product technology in this space; consumers, in turn, respond to the product offerings by either purchasing or not a unit quantity of the product. It is assumed that consumers engage in repeat purchasing behavior such that the entire population of consumers considers making a purchase in every period and that consumer
  • 14. 14 preferences are stable over time.3 Although preferences are stable, consumer purchase decisions vary as product performance and price vary over time. Consumers are assumed to be well informed4, in that they have accurate information about product performance each period. Firms are assumed to maximize current period profits.5 In the model, consumers are characterized by two basic factors. The first factor, Fi0 , specifies individual i’s minimum functionality requirement. The second factor, Ui0 , specifies consumer i’s minimum utility requirement, which determines the price, Pi0, that consumer i would be willing to pay for a minimally acceptable product. The population of consumers is specified by independently drawing values of Fi0 and Ui0 from a uniform distribution of sufficient range such that multiple innovation attempts are required to reach all consumers in the market. The functional benefit, Bij, that consumer i derives from product j is determined by the functionality offered by the product in excess of the consumer’s minimum functionality threshold: 3 This situation is characteristic of a market for durable goods with regular entry of consumers, such as the entry of some fixed number of new households into an economy every year. Alternatively, this type of repeat purchasing behavior could characterize a fixed population purchasing a non-durable good. The assumption of some sort of continuing purchase, whether through a renewing population of single good purchasers or a fixed population of repeat purchasers, is important to the model in that it is the potential of attracting existing as well as new customers that drives firms to innovate. As a result, a single purchase, fixed population model would not generate the behavior observed in the last phase of the current model because, in effect, such a model stipulates the ‘end of history’ after full penetration. A less extreme model, however, such as one in which goods face obsolescence after some number of periods would generate incentives for continued innovation on the part of firms as they compete for whichever consumers are active in the market in each period. 4 The current model makes the simplifying assumption that consumers are perfectly informed regarding product performance. Because the interest is in the qualitative pattern of behavior, consumer uncertainty would be a relevant factor if it were to affect firms’ development decisions in a systematic way. With no compelling reason to bias consumers’ assessment of product performance in either the positive or negative direction, the error in the assessment would have to be modeled as a symmetric distribution around the true value. Such an error, while affecting the absolute values associated with the observed outcomes, would not affect the qualitative nature of the results and would thus only be an unnecessary complication. 5 This can be thought of as price skimming behavior (Kotler, 1991) and is the same assumption made in Klepper (1996).
  • 15. 15 Fj – Foi + 1 if Fj – Foi ≥ 0 (1) Bi(Fj) = 0 otherwise The utility, Uij, that consumer i derives from product j is specified as a Cobb-Douglas utility function which trades off price and functionality as6: α 1-α (2) Ui(Fj , Pj) = Bi(Fj) (1/Pi) , where 0 < α < 1. Consumers will reject any product that does not meet both their functionality and utility requirements, such that Bi ≥ 1, and Uij ≥ Ui0. Thus, Pi0, is the highest price a consumer will be willing to pay for a product that just satisfies his or her functionality requirement, (i.e., Bij = 1) and is characterized as: (3) Pio = ( Uio )1/(α - 1) As discussed above, consumers value functionality improvements beyond their threshold requirements, ∂Uij/∂Bij > 0, but at a decreasing rate, ∂2Uij/∂Bij2 < 0. This property of diminishing returns to improvements holds for α values below 0.5. From the utility function we solve for Pij, the maximum price a consumer would be willing to pay for a product that meets his or her functionality requirements, as7: α/ Pij = Pio ( Bi(Fj) ) 1-α (4) 6 Note that [logU]/(1-α) = α/(1-α)logB – logP. Hence, our model is a monotonic transformation of the utility function of standard vertical differentiation models, where U=KB - P (Tirole, 1988). The current model differs from the standard model in that it introduces minimum thresholds for functionality and diminishing returns to functional improvements. 7 To find Pij we identify the product j such that Ui (Fj , Pj ) = Uo.
  • 16. 16 Given a choice among a set of acceptable products, a consumer will select the product that maximizes his or her utility. In every period, the entire population of consumers is exposed to the available products and each consumer selects his or her own best choice. Evolution of Product Technology Products are represented by their functional performance and by a cost of production. Following the characterization used in previous analytical models (Cohen and Klepper, 1996; Klepper, 1996), the effect of product and process innovations is reflected in changes in the product’s functional performance and cost. Product innovation enhances functionality by a fixed amount, Fprod, and leads to a fixed production cost increase, Cprod. Thus, a product innovation affects product j in the following manner: (5) Fj, t+1 = Fj,t + Fprod (6) Cj, t+1 = Cj,t + Cprod Process innovation leaves product functionality unchanged, while lowering the cost of production by a constant percentage, ∆c. Thus, a process innovation affects product j as follows: (7) Fj,t+1 = Fj,t (8) Cj, t+1 = Cj,t (1 - ∆c) The geometric decrease in cost due to process innovation has an empirical basis, as discussed in the learning curve literature (Boston Consulting Group, 1972). On the product innovation side, modeling product improvement as an arithmetic increase implies that the rate at which firms can pursue improvement is fixed --- firms can’t engage in time compression by executing two innovations in a single period.
  • 17. 17 In reality, the rate of innovative improvement is a function of the resources devoted to innovation, as well as technological possibilities. The S-curve literature (Foster, 1986) shows that, at later stages of development, increasingly larger resource investments are required to maintain a constant rate of performance improvement. Often, these investments are justified by the (expected) growth of the market in which the innovations are deployed. Because the purpose of this model is to examine the effects of demand heterogeneity on technology development, and not the technological limits to development themselves, the simplifying assumption of linear improvements is used. In every period firms can choose to pursue a mix of product and process innovation or to forgo innovative activity. The current state of the product is determined by the entire history of development activity and is therefore path dependent. Innovative outcomes are cumulative and therefore product cost and functionality cannot be manipulated instantaneously. In the model, firms choose innovative activity on the basis of local search. Firms are assumed to be able to predict consumer reaction to each incremental change to the product (i.e. development outcomes that will ensue within a single product or process innovation). However, firms do not make evaluations of potential consumer demand further away from their current product offering. We explore behavior that corresponds to a symmetric Nash Equilibrium of a series of one-shot games among firms with firms choosing innovation activity and price so as to maximize their own payoff assuming that their competitors’ behavior remains constant. Thus, firms are modeled as making profit-maximizing choices, but based only on next period’s payoff. Finally, we make the simplifying assumption that firms’ initial product offerings are the same. 8 8 In the current modeling effort, we are trying to understand the effect of consumer heterogeneity on the pattern of
  • 18. 18 The model is analyzed under two different product pricing regimes. The first pricing regime, ‘market pricing’, posits that firms are fully informed regarding consumers’ responses to pricing and that the firms can, given their product’s performance and production cost, determine the price point which will yield them the greatest profit. The second pricing regime, ‘heuristic pricing’, assumes that firms price at a fixed markup over costs. This simplified pricing structure, while clearly non-optimizing, is the most common form of pricing rule employed by businesses today (Monroe, 1990: 143). The model results, discussed below , are remarkable for their robustness given that these two pricing regimes represent polar cases of firm pricing decisions. While the choice of pricing regime affects the absolute values of the simulation results, the pattern of product and process innovation behaviors that is the focus of this analysis is consistent for both settings.9 To facilitate the exposition of the results, we present figures from the heuristic pricing case. 5. Analysis The model is analyzed using a computer simulation programmed in Pascal. The first procedures of the simulation initialize both the population of consumers and the initial characteristics of the product technologies. The population of consumers is composed of one hundred individuals, with each individual characterized by a minimum functionality requirement and a minimum utility level. The values of individual consumers’ Fi0 are uniformly distributed from 1 to 20 and Pi0 values range from 1 to 7. The range of consumers’ minimum functional product and process innovation for a single technological trajectory. A separate question is how different technological trajectories may compete with one another. 9 Because the market pricing regime allows for behavior that is more sensitive to immediate market opportunities (i.e., the particular preferences among consumers considering purchasing the product), the price patterns display greater variance than those observed under the heuristic pricing. The relative pattern of product and process innovation, however, holds true for both cases.
  • 19. 19 thresholds is such that approximately twenty product innovation attempts are necessary to span the distance between the minimum requirements of the least and most demanding customer in the market. Product technologies are introduced to the market at different points of functional development. We characterize two different settings of product entry. One is a “new to the world technology”. This is the typical setting examined in technology life cycle studies in which the initial product technology is functionally crude. With this initial setting, we observe the conventional technology life cycle in which product development is initially emphasized with a later shift in emphasis towards process innovation. The other setting is a “new to the market” technology. Product technologies can be introduced in forms that are, relative to market demands, functionally advanced. This situation is characteristic of product technologies that are being modified for application in a new task setting, after having been previously introduced to other application domains. In this setting, the initial emphasis is on process innovations in order to lower the costs of the product sufficiently to penetrate larger segments of the latent market. “New to the world” technologies are introduced at an initial performance level of 2 and an initial cost of 4. ‘New to the market’ technologies are introduced at an initial cost of 10 and an initial performance of 15. For all the runs shown, α = 0.2, Cprod = 0.2, Fprod = 1, ∆c = 0.05, and the heuristic markup is 20 percent. The firms’ choice set for allocating development effort between product and process innovation is: pure product; 75% product, 25% process; 50% product and process; 25% product, 75% process; and pure process. After this initialization, the following sequence of events is repeated for one hundred periods. First, each firm independently surveys its demand environment to determine the profit
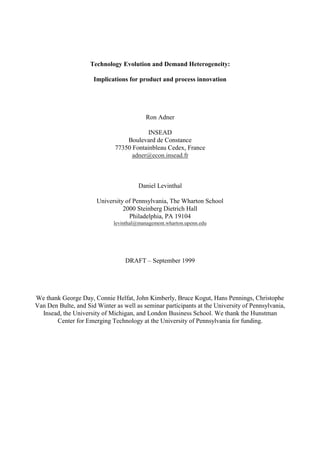
  • 20. 20 expectations for each possible development action. Second, the firms commit to the activity that will the yield highest expected profit. Third, every consumer then independently evaluates the available product offerings and decides whether any product satisifies their minimum functionality and utility requirements and, if so, what product provides them the maximum utility level. Finally, market outcomes are tallied and firms experience their actual market payoffs. To test for stochastic robustness, the simulation was run fifty times with different randomly drawn populations. While the duration of each of the distinct phases of technology evolution varied with each specific population draw, the relative rates of innovation followed a similar pattern. The absolute and relative attractiveness of product and process innovation is determined by the relationship among Fprod , Cprod, and ∆c. These variables affect the qualitative results in a straightforward manner (increasing Fprod or decreasing Cprod makes product innovation more attractive, while increasing ∆c makes process innovation relatively more attractive). The value of parameter α, affects the price trends observed when in the mature demand phase (as discussed below). The parameters which most dramatically affected the qualitative pattern of behavior are the initial cost and performance attributes of the product. These variables affect the early stage dynamics of how consumer thresholds are met. 6. Results Three canonical phases of development activity can be identified during the course of the simulation according to their relative rates of product and process innovation. In the first phase, which is termed attribute equalization, development actions are focused on achieving a balance between price and performance relative to the demands of the market. In this phase, one of the
  • 21. 21 two innovation types is the dominant development mode. In the second phase, termed market expansion, development activities serve to expand market penetration through reductions in price, and thus process innovations are dominant. Finally, in the third phase of demand maturity, innovation activity alternates between product and process innovation so that price remains relatively stable as product functionality increases. The phases are identified by observing inflections in product pricing behavior. The boundary between the first and second stages is defined as the point of greatest negative change in the price slope. The boundary between the second stage and third stage is defined as the point of greatest positive change in the price slope. A representative simulation run for new to the world introductions isshown in Figure 4. The figures graph the levels of functional performance and price over time. The pattern of product and process innovation is most readily observed by following changes in product price, since in the case of heuristic pricing price is coupled to production cost and thereby directly reflects firms’ innovation choices. Price increases signal a focus on product development, while price decreases signal a focus on process development. The first phase is characterized by an increase in product price, reflecting a focus on product development. The second phase in which price decreases, reflecting the dominance of process development begins at period 12 and ends at period 33. It is followed by the third phase is characterizedby relative price stability in the face of performance improvements. Figure 5 depicts the dynamics of technology development for products that are introduced to the market at a relatively advanced state of product development. In this case the attribute equalization stage focuses on price reduction that not only balances the relative value of price and performance to meet market preferences, but at the same time also results in increased market penetration. As a result, the stages of attribute equalization and market penetration are
  • 22. 22 effectively collapsed onto one stage. The third phase, demand maturity, begins in period 23 and has the same characteristics depicted for the case of ‘new to the world’ product technology. Examples of such ‘new to the market’ technologies are the commercialization of space technology, or the ‘consumerization’ of industrial goods. The development of home video cassette recorders, which built on a related product technology developed for industrial applications (Cusumano and Rosenbloom, 1987), falls into this category; indeed, the price- performance history presented for VCRs in Figure 2 is similar to the these simulations results. Attribute equalization Recall that for a consumer to purchase a product, the product must satisfy or exceed the consumer’s threshold functionality and the product’s price must be such that the net utility will satisfy or exceed the consumer’s threshold utility level. At the early stage of market penetration, the innovation effort that will yield the greatest increases in sales and profit is the one that will meet the threshold requirements of the greatest number of current non-buyers. This attribute, whether functionality or price, will be the focus of the initial innovative efforts. The attribute equalization phase of innovative activity ends when the relative values of market price and product functionality correspond to consumers’ preferences regarding the tradeoff between price and functionality. Development efforts face a tension between attracting new customers through engaging in product development and losing satisfied customers who are unwilling to pay the higher price charged for an improved product. In the conventional setting in which early innovative efforts focus on product innovation, this loss of established consumers due to price increases associated with product development is initially offset by the addition of new consumers with higher quality thresholds and greater revenue per product associated with
  • 23. 23 their purchases. After a certain point, however, efforts at market penetration via product enhancements become self-defeating as large numbers of former purchasers find the new price- performance combination unattractive. Clearly, the product’s initial cost and performance will determine the dimension on which initial innovative efforts are directed. In the traditional technology life cycle, this initial phase is dominated by product development activity. In the new to the world case, the model predicts an early focus on product development when the market penetration of the initial embodiment of a product is limited by its performance. Consider for example the market for early personal computers. The initial penetration of PCs was limited largely by the low functionality of the early PCs, rather than a prohibitive price. Early automobiles also suffered from an initial performance crisis: a car that breaks down every fifteen miles is no substitute for a horse, regardless of price. In contrast, for product technologies that are introduced to the market at a functionality level that is high compared to their affordability, price is the primary barrier to market penetration and, as a result, process development is the primary focus of early development efforts. Commercial applications of space technologies provide a clear example of such products. For example, the critical task for the commercialization of the Global Positioning System was not to improve the precision of the transmitter, but rather to lower the cost of the system from the thousands of dollars paid by government agencies to the $500 price range at which commercial introduction was feasible (Pearce, 1994).
  • 24. 24 Market penetration The next phase of innovative activity is dominated by process developments which serve to ‘fill in’ the market via price reductions. Some of these ‘fill in’ customers are former customers who stopped purchasing when the product became too expensive. Others are ‘bargain hunters’, consumers whose functionality thresholds are relatively high, but who are unwilling to pay the high early market price. Product price is reduced until the sales increases due to lower price no longer offset the revenue lost per product. Demand maturity Eventually firms’ development efforts yield a product whose functionality satisfies the core of the market to the point where performance improvements no longer attract a price premium from a significant part of the market. At this point, consumers’ diminished valuation of performance improvements would seem to reduce the appeal of product innovation. However, despite the reduction in willingness to pay for improvement on the part of consumers, firms, driven by competitive pressures, engage in significant levels of product innovation. Although the market as a whole is ‘satiated’ with the existing quality of product offerings, in that the prospect of incremental performance improvements will not significantly affect buying behavior with regards to either willingness to pay or number of active buyers, individual firms still perceive opportunities for market share gains through offering consumers better products. Because each firm evaluates its development options with regards to it’s rival’s existing rather than potential product, each firm believes that market share gains will ensue if it offers a better product than was previously available to consumers. In the context of the model, a superior
  • 25. 25 product is one of equivalent performance at a lower price or of higher performance at a similar price, than the products offered in the previous period. Consider the firm’s opportunities at the point at which consumer willingness to pay for performance improvement has diminished. If the firm chooses a to focus on product innovation, its production costs will increase. As it attempts to pass these increases onto the market, consumers at the low end will begin to drop out. As the market shrinks, the gains from higher product prices becomes insufficient to offset the loss of buyers and process innovation becomes the more attractive alternative. If the firm chooses to focus on process innovation and thereby reduces its production costs, competitive pressures will force the firm to pass some of these savings on to consumers. Successive process innovations lead to reductions in both the cost and the price of the product, eventually leading to pressure on profit levels and, in turn, increasing the attractiveness of product innovation. Thus, at the point at which consumer willingness to pay for performance improvements is relatively low, innovating firms face a tension between the loss of revenue due to decreases in unit volume associated with the higher prices that result from product development efforts and the loss of revenue due to the price decreases associated with process development. In the model, firms manage this tension by choosing to balance product and process innovation , keeping product price in a critical range that corresponds to the way that the aggregate market trades off the value of product performance and price. This tradeoff is determined by the value of the parameter α in consumers’ utility function. Lower (higher) values of α lead to a lower (higher) price level at maturity.10 10 Since α effectively represents consumers’ preference for the product relative to all other uses for money (i.e. all other goods and services in the economy), its empirical value is likely to be quite low.
  • 26. 26 At this stage, product development becomes a way of maintaining product price rather than satisfying the needs of new customers. As a result of competition in the face of mature demand product price remains relatively stable while product functionality experiences a steady rate of improvement. The competitive dynamics underlying this third stage can be further illustrated by considering the observed development pattern under the case of a monopolist firm. Figure 6 illustrates representative results under a monopolist regime for a new to the world product introduction. Because the monopolist firm is not forced to offer consumers a more attractive product than its rival, it need only offer a product that satisfies consumers’ minimum requirements. As such, the demand landscape which the monopolist faces is a rather different one than that faced by a competitive firm leaving the monopolist freer to initially exploit willingness to pay higher prices for higher performance among higher end consumers. Significantly, however, when demand matures the monopolist ceases to innovate entirely, and the sustained improvement observed under the competitive regime is absent. Indeed, for the case shown in Figure 6 all innovative activity ends in period 50. The early phases of technology development are motivated by the drive to meet market requirements. In contrast, after the onset of demand maturity, development is driven by competition among firms for the same consumers. When there is only one firm in the market, there is no contention for its consumers; in the absence of a rival product offering the consumers will stay with the firm. Therefore when innovation ceases to expand the market and consumers’ willingness to pay for improvements declines, the monopolist ceases innovation activity and consumers are faced with a static product. This qualitative pattern holds for both pricing regimes.
  • 27. 27 Firms in competitive situations seek to differentiate themselves from rivals in order to gain market advantage (Porter, 1980). This need for differentiation continues as a function of rivalry, independently of the state of consumer satisfaction. The question still remains as to why producers do not offer lower priced products at the functionality level at which consumer willingness to pay is largely exhausted, rather than improving functionality beyond this point. Price reductions are attractive only to the extent that they attract new customers. After a certain point, the returns to market expansion via greater price reduction are outweighed by the foregone revenues from existing customers. As the product price falls below consumers’ willingness to pay, the consumers’ purchasing behavior is not changed. There is simply an increase in consumer surplus. Certainly price competition is a powerful driver of firm behavior, but to the extent that other avenues for attracting and retaining customers are available to firms, price competition will be attenuated. The issue of satisfied demand raises the related question of why consumers would purchase advanced products that are clearly beyond their needs rather than holding out for more primitive products with lower prices. Ultimately, what the market dynamics generate is consumer surplus in the form of ‘luxurious bargains’. As long as the magnitude of the incremental quality improvements that derive from product development offset any associated price change, there will be a net increase in consumer surplus and the luxury of increased functionality will indeed be a bargain. Another issue, outside the structure of the model, is the prospect that consumers’ minimum functional requirements may rise with time. Such a dynamic would necessitate the
  • 28. 28 purchase of increasingly advanced products. Changes in minimum thresholds can result from changing expectations or from changing objective requirements.11 The sudden appearance of sub $1000 personal computers in 1997 presents a different sort of complication (Ramstad, 1997) – the emergence of a new application domain, the Internet, which (1) posed a lower performance requiremennt than the existing competitive threshold; and (2) introduced a large number of new price sensitive consumers into the market (purchasers of 2nd computers and first time lower income buyers spurred by announcements of the importance to their future of ‘getting wired’. 6. Discussion The model developed in this essay explores the interaction of innovation choices and consumer demand during the course of a technology’s development. It shows that consideration of demand offers an alternative to supply side explanations of the technology life cycle. Early in a technology’s development, innovation is guided by a drive to meet market requirements. In the later stages of development, after the market’s price and performance requirements are met, innovation is driven by competition among suppliers faced with ‘technologically satisfied’ consumers. Under conventional (‘new to the world’) initial conditions, the demand based model generates behaviors that are highly consistent with those documented in technology life cycle studies (e.g., Utterback and Abernathy, 1978; DeBresson and Lampel, 1985). Both approaches 11 The quintessential example of evolving minimum thresholds is found in the context of personal computers. The minimum requirements of computers are continually ratcheted up as new software programs become more demanding of the technical requirements of the machines. The introduction of a new standard platform such as Windows95, which provides consumers with the motivation to demand more powerful hardware, demonstrates how the presence of complementary goods can act to raise threshold requirements.
  • 29. 29 predict a product development focus and low market volumes in the early phases of development, with a process development focus in the intermediate stage accompanied by high market growth, and slower market growth in the final stage. While these patterns have been generally explained in terms of production technologies and producer entry (see Klepper, 1997 for a review), the logic which drives the present results has a very different basis and is rooted in the underlying heterogeneity of the market environment. The demand-based model developed here also offers insight into the development patterns of products introduced under less conventional conditions which do not follow the traditional technology life cycle. Furthermore, while previous models (Gort and Klepper, 1982; Utterback and Abernathy, 1975; Abernathy, 1978; Klepper and Graddy, 1990) of the product life cycle predict decreased innovation activity in later stages of the life cycle, the model developed here suggests the possibility of high levels of innovative activity for mature product classes, consistent with a number of empirical findings (Henderson, 1995; Christensen, 1992; Klepper, 1997). By introducing demand-based factors, the current model sheds new light on this observed, but previously unexplained behavior in the product life cycle. While price trends similar to those predicted by the model for later stages of development are suggested by production experience curves (Boston Consulting Group, 1972), experience curve explanations do not substitute for the demand-based framework presented here but rather complements it. The present argument differs from experience curves in that it is concerned with an evolving product technology, whereas experience curve arguments focus on the perfection of manufacturing techniques for a generally static product (Grant, 1995). As a result, experience curve arguments do not speak to the relative intensity of product and process innovation.
  • 30. 30 In addition to abstracting from possible learning curve effects on product cost, the model also does not explore possible consumption or network externalities that might influence purchase behavior (Arthur, 1989; David, 1985). To the extent that such externalities are present, they would allow consumers to derive greater utility from a given product as the user base, the number of consumers already purchasing, increases. This increase in utility would result in a downward shift of individual consumer’s F0i. This lowering of consumers’ functional requirements would, in turn, allow firms to satisfy consumers’ requirements earlier and with less development effort, but should not affect the qualitative dynamics of the innovative process. The model also does not explore the effects of product line strategies on firms’ development decisions. While outside the scope of the current model, we can leverage our understanding of the current baseline dynamics to shed some light on the expected dynamics of product lines. The key point of differentiation between the single product setting and that of a multi-product product line occurs when early consumers threaten to stop purchasing the product because its price is rising due to improvements which they do not particularly value. At this point, a firm might offer a ‘basic’ product to maintain its existing customer base and a higher end ‘advanced’ product, which it would actively improve, to capture new customers. The market would thus be segmented according to functionality and price. However, competitive pressure would force firms to improve their product in all market segments in order to maintain their share within each segment. Thus, the basic dynamics characterized here should hold in the presence of product line strategies. The central assumption underlying the result of “luxurious bargans” is that the potential for technological progress remains unexhausted even after the population’s willingness to pay for improvement is largely exhausted. While the potential of technology performance relative to
  • 31. 31 demand requirements can only be assessed on a case specific basis, the rising dominance of electronic, computer, and information technology that has heralded the dawn of the ‘information age’ suggests that the prevalence of such settings may be increasing (Kelly, 1997). It is no coincidence that the price histories of Figures 1 and 2 are drawn from the realm of electronics. Electronic product technologies have demonstrated a seeming inexhaustible potential for improvement, both on the product performance side, with increases in speed, compactness, and reliability, as well as on the production process side, with tremendous reductions in the cost of obtaining these levels of performance. As such, they provide an ideal setting to study the dynamics of technology development where exogenous limits to development are not a primary constraint. Viewing the evolution of technology through a demand-based lens suggests that the early evolution of technologies is guided by responding to the unsatisfied needs of the market. After sufficient development however, firms face the intriguing possibility that these guiding needs have largely been satisfied. The framework developed here suggests that product maturity may be as much a function of satiated needs as it is of exhausted technologies. The dynamics highlighted by the model suggest that price sensitivity to technological improvements can be a strong signal of the state of demand satisfaction. Highlighting the role of demand heterogeneity, adds to our understanding of the role of selection forces on the evolution of product technology. While the exploration of path dependence has motivated a significant volume of work on technology evolution, the role of the demand context in which firms operate has received less attention. This bias in the literature has undermined our appreciation of the complexity of the demand environment and its potential for enriching our understanding of technology evolution.
  • 32. 32 References Abernathy, William. 1978. The productivity dilemma. Baltimore: Johns Hopkins University Press. Arthur, W. Brian. 1989. Bass, Frank M. 1980. The relationship between diffusion rates, experience curves and emand elasticities for consumer durable technological innovations. Journal of Business, Part II, 53, 551- 567. Boston Consulting Group. 1972. Perspectives on Experience. Bostong Consulting Group: Boston, MA. Brown, Lawrence A. 1981. Innovation Diffusion: a new perspective. New York: Metheun & Co. Christensen, Clayton M. 1997. The Innovator’s Dillemma. Boston, MA: Harvard Business School Press. Christensen, Clayton. 1992. Exploring the limits of the technology S-cure. Production and Operations Management. vol 1(4). Clark, Kim B. 1985. The interaction of design hierarchies and market concepts in technological evolution. Research Policy, v14,n5 p.235-251. Cohen, Wesley and Klepper, Steven. 1996. Firm size and the nature of innovation within industries: the case of process and product R&D. Review of Economics and Statistics, vol. 78(2), 232-43. Cohen, Wesley M. Levinthal, Daniel A Innovation and Learning: The Two Faces of R&D. Economic Journal. 99(397): 569-596. 1989 Cooper, Arnold and Schendel, Dan. 1976. Strategic responses to technological threats. Business Horizons. vol 19, 61-69. Cusumano, Michaell A. and Rosenbloom, Richard S. (1987) Technological pioneering and competitive advantage: the birth of the VCR industry. California Management Revie. 1,4: 51-76. David, Paul. 1985. Clio and the economics of QWERTY. American Economic Review. May DeBresson, Chris and J. Townsend. 1981. Multivariate models for innovation - looking at the Abernathy-Utterback model with other data. Omega. vol. 9(4), 429-36. Dessauer, John H. 1971. My years with xerox; the billions nobody wanted. Garden City, NY: Doubleday.
  • 33. 33 Dosi, Giovanni.1982. Technological paradigms and technological trajectories. Research Policy, 11, 147-62. Economist, The. 1997. Magnetic storage: not Moore’s Law. July 12. page 72-73. Foster, Richard. 1986. Innovation, the attacker’s advantage. Simon and Schuster: New York. Gort, Michael and Steven Klepper. 1982. Time paths in the diffusion of product innovations. Economic Journal. 92 p. 630-53. Grant, Robert M. 1995. Contemporary Strategy Analysis. 2ed. Blackwell Business Press: Cambridge. Mass. Green, Paul E. and Wind, Yoram. 1973. Multiattribute Decisions in Marketing: A measurement approach. The Dryden Press. Hinsdale, Ill. Henderson, Rebecca. 1995. Of life cycles real and imaginary: The unexpectedly long old age of optical lithography. Research Policy, 24, 631-643. Hippel, Eric von. 1988. The Sources of Innovation. New York: Oxford University Press. Jensen, R. 1982. Adoption and diffusion of an innovation of uncertain profitability. Journal of Economic Theory. 27,, 182-193. Kelly, Kevin. 1997. New rules for the New Economy. Wired. September. Klein, Burton. 1977. Dynamic Economics. Cambridge, Mass: Harvard University Press. Klepper, Steven. 1997. Industry life cycles. Industrial and Corporate Change, V6n1. p.144-81. Kotler, Philip. 1991. Marketing management: analysis, planning, implementation and control. Englewood Cliffs, NJ: Prentice Hall Inc. McFadden, Daniel. 1986. The choice theory approach to marketing research. Marketing Science, 5 (Fall): 297-297. Meyer, Robert. And Eric J. Johnson. 1995. Empirical generalizations in the modeling of consumer choice. Marketing Science. Summer 1995, v14n3(Part 2), p. G180-G189 Monroe, Kent B. 1990. Pricing: Making profitable decisions. 2ed. McGraw-Hill. NY. Mowery, David and Rosenberg, Nathan. 1979. The influence of market demand on innovation: a critical review of some recent empirical studies. Research Policy, 8, 103-53. Mueller, D.C., and John E. Tilton. 1969. R&D costs as a barrier to entry. Canadian Journal of
  • 34. 34 Economics. vol 2. p570-79. Nelson, Richard and Winter, Sidney. 1982. An Evolutionary Theory of Economic Change. Cambridge, MA: Harvard University Press. Pearce, Michael (1994) “An answer to the age-old cry: where on Earth am I?” Wall Street Journal, March 24, section A, p.12. Porter, Michael E. 1980. Competitive Strategy. New York, NY: The Free Press. Porter, Michael. 1983. The technological dimension of competitive strategy. Research on Technological Innovation, Management and Policy, Vol 1. JAI Press Inc. p.1-33. Prokesch, Steven E Battling bigness. Harvard Business Review. 71(6): 143. 1993 Ramstad, Evan. 1997. Low-cost PCs made gains over holiday. Wall Street Journal. Dec 31. p.a3. Rogers, Everett M. 1995. Diffusion of innovations. 4th ed. New York : Free Press, c1995. Sahal, Devendra. 1985. Technological guideposts and innovation avenues. Research Policy, 14, 61-82. Schmookler, Jacob. 1966. Invention and Economic Growth. Cambridge, MA: Harvard University Press. Thirtle, Colin G. and Ruttan, Vernon W. 1987. The Role of Demand and Supply in the Generation and Diffusion of Technical Change. Harwood Academic Publishers: London. Tirole, Jean. 1988. The Theory of Industrial Organization. Cambridge, Mass: MIT Press. Utterback, James and Abernathy, William. 1975. A dynamic model of process and product innovation. Omega. vol 3(6) 639-56. Utterback, James M. 1994. Mastering the Dynamics of Innovation. Boston, Mass.: Harvard Business School Press. Varian, Hal .1978. Microeconomic Analysis. W.W. Norton and Co. NY.
  • 35. 35 Figure 2: VCR Price History 1977 black and white 1400 60 min record 1980 timed programming 1200 1978 41 lbs 1982 cb interference; 25 lbs; auto record; 1000 humidity light; counter jack for wired 1983 price (1982$) remote; resolution wireless remote; cable tv tuning 250 lines 800 1985 - varactor tuning (presets); 4/12 programming 1987- 1 touch record; intr. hi fi models 1988-editing features; 5.4/72 prg; on screen prg. 600 1990-5.3/155 prg; 70 cable channels 1993-6.5/264 programming ‘94-digital tuner standard; 8/365prg 400 ‘95-VCRplus; 4 heads universal remote 1996- menu driven, 200 remote prog; 125 channels 1997-childproof; self setting clock; go-to search 0 1975 1980 1985 1990 1995 2000 compiled from data on models featured in Consumer Reports. Product Innovation Process Innovation Rate of Innovation Time Figure 3: Dynamics of Product and Process Innovation
  • 36. 36 Figure 4: New to the World Technology with Competition (Markup 20%, Initial cost 4, Initial performance 2) 45 7 40 6 35 5 30 Performance 25 4 Price Performance 20 3 Price 15 2 10 1 5 0 0 1 6 11 16 21 26 31 36 41 46 51 56 61 66 71 76 81 86 91 96 Period Figure 5: New to Market Technology with Competition (Markup 20%, Initial cost 10, Initial performance 15) 50 12 45 10 40 35 8 Performance 30 Price Performance 25 6 Price 20 4 15 10 2 5 0 0 1 6 11 16 21 26 31 36 41 46 51 56 61 66 71 76 81 86 91 96 Period Figure 6: New to World T echnology with no Competition (M arkup 20%, Initial cost 4, Initial performance 2) 35 10 9 30 8 25 7 Performance 20 6 Price Perform ance 5 15 Price 4 10 3 2 5 1 0 0 11 16 21 26 31 36 41 46 51 56 61 66 71 76 81 86 91 96 1 6 Pe riod