
Recomendados
Mais conteúdo relacionado
Mais procurados
Mais procurados (18)
Destaque
Semelhante a Sr march2012 stats12041822817_2_3
Semelhante a Sr march2012 stats12041822817_2_3 (20)
Último
Último (20)
Sr march2012 stats12041822817_2_3
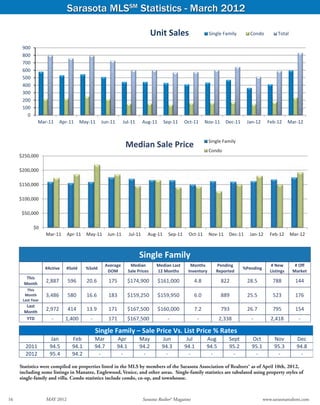
- 1. Sarasota MLSSM Statistics - March 2012 Unit Sales Single Family Condo Total 900 800 700 600 500 400 300 200 100 0 Mar‐11 Apr‐11 May‐11 Jun‐11 Jul‐11 Aug‐11 Sep‐11 Oct‐11 Nov‐11 Dec‐11 Jan‐12 Feb‐12 Mar‐12 Single Family Median Sale Price Condo $250,000 $200,000 $150,000 $100,000 $50,000 $0 Mar‐11 Apr‐11 May‐11 Jun‐11 Jul‐11 Aug‐11 Sep‐11 Oct‐11 Nov‐11 Dec‐11 Jan‐12 Feb‐12 Mar‐12 Single Family Average Median Median Last Months Pending # New # Off #Active #Sold %Sold %Pending DOM Sale Prices 12 Months Inventory Reported Listings Market This Month 2,887 596 20.6 175 $174,900 $161,000 4.8 822 28.5 788 144 This Month 3,486 580 16.6 183 $159,250 $159,950 6.0 889 25.5 523 176 Last Year Last Month 2,972 414 13.9 171 $167,500 $160,000 7.2 793 26.7 795 154 YTD ‐ 1,400 ‐ 171 $167,500 ‐ ‐ 2,338 ‐ 2,418 ‐ Single Family – Sale Price Vs. List Price % Rates Jan Feb Mar Apr May Jun Jul Aug Sept Oct Nov Dec 2011 94.5 94.1 94.7 94.1 94.2 94.3 94.1 94.5 95.2 95.1 95.3 94.8 2012 95.4 94.2 - - - - - - - - - - Statistics were compiled on properties listed in the MLS by members of the Sarasota Association of Realtors® as of April 10th, 2012, including some listings in Manatee, Englewood, Venice, and other areas. Single-family statistics are tabulated using property styles of single-family and villa. Condo statistics include condo, co-op, and townhouse. Source: Sarasota Association of Realtors® 16 MAY 2012 Sarasota Realtor® Magazine www.sarasotarealtors.com
- 2. Sarasota MLSSM Statistics - March 2012 Single Family Inventory Condo 4,000 3,000 2,000 1,000 0 Mar‐11 Apr‐11 May‐11 Jun‐11 Jul‐11 Aug‐11 Sep‐11 Oct‐11 Nov‐11 Dec‐11 Jan‐12 Feb‐12 Mar‐12 Single Family Pending Sales Condo 1000 900 800 700 600 500 400 300 200 100 0 Mar‐11 Apr‐11 May‐11 Jun‐11 Jul‐11 Aug‐11 Sep‐11 Oct‐11 Nov‐11 Dec‐11 Jan‐12 Feb‐12 Mar‐12 Condo Average Median Sale Median Last Months of Pending # New # Off #Active #Sold %Sold %Pending DOM Prices 12 Months Inventory Reported Listings Market This Month 1,576 235 14.9 187 $192,000 $162,500 6.7 369 23.4 372 145 This Month 2,015 220 10.9 195 $173,000 $160,000 9.2 319 15.8 280 212 Last Year Last Month 1,616 177 10.9 212 $150,000 $160,000 9.1 337 20.8 323 166 YTD ‐ 566 ‐ 202 $178,500 ‐ ‐ 946 ‐ 1,049 ‐ Condo – Sale Price Vs. List Price % Rates Jan Feb Mar Apr May Jun Jul Aug Sept Oct Nov Dec 2011 93.4 91.2 92.2 93.4 94.5 94.2 92.5 93.1 92.8 93.2 93.6 92.7 2012 93.1 93.5 - - - - - - - - - - Median sales price is the middle value, where half of the homes sold for more, and half sold for less. Listings sold were closed transactions during the month. Pending sales are sales where an offer has been accepted during the month, but the sale has not yet closed. Even though some pending sales never close, pending sales are an indicator of current buyer activity. DOM indicates the average number of days that sold properties were on the market before a contract was executed. Sarasota Association of Realtors® MLS www.sarasotarealtors.com Sarasota Realtor® Magazine MAY 2012 17