SlideShare uma empresa Scribd logo
1 de 4
Sarasota MLSSM Statistics - October 2012
                                                                                                                                           Single Family
                                                                                            Unit Sales
                                                                                                                                           Condo
       700
       600
       500
       400
       300
       200
       100
         0
                  Oct‐11         Nov‐11         Dec‐11      Jan‐12      Feb‐12      Mar‐12       Apr‐12      May‐12        Jun‐12     Jul‐12     Aug‐12       Sep‐12       Oct‐12


                                                                                                                            Single Family
                                                                          Median Sale Price
                                                                                                                            Condo
      $250,000

      $200,000

      $150,000

      $100,000

       $50,000

                 $0
                          Oct-11       Nov-11     Dec-11         Jan-12      Feb-12     Mar-12      Apr-12     May-12        Jun-12     Jul-12      Aug-12      Sep-12      Oct-12


                                                                                   Single Family 
                                                             Average          Median         Median Last        Months         Pending                          # New        # Off 
                      #Active          #Sold      %Sold                                                                                        %Pending 
                                                              DOM            Sale Prices     12 Months         Inventory       Reported                        Listings     Market 
         This 
        Month 
                      2,277            516        22.7           158      $176,000            $171,000              4.4             714            31.4          826          114 
         This 
        Month         2,924            412        14.1           190      $149,838            $156,000              7.1             585            20.0          701          186 
       Last Year 
         Last 
        Month 
                      2,205            500        22.7           158      $169,950            $170,000              4.4             634            28.8          659          145 
         YTD                ‐          5,379        ‐            167      $174,000                 ‐                 ‐             7,319            ‐           6,624          ‐ 
                                    
                                                         Single Family – Sale Price Vs. List Price % Rates
                           Jan           Feb             Mar         Apr          May          Jun           Jul           Aug        Sept          Oct         Nov          Dec 
        2011               94.5          94.1            94.7        94.1         94.2         94.3         94.1           94.5       95.2          95.1        95.3         94.8 
        2012               95.4          94.2            94.6        94.7         95.1         95.2         94.2           95.3       95.2          95.4         ‐            ‐ 
                       
      Statistics were compiled on properties listed in the MLS by members of the Sarasota Association of Realtors® as of Nov. 10th, 2012,
      including some listings in Manatee, Englewood, Venice, and other areas. Single-family statistics are tabulated using property styles of
      single-family and villa. Condo statistics include condo, co-op, and townhouse.

                                                                                                                          Source: Sarasota Association of Realtors®
16	                       DECEMBER 2012	                                              Sarasota Realtor® Magazine	                                           www.sarasotarealtors.com
Sarasota MLSSM Statistics - October 2012
                                                                                                                    Single Family
                                                                             Inventory                              Condo
3,500
3,000
2,500
2,000
1,500
1,000
  500
       0
            Oct‐11         Nov‐11 Dec‐11            Jan‐12     Feb‐12 Mar‐12 Apr‐12 May‐12 Jun‐12                          Jul‐12    Aug‐12     Sep‐12      Oct‐12


                                                                                                                     Single Family
                                                                          Pending Sales                              Condo
900
800
700
600
500
400
300
200
100
   0
           Oct‐11         Nov‐11     Dec‐11        Jan‐12    Feb‐12      Mar‐12     Apr‐12     May‐12       Jun‐12        Jul‐12     Aug‐12     Sep‐12    Oct‐12


                                                                                    Condo 
                                                       Average       Median Sale    Median Last      Months of           Pending                     # New       # Off 
                  #Active     #Sold        %Sold                                                                                      %Pending 
                                                        DOM            Prices       12 Months        Inventory           Reported                   Listings    Market 
   This 
  Month 
                  1,240        193         15.6         191          $160,000        $170,000              6.4             240          19.4         294           107 
   This 
  Month           1,601        165         10.3         222          $143,000        $161,000              9.7             187          11.7         307           221 
 Last Year 
   Last 
  Month 
                  1,255        148         11.8         191          $175,400        $167,250              8.5             210          16.7         257           122 
   YTD               ‐        2,154           ‐         193          $177,500             ‐                 ‐             2,638          ‐          2,667            ‐ 
                      
                                                     Condo – Sale Price Vs. List Price % Rates
                   Jan             Feb         Mar           Apr         May         Jun         Jul             Aug         Sept       Oct         Nov         Dec 
   2011            93.4            91.2        92.2          93.4        94.5        94.2       92.5             93.1        92.8       93.2        93.6        92.7 
   2012            93.1            93.5        94.2          94.3        93.8        93.8       94.6             94.1        94.2       94.4         ‐           ‐ 
               
Median sales price is the middle value, where half of the homes sold for more, and half sold for less. Listings sold were closed
transactions during the month. Pending sales are sales where an offer has been accepted during the month, but the sale has not yet
closed. Even though some pending sales never close, pending sales are an indicator of current buyer activity. DOM indicates the average
number of days that sold properties were on the market before a contract was executed.
                                                                                                                  Sarasota Association of Realtors® MLS
www.sarasotarealtors.com	                                                    Sarasota Realtor® Magazine	                                      DECEMBER 2012	              17
The Xtra Pages - Digital Version Only
                                                                                                       Single Family
                                               Months of Inventory                                     Condo
12

10

 8

 6

 4

 2

 0
      Oct‐11    Nov‐11    Dec‐11    Jan‐12    Feb‐12    Mar‐12    Apr‐12 May‐12       Jun‐12      Jul‐12 Aug‐12        Sep‐12     Oct‐12
                                                                                               Single Family
                                                       Days on Market
                                                                                               Condo
250

200

150

100

50

 0
       Oct‐11    Nov‐11    Dec‐11    Jan‐12    Feb‐12    Mar‐12    Apr‐12    May‐12    Jun‐12      Jul‐12     Aug‐12     Sep‐12     Oct‐12
                                                                                                            Single Family
                                                         Sales Volume                                       Condo
$200,000,000
$180,000,000
$160,000,000
$140,000,000
$120,000,000
$100,000,000
 $80,000,000
 $60,000,000
 $40,000,000
 $20,000,000
          $0
                  Oct‐11 Nov‐11 Dec‐11 Jan‐12 Feb‐12 Mar‐12 Apr‐12 May‐12 Jun‐12                        Jul‐12 Aug‐12 Sep‐12 Oct‐12

                                                       New Listings                     Single Family
                                                                                        Condo
900
800
700
600
500
400
300                                                                                   Sarasota Association of Realtors® MLS
200
100
  0
       Oct‐11   Nov‐11    Dec‐11    Jan‐12    Feb‐12    Mar‐12    Apr‐12    May‐12    Jun‐12     Jul‐12     Aug‐12     Sep‐12     Oct‐12
Third Quarter 2012 Report
                                      Single Family Sales ‐ By Quarter                                           REO         Short         Market
1400
1200
1000
 800
 600
 400
 200
   0
            2009‐Q4      2010‐Q1      2010‐Q2*     2010‐Q3      2010‐Q4      2011‐Q1     2011‐Q2     2011‐Q3      2011‐Q4      2012‐Q1       2012‐Q2
                 * Homebuyer Tax Credit In Effect

                                       Condo Sales ‐ By Quarter                                                  REO          Short         Market
700
600
500
400
300
200
100
  0
        2009‐Q4        2010‐Q1     2010‐Q2*        2010‐Q3      2010‐Q4      2011‐Q1     2011‐Q2     2011‐Q3      2011‐Q4      2012‐Q1       2012‐Q2
                      * Homebuyer Tax Credit In Effect

                         Single Family Median Sale Price                                              REO         Short          Market
 $300,000

 $250,000

 $200,000

 $150,000

 $100,000

  $50,000

       $0
               2009‐Q4      2010‐Q1      2010‐Q2      2010‐Q3      2010‐Q4     2011‐Q1     2011‐Q2     2011‐Q3     2011‐Q4       2012‐Q1      2012‐Q2


                                   Condo Median Sale Price                                            REO         Short         Market
 $300,000

 $250,000

 $200,000                                                                                    Source: Sarasota Association of Realtors®

 $150,000

 $100,000

  $50,000

       $0
               2009‐Q4      2010‐Q1      2010‐Q2      2010‐Q3     2010‐Q4      2011‐Q1    2011‐Q2     2011‐Q3      2011‐Q4      2012‐Q1      2012‐Q2

Mais conteúdo relacionado

Mais procurados (15)

Sales climb in February 2012; pending sales rise to 11-month high
Sales climb in February 2012; pending sales rise to 11-month highSales climb in February 2012; pending sales rise to 11-month high
Sales climb in February 2012; pending sales rise to 11-month high
 
May2011 stats 3 to8
May2011 stats 3 to8May2011 stats 3 to8
May2011 stats 3 to8
 
Sarasota Market Stats Feb 2011
Sarasota Market Stats Feb 2011Sarasota Market Stats Feb 2011
Sarasota Market Stats Feb 2011
 
May2011 stats
May2011 statsMay2011 stats
May2011 stats
 
July2010 stats
July2010 statsJuly2010 stats
July2010 stats
 
Sar stats july2011
Sar stats july2011Sar stats july2011
Sar stats july2011
 
August2010 stats
August2010 statsAugust2010 stats
August2010 stats
 
Market Watch October 2012
Market Watch October 2012Market Watch October 2012
Market Watch October 2012
 
Dec2010stats
Dec2010statsDec2010stats
Dec2010stats
 
Lake Elsinore EWDC 2-21-13
Lake Elsinore EWDC 2-21-13Lake Elsinore EWDC 2-21-13
Lake Elsinore EWDC 2-21-13
 
Austin Real Estate Update January '08
Austin Real Estate Update January '08Austin Real Estate Update January '08
Austin Real Estate Update January '08
 
October 2012 Vreb Statistics
October 2012 Vreb StatisticsOctober 2012 Vreb Statistics
October 2012 Vreb Statistics
 
January 2013 the woodlands tx home sales market report collection
January 2013 the woodlands tx home sales market report collectionJanuary 2013 the woodlands tx home sales market report collection
January 2013 the woodlands tx home sales market report collection
 
Phoenix Market report 1112
Phoenix Market report 1112Phoenix Market report 1112
Phoenix Market report 1112
 
Qr Codes in Magazine Advertising Q2 2012
Qr Codes in Magazine Advertising Q2 2012Qr Codes in Magazine Advertising Q2 2012
Qr Codes in Magazine Advertising Q2 2012
 

Semelhante a Sarasota Market Statistics - October

Northeast Georgia September 2012 Market Trend RE/port
Northeast Georgia September 2012 Market Trend RE/portNortheast Georgia September 2012 Market Trend RE/port
Northeast Georgia September 2012 Market Trend RE/portRE/MAX Regional Services
 
Chattanooga September 2012 Market Trend RE/port
Chattanooga September 2012 Market Trend RE/portChattanooga September 2012 Market Trend RE/port
Chattanooga September 2012 Market Trend RE/portRE/MAX Regional Services
 
Northern KY September 2012 Market Trend RE/port
Northern KY September 2012 Market Trend RE/portNorthern KY September 2012 Market Trend RE/port
Northern KY September 2012 Market Trend RE/portRE/MAX Regional Services
 
Metro Atlanta September 2012 Market Trend RE/port
Metro Atlanta September 2012 Market Trend RE/portMetro Atlanta September 2012 Market Trend RE/port
Metro Atlanta September 2012 Market Trend RE/portRE/MAX Regional Services
 
Augusta September 2012 Market Trend RE/port
Augusta September 2012 Market Trend RE/portAugusta September 2012 Market Trend RE/port
Augusta September 2012 Market Trend RE/portRE/MAX Regional Services
 
Lexington September 2012 Market Trend RE/port
Lexington September 2012 Market Trend RE/portLexington September 2012 Market Trend RE/port
Lexington September 2012 Market Trend RE/portRE/MAX Regional Services
 
Louisville September 2012 Market Trend RE/port
Louisville September 2012 Market Trend RE/portLouisville September 2012 Market Trend RE/port
Louisville September 2012 Market Trend RE/portRE/MAX Regional Services
 
Savannah September 2012 Market Trend RE/port
Savannah September 2012 Market Trend RE/portSavannah September 2012 Market Trend RE/port
Savannah September 2012 Market Trend RE/portRE/MAX Regional Services
 
Detroit September 2012 Market Trend RE/port
Detroit September 2012 Market Trend RE/portDetroit September 2012 Market Trend RE/port
Detroit September 2012 Market Trend RE/portRE/MAX Regional Services
 
September 2012 Market Overview
September 2012 Market OverviewSeptember 2012 Market Overview
September 2012 Market OverviewGary Smith
 
Market report 0912
Market report 0912Market report 0912
Market report 0912Len Nevin
 
Naea 12-12 (2)
Naea 12-12 (2)Naea 12-12 (2)
Naea 12-12 (2)Cate8364
 
Naea 12-12 (2)
Naea 12-12 (2)Naea 12-12 (2)
Naea 12-12 (2)Cate8364
 

Semelhante a Sarasota Market Statistics - October (20)

Sarasota Market stats for March
Sarasota Market stats for MarchSarasota Market stats for March
Sarasota Market stats for March
 
Sr march2012 stats12041822817_2_3
Sr march2012 stats12041822817_2_3Sr march2012 stats12041822817_2_3
Sr march2012 stats12041822817_2_3
 
SARStats-July2011
SARStats-July2011SARStats-July2011
SARStats-July2011
 
Srmag june2011 stats
Srmag june2011 statsSrmag june2011 stats
Srmag june2011 stats
 
Northeast Georgia September 2012 Market Trend RE/port
Northeast Georgia September 2012 Market Trend RE/portNortheast Georgia September 2012 Market Trend RE/port
Northeast Georgia September 2012 Market Trend RE/port
 
Chattanooga September 2012 Market Trend RE/port
Chattanooga September 2012 Market Trend RE/portChattanooga September 2012 Market Trend RE/port
Chattanooga September 2012 Market Trend RE/port
 
Northern KY September 2012 Market Trend RE/port
Northern KY September 2012 Market Trend RE/portNorthern KY September 2012 Market Trend RE/port
Northern KY September 2012 Market Trend RE/port
 
Metro Atlanta September 2012 Market Trend RE/port
Metro Atlanta September 2012 Market Trend RE/portMetro Atlanta September 2012 Market Trend RE/port
Metro Atlanta September 2012 Market Trend RE/port
 
Augusta September 2012 Market Trend RE/port
Augusta September 2012 Market Trend RE/portAugusta September 2012 Market Trend RE/port
Augusta September 2012 Market Trend RE/port
 
Lexington September 2012 Market Trend RE/port
Lexington September 2012 Market Trend RE/portLexington September 2012 Market Trend RE/port
Lexington September 2012 Market Trend RE/port
 
Memphis October 2012 Market Trend RE/port
Memphis October 2012 Market Trend RE/portMemphis October 2012 Market Trend RE/port
Memphis October 2012 Market Trend RE/port
 
Louisville September 2012 Market Trend RE/port
Louisville September 2012 Market Trend RE/portLouisville September 2012 Market Trend RE/port
Louisville September 2012 Market Trend RE/port
 
Savannah September 2012 Market Trend RE/port
Savannah September 2012 Market Trend RE/portSavannah September 2012 Market Trend RE/port
Savannah September 2012 Market Trend RE/port
 
Detroit September 2012 Market Trend RE/port
Detroit September 2012 Market Trend RE/portDetroit September 2012 Market Trend RE/port
Detroit September 2012 Market Trend RE/port
 
Phoenix AZ - Monthly Market Watch - September 2012
Phoenix AZ - Monthly Market Watch - September 2012Phoenix AZ - Monthly Market Watch - September 2012
Phoenix AZ - Monthly Market Watch - September 2012
 
September 2012 Market Overview
September 2012 Market OverviewSeptember 2012 Market Overview
September 2012 Market Overview
 
Market report 0912
Market report 0912Market report 0912
Market report 0912
 
Sarasota Market Stats May
Sarasota Market Stats MaySarasota Market Stats May
Sarasota Market Stats May
 
Naea 12-12 (2)
Naea 12-12 (2)Naea 12-12 (2)
Naea 12-12 (2)
 
Naea 12-12 (2)
Naea 12-12 (2)Naea 12-12 (2)
Naea 12-12 (2)
 

Mais de Sarasota Real Estate

Mais de Sarasota Real Estate (9)

Sarasota Market Statistics July 2013
Sarasota Market Statistics July 2013Sarasota Market Statistics July 2013
Sarasota Market Statistics July 2013
 
Sr mag june2013stats.3-8
Sr mag june2013stats.3-8Sr mag june2013stats.3-8
Sr mag june2013stats.3-8
 
Sar statsemail13052285100.2 7
Sar statsemail13052285100.2 7Sar statsemail13052285100.2 7
Sar statsemail13052285100.2 7
 
Srmag june2011 stats
Srmag june2011 statsSrmag june2011 stats
Srmag june2011 stats
 
SAR Monthly Statistics Released for June 2011
SAR Monthly Statistics Released for June 2011SAR Monthly Statistics Released for June 2011
SAR Monthly Statistics Released for June 2011
 
Buying a home in sarasota florida
Buying a home in sarasota floridaBuying a home in sarasota florida
Buying a home in sarasota florida
 
Home buyers guide
Home buyers guideHome buyers guide
Home buyers guide
 
Sarasota Market Stats - October 2010
Sarasota Market Stats - October 2010Sarasota Market Stats - October 2010
Sarasota Market Stats - October 2010
 
Online Sarasota Visitors Guide
Online Sarasota Visitors GuideOnline Sarasota Visitors Guide
Online Sarasota Visitors Guide
 

Último

2k Shot Call girls Karol Bagh Delhi 9205541914
2k Shot Call girls Karol Bagh Delhi 92055419142k Shot Call girls Karol Bagh Delhi 9205541914
2k Shot Call girls Karol Bagh Delhi 9205541914Delhi Call girls
 
9990771857 Call Girls in Dwarka Sector 7 Delhi (Call Girls) Delhi
9990771857 Call Girls in Dwarka Sector 7 Delhi (Call Girls) Delhi9990771857 Call Girls in Dwarka Sector 7 Delhi (Call Girls) Delhi
9990771857 Call Girls in Dwarka Sector 7 Delhi (Call Girls) Delhidelhimodel235
 
9990771857 Call Girls in Dwarka Sector 3 Delhi (Call Girls) Delhi
9990771857 Call Girls in Dwarka Sector 3 Delhi (Call Girls) Delhi9990771857 Call Girls in Dwarka Sector 3 Delhi (Call Girls) Delhi
9990771857 Call Girls in Dwarka Sector 3 Delhi (Call Girls) Delhidelhimodel235
 
SVN Live 5.6.24 Weekly Property Broadcast
SVN Live 5.6.24 Weekly Property BroadcastSVN Live 5.6.24 Weekly Property Broadcast
SVN Live 5.6.24 Weekly Property BroadcastSVN International Corp.
 
9990771857 Call Girls in Dwarka Sector 2 Delhi (Call Girls) Delhi
9990771857 Call Girls in Dwarka Sector 2 Delhi (Call Girls) Delhi9990771857 Call Girls in Dwarka Sector 2 Delhi (Call Girls) Delhi
9990771857 Call Girls in Dwarka Sector 2 Delhi (Call Girls) Delhidelhimodel235
 
M3M The Line Brochure - Premium Investment Opportunity for Commercial Ventures
M3M The Line Brochure - Premium Investment Opportunity for Commercial VenturesM3M The Line Brochure - Premium Investment Opportunity for Commercial Ventures
M3M The Line Brochure - Premium Investment Opportunity for Commercial Venturessheltercareglobal
 
9990771857 Call Girls in Dwarka Sector 137 Noida (Call Girls) Delhi
9990771857 Call Girls in Dwarka Sector 137 Noida (Call Girls) Delhi9990771857 Call Girls in Dwarka Sector 137 Noida (Call Girls) Delhi
9990771857 Call Girls in Dwarka Sector 137 Noida (Call Girls) Delhidelhimodel235
 
BPTP THE AMAARIO For The Royals Of Tomorrow in Sector 37D Gurgaon Dwarka Expr...
BPTP THE AMAARIO For The Royals Of Tomorrow in Sector 37D Gurgaon Dwarka Expr...BPTP THE AMAARIO For The Royals Of Tomorrow in Sector 37D Gurgaon Dwarka Expr...
BPTP THE AMAARIO For The Royals Of Tomorrow in Sector 37D Gurgaon Dwarka Expr...ApartmentWala1
 
Prestige Sancoale Goa Residneces Brochure.pdf
Prestige Sancoale Goa Residneces Brochure.pdfPrestige Sancoale Goa Residneces Brochure.pdf
Prestige Sancoale Goa Residneces Brochure.pdfkishor21012022
 
Shapoorji Pallonji Joyville Vista Pune | Spend Your Family Time Together
Shapoorji Pallonji Joyville Vista Pune | Spend Your Family Time TogetherShapoorji Pallonji Joyville Vista Pune | Spend Your Family Time Together
Shapoorji Pallonji Joyville Vista Pune | Spend Your Family Time Togetheraidasheikh47
 
Vanam At Purva Soukhyam Guduvanchery.pdf.pdf
Vanam At Purva Soukhyam Guduvanchery.pdf.pdfVanam At Purva Soukhyam Guduvanchery.pdf.pdf
Vanam At Purva Soukhyam Guduvanchery.pdf.pdfkratirudram
 
Parksville 96 Surrey Floor Plans May 2024
Parksville 96 Surrey Floor Plans May 2024Parksville 96 Surrey Floor Plans May 2024
Parksville 96 Surrey Floor Plans May 2024VickyAulakh1
 
Enjoy Night ≽ 8448380779 ≼ Call Girls In Huda City Centre (Gurgaon)
Enjoy Night ≽ 8448380779 ≼ Call Girls In Huda City Centre (Gurgaon)Enjoy Night ≽ 8448380779 ≼ Call Girls In Huda City Centre (Gurgaon)
Enjoy Night ≽ 8448380779 ≼ Call Girls In Huda City Centre (Gurgaon)Delhi Call girls
 
2k Shots ≽ 9205541914 ≼ Call Girls In Sainik Farm (Delhi)
2k Shots ≽ 9205541914 ≼ Call Girls In Sainik Farm (Delhi)2k Shots ≽ 9205541914 ≼ Call Girls In Sainik Farm (Delhi)
2k Shots ≽ 9205541914 ≼ Call Girls In Sainik Farm (Delhi)Delhi Call girls
 
Cheap Rate ✨➥9711108085▻✨Call Girls In Malviya Nagar(Delhi)
Cheap Rate ✨➥9711108085▻✨Call Girls In Malviya Nagar(Delhi)Cheap Rate ✨➥9711108085▻✨Call Girls In Malviya Nagar(Delhi)
Cheap Rate ✨➥9711108085▻✨Call Girls In Malviya Nagar(Delhi)delhi24hrs1
 
TENANT SCREENING REPORT SERVICES​ How Tenant Screening Reports Work
TENANT SCREENING REPORT SERVICES​ How Tenant Screening Reports WorkTENANT SCREENING REPORT SERVICES​ How Tenant Screening Reports Work
TENANT SCREENING REPORT SERVICES​ How Tenant Screening Reports WorkTurbo Tenant
 
M3M 129 E Brochure Noida Expressway, Sector 129, Noida
M3M 129 E Brochure Noida Expressway, Sector 129, NoidaM3M 129 E Brochure Noida Expressway, Sector 129, Noida
M3M 129 E Brochure Noida Expressway, Sector 129, Noidasarak0han45400
 
Bptp The Amaario Launch Luxury Project Sector 37D Gurgaon Dwarka Expressway...
Bptp The Amaario Launch  Luxury Project  Sector 37D Gurgaon Dwarka Expressway...Bptp The Amaario Launch  Luxury Project  Sector 37D Gurgaon Dwarka Expressway...
Bptp The Amaario Launch Luxury Project Sector 37D Gurgaon Dwarka Expressway...ApartmentWala1
 
Kohinoor Hinjewadi Phase 2 Pune E-Brochure.pdf
Kohinoor Hinjewadi Phase 2 Pune  E-Brochure.pdfKohinoor Hinjewadi Phase 2 Pune  E-Brochure.pdf
Kohinoor Hinjewadi Phase 2 Pune E-Brochure.pdfManishSaxena95
 
9990771857 Call Girls in Dwarka Sector 1 Delhi (Call Girls) Delhi
9990771857 Call Girls in Dwarka Sector 1 Delhi (Call Girls) Delhi9990771857 Call Girls in Dwarka Sector 1 Delhi (Call Girls) Delhi
9990771857 Call Girls in Dwarka Sector 1 Delhi (Call Girls) Delhidelhimodel235
 

Último (20)

2k Shot Call girls Karol Bagh Delhi 9205541914
2k Shot Call girls Karol Bagh Delhi 92055419142k Shot Call girls Karol Bagh Delhi 9205541914
2k Shot Call girls Karol Bagh Delhi 9205541914
 
9990771857 Call Girls in Dwarka Sector 7 Delhi (Call Girls) Delhi
9990771857 Call Girls in Dwarka Sector 7 Delhi (Call Girls) Delhi9990771857 Call Girls in Dwarka Sector 7 Delhi (Call Girls) Delhi
9990771857 Call Girls in Dwarka Sector 7 Delhi (Call Girls) Delhi
 
9990771857 Call Girls in Dwarka Sector 3 Delhi (Call Girls) Delhi
9990771857 Call Girls in Dwarka Sector 3 Delhi (Call Girls) Delhi9990771857 Call Girls in Dwarka Sector 3 Delhi (Call Girls) Delhi
9990771857 Call Girls in Dwarka Sector 3 Delhi (Call Girls) Delhi
 
SVN Live 5.6.24 Weekly Property Broadcast
SVN Live 5.6.24 Weekly Property BroadcastSVN Live 5.6.24 Weekly Property Broadcast
SVN Live 5.6.24 Weekly Property Broadcast
 
9990771857 Call Girls in Dwarka Sector 2 Delhi (Call Girls) Delhi
9990771857 Call Girls in Dwarka Sector 2 Delhi (Call Girls) Delhi9990771857 Call Girls in Dwarka Sector 2 Delhi (Call Girls) Delhi
9990771857 Call Girls in Dwarka Sector 2 Delhi (Call Girls) Delhi
 
M3M The Line Brochure - Premium Investment Opportunity for Commercial Ventures
M3M The Line Brochure - Premium Investment Opportunity for Commercial VenturesM3M The Line Brochure - Premium Investment Opportunity for Commercial Ventures
M3M The Line Brochure - Premium Investment Opportunity for Commercial Ventures
 
9990771857 Call Girls in Dwarka Sector 137 Noida (Call Girls) Delhi
9990771857 Call Girls in Dwarka Sector 137 Noida (Call Girls) Delhi9990771857 Call Girls in Dwarka Sector 137 Noida (Call Girls) Delhi
9990771857 Call Girls in Dwarka Sector 137 Noida (Call Girls) Delhi
 
BPTP THE AMAARIO For The Royals Of Tomorrow in Sector 37D Gurgaon Dwarka Expr...
BPTP THE AMAARIO For The Royals Of Tomorrow in Sector 37D Gurgaon Dwarka Expr...BPTP THE AMAARIO For The Royals Of Tomorrow in Sector 37D Gurgaon Dwarka Expr...
BPTP THE AMAARIO For The Royals Of Tomorrow in Sector 37D Gurgaon Dwarka Expr...
 
Prestige Sancoale Goa Residneces Brochure.pdf
Prestige Sancoale Goa Residneces Brochure.pdfPrestige Sancoale Goa Residneces Brochure.pdf
Prestige Sancoale Goa Residneces Brochure.pdf
 
Shapoorji Pallonji Joyville Vista Pune | Spend Your Family Time Together
Shapoorji Pallonji Joyville Vista Pune | Spend Your Family Time TogetherShapoorji Pallonji Joyville Vista Pune | Spend Your Family Time Together
Shapoorji Pallonji Joyville Vista Pune | Spend Your Family Time Together
 
Vanam At Purva Soukhyam Guduvanchery.pdf.pdf
Vanam At Purva Soukhyam Guduvanchery.pdf.pdfVanam At Purva Soukhyam Guduvanchery.pdf.pdf
Vanam At Purva Soukhyam Guduvanchery.pdf.pdf
 
Parksville 96 Surrey Floor Plans May 2024
Parksville 96 Surrey Floor Plans May 2024Parksville 96 Surrey Floor Plans May 2024
Parksville 96 Surrey Floor Plans May 2024
 
Enjoy Night ≽ 8448380779 ≼ Call Girls In Huda City Centre (Gurgaon)
Enjoy Night ≽ 8448380779 ≼ Call Girls In Huda City Centre (Gurgaon)Enjoy Night ≽ 8448380779 ≼ Call Girls In Huda City Centre (Gurgaon)
Enjoy Night ≽ 8448380779 ≼ Call Girls In Huda City Centre (Gurgaon)
 
2k Shots ≽ 9205541914 ≼ Call Girls In Sainik Farm (Delhi)
2k Shots ≽ 9205541914 ≼ Call Girls In Sainik Farm (Delhi)2k Shots ≽ 9205541914 ≼ Call Girls In Sainik Farm (Delhi)
2k Shots ≽ 9205541914 ≼ Call Girls In Sainik Farm (Delhi)
 
Cheap Rate ✨➥9711108085▻✨Call Girls In Malviya Nagar(Delhi)
Cheap Rate ✨➥9711108085▻✨Call Girls In Malviya Nagar(Delhi)Cheap Rate ✨➥9711108085▻✨Call Girls In Malviya Nagar(Delhi)
Cheap Rate ✨➥9711108085▻✨Call Girls In Malviya Nagar(Delhi)
 
TENANT SCREENING REPORT SERVICES​ How Tenant Screening Reports Work
TENANT SCREENING REPORT SERVICES​ How Tenant Screening Reports WorkTENANT SCREENING REPORT SERVICES​ How Tenant Screening Reports Work
TENANT SCREENING REPORT SERVICES​ How Tenant Screening Reports Work
 
M3M 129 E Brochure Noida Expressway, Sector 129, Noida
M3M 129 E Brochure Noida Expressway, Sector 129, NoidaM3M 129 E Brochure Noida Expressway, Sector 129, Noida
M3M 129 E Brochure Noida Expressway, Sector 129, Noida
 
Bptp The Amaario Launch Luxury Project Sector 37D Gurgaon Dwarka Expressway...
Bptp The Amaario Launch  Luxury Project  Sector 37D Gurgaon Dwarka Expressway...Bptp The Amaario Launch  Luxury Project  Sector 37D Gurgaon Dwarka Expressway...
Bptp The Amaario Launch Luxury Project Sector 37D Gurgaon Dwarka Expressway...
 
Kohinoor Hinjewadi Phase 2 Pune E-Brochure.pdf
Kohinoor Hinjewadi Phase 2 Pune  E-Brochure.pdfKohinoor Hinjewadi Phase 2 Pune  E-Brochure.pdf
Kohinoor Hinjewadi Phase 2 Pune E-Brochure.pdf
 
9990771857 Call Girls in Dwarka Sector 1 Delhi (Call Girls) Delhi
9990771857 Call Girls in Dwarka Sector 1 Delhi (Call Girls) Delhi9990771857 Call Girls in Dwarka Sector 1 Delhi (Call Girls) Delhi
9990771857 Call Girls in Dwarka Sector 1 Delhi (Call Girls) Delhi
 

Sarasota Market Statistics - October

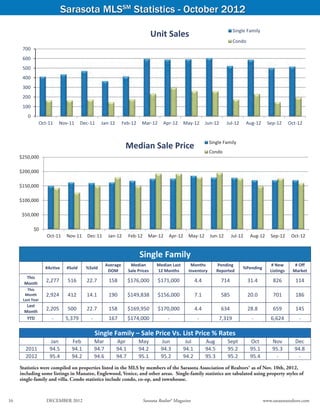
  • 1. Sarasota MLSSM Statistics - October 2012 Single Family Unit Sales Condo 700 600 500 400 300 200 100 0 Oct‐11 Nov‐11 Dec‐11 Jan‐12 Feb‐12 Mar‐12 Apr‐12 May‐12 Jun‐12 Jul‐12 Aug‐12 Sep‐12 Oct‐12 Single Family Median Sale Price Condo $250,000 $200,000 $150,000 $100,000 $50,000 $0 Oct-11 Nov-11 Dec-11 Jan-12 Feb-12 Mar-12 Apr-12 May-12 Jun-12 Jul-12 Aug-12 Sep-12 Oct-12 Single Family    Average Median  Median Last  Months  Pending  # New  # Off  #Active  #Sold  %Sold  %Pending  DOM  Sale Prices  12 Months  Inventory  Reported  Listings  Market  This  Month  2,277  516  22.7  158  $176,000  $171,000  4.4  714  31.4  826  114  This  Month  2,924  412  14.1  190  $149,838  $156,000  7.1  585  20.0  701  186  Last Year  Last  Month  2,205  500  22.7  158  $169,950  $170,000  4.4  634  28.8  659  145  YTD  ‐  5,379 ‐  167  $174,000  ‐  ‐  7,319  ‐  6,624  ‐      Single Family – Sale Price Vs. List Price % Rates   Jan  Feb  Mar  Apr  May  Jun  Jul  Aug  Sept  Oct  Nov  Dec  2011  94.5  94.1  94.7  94.1  94.2  94.3  94.1  94.5  95.2  95.1  95.3  94.8  2012  95.4  94.2  94.6  94.7  95.1  95.2  94.2  95.3  95.2  95.4  ‐  ‐    Statistics were compiled on properties listed in the MLS by members of the Sarasota Association of Realtors® as of Nov. 10th, 2012, including some listings in Manatee, Englewood, Venice, and other areas. Single-family statistics are tabulated using property styles of single-family and villa. Condo statistics include condo, co-op, and townhouse. Source: Sarasota Association of Realtors® 16 DECEMBER 2012 Sarasota Realtor® Magazine www.sarasotarealtors.com
  • 2. Sarasota MLSSM Statistics - October 2012 Single Family Inventory Condo 3,500 3,000 2,500 2,000 1,500 1,000 500 0 Oct‐11 Nov‐11 Dec‐11 Jan‐12 Feb‐12 Mar‐12 Apr‐12 May‐12 Jun‐12 Jul‐12 Aug‐12 Sep‐12 Oct‐12 Single Family Pending Sales Condo 900 800 700 600 500 400 300 200 100 0 Oct‐11 Nov‐11 Dec‐11 Jan‐12 Feb‐12 Mar‐12 Apr‐12 May‐12 Jun‐12 Jul‐12 Aug‐12 Sep‐12 Oct‐12 Condo    Average  Median Sale  Median Last  Months of Pending  # New  # Off  #Active  #Sold  %Sold  %Pending  DOM  Prices  12 Months  Inventory  Reported  Listings  Market  This  Month  1,240  193  15.6  191  $160,000  $170,000  6.4  240  19.4  294  107  This  Month  1,601  165  10.3  222  $143,000  $161,000  9.7  187  11.7  307  221  Last Year  Last  Month  1,255  148  11.8  191  $175,400  $167,250  8.5  210  16.7  257  122  YTD  ‐  2,154  ‐  193  $177,500  ‐  ‐  2,638  ‐  2,667  ‐    Condo – Sale Price Vs. List Price % Rates   Jan  Feb  Mar  Apr  May  Jun  Jul  Aug  Sept  Oct  Nov  Dec  2011  93.4  91.2  92.2  93.4  94.5  94.2  92.5  93.1  92.8  93.2  93.6  92.7  2012  93.1  93.5  94.2  94.3  93.8  93.8  94.6  94.1  94.2  94.4  ‐  ‐    Median sales price is the middle value, where half of the homes sold for more, and half sold for less. Listings sold were closed transactions during the month. Pending sales are sales where an offer has been accepted during the month, but the sale has not yet closed. Even though some pending sales never close, pending sales are an indicator of current buyer activity. DOM indicates the average number of days that sold properties were on the market before a contract was executed. Sarasota Association of Realtors® MLS www.sarasotarealtors.com Sarasota Realtor® Magazine DECEMBER 2012 17
  • 3. The Xtra Pages - Digital Version Only Single Family Months of Inventory Condo 12 10 8 6 4 2 0 Oct‐11 Nov‐11 Dec‐11 Jan‐12 Feb‐12 Mar‐12 Apr‐12 May‐12 Jun‐12 Jul‐12 Aug‐12 Sep‐12 Oct‐12 Single Family Days on Market Condo 250 200 150 100 50 0 Oct‐11 Nov‐11 Dec‐11 Jan‐12 Feb‐12 Mar‐12 Apr‐12 May‐12 Jun‐12 Jul‐12 Aug‐12 Sep‐12 Oct‐12 Single Family Sales Volume Condo $200,000,000 $180,000,000 $160,000,000 $140,000,000 $120,000,000 $100,000,000 $80,000,000 $60,000,000 $40,000,000 $20,000,000 $0 Oct‐11 Nov‐11 Dec‐11 Jan‐12 Feb‐12 Mar‐12 Apr‐12 May‐12 Jun‐12 Jul‐12 Aug‐12 Sep‐12 Oct‐12 New Listings Single Family Condo 900 800 700 600 500 400 300 Sarasota Association of Realtors® MLS 200 100 0 Oct‐11 Nov‐11 Dec‐11 Jan‐12 Feb‐12 Mar‐12 Apr‐12 May‐12 Jun‐12 Jul‐12 Aug‐12 Sep‐12 Oct‐12
  • 4. Third Quarter 2012 Report Single Family Sales ‐ By Quarter REO Short Market 1400 1200 1000 800 600 400 200 0 2009‐Q4 2010‐Q1 2010‐Q2* 2010‐Q3 2010‐Q4 2011‐Q1 2011‐Q2 2011‐Q3 2011‐Q4 2012‐Q1 2012‐Q2 * Homebuyer Tax Credit In Effect Condo Sales ‐ By Quarter REO Short Market 700 600 500 400 300 200 100 0 2009‐Q4 2010‐Q1 2010‐Q2* 2010‐Q3 2010‐Q4 2011‐Q1 2011‐Q2 2011‐Q3 2011‐Q4 2012‐Q1 2012‐Q2 * Homebuyer Tax Credit In Effect Single Family Median Sale Price REO Short Market $300,000 $250,000 $200,000 $150,000 $100,000 $50,000 $0 2009‐Q4 2010‐Q1 2010‐Q2 2010‐Q3 2010‐Q4 2011‐Q1 2011‐Q2 2011‐Q3 2011‐Q4 2012‐Q1 2012‐Q2 Condo Median Sale Price REO Short Market $300,000 $250,000 $200,000 Source: Sarasota Association of Realtors® $150,000 $100,000 $50,000 $0 2009‐Q4 2010‐Q1 2010‐Q2 2010‐Q3 2010‐Q4 2011‐Q1 2011‐Q2 2011‐Q3 2011‐Q4 2012‐Q1 2012‐Q2