A summary on SQCOnline.com
•Transferir como DOC, PDF•
0 gostou•634 visualizações

What started as a small university project is now one of the most-used sites in the world for statistical process design. Guess the site itself is less flashy - but absolutely solid content on statistical quality control.

Recomendados
Recomendados
Mais conteúdo relacionado
Último
Último (20)
Destaque
Destaque (20)
A summary on SQCOnline.com
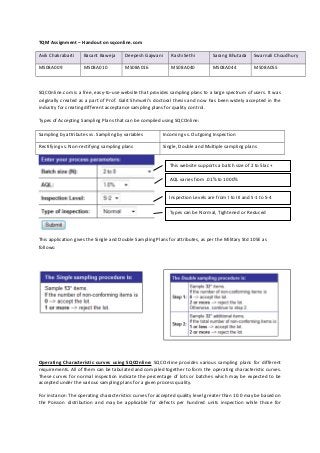
- 1. TQM Assignment – Handout on sqconline.com Avik Chakrabarti Basant Baweja Deepesh Gajwani Rashi Sethi Sarang Bhutada Swarnali Choudhury MS08A009 MS08A010 MS08A016 MS08A040 MS08A044 MS08A055 SQCOnline.com is a free, easy-to-use website that provides sampling plans to a large spectrum of users. It was originally created as a part of Prof. Galit Shmueli’s doctoral thesis and now has been widely accepted in the industry for creating different acceptance sampling plans for quality control. Types of Accepting Sampling Plans that can be compiled using SQCOnline: Sampling by attributes vs. Sampling by variables Incoming vs. Outgoing Inspection Rectifying vs. Non-rectifying sampling plans Single, Double and Multiple sampling plans This website supports a batch size of 2 to 5lac + AQL varies from .01% to 1000% Inspection Levels are from I to III and S-1 to S-4 Types can be Normal, Tightened or Reduced This application gives the Single and Double Sampling Plans for attributes, as per the Military Std 105E as follows: Operating Characteristic curves using SQCOnline: SQCOnline provides various sampling plans for different requirements. All of them can be tabulated and compiled together to form the operating characteristic curves. These curves for normal inspection indicate the percentage of lots or batches which may be expected to be accepted under the various sampling plans for a given process quality. For instance: The operating characteristics curves for accepted quality level greater than 10.0 may be based on the Poisson distribution and may be applicable for defects per hundred units inspection while those for accepted quality level of 10.0 or less and sample sizes of 80 or less may be based on the binomial distribution and are applicable for percent defective inspection.
- 2. SQCOnline can be effectively used to decide in choosing between types of inspection and switching between them. There are standard rules for for switching between samples and SQCOnline can validate action permitting Used when Used when the switching. recent quality recent quality has been poor has been exceptionally good If we answer the stipulated questions for switching between inspections, the site gives a probability plot on the time period (when an inspection method could be switched). Process capability index: The calculators on SQCOnline compute the process capability index which shows the process potential of meeting the specifications. An example is as follows: USL = 1.4 LSL = 0.60 σ = 0.10 Mean = 1.00 Cpk = 1.333 Cp = 1.333 The potential process capability can be achieved by centering the process. The PPM calculations are for the potential process capability. As per the calculations, the process fallout is approximately 63 PPM (defective parts- per-million) Control Chart Calculator for Attributes (Discrete Data): This wizard computes the Lower and Upper Control Limits (LCL, UCL) and the Center Line (CL) for monitoring the fraction of nonconforming items or number of nonconformities (defects) using p and c control charts . Control Chart Calculator for Variables(Continual data): This wizard on SQCOnline computes the Lower and Upper Control Limits (LCL, UCL) and the Center Line (CL) for monitoring the process mean and variability of continuous measurement data using Shewhart X-bar, R-chart and S-chart. It takes in a set of preliminary samples drawn while the process is known to be in control. The information from these samples is used to estimate the process mean and standard deviation: This gives the upper control limit Input parameters for This gives the central control limit determining controls This gives the lower control limit MTBF Calculator: SQCOnline can be used to calculate the system reliability i.e. the mean time between two system failures. An example of the same is described alongside.