2. ¡ Project statement and thesis
¡ Process
§ Data Collection
§ Selection of iconic sites
§ Picture taking of surroundings
§ Note taking
§ Quantitative data
§ Historical research on iconic sites
§ Analysis and application
§ Brochure cover designs
§ Brochure layout
§ Final brochure designs
¡ The Real World
§ Production
§ Use of Product
§ Intervention
CONTENTS
4. ¡ Our idea would be to ‘map’, record and
research the various iconic places that we
encounter on our traverse up Broadway.
¡ Our idea is to synthesize all the information
we have gathered and to create tourist guide
brochures for each neighborhood that we
have encountered. The front cover of each
pamphlet will identify specific landmarks or
points of interest in each neighborhood (by
name and through the use of images or
symbols), and will include specific visual
details or cues that we have characterized
from the neighborhoods (for example, color,
space, font-type, etc.).
¡ Also within the brochures will be the images
of the sites and historical information on the
sites. This is where the secondary research
will come into play in our projects.
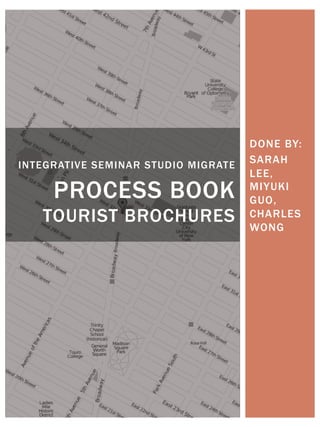
PROJECT STATEMENT AND
THESIS
SL
5. PROJECT STATEMENT AND
THESIS
Broadway Segments
1. Wall Street
Battery Place to Canal
Street
2. Chinatown
Canal Street to 14th
Street
3. Union Square
14th Street to 34th Street
4. Times Square
34th Street to 50th Street
5. Columbus Circle
50th Street to 61st Street
6. The Upper West Side
61st Street to 116th
Street
7. Harlem
116th Street to 170th
Street
8. Inwood
170th Street to 207th
Street
SL
7. ¡ Within each brochure, historical
information on the specific iconic sites
will be included, as well as details on
how they help shape and contribute
aesthetic value to their current
climates. With the proliferation of this
knowledge, New Yorkers can become
more aware of the diversity and
idiosyncrasy of the many places that
make up New York City, perhaps
promoting more tourist interest as well
as a sense of consciousness of one’s
surroundings.
¡ 3 to 4 iconic sites were selected per
neighborhood based on how
representative they were of their
segment of New York
DATA COLLECTION: SELECTION
OF ICONIC SITES
MK
16. DATA COLLECTION: PICTURE TAKING OF
SURROUNDINGS
1 2
3 4
1. Battery Park to Canal Street| 2. Canal Street to 14th Street|
3. 14th Street to 34th Street | 4. 34th Street to 50th Street
MK
17. DATA COLLECTION: PICTURE TAKING OF
SURROUNDINGS
6 7
6. 61st Street to 116th Street | 7. 116th Street to 170th Street |
8. 170th Street to 207th Street
8
Note: no pictures available for segment 5
MK
18. DATA COLLECTION: NOTE TAKING
A more qualitative
approach was applied.
Information is usually
observed through the
senses (sight, sound,
smell, etc.) as we
‘migrated’ up
Broadway first hand,
thus more primary
data was collected
through notes and
pictures (see figure 2a
and 2b). An empirical
data collection
method was an
essential part of the
process, as more
unexpected
information could be
gathered – for
example, the symbols
used on Chinese shop
signs in Chinatown, or
the mannerisms of
people walking in
Times Square. The
data collected was
also more descriptive,
rather than
mathematical, as the
end goal of the project
was to generate a
creative design work
or campaign. SL
19. Some quantitative data was gathered as well, although notably less
with respect to qualitative data. Information on specific racial
population sizes and income levels lent a beneficial perspective
when trying to section or identify the different neighborhoods of
the city (see figure 3). Furthermore, this information gave us ideas
on why and how a neighborhood has evolved to be what it is today,
lending to the historical aspect of our project.
"Urban research maps." The changing city at the sweep of your mouse: Block by block demographic changes mapped
across New York, 2000 to 2010. Center for Urban Research, The Graduate Center, City University of New York (CUNY),
n.d. Web. 19 Oct 2013. http://www.urbanresearchmaps.org/plurality/blockmaps.htm.
DATA COLLECTION:
QUANTITATIVE DATA
SL
20. Secondary data in the form of internet sources and historical literature was also crucial to the
development of the project, specifically in the understanding of the iconic sites. The goal was to sift
out information that answered the questions: why does this place look like the way it does? How is
the aesthetic of a building influenced by its history? Following the research, a short write-up on
each iconic place is included in the final pamphlet of the neighborhood, along with the image of
the sites themselves. For example, Licoln center was designed in the 1950s to 1960s as part of an
urban renewal project, with the purpose of becoming a cultural hub for fine art and performance.
Thus its design was constructed around the ideas of sophistication, refinement and meticulous
detail and was inspired by Michelangelo's Campidoglio in Rome. Lincoln center, as an iconic site,
thus contributes to the majestic and cultivated aesthetic of the upper-west side.
See brochures for full information
Roth, Leland M. (2001). American Architecture: A History. Boulder, Colo.:
Magnet, Myron. n. page. http://www.city-journal.org/html/10_4_a_new_lincoln.html.
DATA COLLECTION:
HISTORICAL RESEARCH ON
ICONIC SITES
SL
22. BROCHURE COVER DESIGNS
1. Wall Street [Battery Park to Canal Street]|2. Chinatown [Canal
Street to 14th Street]|3. Union Square [14th Street to 34th Street] |
4. Times Square [34th Street to 50th Street] | 5. Columbus Circle
[50th Street to 61st Street] | 6. The Upper West Side [61st Street to
116th Street] | 7. Harlem [116th Street to 170th Street] | 8. Inwood
[170th Street to 207th Street]
SL
23. ¡ The use of symbols and imagery played a
significant role in the designs. For example, the use
of the iconic Union Square subway station in the
Union Square brochure design makes it instantly
identifiable. Furthermore, the choice of hand-drawn
sketches of the subway station, the equestrian
portrait of George Washington and the water-color
tiles creates a certain antiquity, suggestive of
stamps, lending to the iconic history the location.
¡ The use of color in the designs was arguable the
most critical indicator for the sites themselves. As
seen in brochure cover no. 6, the use of traditional
chinese colors of prosperity (red and gold), made
more striking in contrast to the desaturated
background picture, was employed to suggest the
distinctive visual quality of Chinatown. They were
inspired by the shop signs, building colors and
customary décor of the area surrounding the iconic
sites. In other posters, such as the one of Wall
Street, the colors black, white and silver were
utilized to describe the masculinity, dominance and
severity of the place and industry.
BROCHURE COVER DESIGNS
SL
24. ¡ Symmetry also played an important part
in the designs. For example, in the Chinese
culture, symmetry invokes balance and
peace (see design for chinatown). The
asymmetric buildings in the design for Wall
Street suggest the aggressive competition
to constantly ‘construct’ higher, bigger,
stronger brands, metaphorically
represented by the ‘competing’ buildings.
¡ The use of typeface and language in
the designs is essential in embodying the
character of the places. Chinese
calligraphic fonts were used in the
Chinatown poster to appeal to the cultural
significance of the chinese language. The
font chosen for the design of Wall Street
was inspired by the typeface used in the
Wall Street Journal.
Garcia, Mario. "The Wall Street Journal." Font Bureau. The Font Bureau Gallery, inc., n.d. Web. 20 Oct 2013.
http://www.fontbureau.com/gallery/newspaper/WallStreetJournal/.
BROCHURE COVER DESIGNS
SL
25. A homogenous brochure layout was created to make
the brochures cohesive and consistent in design. A
description of the surroundings, a brief history of
the location, interesting facts on the iconic sites, a
map and a tourist business contact card was
included to create a complete pamphlet.
BROCHURE LAYOUT
MK
29. 1. Contacting a print
shop
2. Mass printing of
brochures
3. Proliferation of
brochures to the
public through
different
distribution
channels:
§ Tourist agencies
§ Tourist
information
stands
§ Magazines /
journals /
publications
§ Email
§ Social media
(facebook,
instagram,
twitter, etc.)
§ Word-of-mouth
PRODUCTION
SL
30. ¡ Brochures can eventually be used as
interactive tour guides as they journey up
Broadway in New York to visit the iconic
sites / landmarks.
¡ With the proliferation of this knowledge, New
Yorkers can become more aware of the
diversity and idiosyncrasy of the many places
that make up New York City, perhaps
promoting more tourist interest as well as a
sense of consciousness of one’s surroundings.
USE OF PRODUCT
SL