
Recomendados
Recomendados
Mais conteúdo relacionado
Mais procurados
Mais procurados (20)
Destaque
Destaque (17)
Semelhante a IJBB-51-3-188-200
Semelhante a IJBB-51-3-188-200 (20)
IJBB-51-3-188-200
- 1. Indian Journal of Biochemistry & Biophysics Vol. 51, June 2014, pp. 188-200 Applications of complementarity plot in error detection and structure validation of proteins Sankar Basu1 , Dhananjay Bhattacharyya2 and Rahul Banerjee1* 1 Crystallography and Molecular Biology Division, 2 Computational Science Division, Saha Institute of Nuclear Physics, Kolkata 700064, India Received 30 September 2013; revised 09 April 2014 The complementarity plot (CP) is based on packing and electrostatics of amino acid residues buried within globular proteins and is a sensitive indicator of the harmony or disharmony of interior residues with regard to short and long range forces sustaining the native fold. As a structure validation tool, it has already been reported to be effective in detecting erroneous side-chain torsions in obsoleted structures. The current study describes the design of several local and global scores based on CP and surveys their utilities in discriminating between obsolete structures and their corresponding upgraded counterparts, detection of wrong rotamer assignments and in identifying packing anomalies. CPs are especially effective in the detection of low-intensity errors (in main-chain geometrical parameters) diffused over the entire polypeptide chain. The methodology is also used to confirm the integral role played by strategic deviations (in main-chain geometrical parameters) in maintaining fold integrity, as reversal to their corresponding ideal values (either unimodal or conformation dependent) lead to large-scale structural distortions. A special feature of this validation tool is to signal unbalanced partial charges within protein interiors. The application of CP in protein homology modeling and protein design is also demonstrated. Keywords: Complementarity, Packing and electrostatics, Structure validation There has been a rapid increase in the number of protein crystal structures deposited in the Protein Data Bank (PDB)1 currently exceeding 75000 which requires sophisticated validation tools to efficiently detect (local/global) structural errors and provide a just estimate of the overall reliability of the reported atomic coordinates2 . Homology modeling, threading techniques and de novo structure prediction3,4 should also profit from effective validation protocols in assessing the confidence level associated with the final model. Thus, discerning validation procedures could find a wide range of applications in computational and experimental structural studies. Currently, the most commonly used tools include the deviation of covalent bond lengths, bond angles and peptide planarity from ideal values which have been estimated from statistical analyses of either small molecules5,6 from the CSD or high resolution protein crystal structures from the PDB7 . Generally, deviations less than 3σ from unimodal ideal values are considered to be within the normal range8 . The Ramachandran plot9 continues to be one of the most simple and effective indicators of error. Combinations of side- chain torsion angles (χ) from a correctly determined structure are also expected to be in agreement with statistical distributions tabulated in rotamer libraries10 . Lately, ‘network based approaches’ have also been implemented to assess the quality of protein structures11,12 . Correctly folded proteins are expected to have densely packed interiors and absence of destabilizing unbalanced electric fields within them which can be assessed by means of complementarity. Elevated values for surface (Sm) and electrostatic complementarity (Em) measures found for residues within native protein interiors arise naturally due to the stereo-specific interlocking of side-chains (avoiding short contacts and packing defects)13 and the meticulous balance of charges (inclusive of hydrogen bonds)14 to stabilize the protein fold. The applications of Sm, Em for threading and fold recognition have already been demonstrated14 and the complementarity plot (CP) could also identify residues with suboptimal packing and electrostatics, found to be highly correlated with coordinate errors14 . —————— *Corresponding author E-mail: sankar.basu@saha.ac.in dhananjay.bhattacharyya@saha.ac.in rahul.banerjee@saha.ac.in Phone: +91-33-2337-0221 (ext: 1325) Fax: +91-33-2337-4637
- 2. BASU et. al : APPLICATIONS OF COMPLEMENTARITY PLOT 189 In this work, we further examine the utility of the CP as a validation tool by designing a set of scores which adequately describe the quality of the plot in several ensuing applications. Based on these scores, the ability of the plot to detect errors in side-chain rotamers, geometrical parameters and disqualify obsoleted, retracted structures has been tested. Possible applications of the plot in homology modeling and protein design have been examined. Lastly, an attempt has been made to probe the relationship of deviations in geometrical parameters to fold integrity, where CP has been effectively used alongside RMS deviations as an indicator of error. A standalone suite of the program is available in the public domain15 . Materials and Methods Databases Initially 1500 structures were culled from the PDB applying filters in R-factor ≤ 20 %, resolution ≤ 2 Å and homologues removed at greater than equal to 30% sequence identity. From this set, selection of polypeptide chains within the range 75 to 500 residues yielded 918 structures. Further, rejection of chains with any missing atoms or containing embedded prosthetic groups finally led to a database of 400 structures, referred to as DB2. This database has been used in a previous calculation14 with satisfactory results. Primarily, DB2 was used as a training set in the design of the complementarity (CSl) and accessibility (rGb) scores, which were then independently tested on three datasets UDB, MDB and LDB spanning resolution ranges ≤ 1 Å, 2-2.5 Å and > 3 Å, respectively. For structure validation in the case of real data, 110 pairs of obsolete structures and their upgraded partners were collected (OUDB) from the PDB (ftp://ftp.wwpdb.org/pub/pdb/data/status/obsolete.dat). In order to ensure that the upgraded structure was genuinely better than its obsoleted counterpart, only those pairs were selected, wherein the improvement in resolution and R-factor was better than 0.2 Ǻ and 0.02, respectively. For calculations involving synthetic data, a composite database consisting of 143 high-resolution structures was assembled (SDB) and subsets there from were used for idealization (see below) (SDB-1, SDB-3), detection of diffused errors (SDB-2), detection of synthetic errors in rotamers (SDB-3) and detection of partial charges within the protein interior (SDB-3, SDB-4) (Table S1 in the Supplementary Material). Complementarity plot (CP) CP requires the surface ( sc mS ) and electrostatic ( sc mE ) complementarity to be computed for buried residues. Briefly, the extent of burial (Bur) of every amino acid residue with respect to the solvent was estimated by the ratio of the solvent accessible areas (SAA: probe radius: 1.4 Å)16 of the residue (X) in the polypeptide chain to that of an identical residue in a Gly-X-Gly peptide fragment, in a fully extended conformation. Only those residues with the burial ratio (Bur) ≤ 0.30 were henceforth considered for the CP. The van der Waals surface was calculated13 for the entire polypeptide chain, sampled at 10 dots/Å2 . For surface complementarity ( sc mS ), only side-chain surface points of buried residues (target) were considered and their nearest neighboring surface points identified from the rest of the polypeptide chain (within a distance of 3.5 Å). sc mS reflects the quality of atomic packing within protein interiors, which is predominantly determined by side chain atoms contributing approximately 70% of the atoms involved in packing within the molecular interior. Surface points essentially being area elements are characterized by their positions (x, y, z) and the direction cosines (dl, dm, dn) of the normal to the area element corresponding to the surface point. Consider surface point ‘a’ to be located on the surface of a buried amino acid side chain (referred to as ‘target’; based on the burial criteria given above) and point ‘b’ to be its nearest neighbor from the surface points constituting the rest of the polypeptide chain (including those on main chain atoms). Then, adapted from Lawrence and Colman17 , the following expression was calculated: ).(exp.nn),( 2 abba dwbaS −= ⋅ …(1) where an and bn are two unit normal vectors, corresponding to the dot surface point a (located on the side chain surface of the target residue) and b (the dot point nearest to a, within 3.5 Å) respectively, with dab the distance between them and w, a scaling constant set to 0.5. sc mS was defined as the median of the distribution {S(a,b)} calculated over all the dot surface points of the side-chain target residue. For electrostatic complementarity )( sc mE , the electrostatic potential of the molecular surface was estimated using the finite difference Poisson- Boltzmann method as implemented in DelPhi18 .
- 3. INDIAN J. BIOCHEM. BIOPHYS., VOL. 51, JUNE 2014190 Consider the buried side-chain surface of an amino acid residue within a protein again referred to as a target. The potential on the side-chain surface points of the buried residue (target) was computed twice14 , first due to all atoms of the target residue and second as a function of all atoms from the rest of the polypeptide chain (excluding the target). Thus, each surface point was tagged with two values of electrostatic potential. Following McCoy et al.19 , the negative of the Pearson’s correlation coefficient between these two sets of potential values over the side-chain dot surface points of the target residue was defined as sc mE . −− −− −= ∑∑ ∑ == = 2 1 1 2 1 2 1 `))`(())(( `))`()()(( N i N i N isc m ii ii E ϕϕϕϕ ϕϕϕϕ …(2) where, for a given residue consisting of a total of N side-chain dot surface points, )(iϕ is the potential on its ith point realized due to its own atoms and )`(iϕ , due to the rest of the protein atoms, ϕ and `ϕ are the mean potentials of )(iϕ , i = 1…N and )`(iϕ , i = 1…N, respectively. The plot of sc mS on the X-axis and sc mE on the Y-axis (spanning -1 to 1 in both axes) constitutes the CP, which is actually divided into three plots based on the burial ranges: 0.00 ≤ Bur ≤ 0.05 (CP1), 0.05 < Bur ≤ 0.15 (CP2) and 0.15 < Bur ≤ 0.30 (CP3). To start with, all the buried residues from the database DB2 were plotted in the CPs, which had been divided into square-grids (of width 0.05 × 0.05), and the center of every square grid was assigned an initial probability (Pgrid) equal to the number of points in the grid divided by the total number of points in the plot. The probability of a residue to occupy a specific position in the plot was then estimated by bilinear interpolation from the probability values of its four nearest neighboring voxels. As discussed in a previous report14 , each CP was contoured based on the initial probability values (Pgrid >= 0.005 for the first contour level and Pgrid >= 0.002 for the second), thus dividing the plot into three distinct regions. Inspired by the Ramachandran plot, the region within the first contour was termed ‘probable’, between the first and second contour, ‘less probable’ and outside the second contour ‘improbable’. Complementarity and accessibility scores In order to quantify the quality of the plots, a complementarity score was designed, wherein all points in each plot were first partitioned into two sets, those with zero and non-zero probabilities. Occurrence of any point with zero probability (essentially in the improbable region) implies that the corresponding residue exhibits suboptimal packing and/or electrostatics with respect to the rest of the protein and, therefore, should be penalized. The score thus consists of two terms — the first essentially the average of the non-zero log probabilities and the second, the fraction of residues with zero-probability multiplied by a penalty (Pen). Thus, the score would be expected to decrease with increase in the points in the improbable regions of the plot. For a particular plot (say CP1), the score can be defined as: ⋅− = ∑= tot zero N i i N N PenP N Sl 1 10 )(log 1 …(3) = Slnon-zero + Slzero where Ntot is the total number of points in the plot which can be partitioned into points which fall in square grids of non-zero probability (N) with grid probabilities Pi and those located in grids of zero probability (Nzero). For the first term, it was assumed that the probability assigned to one point (Pi) is independent of the others, leading to a multiplication of probabilities (P1, P2, …) and converted into a summation by taking log ( ∑= N i iP 1 10 )(log ). There is some measure of arbitrariness in assigning the value for Pen. Even for accurately determined structures from DB2, generally 10% of the residues (per chain) would be located in the improbable regions of the plots. It was thus decided that for correctly folded proteins (of the kind found in DB2), the ratio of the two terms (RSl = Slzero/Slnon-zero) should optimally be in the range 0.30, greater than which it would unjustifiably begin to dominate the overall score, whereas too low a value (say less than 0.10) would compromise the sensitivity of the score to structural errors. Several values of Pen were tested on DB2, where the two terms (Slzero and Slnon-zero) were estimated for each polypeptide chain in the database; initially applying the same Pen for all the three plots
- 4. BASU et. al : APPLICATIONS OF COMPLEMENTARITY PLOT 191 (CP1, CP2, CP3; Table S2 in the Supplementary Material). For uniform penalties applied to all the three plots, it was observed that RSl tended to increase from CP1 to CP3 as relaxation in packing constraints (with corresponding increase in solvent exposure) increased the relative fraction of points in the zero probability grids from CP1 to CP3 (Nzero/Ntot for CP1: 0.026 (± 0.029), CP2: 0.037 (± 0.048), CP3: 0.045 (± 0.043)). Thus, to introduce some measure of uniformity, Pen was modulated (CP1: 25; CP2: 20; CP3: 15) such that RSl was in the range 0.30–0.35 for all the three plots. Understandably, the ratios of the penalties (Pen) in the three plots (CP1/CP2: 25/20 = 1.25; CP1/CP3: 25/15 = 1.67) were correlated to the corresponding ratios of Nzero/Ntot (CP2/CP1: 0.037/0.026 = 1.42; CP3/CP1: 0.045/0.026 = 1.73). Finally, ∑= ⋅+= 3 1j jjl SlwbKCS …(4) As has been mentioned, scores for deviant structures are expected to decrease in value. So, for convenience of interpretation, K was empirically set to 5.0 so as to obtain an overall positive score from 0 to 5 in case of a favorable distribution spanning the three plots. It follows that such a constant merely acts as a scale factor universally applied to all CSl scores. wbj is the number of points in the jth plot divided by the total number of points in the three plots and the (weighted) summation is over CP1, CP2 and CP3. The sensitivity of CSl was also tested (Table S2 in the Supplementary Material) for different combinations of penalties by computing its mean and standard deviations for all chains in DB2. Standard deviations were especially high (1.17 to 2.33) for uniform penalties 100, 75, 50, whereas for different combinations of penalties in the range of 5 to 30, CSl was found to be fairly stable with standard deviations falling in range of 0.14 to 0.60 (Table S2 in the Supplementary Material), and CSl was confirmed to be well behaved for the selected penalty values (Pen = 25, 20, 15 for CP1, CP2 and CP3, respectively). In order to check the expected distribution of amino acid residues w.r.t. burial, the following score was defined. ∑= = resN i i resN rGb 1 10 )(Prlog 1 …(5) where Nres is the total number of residues in the polypeptide chain and Pri is the propensity of a particular amino acid (Val, Leu etc) to acquire a particular degree of solvent exposure (corresponding to buried residues in the three burial bins and a 4th bin composed of exposed residues (Bur > 0.30)). = DB j N jsN kBurjsP ))((Re ))(|)((Re Pr …(6) where k = 1, 2, 3, 4 corresponds to four burial bins with 0.0 ≤ Bur ≤ 0.05, 0.05 < Bur ≤ 0.15, 0.15 < Bur ≤ 0.30 and Bur > 0.30, respectively and j = 1, 2, 3 .. 19 correspond to the 19 amino acids excluding glycine. P(Res(j)|Bur(k)) is the conditional probability of Res(j) (say Val) to acquire a given burial, Bur(k), N(Res(j)) is the number of residues of identity Res(j) found in the database and NDB is the total number of residues in the training database, DB2. Glycines were disregarded in all the scores due to the lack of any non-hydrogen side-chain atoms. To quantify the individual contributions of sc mS and sc mE , two additional (global) scores PSm and PEm were further defined. The normalized frequency distribution separately for each burial bin was used to assign discrete probabilities [P (x < sc mS < (x+0.05)] to sc mS divided into intervals of 0.05. Three such probability distributions were computed one for each burial bin and a similar procedure was adopted for sc mE . Then, for each polypeptide chain, the individual probabilities were averaged over all buried or partially buried residues, giving rise to the two following measures: 0)(; ))((log 1 10 ≠= ∑= sc mi b N i sc mi Sm SP N SP P b … (7) 0)(; ))((log 1 10 ≠= ∑= sc mi b N i sc mi Em EP N EP P b … (8) where Nb is the total number of buried or partially buried residues in a given polypeptide chain.
- 5. INDIAN J. BIOCHEM. BIOPHYS., VOL. 51, JUNE 2014192 A local score (Pcount) was also defined simply as the number (in percentage) of points in the improbable regions divided by the total number of points spanning the three plots. Building idealized structures Idealization refers to the reversal of all main chain bond lengths, angles along with torsion angle ω to their corresponding ideal values. A locally developed algorithm was utilized to build idealized structures from the native coordinates which was cross checked using the ‘Build and Edit protein’ module in the Accelrys (Studio, D., 2.5 Guide, Accelrys Inc., San Diego. 2009) suite of programs. Both methods gave nearly identical results, as an RMSD of 0.035 Å (for 2HAQ) was obtained upon superposing (by DaliLites)20 the two structures which had been built by an identical set of (idealized) geometrical parameters. For the in-house program, a single peptide plane consisting of atoms Cα i-1, Ci-1, Oi-1, Ni, Hi and Cα i was initially constructed based on ideal values for bond lengths, bond angles6 and the ω-torsion21 . Atomic coordinates of Ci, Ni+1 and Cα i+1 of the successive peptide plane were then determined by the repeated application of the ‘fourth atom fixing’ procedure22 , in the course of which, the native values of φ, ψ were retained. The positions of the remaining atoms (Oi, Hi+1: second plane) were then generated by superposing the initially obtained idealized peptide plane on to the predetermined atoms Ci, Ni+1 and Cα i+1. Finally, the side chain atoms (extracted from the native coordinates) were threaded on to the idealized main-chain by superposing N, Cα , C coordinates of every residue on to their main-chain counterparts. When native values for all geometrical parameters were fed into the program, a Cα -RMSD of 0.035 Å (side-chain RMSD: 0.5 Å, 2HAQ) was obtained between the rebuilt structure and the native coordinates (upon superposition)20 , which also confirmed the correctness of the idealization protocol. Idealized structures using conformation dependent ideal values (for bond angles) from a library (CDL: http://dunbrack.fccc.edu/nmhrcm/) were built by suitably adapting the algorithm given above, where the ideal values were now dependent on residue identities and the relative orientation of contiguous peptide planes (φ, ψ)23 . Hydrogen atoms were then removed and geometrically rebuilt by REDUCE, version 2 (http://kinemage.biochem. duke.edu/downloads/software/reduce/)24 . The idealized structures were then energy minimized by CHARMM25 with either hard (constant harmonic force parameter set to 250.0 for N, Cα , C, O atoms and 10.0 for Cβ ) or soft (5.0, 2.5: flexible backbone) harmonic restraints on main-chain atoms and Cβ . Incorporation of low intensity diffused errors into native coordinates A predetermined quantum of small random errors in pre-selected geometrical parameters (± 0.5σ approximately ranging from 1.5-2.5° for main-chain bond angles6 and ±1° for (φ, ψ)) was incorporated into native crystal structures by perturbing the specified parameter on randomly chosen residues. The protein structure was then rebuilt using computational procedures described above. Building homology models To test the performance of CP on homology models, 20 structures representing a fairly wide cross section of folds were selected as templates from the SCOP database26 . For each template structure, 5 other sequences with varying identities (ranging from 13% to 90%) were chosen by a BLAST27 search (using the DELTA-BLAST algorithm) against the PDB. Sequence similarities and identities were calculated using the ‘Align sequence profiles’ module (scoring matrix: BLOSUM62) as implemented in the Accelrys (Studio, D., 2.5 Guide, Accelrys Inc., San Diego. 2009) suite of programs. The resultant alignment profile along with the template-backbone coordinates were fed to the ‘Build homology model’ module of Accelrys with ‘High’ optimization. The top most model with lowest total energy and physical energy were then selected. All models were finally energy minimized with flexible backbone and subjected to validation by the CP. Results and Discussion As will be evident from the definition of the complementarity functions (see ‘Materials and Methods’), perfect fit between two surfaces (for example identical surfaces) will return a value of 1.00 for sc mS . Likewise sc mE will be 1.00 for perfect anti-correlation between two sets of electrostatic potential values on a given surface. Generally, for completely buried (0.00 ≤ Bur ≤ 0.05) residues in correctly folded proteins, both sc mS and sc mE lie in the narrow range of ~0.50–0.55 and ~0.50–0.70, respectively, regardless of their identity, thereby
- 6. BASU et. al : APPLICATIONS OF COMPLEMENTARITY PLOT 193 satisfying fairly stringent constraints in both packing and electrostatics14 . For higher solvent exposure (0.05 < Bur ≤ 0.30) there is some measure of relaxation in the constraints. The CP consists in plotting the surface ( sc mS : X-axis) and electrostatic ( sc mE : Y-axis) complementarity values of individual residues. The term ‘complementarity plot’ (CP) is perhaps a misnomer, as there are actually three plots, each serving a given range of solvent exposure of the plotted residues (CP1, CP2, CP3 for burial bins 1, 2, 3: see ‘Materials and Methods’). The constraints both in terms of packing and electrostatics for correctly folded proteins are reflected in the dense population of points in a localized region of the CPs14 . Thus, points straying into the improbable regions of the plot denote either defective packing of side chain atoms and/or imbalance in the distribution of partial charges within the protein interior likely to be symptomatic of fold instability. To quantify the character of a distribution of points spanning all the three plots, proportional to their net probability of occurrence, a complementarity score was designed (CSl). In addition, a second score (accessibility score: rGb) essentially estimated the propensity of a particular amino acid residue (Leu, Val etc) to acquire a specified degree of solvent accessibility (see ‘Materials and Methods’). As both scores (CSl, rGb) are computed on entire polypeptide chains (or a collection of points in the plots), they could be treated as ‘global’. A local score (Pcount) was also defined, which simply consisted in counting the number of points in the improbable regions divided by the total number of points in the three plots. Testing the scores in different resolution ranges The global scores (CSl, rGb) were initially optimized on the training database DB2 (see ‘Materials and Methods’) to yield values of 2.24 (σ: ± 0.48), and 0.055 (± 0.022), respectively. They were then tested on 3 independent datasets consisting of ultrahigh (UDB), medium (MDB) and low resolution structures (LDB). Both the scores from UDB and MDB were in good agreement with values observed for the training set (DB2), in contrast to LDB which exhibited significant decrease (Fig. S1 in the Supplementary Material). The discriminating power of CSl, rGb consistent with the visually recognizable features in the distribution of points in the CPs was thus fairly well-established. As has been previously mentioned, deviations of less than 3σ in geometrical parameters (bond lengths, bond angles etc.) from ideal values are considered to be within the normal range8 . Thus, for all the scores a cut-off of 3σ from the mean was decided as the threshold (with the sole exception of rGb) for successful validation. Thus, the threshold value for CSl was set to 0.80 (µ-3σ from DB2). Similarly, the average values for PSm and PEm for all chains in DB2 were -0.855 ± 0.054 and -1.492 ± 0.099, respectively and their threshold values were set to -1.017 and -1.789 (µ-3σ). Again, considering all the polypeptide chains in DB2, an average of 8.75% (± 4.10), 9.25% (± 5.05) and 11.14% (± 6.00) of the points (per chain) were found to be in the improbable regions of CP1, CP2 and CP3, respectively. Thus, any polypeptide chain was considered to have successfully passed the validation test for the ‘local score’, Pcount when less than 15% (3σ; average σ from the three plots: 5.05) of its residues/points were located in the improbable regions taking into consideration all three plots. Only in case of rGb was the cut-off reduced to µ-2σ : 0.011, as the standard deviation was fairly high (σ = 0.4 µ) and 3σ actually exceeded the mean. It was also confirmed by visual inspection that for structures with rGb approximately ~0.000, the three- dimensional distribution of residues w.r.t. solvent accessibility was non-native. Throughout this work, the two global scores CSl and rGb were used in conjunction, i.e., successful validation required the simultaneous satisfaction of their individual criteria. Discriminating obsolete structures from their upgraded counterparts In order to test the performance of CP for real data, a database (OUDB) consisting of 110 pairs of obsolete and upgraded structures were compiled. For each pair, the upgraded structure was better refined relative to its obsolete counterpart indicated by improvements in their corresponding resolutions and R-factors (see ‘Materials and Methods). Firstly, the complementarity scores were computed for all the chains in the database and compared pairwise (Fig. 1). On applying the validation criteria (for CP) mentioned above, 69, 97 structures passed the test for the obsolete and upgraded sets, respectively. Based on the ‘local’ score (Pcount), the corresponding numbers were 44, 72. For benchmarking, the packing and hydrogen bonding parameters were calculated by Whatcheck28 for each chain in the two sets and the number of
- 7. INDIAN J. BIOCHEM. BIOPHYS., VOL. 51, JUNE 2014194 residues with ‘abnormal new packing environment’ and ‘unfulfilled buried hydrogen bond donor or acceptor’ were summed. In case a residue appeared in both lists, it was considered only once. Finally, the number of such anomalous residues divided by the chain length was used as a criterion for validation. Since no criteria for rejection is given in the Whatcheck manual, a variety of cut-offs were tried. A cut-off of 5% (that is anomalous residues constituting more than 5% of the polypeptide chain to be considered a failure) led to 25 and 53 successful validations in both sets and similar numbers obtained for cut-offs of 10 and 15% were 89, 102 and 106, 110, respectively. Detection of errors in rotamers As would be evident from the description of the CPs, the scores primarily concern the subjection of side-chain atoms to short and long range forces in the protein. Thus, it would be expected that wrong assignments in side-chain rotamers due to low resolution data or some other reason, should evoke a sensitive response from these measures. To test this hypothesis, those side-chains from the set of obsolete structures were compiled (1061 residues in all) which differed by more than 40° from their corresponding residues in their upgraded counterpart (involving χ1 and χ2) and yet were within 40° of another valid rotamer combination29 . These two sets of residues (Obsolete, Upgraded) were plotted in the CPs and the partitioning of points in the probable, less probable and improbable regions (Fig. 2) compared against the standard distribution in DB2 (CP1: 82.1%, 9.2%, 8.7%; CP2: 76.1%, 13.9%, 10.0%; CP3: 70.7%, 16.8%, 12.5%). For completely buried residues (CP1) in the obsolete set, the proportion of residues in the three regions (39.7%, 21.7%, 38.6%) significantly differed Fig. 1—Pair wise comparison of obsolete and upgraded structures by CP [The database (OUDB) consists of 110 pairs of obsolete and upgraded structures which have been numbered sequentially. CSl values are plotted in ‘blue’ and ‘red’ for the obsolete and upgraded structures respectively] Fig. 2—Distribution of residues in the CP from obsolete structures that have a different (yet valid) side-chain rotamer than their upgraded counterparts taken from the database OUDB [(A) Distribution of residues in CP1 for obsolete structires; (B) Distribution of residues in CP1 for upgraded structures. ‘Probable’, ‘Less probable’ and ‘Improbable’ regions of the plots are colored in ‘purple’, ‘mauve’ and ‘sky-blue’ respectively. CP1 consists of those residues for which 0.00 ≤ Bur ≤ 0.05.]
- 8. BASU et. al : APPLICATIONS OF COMPLEMENTARITY PLOT 195 from that found in DB2, in contrast to the upgraded set which was found to be in fairly good agreement (73.7%, 15.6%, 10.8%). Significant differences in the two distributions were also found for CP2 (obsolete: 42.8%, 20.5%, 36.7%; upgraded: 64.9%, 21.2%, 13.9%) and CP3 (obsolete: 47.7%, 29.3%, 22.9%, upgraded: 60.9%, 25.7%, 13.4%). Deviations from the expected distributions (DB2) were estimated by means of χ2 (df = 3-1, probable, less probable, improbable; χ2 0.05 = 5.991) for each of the two sets separately for all the three CPs. For obsolete and upgraded structures, χ2 were found to be 509.8, 21.55 (CP1), 191.8, 14.53 (CP2) and 67.82, 15.93 (CP3), respectively. As the points were plotted without any reference to the rest of the polypeptide chains, the χ2 could be considered an adaptation of the ‘local’ score. The relative decrease in χ2 for obsolete structures from CP1 to CP3 was obviously due to the relaxation in packing with increase in solvent exposure. The two sets could also be clearly discriminated by the CP-scores applied to the entire distribution: CSl : -1.73, rGb : 0.027 (obsolete); CSl : 1.97, rGb : 0.031 (upgraded). As mentioned previously, the threshold values of CSl, rGb (from DB2) were 0.80 and 0.011, respectively. Disqualifying retracted structures A set of 28 retracted or suspected (obsolete without being superseded) crystal structures from the PDB, were subjected to a selection of validation protocols (Procheck30 , Clash-score from Molprobity31 and Whatcheck28 packing parameters), including CP. Structures which were either suspect in (complexed) ligand or contained embedded co-factors were not included in the calculation and for oligomeric proteins, the largest polypeptide chain was retained. Procheck was used as an initial general filter and the remaining structures were specifically tested for packing defects by the other validation measures. A structure was considered to have passed the filters implemented in Procheck, when all G-factor scores were greater than -1.0 and ‘INSIDE’ recorded for bad contacts. The criteria for successful validation in the case of CP both with respect to the local (Pcount) and global (CSl, rGb) measures have already been mentioned and structures were considered to have passed the validation filter for Whatcheck, when there was ‘No series of residues with abnormal new packing environment’ and ‘No stretches of four or more residues each having a packing Z-score worse than -1.75’ (Whatcheck output for packing parameter). A Clash-score (Molprobity) less than 20.0 was considered to be within the normal range. A total of 5 structures (1G40, 1G44, 2A01, 2ADH, 3KJ5) failed in all tests, whereas 15, 14, 4, 6, 5 were found to satisfy the validation criteria in Procheck, Whatcheck, Clash-score, Pcount and (CSl, rGb), respectively (Table 1, Table S3 in the Supplementary Material). Of the 15 structures (passing Procheck), 6, 11, 10, 11 failed in Whatcheck, Clash-score, Pcount and (CSl, rGb), respectively. Surface complementarity alone was also considered (Psm) separately in order to specifically test for packing defects (by CP) in these structures. A total of 11 structures managed to exceed the threshold in Psm. Again, 6 structures passed Procheck and failed in Psm. More importantly, there were 9 structures (1BEF, 1DF9, 2QID, 1RID, 1Y8E, 1S7B, 2F2M, 2CK9, 2MT2) which passed Whatcheck packing parameters, however failed to meet the threshold in Psm, indicative of packing defects which was also reflected in their high clash-scores. Thus, the performance of CP to detect anomalous packing in these retracted structures appeared to be somewhat better than Whatcheck28 packing parameters and comparable to the Clash-score incorporated in Molprobity31 . Detection of low-intensity diffused errors Since CPs are probabilistic in nature and are most effective when the entire polypeptide chain is taken into account, they should be able to detect an overall decline in the accuracy of the coordinates due to low- quantum random errors in geometrical parameters diffused over the entire structure. To probe the performance of CPs in such circumstances, random errors were incorporated throughout the fold in pre-selected geometrical parameters: (i) approximately 1.5-2.5° for main-chain bond angles (± 0.5σ, and (ii) ± 1° for (φ, ψ). 30 high-resolution structures from SDB-1 were used for these calculations and 20 erroneous models generated per native structure for each of the geometrical parameters leading to 00 models per set. From this set, 142 with errors in main–chain bond angles and 152 files with errors in (φ, ψ) passed the validation filters (criteria stated in the previous section) in Procheck. The average all-atom RMS deviations of these models with respect to their corresponding native structures were 1.89 Å (± 0.71) and 1.67 Å (± 0.56), respectively. Of these 108, 109 files failed to meet the criteria for successful validation in CP with 78, 77 registering negative values for at least one of the two (CSl, rGb) scores.
- 9. INDIAN J. BIOCHEM. BIOPHYS., VOL. 51, JUNE 2014196 Table 1—Comparison of the different validation measures for retracted/suspected structures [Success or failure to meet the validation criteria (see Text) for all the measures is indicated by ‘+’ and ‘-’ respectively. Information regarding these retracted or suspected structures were obtained from http://main.uab.edu/Sites/reporter/articles/71570/, Read et al., 20112 and ftp://ftp.wwpdb.org/pub/pdb/data/status/obsolete.dat] PDB ID Resolution, R-facor Procheck Whatcheck-packing Clash-score Pcount (CSl, rGb) Psm 1BEF 2.10, 0.186 + + - - - - 1CMW 2.60, 0.192 + - - - - + 1DF9 2.10, 0.199 - + - - - - 2QID 2.10, 0.199 - + - - - - 1G40 2.20, 0.198 - - - - - - 1G44 2.60, 0.234 - - - - - - 1L6L 2.30, 0.198 + + - - - + 1RID 2.10, 0.206 - + - - - - 1Y8E 2.20, 0.195 - + - - - - 2A01 2.40, 0.228 - - - - - - 2HR0 2.26, 0.180 + - - - - + 1PF4 3.80, 0.240 + - - - - - 1S7B 3.80, 0.320 + + - - - - 1Z2R 4.20, 0.280 + - - - - - 2F2M 3.70, 0.282 + + - - - - 2A73 3.30, 0.233 + + - - - + 2ADH 2.4, NULL - - - - - - 2CK9 2.85, 0.187 + + - - - - 2MT2 2.30, NULL - + - - - - 2PZ3 2.42, 0.314 - - - - + + 2QNS 3.00, 0.238 - - - - - + 2RA7 1.99, 0.242 + + + + + + 3A00 1.80, 0.222 + + + + + + 3K78 2.80, 0.274 + + - + - + 3KJ5 3.00, 0.366 - - - - - - 3O7Y 2.41, 0.180 + - + + + + 3O7Z 2.55, 0.183 + - + + + + 3O8K 2.70, 0.268 - - - + - - Probing the role of deviations in maintaining structural integrity One of the questions addressed in this work was the contribution of deviations (in geometrical parameters) in maintaining structural integrity of the native fold. For this purpose, 20 high resolution structures (SDB-2), spanning the four major protein classes and ranging from 56 to 363 residues in chain length were selected and the structures rebuilt (see ‘Materials and Methods’) by reverting all main-chain bond lengths, angles and ω-torsions to their corresponding unimodal ideal values6,21 , while retaining native values for all other dihedral angles (φ, ψ, χ). This led to such large-scale distortions in the idealized structures (with respect to the original native model) that often their (Cα ) RMSDs exceeded 10 Å (Fig. 3). Although the degree of structural distortions is estimated by the RMSDs, its effect on packing and electrostatics can be conveniently assessed using the CP measures. The distortions were more pronounced for larger polypeptide chains (~100 residues or more in length) due to the accumulation of a higher number of angular idealizations. Also, proteins containing greater β-sheet content had more severe deformations, most probably rationalized32 by the distribution in N-Cα -C (τ) angle with respect to secondary structure. It is possible that the strategic location of deviations could influence beta sheet geometry (twist etc.), though a detailed examination of this issue lies outside the scope of the current work. The procedure led to a sharp decline in CSl (-10.54, σ = ± 3.48) averaged over all 20 structures, relative to their corresponding native values (2.47 ± 0.41, respectively: Table S4 in the Supplementary Material).
- 10. BASU et. al : APPLICATIONS OF COMPLEMENTARITY PLOT 197 Fig. 3—Distortions in the native fold due to the reversal of all main-chain bond lengths, angles and ω-torsions to their corresponding (unimodal) ideal values [(A) The native structure of cyclophilin from L. donovani (2HAQ); and (B) its corresponding idealized structure (Cα -RMSD: 12.86 Å, calculated at one-to-one atomic correspondence). Figure constructed by PyMol [http://www.pymol.org/] Little or no improvement was observed in the quality of the rebuilt structures by either retaining native ω values or utilizing ideal values (for bond angles) derived from a conformation dependent library (CDL)23 (Fig. S2 in the Supplementary Material). The values for rGb (0.000 ± 0.031) for the idealized structures were also substantially reduced, as structural distortions often led to the exposure of hydrophobic residues to the solvent. Energy minimization subsequent to idealization improved the complementarity scores (CSl : -2.58 ±2.61), even though they were still significantly less than their corresponding native values, with a surge in their standard deviations. The substantially low values for rGb remained unaltered even after energy minimization, indicative of hydrophobic residues still remaining exposed to the solvent. Minimization also did not improve the (Cα ) RMSDs (calculated at a one-to-one atomic correspondence subsequent to superposition20 ) between native and idealized coordinates, which in some instances could not even be superposed onto each other (Table S5 in the Supplementary Material). Thus, in summary, in no case could the original structure be reconstituted by any form of energy minimization of the idealized coordinates. Calculations using both unimodal and CDL ideal values were repeated on a larger dataset of 68 ultrahigh resolution (≤ 1 Ǻ) structures (SDB-3), which gave a similar pattern of results (Table S6 in the Supplementary Material). To determine the relative contribution of each geometrical parameter in the distortions of the reconstituted (idealized) polypeptide chains, calculations (from SDB-1) were repeated by individually idealizing bond lengths, angles and ω in turn, while retaining native values for all other parameters. Idealizing bond lengths were found to cause no significant distortions, while all the angular parameters played an influential causal role in giving rise to structural deformations. Idealizing either τ or ω was found to have a more pronounced effect on the distortions amongst all other angular parameters (Table S4 in the Supplementary Material). Detection of unbalanced charges in the protein interior CP takes into account long range electrostatics of the whole protein molecule as part of its validation protocol. In order to examine the additional efficacy of this feature in error detection (involving misidentification of side-chains) native sequences of 93 structures (SDB-3 and SDB-4) were redesigned by switching polar or charged to hydrophobic residues and vice versa. All deeply or partially buried residues from a chosen set of amino acid identities (Bur ≤ 0.30) were changed to those of an altered hydrophobic character, though similar in size and shape in most of the cases: Ala → Ser, Ser ↔ Cys, Thr ↔ Val, Phe ↔ Tyr, Leu → Asn (transition probability : 0.5), Leu → Asp (0.5), Ile → Met, Met → Ile (0.5), Met → Arg (0.5), Glu → Arg (0.5), Glu → Gln (0.5), Asp ↔ Asn, Arg → Met (0.5), Arg → Glu (0.5). Side-chains of these designed sequences were then threaded on to the native backbone using SCWRL4.0 and the resulting structures were energy minimized with flexible backbones, subsequent to hydrogen fixation by
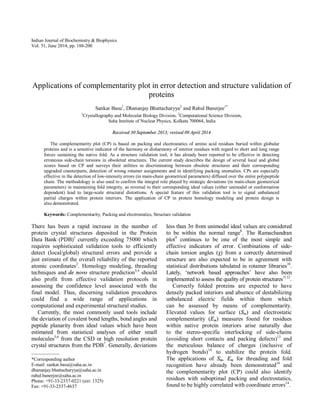
- 11. INDIAN J. BIOCHEM. BIOPHYS., VOL. 51, JUNE 2014198 REDUCE, version 2 (http://kinemage.biochem. duke.edu/downloads/software/reduce/)24 . Molprobity31 was used to ensure that the redesigned models were devoid of errors/outliers in the other validation parameters. All 93 redesigned structures passed all the validation filters in Molprobity with minimum Clash scores (1.26 ± 0.64; <percentile>: 98.23 ± 1.55) and satisfying all other validation filters, reflected in the overall Molprobity scores (1.00 ± 0.27; <percentile>: 99.38 ±1.21). Although, CSl dropped to 0.36 ± 1.23; w.r.t. native (CSl: 2.21 ± 0.62), the polar to hydrophobic transitions (or vice versa) were naturally captured in the poor rGb scores (0.005 ±0.026), reflecting non-native like distribution of amino acids (native: 0.054 ±0.026) with regard to burial and also in the distribution of suboptimal points, primarily with regard to sc mE (Fig. 4). 74 redesigned models failed to meet the criteria for successful validation (in CP), whereas 58 registered negative values in at least one of the two (CSl, rGb) scores (Fig. S3 in the Supplementary Material). On the other hand, consideration of the ‘local’ score (Pcount) led to the rejection of 77 structures. By considering electrostatic complementarity alone, (PEm) 66 structures failed to meet the threshold criteria. 198 unfulfilled hydrogen bonds (for buried residues) were detected by Whatcheck28 in the native structures, which increased to 1160 for the redesigned models, demonstrating a comparable ability of Whatcheck and CP to detect such errors. 82 redesigned models had more than 2 (average obtained from native) unfulfilled hydrogen bonds over and above the native. Thus, the local electrostatic parameters of CP and Whatcheck appeared to perform comparably. Quality assessment of homology models Finally, the method was tested on homology models (20 folds) with templates of varying sequence identity (w.r.t. the modeled sequence; ranging from 13.5% to 90.3%). Both CSl,, rGb correlated fairly well with sequence identities and somewhat better with sequence similarities of the modeled sequences (w.r.t. the template, Table S7 in the Supplementary Material). The (non-linear) correlation of CSl with both sequence identity and similarity were best fitted to cubic-polynomial curves with R2 of 0.69 and 0.72, respectively (Fig. 5). Interestingly, there was a significant improvement in the scores upon energy minimization of the models obtained from Accelerys (Modeller). On an average, there was an increase of ~150 to 175% in the CSl scores for the models before and after energy minimization. Generally, a fairly steep decline in CSl was noted below 30% sequence identity, even though 8 out of 47 such models were found above the Fig. 4—Ability of CP to detect residues with unbalanced charges in the protein interior [(A) Native distribution of 3KLR in CP1; and (B) distribution of the designed structure subsequent to the ‘polar to hydrophobic’ transitions. All buried residues have been included in the plot. As can seen from the plot, the mutated residues have a tendency to be found in the improbable region suboptimal for sc mE ]
- 12. BASU et. al : APPLICATIONS OF COMPLEMENTARITY PLOT 199 Fig. 5—CSl scores for homology models as a function of sequence identity (A) and similarity (B) w.r.t the template - Table S2 : Supplementary Material [The templates are in the extreme right hand top corner of the graph. Both distributions are best fitted to cubic polynomial curves with R2 of (A) 0.69 for identity and (B) 0.72 similarity respectively] CSl cut-off (0.80) for successful validation. Thus, the scores could definitely be used as measures, either to judge the overall quality of the models or the appropriate choice of the template. CP was then compared with the Modeller-DOPE score33 which also provides a measure of complementarity in the interior of protein structural models. 22 homologous structures of 2HAQ (Cyclophilin-like-fold) were assembled ranging in sequence identity from 17 to 74%. Homology models were built using these sequences with 2HAQ as a template in Accelerys (Modeller), which provided their DOPE scores. Both the scores gave a significant correlation with sequence identities w.r.t. the template (CSl: 0.79; DOPE: -0.66, Fig. S4 in the Supplementary Material), their mutual correlation being -0.51. However, unlike CSl which is normalized over the entire polypeptide chain, the DOPE score gave almost zero correlation (-0.12, calculated on 50 models), when estimated over a collection of folds. Conclusions The complementarity plot can be used as a validation technique either over an entire polypeptide chain (or set of chains) or the CP scores may be simply applied to estimate the character of any distribution of points on the plot, whatever be their actual origin. It works best when applied to discriminate between native properties and deviations there from of stably folded protein domains or individual monomers. In contrast to the Ramachandran plot, CP is probabilistic in nature. Further, this is probably the only validation procedure to combine both packing and electrostatics in a single unified measure and serves to graphically identify (apart from actually listing) residues with faulty packing and/or electrostatics. One drawback of the methodology could be its demand for additional computational time compared to procedures involving point atoms. Currently, the entire CP analysis can be completed in about 12-15 min (on a standard Linux platform), for a polypeptide chain of length 150–200 residues. The current study shows that over and above the standard validation procedures, the quality of packing within proteins and the global electrostatics should be included separately in any validation package. Thus, CP may be a useful addition in the already existing repertoire of structure validation tools. Program availability The standalone suite of programs (Sarama) for the complementarity plot (Linux Platform) has already been reported to be available in the public domain15 with detailed features and documentation at: http://www.saha.ac.in/biop/www/sarama.html. The program can also be made available upon an e-mail request to Sankar Basu (nemo8130@gmail.com). Supplementary Materials The Supplementary Materials for this article containing seven tables (Table S1-S7), four figures (Fig. S1-S4) and one dataset (Dataset S1) is available at http://www.saha.ac.in/biop/www/db/local/sarama/IJBB20 14-Supp.pdf)
- 13. INDIAN J. BIOCHEM. BIOPHYS., VOL. 51, JUNE 2014200 Acknowledgments We thank Prof. Dipak Dasgupta (Biophysics Division), Prof. Nitai Bhattacharyya (C & MB Division) and the Computer Section of Saha Institute of Nuclear Physics (SINP) for their constant support during this project. The work was supported by MSACR project, SINP, Kolkata, India. References 1 Berman H M, Henrick K & Nakamura H (2003) Nature Struct Biol 10, 98 2 Read RJ, Adams P D, Arendall W B, III, Brunger A T, Emsley P, Joosten R P, Kleywegt J G, Krissinel E B, Lutteke T, Otwinowski Z, Perrakis A, Richardson J S, Sheffler W H, Smith J L, Tickle I J, Vriend G & Zwart P H (2011) Structure 19, 1395-1412 3 Bradley P, Misura K M S & Baker D (2005) Science 309, 1868-1871 4 Rohl C A, Strauss C E M, Misura K M S & Baker D (2004) Method Enzymol 383, 66-93 5 Engh R A & Huber R (1991) Acta Crystallogr A 47, 392-400 6 Engh R A & Huber R (2001) International Tables for Crystallography. In: International Tables for Crystallography (Rossmann M G & Arnold E, eds.), pp 382-392, Dordrecht, The Netherlands: Kluwer Academic Publishers 7 Jaskolski M, Gilski M, Dauter Z & Wlodawer A (2007) Acta Crystallogr D63, 611-620 8 Lovell S C, Davis I W, Arendall W B, III, de Bakker P I W, Word J M, Prisant M G, Richardson J S & Richardson D C (2003) Proteins: Struct Funct Genet 50, 437-450 9 Ramachandran GN, Ramakrishnan C & Sasisekharan V (1963) J Mol Biol 7, 95-99 10 Dunbrack RL, Jr & Karplus M (1993) J Mol Biol 230, 543-571 11 Chatterjee S, Ghosh S & Vishveshwara S (2013) Mol Biosyst 9, 1774-88 12 Ghosh S & Vishveshwara S (2014) F1000Research 3, 17 13 Banerjee R, Sen M, Bhattacharyya D & Saha P (2003) J Mol Biol 333, 211–226 14 Basu S, Bhattacharyya D & Banerjee R (2012) Biophys J 102, 2605-2614 15 Basu S, Bhattacharyya D & Banerjee R (2013) J Bioinf Intell Control 2, 321-323 16 Lee B & Richards F M (1971) J Mol Biol 55, 379-400 17 Lawrence M C & Colman PM (1993) J Mol Biol 234, 946–950 18 Rocchia W S, Sridharan A, Nicholls E, Alexov A, Chiabrera A & Honig B (2002) J Comput Chem 23, 128-137 19 McCoy A J, Epa V C & Colman P M (1997) J Mol Biol 268, 570-584 20 Holm L & Rosenstrom P (2010) Nucl Acids Res 38, W545–549 21 Vriend G (1990) J Mol Graph 8, 52-55 22 Ramachandran G N & Sasisekharan V (1968) Adv Protein Chem 23, 283-437 23 Berkholz D S, Shapovalov M V, Dunbrack R L & Karplus P A (2009) Structure 17, 1316-1325 24 Word J M, Lovell S C, Richardson J S & Richardson D C (1999) J Mol Biol 285, 1735–1747 25 Brooks B R, Bruccoleri R E, Olafson B D, States D J, Swaminathan S & Karplus M (1983) J Comput Chem 4, 187-217 26 Murzin AG, Brenner SE, Hubbard T & Chothia C (1995) J Mol Biol 247, 536-540 27 Johnson M, Zaretskaya I, Raytselis Y, Merezhuk Y, McGinnis S & Madden T L (2008) Nucl Acids Res 36, W5-W9 28 Hooft R W W, Sander C & Vriend G (1996) Proteins 26, 363-376 29 Shapovalov M S & Dunbrack R L Jr (2011) Structure 19, 844-858 30 Laskowski R A, MacArthur M W, Moss D S & Thornton J M (1993) J Appl Crystallogr 26, 283-291 31 Davis I W, Leaver-Fay A, Chen V B, Block J N, Kapral G J, Wang X, Murray L W, Arendall W B, III, Snoeyink J, Richardson J S & Richardson DC (2007) Nucl Acids Res 35, W375–W383 32 Touw W G & Vriend G (2010) Acta Crystallogr D 66, 1341-1350 33 Sali A & Blundell T L (1993) J Mol Biol 234, 779-815