SlideShare uma empresa Scribd logo
1 de 7
Internal Quality Control In Blood Bank Testing

Internal Quality Control (IQC) is the backbone of any quality assurance program. Internal quality
control is the set of procedures undertaken by the staff of a laboratory for continuously and
concurrently assessing laboratory work and the emergent results, to decide whether they are reliable
enough to be released. It is meant to allow laboratory technicians to check their own performance and
help them to monitor the reliability of their technique. It maintains day to day working objectively and
detects any deviation very early like
Drift or trend - Seen when the control value moves progressively in one direction from the mean for a minimum
of three (3) days. Suggests that a problem is gradually developing, such as deterioration of a reagent or control.
Dispersion – Increase in Random Errors and Lack of Precision. Suggests inconsistency of technique or
fluctuations
in
instrumentation
function.
Shift – Abrupt changes observed when a problem develops suddenly. May be due to instrument malfunction or
an
error
in
technique.
QUALITY MANAGEMENT in blood transfusion service is concerned with every aspect of transfusion practice
and applies to all activities of a blood transfusion service. It involves identification and election of prospective
blood donors, adequate ollection of blood, preparation of blood components, quality laboratory testing and
ensuring
the
safest
and
most
appropriate
use
of
blood/blood
components.
When testing of blood & its components is performed, test may either be classified as:
QUANTITATIVE: Measures the amount of substance present like in TTD (ELISA,MILUMINESCENCE), Final
products
and
Donor
selection
parameters.
QUALITATIVE: Determines whether the substance being tested is present or absent like in Blood rouping,
rapid card tests etc.Internal quality control programme try to make things more objective than subjective and to
reduce interpersonal or inter organization errors/differences.

List of Qualitaive(QL) and Quantitaive (QN) tests done in blood bank
TESTS FOR
DONOR ELECTION

TESTS OF COLLECTED BLOO
PRODUCT

TEST OF FINAL PRE
TRANSFUSION

SEROLOGICAL TESTS DONE

Hemoglobin (QN)

HIV(QN)/(QL-CARD
TEST)

Hemoglobin
(QN)

Bloodgrouping (QL)

Platelet count (QN)

HBs Ag (QN)/ (QL-CARD
TEST)

PCV(QN)

Cross Matching (QL)

SerumAlbumin

HCV
TEST)

Platelet count
(QN)

Antibody screening /

(QN)/

(QL-CARD

(plasmaidentification

(QL)

Donors) (QN)
VDRL/RPR(QL)

pH (QN)

Direct
(QL)

Coombs

Test
MP (QL)

TRBC (QN)

Indirect Coombs Test
(QL)

TLC (QN)
Factor VIII (QN)
Fibrinogen (QN)
PTTK (QN)
Pyogenic Culture (QN)
EQUIPMENT/REAGENTS WHICH NEED IN-HOUSE CHECKS (IQC)
ELISA Reader/Kits
Blood grouping equipment/Reagents
Cross Matching cards/Antibody screening
Hematology analyzer/Reagents
pH meter
Rapid cards/RPR/MP
Coagulation analyzer

Internal Quality Control for Quantitative Tests
Implementing QC program for Quantitative tests operates on the following steps:
Select quality controls.
Collect at least 20 control values over a period of 20- 30 days for each level of control.
Perform statistical analysis.
Develop Levey-Jennings chart.
Monitor control values using the Levey-Jennings chart and/or Westgard rules.
Take immediate corrective action, if needed.
Record actions taken.
SELECTING CONTROL MATERIALS/CALIBRATORS
A calibrator has a known concentration of the substance (analyte) being measured. Calibrator is used to adjust
instrument, kit, test system in order to standardize the assay. Calibrator is not a control.
A control has a known range of the analyte. Usually 2 or 3 levels of controls are used based on the number of
tests run daily for a particular analyte. The controls should be run along with patient sample and are used to
validate day to day reliability of the test system.
Characteristics of Control materials
Different values covering all Medical decision points
Similar to the test specimen (matrix)
Available in large quantity
Stored in small aliquots
Ideally, should last for at least 1 year
Managing Control materials
Sufficient material from same lot number/ generation number or serum pool for one year’s testing
May be frozen, freeze dried, or chemically preserved
Requires very accurate reconstitution if this step is necessary
Always store as recommended by the manufacturer
Sources of QC samples
Appropriate diagnostic sample Obtained from:
Another Laboratory
EQA provider
Commercial product
Types of Control materials ASSAYED:
Mean

calculated

by

the

manufacturer

Must verify in the laboratory
UNASSAYED:
Less

expensive

Must perform data analysis
“HOMEMADE” OR “INHOUSE”:
Pooled

sera

collected

in

the

laboratory

Characterized
Preserved in small quantities for daily use
ANALYSIS OF QC RESULTS
Analytical tools are needed for the analysis of the QC data. Basic Statistical skills are required for the urpose
and form an important skill for the laboratory personnel. Levy Jennings’s (LJ) chart should be used to plot daily
QC values. It indicates the changes in trends and shifts of the laboratory performance.
Westgard rules should be used to interpret daily QC values. The level of QC applied in the laboratory varies
according to the number of specimens analyzed per day. A data set of at least 20 points should be obtained over
a 30 day period. These data points are used to calculate mean, standard deviation, coefficient of variation;
determine target ranges. It is made sure that all the procedural variation is represented including different
operators, different times of the day. Variability in the data is determined to establish the acceptable range.
MEASUREMENT OF VARIABILITY –
A certain amount of variability will naturally occur when a control is tested repeatedly. Variability is ffected by
operator technique, environmental conditions, and the performance characteristics of the assay method. The
goal is to differentiate between variability due to chance from that due to error. The terms used to describe
variability are: Range, Variance, Standard Deviation, Coefficient of Variation.
MEASUREMENT OF CENTRAL TENDENCY –

Data are frequently distributed about a central value or a central location. The measures are –
MEDIAN - The value at the center(midpoint) of the observations
MODE – The value which occurs with the greatest frequency
MEAN – The calculated average of the values
CALCULATION OF MEAN –
done using the standard formula keeping out of calculation the outliers (values which fall outside the
manufactures supplied control range).

MEAN FOR ELISA TEST
The calculation of mean is especially useful for ELISA test used in blood banks. The optical density (OD) values
and cut off (CO) for controls for each assay run is measured. The ratio of OD to CO (OD/CO) is calculated and
considered as a single data point. This ratio standardizes the data and is used to calculate the laboratory mean.
where X = OD/CO (OD- optical density; CO - cut off for control)

NORMAL DISTRIBUTION; X AXIS – RATIO OF OD/CO;
YAXIS – FREQUENCY
MEAN FOR HEMATOLOGY PARAMETERS
where X = value of test eg. Hb, Platelet count etc ACCURACY AND PRECISION

The degree of fluctuation in the measurement is indicative of the “precision” of the assay.
The closeness of measurements to the true value is indicative of the “accuracy” of the assay.
Quality control is used to monitor both the precision and the accuracy of the assay in order to
provide reliable results.
RANGE
Refers to the difference or spread between the highest and lowest observations. It is the simplest measure of
dispersion. It makes no assumption about the sahpe of he distribution or the central tendency of the data.
VARIANCE (S )
2

Is a measure of variability about the mean. It is calculated as the average squared deviation from the mean.
S=

?(X-X¯) =

2

2

mg /dl
2

2

N-1
DEGREES OF FREEDOM

Represents the number of independent data points that are contained in a data set.
The mean is calculated first, so the variance calculation has lost one degree of freedom (n-1).
CALCULATION OF STANDARD DEVIATION
The standard deviation is the square root of the variance; it is the square root of the average squared deviation
from the mean. SD is commonly used (rather that the variance) since it has the same units as the mean and the
original observations. SD is the principle calculation used in the laboratory to measure dispersion of a group of
values around a mean. Laboratories use the +/- 2SD criteria for the limits of the acceptable range for a test
meaning that when the QC measurement falls within that range, there is 95.5% confidence that the
measurement is correct. Only 4.5% of the time will a value fall outside of that range due to chance; more likely it
will be due to error. S = square root of (X-X¯) = mg/dl
N-1
S = square root of Variance
CALCULATION OF COEFFICIENT OF VARIATION
The CV is the standard deviation expressed as a percentage of the mean. Ideally it should be less than 5%.
CV = SD/mean X 100
2

MONITORING OF QC DATA
Levy Jennings’s (LJ) chart should be used to plot daily QC values for each run and make decisions regarding
acceptability of run. Monitoring should be done to
evaluate the precision and accuracy of repeated measurements. Charts needs to be reviewed at regular
intervals to take necessary action and
documented.
LEVEY-JENNINGS CHART
It is a graphical method for displaying control results and evaluating whether a procedure is in-control or out-ofcontrol. The control values are plotted versus time.
Lines are drawn from point to point to accent any trends, shifts or random excursions.
An example of a Levey-Jennings chart with upper and lower limits of one and two times the standard
deviation.
The control values in a L-J chart should be ideally clustered about the mean (+/- 2SD) with little variation in the
upward or downward direction.
IMPRECISION – large amount of scatter about the mean usually cause by error in the technique
INACCURACY – may be seen as a trend or a shift, usually caused by change in the testing process.
RANDOM ERROR - No pattern. Usually poor technique, malfunctioning equipment.
WESTGARDRULES
Multirule QC uses a combination of decision criteria, or control rules, to decide whether an analytical run s incontrol or outof- control. The well-known Westgard
multirole QC procedure uses 5 different control rules to judge the acceptability of an analytical run. By
comparison, a single-rule QC procedure uses a single
criterion or single set of control limits, such as a Levey-Jennings chart with control limits set as either the mean
plus or minus 2 standard deviations (2s) or the
mean plus or minus 3s. “Westgard rules” are generally used with 2 or 4 control measurements per run, which
means they are appropriate when two different
control materials are measured 1 or 2 times per material, which is the case in many chemistry applications.
Some alternative control rules are more suitable
when three control materials are analyzed, which is common for applications in hematology, coagulation, and
immunoassays.

1 Refers to a control rule that is commonly used with a Levey-Jennings chart when the control limits are set as
3s

the mean plus 3s and the mean minus 3s. A
run is rejected when a single control measurement exceeds the mean plus 3s or the mean minus 3s control limit.

1 Refers to the control rule that is commonly used with a Levey-Jennings chart when the control limits are set
2s
as the mean plus/minus 2s. In the original
Westgard multirule QC procedure, this rule is used as a warning rule to trigger careful inspection of the control
data by the following rejection rules.

2 Reject when 2 consecutive control measurements exceed the same mean plus 2s or the same mean minus
2s

2s control limit.

R Reject when 1 control measurement in a group exceeds the mean plus 2s and another exceeds the mean
4s

minus 2s.

4 Reject when 4 consecutive control measurements exceed the same mean plus 1s or the same mean minus
1s

1s control limit.

10 Reject when 10 consecutive control measurements fall on one side of the mean.
x

When a rule is violated; in case of WARNING RULE use other rules to inspect the control points. In case of
REJECTION RULE (Out of control) immediately stop testing – identify and correct the problem – repeat testing
on patient samples and controls – do not report patient results until problem is solved and controls indicate
proper performance.
For solving out of control problems there should be definite policies and procedures for remedial action;
troubleshooting guides and alternatives to run rejection

Internal Quality Control for Qualitative Tests
Qualitative test (rapid card) for transfusion transmitted disease with built in controls are adequate rovided the kit
has been qualified with at least one positive and one negative control from external sources (can e in-house
also). These shall be validated by two qualified personnel and documented. Qualitative test in blood group
serology is carried out daily and documented as follows:
Sr.
No

Reagents

Performance

Frequency Of Testing

Anti Human

Appearance, Reactivity And Specificity
1. Serum
Blood Grouping
Appearance,Specificity,Avidity,Reactivity,Potency
2. Serum
Antibody

3. Screening

4.
5.

And Appearance , ReactivityAnd Specificity

Daily
Daily
Lot

Reverse
Grouping Cells
Syphilis (Rapid
Positive And Negative Control (External)
Card)
Normal Salinee Appearance, Nacl Content, Ph, Haemolysisl

Each TestN
Daily

Daily Equipment/Reagents
Sr.
No

Equipment

Performance

1. Temperature Recorder
2. Refrigerator

Compare against thermometer

3. Gen Centrifuge

RPM

4. Blood bag

Centrifuge
Every

Frequency Of Testing

Temperature

Daily
Daily
Standardize speed before initial
use
RPM

Fortnight
5.
6.
7.
8.

Water bath
Auto-Clave
Cell counter

Balance
Weights 5mg-100g
9. Platelet Agitator
10. Laminar Flow hood
Gen/Electronic
thermometer

Observe temp
Observe temp

Calibration Reference sample
Analytical control.
6 Monthly
Frequency of agitation
Air pressure, clean
Observe temperature

Daily
Daily
Daily

Monthly
Monthly
Daily

IMPLEMENTATION OF INTERNAL QUALITY CONTROL PROGRAM
Establish written policies and procedures
Assign responsibility for monitoring and reviewing
Train staff
Obtain control materials
Collect data
Set target values (mean, SD)
Establish and implement troubleshooting and corrective action protocols
Establish and maintain system for documentation

Mais conteúdo relacionado

Mais procurados

Blood transfusion services qc
Blood transfusion services qcBlood transfusion services qc
Blood transfusion services qcNc Das
 
Internal quality control in clinical laboratories hematology(2)
Internal quality control in clinical laboratories hematology(2)Internal quality control in clinical laboratories hematology(2)
Internal quality control in clinical laboratories hematology(2)NAZAR ABU-DULLA
 
Automation in blood banking
Automation in blood bankingAutomation in blood banking
Automation in blood bankingShreya D Prabhu
 
Internal quality control
Internal quality controlInternal quality control
Internal quality controlSyed Basheer
 
Internal Quality Control Lecture MD General 2014 Course, Clin Path Ain Shams ...
Internal Quality Control Lecture MD General 2014 Course, Clin Path Ain Shams ...Internal Quality Control Lecture MD General 2014 Course, Clin Path Ain Shams ...
Internal Quality Control Lecture MD General 2014 Course, Clin Path Ain Shams ...Adel Elazab Elged
 
quality control in clinical pathology
quality control in clinical pathologyquality control in clinical pathology
quality control in clinical pathologyIshaque Vadakkethil
 
Blood components preparation and therapeutic uses final
Blood components preparation and therapeutic uses finalBlood components preparation and therapeutic uses final
Blood components preparation and therapeutic uses finalglobalsoin
 
Quality Control in a Medical Testing Laboratory
Quality Control in a Medical Testing LaboratoryQuality Control in a Medical Testing Laboratory
Quality Control in a Medical Testing LaboratoryDr. Bikash Kumar Chaudhury
 
Laboratory Internal Quality Control presentation master revision, 2014
Laboratory Internal Quality Control presentation master revision, 2014Laboratory Internal Quality Control presentation master revision, 2014
Laboratory Internal Quality Control presentation master revision, 2014Adel Elazab Elged
 
Quality Control In Clinical Laboratory
Quality Control In Clinical LaboratoryQuality Control In Clinical Laboratory
Quality Control In Clinical LaboratoryDr. Rajesh Bendre
 
PRE AND POST ANALYTICAL ERRORS
PRE AND POST ANALYTICAL ERRORSPRE AND POST ANALYTICAL ERRORS
PRE AND POST ANALYTICAL ERRORSMoustafa Rezk
 
Gel card technology ppt nc
Gel card technology ppt ncGel card technology ppt nc
Gel card technology ppt ncNainshi Bhatt
 
Pre analytic and postanalytic test management
Pre analytic and postanalytic test managementPre analytic and postanalytic test management
Pre analytic and postanalytic test managementVarsha Shahane
 
Blood products separation and quality control
Blood products separation and quality controlBlood products separation and quality control
Blood products separation and quality controlAppy Akshay Agarwal
 

Mais procurados (20)

Blood transfusion services qc
Blood transfusion services qcBlood transfusion services qc
Blood transfusion services qc
 
quality control in blood banking
quality control in blood bankingquality control in blood banking
quality control in blood banking
 
Quality assurance in a medical laboratory
Quality assurance in a medical laboratoryQuality assurance in a medical laboratory
Quality assurance in a medical laboratory
 
Internal quality control in clinical laboratories hematology(2)
Internal quality control in clinical laboratories hematology(2)Internal quality control in clinical laboratories hematology(2)
Internal quality control in clinical laboratories hematology(2)
 
Automation in blood banking
Automation in blood bankingAutomation in blood banking
Automation in blood banking
 
Internal quality control
Internal quality controlInternal quality control
Internal quality control
 
Internal Quality Control Lecture MD General 2014 Course, Clin Path Ain Shams ...
Internal Quality Control Lecture MD General 2014 Course, Clin Path Ain Shams ...Internal Quality Control Lecture MD General 2014 Course, Clin Path Ain Shams ...
Internal Quality Control Lecture MD General 2014 Course, Clin Path Ain Shams ...
 
Apheresis
ApheresisApheresis
Apheresis
 
quality control in clinical pathology
quality control in clinical pathologyquality control in clinical pathology
quality control in clinical pathology
 
Blood components preparation and therapeutic uses final
Blood components preparation and therapeutic uses finalBlood components preparation and therapeutic uses final
Blood components preparation and therapeutic uses final
 
Quality Control in a Medical Testing Laboratory
Quality Control in a Medical Testing LaboratoryQuality Control in a Medical Testing Laboratory
Quality Control in a Medical Testing Laboratory
 
Laboratory Internal Quality Control presentation master revision, 2014
Laboratory Internal Quality Control presentation master revision, 2014Laboratory Internal Quality Control presentation master revision, 2014
Laboratory Internal Quality Control presentation master revision, 2014
 
Quality Control In Clinical Laboratory
Quality Control In Clinical LaboratoryQuality Control In Clinical Laboratory
Quality Control In Clinical Laboratory
 
Quality Assurance in Hematology laboratory
Quality Assurance in Hematology laboratoryQuality Assurance in Hematology laboratory
Quality Assurance in Hematology laboratory
 
PRE AND POST ANALYTICAL ERRORS
PRE AND POST ANALYTICAL ERRORSPRE AND POST ANALYTICAL ERRORS
PRE AND POST ANALYTICAL ERRORS
 
Apheresis
ApheresisApheresis
Apheresis
 
Troubleshooting IQC / EQAS
Troubleshooting IQC / EQASTroubleshooting IQC / EQAS
Troubleshooting IQC / EQAS
 
Gel card technology ppt nc
Gel card technology ppt ncGel card technology ppt nc
Gel card technology ppt nc
 
Pre analytic and postanalytic test management
Pre analytic and postanalytic test managementPre analytic and postanalytic test management
Pre analytic and postanalytic test management
 
Blood products separation and quality control
Blood products separation and quality controlBlood products separation and quality control
Blood products separation and quality control
 

Semelhante a Internal quality control in blood bank testing

ANALYTICAL VARIABLES IN QUALITY CONTROL.pptx
ANALYTICAL VARIABLES IN QUALITY CONTROL.pptxANALYTICAL VARIABLES IN QUALITY CONTROL.pptx
ANALYTICAL VARIABLES IN QUALITY CONTROL.pptxDr. Jagroop Singh
 
Quality control
Quality controlQuality control
Quality controlSKYFALL
 
Quality control program 05042018
Quality control program 05042018Quality control program 05042018
Quality control program 05042018Syed Basheer
 
Haemoglobin quality control by maintaining levey jennings chart
Haemoglobin quality control by maintaining levey jennings chartHaemoglobin quality control by maintaining levey jennings chart
Haemoglobin quality control by maintaining levey jennings chartDr Rashmi Sood
 
Quality management system BY M .REJA
Quality management system BY M .REJAQuality management system BY M .REJA
Quality management system BY M .REJAMamunReja1
 
Quality Control for Quantitative Tests by Prof Aamir Ijaz (Pakistan)
Quality Control for Quantitative Tests by Prof Aamir Ijaz (Pakistan)Quality Control for Quantitative Tests by Prof Aamir Ijaz (Pakistan)
Quality Control for Quantitative Tests by Prof Aamir Ijaz (Pakistan)Aamir Ijaz Brig
 
Laboratory Quality Control .ppt
Laboratory Quality Control .pptLaboratory Quality Control .ppt
Laboratory Quality Control .pptABRARAHMED767665
 
Basics of quality assurance laboratory services
Basics of quality assurance laboratory servicesBasics of quality assurance laboratory services
Basics of quality assurance laboratory servicesAhmadAlnatour5
 
Basics of Quality Assurance-Medical Laboratory Services
Basics of Quality Assurance-Medical Laboratory ServicesBasics of Quality Assurance-Medical Laboratory Services
Basics of Quality Assurance-Medical Laboratory ServicesAhmad Al Natour
 
Quality Assurance and Quality Control
Quality Assurance and Quality ControlQuality Assurance and Quality Control
Quality Assurance and Quality ControlECRD IN
 
Quality assurance and quality control
Quality assurance and quality controlQuality assurance and quality control
Quality assurance and quality controlECRD2015
 
Chapter 12
Chapter 12Chapter 12
Chapter 12ECRD IN
 
Quality assurance in the department of clinical biochemistry
Quality assurance in the department of clinical biochemistryQuality assurance in the department of clinical biochemistry
Quality assurance in the department of clinical biochemistryDipesh Tamrakar
 
Data analysis ( Bio-statistic )
Data analysis ( Bio-statistic )Data analysis ( Bio-statistic )
Data analysis ( Bio-statistic )Amany Elsayed
 
Basic QC Statistics - Improving Laboratory Performance Through Quality Contro...
Basic QC Statistics - Improving Laboratory Performance Through Quality Contro...Basic QC Statistics - Improving Laboratory Performance Through Quality Contro...
Basic QC Statistics - Improving Laboratory Performance Through Quality Contro...Randox
 
2 lab qaqc-fall2013
2 lab qaqc-fall20132 lab qaqc-fall2013
2 lab qaqc-fall2013TAMUK
 

Semelhante a Internal quality control in blood bank testing (20)

ANALYTICAL VARIABLES IN QUALITY CONTROL.pptx
ANALYTICAL VARIABLES IN QUALITY CONTROL.pptxANALYTICAL VARIABLES IN QUALITY CONTROL.pptx
ANALYTICAL VARIABLES IN QUALITY CONTROL.pptx
 
Quality control
Quality controlQuality control
Quality control
 
Quality control chemical
Quality control chemicalQuality control chemical
Quality control chemical
 
Quality control.pptx
Quality control.pptxQuality control.pptx
Quality control.pptx
 
Quality control program 05042018
Quality control program 05042018Quality control program 05042018
Quality control program 05042018
 
Haemoglobin quality control by maintaining levey jennings chart
Haemoglobin quality control by maintaining levey jennings chartHaemoglobin quality control by maintaining levey jennings chart
Haemoglobin quality control by maintaining levey jennings chart
 
Quality management system BY M .REJA
Quality management system BY M .REJAQuality management system BY M .REJA
Quality management system BY M .REJA
 
Quality Control for Quantitative Tests by Prof Aamir Ijaz (Pakistan)
Quality Control for Quantitative Tests by Prof Aamir Ijaz (Pakistan)Quality Control for Quantitative Tests by Prof Aamir Ijaz (Pakistan)
Quality Control for Quantitative Tests by Prof Aamir Ijaz (Pakistan)
 
Quality management
Quality managementQuality management
Quality management
 
Laboratory Quality Control .ppt
Laboratory Quality Control .pptLaboratory Quality Control .ppt
Laboratory Quality Control .ppt
 
Basics of quality assurance laboratory services
Basics of quality assurance laboratory servicesBasics of quality assurance laboratory services
Basics of quality assurance laboratory services
 
Basics of Quality Assurance-Medical Laboratory Services
Basics of Quality Assurance-Medical Laboratory ServicesBasics of Quality Assurance-Medical Laboratory Services
Basics of Quality Assurance-Medical Laboratory Services
 
Quality Assurance and Quality Control
Quality Assurance and Quality ControlQuality Assurance and Quality Control
Quality Assurance and Quality Control
 
Quality assurance and quality control
Quality assurance and quality controlQuality assurance and quality control
Quality assurance and quality control
 
Chapter 12
Chapter 12Chapter 12
Chapter 12
 
Quality assurance in the department of clinical biochemistry
Quality assurance in the department of clinical biochemistryQuality assurance in the department of clinical biochemistry
Quality assurance in the department of clinical biochemistry
 
Clinical lab qc sethu
Clinical lab qc sethuClinical lab qc sethu
Clinical lab qc sethu
 
Data analysis ( Bio-statistic )
Data analysis ( Bio-statistic )Data analysis ( Bio-statistic )
Data analysis ( Bio-statistic )
 
Basic QC Statistics - Improving Laboratory Performance Through Quality Contro...
Basic QC Statistics - Improving Laboratory Performance Through Quality Contro...Basic QC Statistics - Improving Laboratory Performance Through Quality Contro...
Basic QC Statistics - Improving Laboratory Performance Through Quality Contro...
 
2 lab qaqc-fall2013
2 lab qaqc-fall20132 lab qaqc-fall2013
2 lab qaqc-fall2013
 

Último

[BuildWithAI] Introduction to Gemini.pdf
[BuildWithAI] Introduction to Gemini.pdf[BuildWithAI] Introduction to Gemini.pdf
[BuildWithAI] Introduction to Gemini.pdfSandro Moreira
 
AXA XL - Insurer Innovation Award Americas 2024
AXA XL - Insurer Innovation Award Americas 2024AXA XL - Insurer Innovation Award Americas 2024
AXA XL - Insurer Innovation Award Americas 2024The Digital Insurer
 
DEV meet-up UiPath Document Understanding May 7 2024 Amsterdam
DEV meet-up UiPath Document Understanding May 7 2024 AmsterdamDEV meet-up UiPath Document Understanding May 7 2024 Amsterdam
DEV meet-up UiPath Document Understanding May 7 2024 AmsterdamUiPathCommunity
 
"I see eyes in my soup": How Delivery Hero implemented the safety system for ...
"I see eyes in my soup": How Delivery Hero implemented the safety system for ..."I see eyes in my soup": How Delivery Hero implemented the safety system for ...
"I see eyes in my soup": How Delivery Hero implemented the safety system for ...Zilliz
 
Cloud Frontiers: A Deep Dive into Serverless Spatial Data and FME
Cloud Frontiers:  A Deep Dive into Serverless Spatial Data and FMECloud Frontiers:  A Deep Dive into Serverless Spatial Data and FME
Cloud Frontiers: A Deep Dive into Serverless Spatial Data and FMESafe Software
 
MS Copilot expands with MS Graph connectors
MS Copilot expands with MS Graph connectorsMS Copilot expands with MS Graph connectors
MS Copilot expands with MS Graph connectorsNanddeep Nachan
 
Spring Boot vs Quarkus the ultimate battle - DevoxxUK
Spring Boot vs Quarkus the ultimate battle - DevoxxUKSpring Boot vs Quarkus the ultimate battle - DevoxxUK
Spring Boot vs Quarkus the ultimate battle - DevoxxUKJago de Vreede
 
Cloud Frontiers: A Deep Dive into Serverless Spatial Data and FME
Cloud Frontiers:  A Deep Dive into Serverless Spatial Data and FMECloud Frontiers:  A Deep Dive into Serverless Spatial Data and FME
Cloud Frontiers: A Deep Dive into Serverless Spatial Data and FMESafe Software
 
ICT role in 21st century education and its challenges
ICT role in 21st century education and its challengesICT role in 21st century education and its challenges
ICT role in 21st century education and its challengesrafiqahmad00786416
 
Web Form Automation for Bonterra Impact Management (fka Social Solutions Apri...
Web Form Automation for Bonterra Impact Management (fka Social Solutions Apri...Web Form Automation for Bonterra Impact Management (fka Social Solutions Apri...
Web Form Automation for Bonterra Impact Management (fka Social Solutions Apri...Jeffrey Haguewood
 
How to Troubleshoot Apps for the Modern Connected Worker
How to Troubleshoot Apps for the Modern Connected WorkerHow to Troubleshoot Apps for the Modern Connected Worker
How to Troubleshoot Apps for the Modern Connected WorkerThousandEyes
 
Artificial Intelligence Chap.5 : Uncertainty
Artificial Intelligence Chap.5 : UncertaintyArtificial Intelligence Chap.5 : Uncertainty
Artificial Intelligence Chap.5 : UncertaintyKhushali Kathiriya
 
Polkadot JAM Slides - Token2049 - By Dr. Gavin Wood
Polkadot JAM Slides - Token2049 - By Dr. Gavin WoodPolkadot JAM Slides - Token2049 - By Dr. Gavin Wood
Polkadot JAM Slides - Token2049 - By Dr. Gavin WoodJuan lago vázquez
 
Strategies for Landing an Oracle DBA Job as a Fresher
Strategies for Landing an Oracle DBA Job as a FresherStrategies for Landing an Oracle DBA Job as a Fresher
Strategies for Landing an Oracle DBA Job as a FresherRemote DBA Services
 
Finding Java's Hidden Performance Traps @ DevoxxUK 2024
Finding Java's Hidden Performance Traps @ DevoxxUK 2024Finding Java's Hidden Performance Traps @ DevoxxUK 2024
Finding Java's Hidden Performance Traps @ DevoxxUK 2024Victor Rentea
 
Exploring Multimodal Embeddings with Milvus
Exploring Multimodal Embeddings with MilvusExploring Multimodal Embeddings with Milvus
Exploring Multimodal Embeddings with MilvusZilliz
 
Corporate and higher education May webinar.pptx
Corporate and higher education May webinar.pptxCorporate and higher education May webinar.pptx
Corporate and higher education May webinar.pptxRustici Software
 
Cyberprint. Dark Pink Apt Group [EN].pdf
Cyberprint. Dark Pink Apt Group [EN].pdfCyberprint. Dark Pink Apt Group [EN].pdf
Cyberprint. Dark Pink Apt Group [EN].pdfOverkill Security
 
2024: Domino Containers - The Next Step. News from the Domino Container commu...
2024: Domino Containers - The Next Step. News from the Domino Container commu...2024: Domino Containers - The Next Step. News from the Domino Container commu...
2024: Domino Containers - The Next Step. News from the Domino Container commu...Martijn de Jong
 
Axa Assurance Maroc - Insurer Innovation Award 2024
Axa Assurance Maroc - Insurer Innovation Award 2024Axa Assurance Maroc - Insurer Innovation Award 2024
Axa Assurance Maroc - Insurer Innovation Award 2024The Digital Insurer
 

Último (20)

[BuildWithAI] Introduction to Gemini.pdf
[BuildWithAI] Introduction to Gemini.pdf[BuildWithAI] Introduction to Gemini.pdf
[BuildWithAI] Introduction to Gemini.pdf
 
AXA XL - Insurer Innovation Award Americas 2024
AXA XL - Insurer Innovation Award Americas 2024AXA XL - Insurer Innovation Award Americas 2024
AXA XL - Insurer Innovation Award Americas 2024
 
DEV meet-up UiPath Document Understanding May 7 2024 Amsterdam
DEV meet-up UiPath Document Understanding May 7 2024 AmsterdamDEV meet-up UiPath Document Understanding May 7 2024 Amsterdam
DEV meet-up UiPath Document Understanding May 7 2024 Amsterdam
 
"I see eyes in my soup": How Delivery Hero implemented the safety system for ...
"I see eyes in my soup": How Delivery Hero implemented the safety system for ..."I see eyes in my soup": How Delivery Hero implemented the safety system for ...
"I see eyes in my soup": How Delivery Hero implemented the safety system for ...
 
Cloud Frontiers: A Deep Dive into Serverless Spatial Data and FME
Cloud Frontiers:  A Deep Dive into Serverless Spatial Data and FMECloud Frontiers:  A Deep Dive into Serverless Spatial Data and FME
Cloud Frontiers: A Deep Dive into Serverless Spatial Data and FME
 
MS Copilot expands with MS Graph connectors
MS Copilot expands with MS Graph connectorsMS Copilot expands with MS Graph connectors
MS Copilot expands with MS Graph connectors
 
Spring Boot vs Quarkus the ultimate battle - DevoxxUK
Spring Boot vs Quarkus the ultimate battle - DevoxxUKSpring Boot vs Quarkus the ultimate battle - DevoxxUK
Spring Boot vs Quarkus the ultimate battle - DevoxxUK
 
Cloud Frontiers: A Deep Dive into Serverless Spatial Data and FME
Cloud Frontiers:  A Deep Dive into Serverless Spatial Data and FMECloud Frontiers:  A Deep Dive into Serverless Spatial Data and FME
Cloud Frontiers: A Deep Dive into Serverless Spatial Data and FME
 
ICT role in 21st century education and its challenges
ICT role in 21st century education and its challengesICT role in 21st century education and its challenges
ICT role in 21st century education and its challenges
 
Web Form Automation for Bonterra Impact Management (fka Social Solutions Apri...
Web Form Automation for Bonterra Impact Management (fka Social Solutions Apri...Web Form Automation for Bonterra Impact Management (fka Social Solutions Apri...
Web Form Automation for Bonterra Impact Management (fka Social Solutions Apri...
 
How to Troubleshoot Apps for the Modern Connected Worker
How to Troubleshoot Apps for the Modern Connected WorkerHow to Troubleshoot Apps for the Modern Connected Worker
How to Troubleshoot Apps for the Modern Connected Worker
 
Artificial Intelligence Chap.5 : Uncertainty
Artificial Intelligence Chap.5 : UncertaintyArtificial Intelligence Chap.5 : Uncertainty
Artificial Intelligence Chap.5 : Uncertainty
 
Polkadot JAM Slides - Token2049 - By Dr. Gavin Wood
Polkadot JAM Slides - Token2049 - By Dr. Gavin WoodPolkadot JAM Slides - Token2049 - By Dr. Gavin Wood
Polkadot JAM Slides - Token2049 - By Dr. Gavin Wood
 
Strategies for Landing an Oracle DBA Job as a Fresher
Strategies for Landing an Oracle DBA Job as a FresherStrategies for Landing an Oracle DBA Job as a Fresher
Strategies for Landing an Oracle DBA Job as a Fresher
 
Finding Java's Hidden Performance Traps @ DevoxxUK 2024
Finding Java's Hidden Performance Traps @ DevoxxUK 2024Finding Java's Hidden Performance Traps @ DevoxxUK 2024
Finding Java's Hidden Performance Traps @ DevoxxUK 2024
 
Exploring Multimodal Embeddings with Milvus
Exploring Multimodal Embeddings with MilvusExploring Multimodal Embeddings with Milvus
Exploring Multimodal Embeddings with Milvus
 
Corporate and higher education May webinar.pptx
Corporate and higher education May webinar.pptxCorporate and higher education May webinar.pptx
Corporate and higher education May webinar.pptx
 
Cyberprint. Dark Pink Apt Group [EN].pdf
Cyberprint. Dark Pink Apt Group [EN].pdfCyberprint. Dark Pink Apt Group [EN].pdf
Cyberprint. Dark Pink Apt Group [EN].pdf
 
2024: Domino Containers - The Next Step. News from the Domino Container commu...
2024: Domino Containers - The Next Step. News from the Domino Container commu...2024: Domino Containers - The Next Step. News from the Domino Container commu...
2024: Domino Containers - The Next Step. News from the Domino Container commu...
 
Axa Assurance Maroc - Insurer Innovation Award 2024
Axa Assurance Maroc - Insurer Innovation Award 2024Axa Assurance Maroc - Insurer Innovation Award 2024
Axa Assurance Maroc - Insurer Innovation Award 2024
 

Internal quality control in blood bank testing

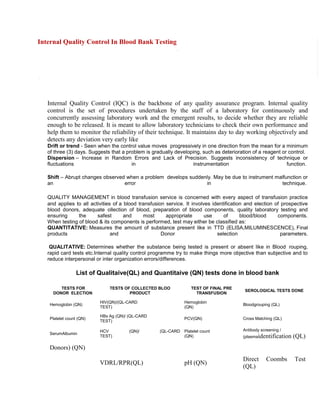
  • 1. Internal Quality Control In Blood Bank Testing Internal Quality Control (IQC) is the backbone of any quality assurance program. Internal quality control is the set of procedures undertaken by the staff of a laboratory for continuously and concurrently assessing laboratory work and the emergent results, to decide whether they are reliable enough to be released. It is meant to allow laboratory technicians to check their own performance and help them to monitor the reliability of their technique. It maintains day to day working objectively and detects any deviation very early like Drift or trend - Seen when the control value moves progressively in one direction from the mean for a minimum of three (3) days. Suggests that a problem is gradually developing, such as deterioration of a reagent or control. Dispersion – Increase in Random Errors and Lack of Precision. Suggests inconsistency of technique or fluctuations in instrumentation function. Shift – Abrupt changes observed when a problem develops suddenly. May be due to instrument malfunction or an error in technique. QUALITY MANAGEMENT in blood transfusion service is concerned with every aspect of transfusion practice and applies to all activities of a blood transfusion service. It involves identification and election of prospective blood donors, adequate ollection of blood, preparation of blood components, quality laboratory testing and ensuring the safest and most appropriate use of blood/blood components. When testing of blood & its components is performed, test may either be classified as: QUANTITATIVE: Measures the amount of substance present like in TTD (ELISA,MILUMINESCENCE), Final products and Donor selection parameters. QUALITATIVE: Determines whether the substance being tested is present or absent like in Blood rouping, rapid card tests etc.Internal quality control programme try to make things more objective than subjective and to reduce interpersonal or inter organization errors/differences. List of Qualitaive(QL) and Quantitaive (QN) tests done in blood bank TESTS FOR DONOR ELECTION TESTS OF COLLECTED BLOO PRODUCT TEST OF FINAL PRE TRANSFUSION SEROLOGICAL TESTS DONE Hemoglobin (QN) HIV(QN)/(QL-CARD TEST) Hemoglobin (QN) Bloodgrouping (QL) Platelet count (QN) HBs Ag (QN)/ (QL-CARD TEST) PCV(QN) Cross Matching (QL) SerumAlbumin HCV TEST) Platelet count (QN) Antibody screening / (QN)/ (QL-CARD (plasmaidentification (QL) Donors) (QN) VDRL/RPR(QL) pH (QN) Direct (QL) Coombs Test
  • 2. MP (QL) TRBC (QN) Indirect Coombs Test (QL) TLC (QN) Factor VIII (QN) Fibrinogen (QN) PTTK (QN) Pyogenic Culture (QN) EQUIPMENT/REAGENTS WHICH NEED IN-HOUSE CHECKS (IQC) ELISA Reader/Kits Blood grouping equipment/Reagents Cross Matching cards/Antibody screening Hematology analyzer/Reagents pH meter Rapid cards/RPR/MP Coagulation analyzer Internal Quality Control for Quantitative Tests Implementing QC program for Quantitative tests operates on the following steps: Select quality controls. Collect at least 20 control values over a period of 20- 30 days for each level of control. Perform statistical analysis. Develop Levey-Jennings chart. Monitor control values using the Levey-Jennings chart and/or Westgard rules. Take immediate corrective action, if needed. Record actions taken. SELECTING CONTROL MATERIALS/CALIBRATORS A calibrator has a known concentration of the substance (analyte) being measured. Calibrator is used to adjust instrument, kit, test system in order to standardize the assay. Calibrator is not a control. A control has a known range of the analyte. Usually 2 or 3 levels of controls are used based on the number of tests run daily for a particular analyte. The controls should be run along with patient sample and are used to validate day to day reliability of the test system. Characteristics of Control materials Different values covering all Medical decision points Similar to the test specimen (matrix) Available in large quantity Stored in small aliquots Ideally, should last for at least 1 year Managing Control materials
  • 3. Sufficient material from same lot number/ generation number or serum pool for one year’s testing May be frozen, freeze dried, or chemically preserved Requires very accurate reconstitution if this step is necessary Always store as recommended by the manufacturer Sources of QC samples Appropriate diagnostic sample Obtained from: Another Laboratory EQA provider Commercial product Types of Control materials ASSAYED: Mean calculated by the manufacturer Must verify in the laboratory UNASSAYED: Less expensive Must perform data analysis “HOMEMADE” OR “INHOUSE”: Pooled sera collected in the laboratory Characterized Preserved in small quantities for daily use ANALYSIS OF QC RESULTS Analytical tools are needed for the analysis of the QC data. Basic Statistical skills are required for the urpose and form an important skill for the laboratory personnel. Levy Jennings’s (LJ) chart should be used to plot daily QC values. It indicates the changes in trends and shifts of the laboratory performance. Westgard rules should be used to interpret daily QC values. The level of QC applied in the laboratory varies according to the number of specimens analyzed per day. A data set of at least 20 points should be obtained over a 30 day period. These data points are used to calculate mean, standard deviation, coefficient of variation; determine target ranges. It is made sure that all the procedural variation is represented including different operators, different times of the day. Variability in the data is determined to establish the acceptable range. MEASUREMENT OF VARIABILITY – A certain amount of variability will naturally occur when a control is tested repeatedly. Variability is ffected by operator technique, environmental conditions, and the performance characteristics of the assay method. The goal is to differentiate between variability due to chance from that due to error. The terms used to describe variability are: Range, Variance, Standard Deviation, Coefficient of Variation.
  • 4. MEASUREMENT OF CENTRAL TENDENCY – Data are frequently distributed about a central value or a central location. The measures are – MEDIAN - The value at the center(midpoint) of the observations MODE – The value which occurs with the greatest frequency MEAN – The calculated average of the values CALCULATION OF MEAN – done using the standard formula keeping out of calculation the outliers (values which fall outside the manufactures supplied control range). MEAN FOR ELISA TEST The calculation of mean is especially useful for ELISA test used in blood banks. The optical density (OD) values and cut off (CO) for controls for each assay run is measured. The ratio of OD to CO (OD/CO) is calculated and considered as a single data point. This ratio standardizes the data and is used to calculate the laboratory mean. where X = OD/CO (OD- optical density; CO - cut off for control) NORMAL DISTRIBUTION; X AXIS – RATIO OF OD/CO; YAXIS – FREQUENCY MEAN FOR HEMATOLOGY PARAMETERS where X = value of test eg. Hb, Platelet count etc ACCURACY AND PRECISION The degree of fluctuation in the measurement is indicative of the “precision” of the assay. The closeness of measurements to the true value is indicative of the “accuracy” of the assay. Quality control is used to monitor both the precision and the accuracy of the assay in order to provide reliable results. RANGE Refers to the difference or spread between the highest and lowest observations. It is the simplest measure of dispersion. It makes no assumption about the sahpe of he distribution or the central tendency of the data. VARIANCE (S ) 2 Is a measure of variability about the mean. It is calculated as the average squared deviation from the mean. S= ?(X-X¯) = 2 2 mg /dl 2 2 N-1 DEGREES OF FREEDOM Represents the number of independent data points that are contained in a data set. The mean is calculated first, so the variance calculation has lost one degree of freedom (n-1). CALCULATION OF STANDARD DEVIATION The standard deviation is the square root of the variance; it is the square root of the average squared deviation
  • 5. from the mean. SD is commonly used (rather that the variance) since it has the same units as the mean and the original observations. SD is the principle calculation used in the laboratory to measure dispersion of a group of values around a mean. Laboratories use the +/- 2SD criteria for the limits of the acceptable range for a test meaning that when the QC measurement falls within that range, there is 95.5% confidence that the measurement is correct. Only 4.5% of the time will a value fall outside of that range due to chance; more likely it will be due to error. S = square root of (X-X¯) = mg/dl N-1 S = square root of Variance CALCULATION OF COEFFICIENT OF VARIATION The CV is the standard deviation expressed as a percentage of the mean. Ideally it should be less than 5%. CV = SD/mean X 100 2 MONITORING OF QC DATA Levy Jennings’s (LJ) chart should be used to plot daily QC values for each run and make decisions regarding acceptability of run. Monitoring should be done to evaluate the precision and accuracy of repeated measurements. Charts needs to be reviewed at regular intervals to take necessary action and documented. LEVEY-JENNINGS CHART It is a graphical method for displaying control results and evaluating whether a procedure is in-control or out-ofcontrol. The control values are plotted versus time. Lines are drawn from point to point to accent any trends, shifts or random excursions. An example of a Levey-Jennings chart with upper and lower limits of one and two times the standard deviation. The control values in a L-J chart should be ideally clustered about the mean (+/- 2SD) with little variation in the upward or downward direction. IMPRECISION – large amount of scatter about the mean usually cause by error in the technique INACCURACY – may be seen as a trend or a shift, usually caused by change in the testing process. RANDOM ERROR - No pattern. Usually poor technique, malfunctioning equipment. WESTGARDRULES Multirule QC uses a combination of decision criteria, or control rules, to decide whether an analytical run s incontrol or outof- control. The well-known Westgard multirole QC procedure uses 5 different control rules to judge the acceptability of an analytical run. By comparison, a single-rule QC procedure uses a single criterion or single set of control limits, such as a Levey-Jennings chart with control limits set as either the mean plus or minus 2 standard deviations (2s) or the mean plus or minus 3s. “Westgard rules” are generally used with 2 or 4 control measurements per run, which means they are appropriate when two different control materials are measured 1 or 2 times per material, which is the case in many chemistry applications. Some alternative control rules are more suitable when three control materials are analyzed, which is common for applications in hematology, coagulation, and immunoassays. 1 Refers to a control rule that is commonly used with a Levey-Jennings chart when the control limits are set as 3s the mean plus 3s and the mean minus 3s. A run is rejected when a single control measurement exceeds the mean plus 3s or the mean minus 3s control limit. 1 Refers to the control rule that is commonly used with a Levey-Jennings chart when the control limits are set 2s
  • 6. as the mean plus/minus 2s. In the original Westgard multirule QC procedure, this rule is used as a warning rule to trigger careful inspection of the control data by the following rejection rules. 2 Reject when 2 consecutive control measurements exceed the same mean plus 2s or the same mean minus 2s 2s control limit. R Reject when 1 control measurement in a group exceeds the mean plus 2s and another exceeds the mean 4s minus 2s. 4 Reject when 4 consecutive control measurements exceed the same mean plus 1s or the same mean minus 1s 1s control limit. 10 Reject when 10 consecutive control measurements fall on one side of the mean. x When a rule is violated; in case of WARNING RULE use other rules to inspect the control points. In case of REJECTION RULE (Out of control) immediately stop testing – identify and correct the problem – repeat testing on patient samples and controls – do not report patient results until problem is solved and controls indicate proper performance. For solving out of control problems there should be definite policies and procedures for remedial action; troubleshooting guides and alternatives to run rejection Internal Quality Control for Qualitative Tests Qualitative test (rapid card) for transfusion transmitted disease with built in controls are adequate rovided the kit has been qualified with at least one positive and one negative control from external sources (can e in-house also). These shall be validated by two qualified personnel and documented. Qualitative test in blood group serology is carried out daily and documented as follows: Sr. No Reagents Performance Frequency Of Testing Anti Human Appearance, Reactivity And Specificity 1. Serum Blood Grouping Appearance,Specificity,Avidity,Reactivity,Potency 2. Serum Antibody 3. Screening 4. 5. And Appearance , ReactivityAnd Specificity Daily Daily Lot Reverse Grouping Cells Syphilis (Rapid Positive And Negative Control (External) Card) Normal Salinee Appearance, Nacl Content, Ph, Haemolysisl Each TestN Daily Daily Equipment/Reagents Sr. No Equipment Performance 1. Temperature Recorder 2. Refrigerator Compare against thermometer Compare against thermometer 3. Gen Centrifuge RPM 4. Blood bag Centrifuge Every Frequency Of Testing Temperature Daily Daily Standardize speed before initial use RPM Fortnight
  • 7. 5. 6. 7. 8. Water bath Auto-Clave Cell counter Balance Weights 5mg-100g 9. Platelet Agitator 10. Laminar Flow hood Gen/Electronic thermometer Observe temp Observe temp Calibration Reference sample Analytical control. 6 Monthly Frequency of agitation Air pressure, clean Observe temperature Daily Daily Daily Monthly Monthly Daily IMPLEMENTATION OF INTERNAL QUALITY CONTROL PROGRAM Establish written policies and procedures Assign responsibility for monitoring and reviewing Train staff Obtain control materials Collect data Set target values (mean, SD) Establish and implement troubleshooting and corrective action protocols Establish and maintain system for documentation