1. USING EXCEL TO FOR DESCRIPTIVE STATISTICS
Application 1 (pg 26) Study Guide
1. Make sure you have the Analysis ToolPak loaded onto Excel. If it is not loaded read the Excel
Instructions for loading the Analysis ToolPak (found on course website).
2. Open a new Excel worksheet and type in the stress inventory scores on page 26 of the Study Guide
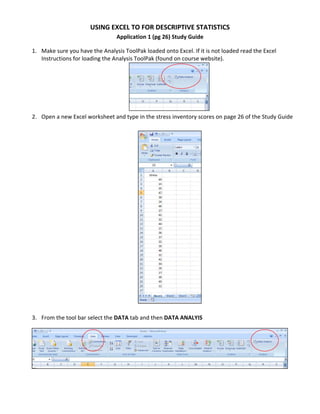
3. From the tool bar select the DATA tab and then DATA ANALYIS
2. 4. Select Descriptive Statistics then click OK
5. Click on the input range and highlight cells A1 through A26. Make sure that the Grouped by
Columns button is clicked and the boxes next Labels in first row and Summary Statistics are also
clicked.
6. Click the Output Range box and click on cell B2 in the spreadsheet and click OK.