
Recomendados
Recomendados
Mais conteúdo relacionado
Semelhante a Due Tues., May 2- 7 questions Big Time Picture Frames h.docx
Semelhante a Due Tues., May 2- 7 questions Big Time Picture Frames h.docx (20)
Mais de sagarlesley
Mais de sagarlesley (20)
Último
Último (20)
Due Tues., May 2- 7 questions Big Time Picture Frames h.docx
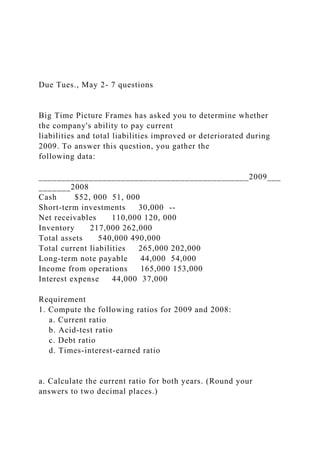
- 1. Due Tues., May 2- 7 questions Big Time Picture Frames has asked you to determine whether the company's ability to pay current liabilities and total liabilities improved or deteriorated during 2009. To answer this question, you gather the following data: ______________________________________________2009___ _______2008 Cash $52, 000 51, 000 Short-term investments 30,000 -- Net receivables 110,000 120, 000 Inventory 217,000 262,000 Total assets 540,000 490,000 Total current liabilities 265,000 202,000 Long-term note payable 44,000 54,000 Income from operations 165,000 153,000 Interest expense 44,000 37,000 Requirement 1. Compute the following ratios for 2009 and 2008: a. Current ratio b. Acid-test ratio c. Debt ratio d. Times-interest-earned ratio a. Calculate the current ratio for both years. (Round your answers to two decimal places.)
- 2. 2009: nothing 2008: nothing The Variline Inc., comparative income statement follows. 2010 data are given as needed. Variline, Inc. Comparative Income Statement Years Ended December 31, 2012 and 2011 (Dollars in thousands) 2012 2011 2010 Net sales $176,000 $160,000 Cost of goods sold 93,600 86,000 Selling and general expenses 46,800 41,400 Interest expense 9,600 10,900 Income tax expense 10,200 9,200 Net income $15,800 $12,500 Additional data:
- 3. Total assets $201,000 $192,000 $174,000 Common stockholders' equity $96,900 $89,800 $79,500 Preferred dividends $3,400 $3,400 $0 Common shares outstanding during the year 20,000 20,000 18,000 Requirements 1. Calculate the rate of return on net sales. 2. Calculate the rate of return on total assets. 3. Calculate the rate of return on common stockholders' equity. 4. Calculate the EPS. 5. Did the company's operating performance improve or deteriorate during 2012? Requirement 1. Calculate the rates of return on net sales for 2012 and 2011. (Round your answers to three decimal places.) 2012: nothing 2011: nothing
- 4. The Specialty Department Stores, Inc., chief executive officer (CEO) has asked you to compare the company's profit performance and financial position with the average for the industry. The CEO has given you the company's income statement and balance sheet, as well as the industry average data for retailers. Specialty Department Stores, Inc. Income Statement Compared with Industry Average Year Ended December 31, 2010 Industry Specialty Average Net sales $782,000 100.0 % Cost of goods sold 526,286 65.8 Gross profit 255,714 34.2 Operating expenses 164,220 19.7
- 5. Operating income 91,494 14.5 Other expenses 6,256 0.4 Net income $85,238 14.1 % Specialty Department Stores, Inc. Balance Sheet Compared with Industry Average December 31, 2010 Industry Specialty Average Current assets $324,960 70.9 % Fixed assets, net 123,840 23.6 Intangible assets, net 8,160 0.8 Other assets 23,040 4.7 Total assets $480,000 100.0 % Current liabilities $221,760 48.1 %
- 6. Long-term liabilities 106,560 16.6 Stockholders' equity 151,680 35.3 Total liabilities and stockholders' equity $480,000 100.0 % Requirements 1. Prepare a common-size income statement and balance sheet for Specialty. The first column of each statement should present Specialty common-size statement, and the second column, the industry averages. 2. For the profitability analysis, compute Specialty's (a) ratio of gross profit to net sales, (b) ratio of operating income to net sales, and (c) ratio of net income to net sales. Compare these figures with the industry averages. Is Specialty's profit performance better or worse than the industry average? 3. For the analysis of financial position, compute Specialty's (a) ratio of current assets to total assets and (b) ratio of stockholders' equity to total assets. Compare these ratios with the industry averages. Is Specialty's financial position better or worse than the industry averages?
- 7. Requirement 1. Prepare a common-size income statement for Specialty Department Stores. (Round your answers to one decimal place.) Specialty Department Stores, Inc. Common-Size Income Statement Compared to Industry Average Year Ended December 31, 2010 Specialty Industry (%) Average (%) Net sales 100.0 Cost of goods sold 65.8 Gross profit 34.2 Operating expenses 19.7 Operating income 14.5 Other expenses 0.4 Net income 14.1
- 8. Financial statement data of Modern Traveler Magazine include the following items (dollars in thousands): Cash. . . . . . . . . . . . . . . . . . . . . . . . $24,000 Accounts receivable, net. . . . . . . . $78,000 Inventories. . . . . . . . . . . . . . . . . $187,000 Total assets. . . . . . . . . . . . . . . . . . $639,000 Short-term notes payable. . . . . . . $48,000 Accounts payable. . . . . . . . . . . . . . $102,000 Accrued liabilities. . . . . . . . . . . . . . $37,000
- 9. Long-term liabilities. . . . . . . . . . . . $225,000 Net income. . . . . . . . . . . . . . . . . . . $73,000 Common shares outstanding. . . . . 20,000 Requirements 1. Compute Modern Traveler's current ratio, debt ratio, and earnings per share. Round all ratios to two decimal places. 2. Compute the three ratios after evaluating the effect of each transaction that follows. Consider each transaction separately. a. Purchased inventory of $48,000 on account b. Borrowed $125,000 on a long-term note payable c. Issued 2,000 shares of common stock, receiving cash of $105,000 d. Received cash on account, $8,000 Requirement 1. Compute
- 10. Modern TravelerModern Traveler's current ratio, debt ratio, and earnings per share. Round all ratios to two decimal places. Current Ratio Debt Ratio Earnings Per Share The Arborists provide tree-spraying services in the company's home county John Renkas, the owner, incurred the following operating costs for the month of August 2012: Salaries and wages. . . . . . . . . . . . . . . . . . . . . $6,000 Chemicals. . . . . . . . . . . . . . . . . . . . . . . . . . . . . 4,900 Depreciation on truck. . . . . . . . . . . . . . . . . . . . 450 Depreciation on building and equipment. . . . . 700
- 11. Supplies expense. . . . . . . . . . . . . . . . . . . . . . . 400 Gasoline and utilities. . . . . . . . . . . . . . . . . . . . 5,590 The Arborists earned $22,000 in revenues for the month of August by spraying trees totaling 25,000 feet in height. Requirements 1. Prepare an income statement for the month of August. Compute the ratio of total operating expense to total revenue and operating income to total revenue. 2. Compute the unit operating cost of spraying one foot of tree height. 3. The manager of The Arborists must keep unit operating cost below $0.50 per foot in order to get his bonus. Did he meet the goal? 4. What kind of system could The Arborists use to integrate all its data? Requirement 1. Prepare an income statement for the month of August. Compute the ratio of total operating expense to total revenue and operating income to total revenue. (Round the ratios to the nearest whole number.)
- 12. The Arborists Income Statement Month Ended August 31, 2012 Chemicals, Depreciation on bldg. & equip, Depreciation on truck, Gasoline & utilities, Net operating income, Net operating loss, Salaries 7 wages, Sales revenue, Supplies expense, Total operating expenses % % % Choose from any list or enter any number in the input fields and
- 13. then click Check Answer. In 2011 Chris Gonzales opened Chris' Pets, a small retail shop selling pet supplies. On December, 31, 2011, Chris's accounting records showed the following: Inventory on December 31, 2011 $10,250 Inventory on January 1, 2011 15,400 Sales revenue 52,000
- 14. Utilities for shop 3,300 Rent for shop 4,100 Sales commissions 2,550 Purchases of merchandise 24,000 Requirement 1. Prepare an income statement for Chris' Pets, a merchandiser, for the year ended December 31, 2011. Chris' Pets Income Statement Year Ended December 31, 2011 Advert. Expense, Beginning inventory, Cost of goods avail. for sale, Cost of goods sold, Ending inventory, Gross profit, Operating profit, Operating loss, Purchases of merch., Rent exp., Sales commissions exp., Sales Rev., Utilities exp. Cost of goods sold:
- 15. Cost of goods sold Gross profit Operating expenses: Craig’s Pets succeeded so well that Craig decided to manufacture his own brand of chewing bone—Fido TreatsFido Treats. At the end of December 2011, his accounting records showed the following: Inventories: Beginning Ending Materials $13,500 $9,000 Work in process 0 1,250
- 16. Finished goods 0 5,200 Other information: Direct material purchases $31,000 Utilities for plant $1,100 Plant janitorial services 500 Rent on plant 13,000 Sales salaries expense 5,800 Customer service hotline expense 1,700 Delivery expense 1,400 Direct labor 17,000 Sales revenue 111,000 Requirements 1. Prepare a schedule of cost of goods manufactured for Fido
- 17. Treats for the year ended December 31, 2011. 2. Prepare an income statement for Fido Treatsfor the year ended December 31, 2011. 3. How does the format of the income statement for Fido Treats differ from the income statement of a merchandiser? 4. Fido Treats manufactured 17,800 units of its product in 2011. Compute the company's unit product cost for the year. Requirement 1. Prepare the schedule of cost of goods manufactured for Fido Treats. (For accounts with a $0 balance, make sure to enter "0" in the appropriate column.) Fido Treats Schedule of Cost of Goods Manufactured Year Ended December 31, 2011 Avail. For use, Begin materials invent., Begin work in progress invent., Cost of goods manfac., Deprec., exp. on plant equip., Direct labor, Direct materials used., Ending materials invent., Ending work in process invent., Plant janitorial serv., Purch., of direct
- 18. materials, Rent on plant., Total manfac. cost incurred during year., Total manfac. cost to account for, Utilities for plant Add: Direct materials used Direct materials used Manufacturing overhead: Total manufacturing costs incurred during the year Total manufacturing costs to account for Less: Cost of goods manufactured KP Mission Kaiser Permanente exists to provide high-quality, affordable health care services and to improve the health of our members
- 19. and the communities we serve.KP Vision We are trusted partners in total health, collaborating with people to help them thrive and creating communities that are among the healthiest in the nation. Strategy To advance our mission on affordability, we need to: · perform by transforming care, coverage, and cost · grow through both core and new opportunities · lead by increasing our relevance as a force for change in health care Affordability thru performance, Growth and Leadership Fast Facts About Kaiser Permanente Founded in 1945, Kaiser Permanente is one of the nation’s largest not-for-profit health plans, serving more than 11.3 million members, with headquarters in Oakland, California. It comprises: · Kaiser Foundation Hospitals and their subsidiaries · Kaiser Foundation Health Plan, Inc. · The Permanente Medical Groups. At Kaiser Permanente, physicians are responsible for medical decisions. The Permanente Medical Groups, which provide care for Kaiser Permanente members, continuously develop and refine medical practices to help ensure that care is delivered in the most efficient and effective manner possible.Health Plan Membership, by Region Northern California: 3,992,501 Southern California: 4,264,119 Colorado: 663,240 Georgia:
- 20. 284,213 Hawaii: 249,687 Mid-Atlantic States (VA, MD, DC): 665,402 Northwest (Oregon/Washington): 552,651 Washington: 651,000 Data as of December 31, 2016 unless otherwise noted.Medical facilities and physicians Hospitals: 38 Medical Offices: 668 Physicians: Approximate, representing all specialties 21,275 Nurses: Approximate, representing all specialties 54,072 Employees: Approximate, representing technical, administrative and clerical employees and caregivers 201,024 Washington (Group Health) data as of December 31, 2016 combined with Kaiser Permanente data from December 31, 2016 unless otherwise noted.Annual Operating Revenue 2016: 64.6 billion2015:60.7 billion 2014: $56.4 billion 2013: $53.1 billion 2012: $50.6 billion 2011: $47.9 billion 2010: $44.2 billion 2009: $42.1 billion 2008: $40.3 billion
- 21. T H E Responses Responses Consumer Expectations Reducing Resources Increasing Cost & Demand Health Market
- 22. 2016 Strategic Plan Update
- 23. 1 In 2014, We Set Out the Perform, Grow, Lead Strategy CONFIDENTIAL AND PROPRIETARY. INTERNAL USE ONLY. DO NOT DISTRIBUTE. 2 2 Since 2014, We Have Increased Strategic Focus in Key Areas CONFIDENTIAL AND PROPRIETARY. INTERNAL USE ONLY. DO NOT DISTRIBUTE. 3 2014 2015
- 24. 2016 One KP Care Transformation Cost Structure Health Plan Services People Technology Core Contiguous New Affordability Quality Total Health One KP Consumer Digital Strategy Privacy and Security Line of Business Mountain Colorado Affordability Definition Vision 2025 Medicaid Eugene, OR Santa Cruz, CA Group Health Cooperative Maui Memorial Affordability Measurement Advocacy School of Medicine Diversity and Inclusion Total Health Impact
- 25. Experience Standards Behavioral Health Virtual Care Maternal and Child Health Enterprise People Strategy Capacity Evaluation Perform Grow Lead 3 2016
- 26. Over The Last Three Years, We Have Performed Well CONFIDENTIAL AND PROPRIETARY. INTERNAL USE ONLY. DO NOT DISTRIBUTE. 4 Membership Growth (millions) Expense Trends (Per Member, Per Month) Pricing* (Average rate increases, KP vs competitors) *Large Commercial Group Rate Increases (Post Buy- Down/Mitigation), Towers Watson Survey 5.6% Average Growth 2014-16 1.6% Average Growth 2011-13 700K More members than forecasted in the 2014 Strategic Plan (10M planned) 2.2% Lower rate increase than competitors, on average 2.6% Lower than the prior 3-year average from 2011-2013 2010 2013
- 27. 4 Competitor 2008-2010 2011-2013 2014-2016 6.3E-2 5.0999999999999997E-2 4.7E-2 KP 2008-2010 2011-2013 2014-2016 6.9000000000000006E-2 4.7E-2 2.5000000000000001E-2 We Have Also Advanced Our Measurement of Affordability CONFIDENTIAL AND PROPRIETARY. INTERNAL USE ONLY. DO NOT DISTRIBUTE. 5 In 2015, KP Care and Coverage is affordable for 80% of people living in our communities.
- 28. We must continue with low trends to enable affordable rates. Service levels declined slightly and will be a focus. PERFORM > We Continue to Work on High-Quality, Affordable Care 6 Note: NCQA’s HEDIS Composite is the most widely used standardized set of performance metrics used to report health care quality. HCAHPS is the most widely used metric to report hospital care service experience. Expense Trends (PMPM) National 75th Percentile Kaiser Permanente We sustained high-quality care during growth. Kaiser Permanente National 90th Percentile HCAHPS National 75th Percentile Baseline Trend 2016 Plan CONFIDENTIAL AND PROPRIETARY. INTERNAL USE ONLY. DO NOT DISTRIBUTE.
- 29. HEDIS Performance Measures 6 75th 2008 2009 2010 2011 2012 2013 2014 2015 70 71 72 73.3 75 76 76 77 KP 2008 2009 2010 2011 2012 2013 2014 2015 59.5 64.099999999999994 67.900000000000006 71.599999999999994 73.3 75 75.5 75.099999999999994 PERFORM > People Strategy: Underpins Everything We Do 7 Our People Strategy is an essential tool for creating and supporting an organization where we all can say this: “I am at my best. I am valued and supported. I make a difference. I am part of a great cause. I am KP.” CONFIDENTIAL AND PROPRIETARY. INTERNAL USE
- 30. ONLY. DO NOT DISTRIBUTE. 7 CONFIDENTIAL AND PROPRIETARY. INTERNAL USE ONLY. DO NOT DISTRIBUTE. GROW > Three Years of Accelerated Growth Is Stabilizing 8 Total Membership (Millions) 9.1 10.7 11.5 2.6% Average Growth 5.6% Average Growth Consumers have increasingly chosen KP since 2013. Growth is stabilizing post-ACA and we will grow to over 11.5 million members by 2019, with an increasing number of Individual and Medicare members. CONFIDENTIAL AND PROPRIETARY. INTERNAL USE
- 31. ONLY. DO NOT DISTRIBUTE. 8 GROW > Group Health Cooperative Will Become KP Washington CONFIDENTIAL AND PROPRIETARY. INTERNAL USE ONLY. DO NOT DISTRIBUTE. 9 In 2017, KP will launch our brand in Washington and offer high quality, more affordable care for Washington communities. We are expanding to nearby communities in every region and seeking new growth opportunities. LEAD > We Are Driving Health Care Change CONFIDENTIAL AND PROPRIETARY. INTERNAL USE ONLY. DO NOT DISTRIBUTE.
- 32. 10 We advocate for providing the best care in the most effective way. Our Total Health strategy addresses societal, economic, and behavioral factors on our communities. Diversity and Inclusion actions involve perspectives from Care, Workplace, Marketplace, Supplier Partnerships, and Compliance. The School of Medicine teaches our preventive, evidence-based care beyond traditional care settings. 10 LOOKING AHEAD > Broadening Our Vision and Impact CONFIDENTIAL AND PROPRIETARY. INTERNAL USE ONLY. DO NOT DISTRIBUTE. 11 OUR VISION: We are trusted partners in total health, collaborating with people to help them thrive, creating communities that are among the healthiest in the nation, and inspiring greater health for America and the world.
- 33. Strategic Goal Alignment 12Add each business goal or objective hereAdd each business goal or objective hereAdd each business goal or objective hereAdd each business goal or objective here CONFIDENTIAL AND PROPRIETARY. INTERNAL USE ONLY. DO NOT DISTRIBUTE. 1 3 Activity: How Can You Support KP’s Strategic Plan? 13 Review Kaiser Permanente’s strategic plan. Identify at least one of the plan components (Perform, Grow, and Lead) that you think your team should focus on this year. Discuss your ideas with your partner. Write down the business objectives that you hope to achieve on the activity worksheet. (Consider using the SMART* model to define your goals.) Talk about it for 5 minutes.
- 34. 2 *SMART goals are specific, measurable, attainable, realistic, and timely/tangible CONFIDENTIAL AND PROPRIETARY. INTERNAL USE ONLY. DO NOT DISTRIBUTE. Action Plan 14 Review Kaiser Permanente’s strategic plan with your team members. Brainstorm ways that you and your team can support our strategy through the framework of Perform, Grow, Lead. Set SMART goals with your team members that you intend to achieve this year. 1 2 3 Focus on Affordability “We need to become an organization that is truly focused on meeting the needs of consumers. To do that, we need to create the best experiences for our members and consumers, no matter where or how they come in contact with us. That is the essence of One KP.” — Bernard Tyson
- 35. Chairman and CEO Kaiser Permanente CONFIDENTIAL AND PROPRIETARY. INTERNAL USE ONLY. DO NOT DISTRIBUTE. 15 share.kp.org/strategy Visit KP’s national strategy website: Our mission is to provide high-quality, affordable health care services and to improve the health of our members and the communities we serve CONFIDENTIAL AND PROPRIETARY. INTERNAL USE ONLY. DO NOT DISTRIBUTE. 15 8.7 9.1 10.7 2008-20102011-20132014-2016 6.1%4.3%1.7%2008-20102011-20132014-2016