SPECTROSCOPIC CONFIRMATION OF THE EXISTENCE OF LARGE, DIFFUSE GALAXIES IN THE COMA CLUSTER

We recently identified a population of low surface brightness objects in the field of the z = 0.023 Coma cluster, using the Dragonfly Telephoto Array. Here we present Keck spectroscopy of one of the largest of these “ultradiffuse galaxies” (UDGs), confirming that it is a member of the cluster. The galaxy has prominent absorption features, including the Ca II H+K lines and the G-band, and no detected emission lines. Its radial velocity of cz=6280±120 km s−1 is within the 1σ velocity dispersion of the Coma cluster. The galaxy has an effective radius of 4.3 ± 0.3 kpc and a Sérsic index of 0.89 ± 0.06, as measured from Keck imaging. We find no indications of tidal tails or other distortions, at least out to a radius of ∼2re. We show that UDGs are located in a previously sparsely populated region of the size—magnitude plane of quiescent stellar systems, as they are ∼6 mag fainter than normal early-type galaxies of the same size. It appears that the luminosity distribution of large quiescent galaxies is not continuous, although this could largely be due to selection effects. Dynamical measurements are needed to determine whether the dark matter halos of UDGs are similar to those of galaxies with the same luminosity or to those of galaxies with the same size.

Recomendados
Recomendados
Mais conteúdo relacionado
Mais procurados
Mais procurados (20)
Destaque
Destaque (16)
Semelhante a SPECTROSCOPIC CONFIRMATION OF THE EXISTENCE OF LARGE, DIFFUSE GALAXIES IN THE COMA CLUSTER
Semelhante a SPECTROSCOPIC CONFIRMATION OF THE EXISTENCE OF LARGE, DIFFUSE GALAXIES IN THE COMA CLUSTER (20)
Mais de Sérgio Sacani
Mais de Sérgio Sacani (20)
Último
Último (20)
SPECTROSCOPIC CONFIRMATION OF THE EXISTENCE OF LARGE, DIFFUSE GALAXIES IN THE COMA CLUSTER
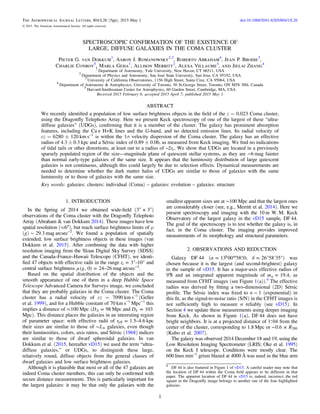
- 1. SPECTROSCOPIC CONFIRMATION OF THE EXISTENCE OF LARGE, DIFFUSE GALAXIES IN THE COMA CLUSTER Pieter G. van Dokkum1 , Aaron J. Romanowsky2,3 , Roberto Abraham4 , Jean P. Brodie3 , Charlie Conroy5 , Marla Geha1 , Allison Merritt1 , Alexa Villaume3 , and Jielai Zhang4 1 Department of Astronomy, Yale University, New Haven, CT 06511, USA 2 Department of Physics and Astronomy, San José State University, San Jose, CA 95192, USA 3 University of California Observatories, 1156 High Street, Santa Cruz, CA 95064, USA 4 Department of Astronomy & Astrophysics, University of Toronto, 50 St.George Street, Toronto, ON M5S 3H4, Canada 5 Harvard-Smithsonian Center for Astrophysics, 60 Garden Street, Cambridge, MA, USA Received 2015 February 6; accepted 2015 April 7; published 2015 May 1 ABSTRACT We recently identified a population of low surface brightness objects in the field of the z = 0.023 Coma cluster, using the Dragonfly Telephoto Array. Here we present Keck spectroscopy of one of the largest of these “ultra- diffuse galaxies” (UDGs), confirming that it is a member of the cluster. The galaxy has prominent absorption features, including the Ca II H+K lines and the G-band, and no detected emission lines. Its radial velocity of cz=6280±120 km s−1 is within the 1σ velocity dispersion of the Coma cluster. The galaxy has an effective radius of 4.3 ± 0.3 kpc and a Sérsic index of 0.89 ± 0.06, as measured from Keck imaging. We find no indications of tidal tails or other distortions, at least out to a radius of ∼ r2 e. We show that UDGs are located in a previously sparsely populated region of the size—magnitude plane of quiescent stellar systems, as they are ∼6 mag fainter than normal early-type galaxies of the same size. It appears that the luminosity distribution of large quiescent galaxies is not continuous, although this could largely be due to selection effects. Dynamical measurements are needed to determine whether the dark matter halos of UDGs are similar to those of galaxies with the same luminosity or to those of galaxies with the same size. Key words: galaxies: clusters: individual (Coma) – galaxies: evolution – galaxies: structure 1. INTRODUCTION In the Spring of 2014 we obtained wide-field (3°×3°) observations of the Coma cluster with the Dragonfly Telephoto Array (Abraham & van Dokkum 2014). These images have low spatial resolution (≈6″), but reach surface brightness limits of μ (g)∼29.3 mag arcsec−2 . We found a population of spatially extended, low surface brightness objects in these images (van Dokkum et al. 2015). After combining the data with higher resolution imaging from the Sloan Digital Sky Survey (SDSS) and the Canada–France–Hawaii Telescope (CFHT), we identi- fied 47 objects with effective radii in the range = ″r 3e – ″10 and central surface brightness =μ g( , 0) 24–26 mag arcsec−2 . Based on the spatial distribution of the objects and the smooth appearance of one of them in a deep Hubble Space Telescope Advanced Camera for Surveys image, we concluded that they are probably galaxies in the Coma cluster. The Coma cluster has a radial velocity of cz = 7090 km s−1 (Geller et al. 1999), and for a Hubble constant of 70 km s−1 Mpc−1 this implies a distance of ≈100 Mpc ( =D 98A Mpc and =D 103L Mpc). This distance places the galaxies in an interesting region of parameter space: with effective radii of =r 1.5eff –4.6 kpc their sizes are similar to those of ∼L* galaxies, even though their luminosities, colors, axis ratios, and Sérsic (1968) indices are similar to those of dwarf spheroidal galaxies. In van Dokkum et al. (2015, hereafter vD15) we used the term “ultra- diffuse galaxies,” or UDGs, to distinguish these large, relatively round, diffuse objects from the general classes of dwarf galaxies and low surface brightness galaxies. Although it is plausible that most or all of the 47 galaxies are indeed Coma cluster members, this can only be confirmed with secure distance measurements. This is particularly important for the largest galaxies: it may be that only the galaxies with the smallest apparent sizes are at ∼100 Mpc and that the largest ones are considerably closer (see, e.g., Merritt et al. 2014). Here we present spectroscopy and imaging with the 10 m W. M. Keck Observatory of the largest galaxy in the vD15 sample, DF 44. The goal of the spectroscopy is to test whether the galaxy is, in fact, in the Coma cluster. The imaging provides improved measurements of its morphology and structural parameters. 2. OBSERVATIONS AND REDUCTION Galaxy DF 44 (α = 13 00 58.0h m s ; δ = ° ′ ″26 58 35 ) was chosen because it is the largest (and second-brightest) galaxy in the sample of vD15. It has a major-axis effective radius of 9″.8 and an integrated apparent magnitude of =m 19.4g , as measured from CFHT images (see Figure 1(a)).6 The effective radius was derived by fitting a two-dimensional (2D) Sérsic profile. The Sérsic index was fixed to n = 1 (exponential) in this fit, as the signal-to-noise ratio (S/N) in the CFHT images is not sufficiently high to measure n reliably (see vD15). In Section 4 we update these measurements using deeper imaging from Keck. As shown in Figure 1(a), DF 44 does not have bright neighbors. It is at a projected distance of 1◦ .04 from the center of the cluster, corresponding to 1.8 Mpc or ∼ × R0.6 200 (Kubo et al. 2007). The galaxy was observed 2014 December 18 and 19, using the Low Resolution Imaging Spectrometer (LRIS; Oke et al. 1995) on the Keck I telescope. Conditions were mostly clear. The 600 lines mm−1 grism blazed at 4000 Å was used in the blue arm The Astrophysical Journal Letters, 804:L26 (5pp), 2015 May 1 doi:10.1088/2041-8205/804/1/L26 © 2015. The American Astronomical Society. All rights reserved. 6 DF 44 is also featured in Figure 1 of vD15. A careful reader may note that the location of DF 44 within the Coma field appears to be different in that paper. The apparent location of DF 44 in vD15 is, indeed, incorrect; the red square in the Dragonfly image belongs to another one of the four highlighted galaxies. 1
- 2. and the gold-coated 1200 lines mm−1 grating blazed at 9000 Å in the red arm. With a 1″.5 wide long slit, this configuration gives a spectral resolution of σinstr = 2.5 Å in the blue and σinstr = 0.85 Å in the red, corresponding to 170 km s−1 at λ = 4500 Å and 30 km s−1 at λ = 8500 Å. The slit was approximately aligned with the major axis of the galaxy. The total integration time was 5400 s, divided over six exposures. The galaxy was moved along the slit in between exposures. The blue and red spectra were reduced using standard techniques for long slit spectroscopy (see, e.g., van Dokkum & Conroy 2012 for an example using a similar instrumental setup as employed here). Sky OH emission lines were used for wavelength calibration and rectification in the red. In the blue, an arc spectrum taken immediately after the science exposures was used for this purpose. The wavelength coverage was 3065–5560 Å in the blue and 7590–9220 Å in the red. Sky subtraction was done by fitting a linear function in the spatial direction. The galaxy was masked in the fit. One-dimensional (1D) spectra were extracted by summing rows in the two- dimensional spectra. The extraction regions are ≈11″ and correspond approximately to the rows where the flux is at least 30 % of the peak. Extraction with optimal weighting, or using a smaller or larger aperture, does not improve the quality of the 1D spectrum. A relative flux calibration was obtained using observations of the spectrophotometric standard Feige 110 (Hamuy et al. 1992). We also obtained V-band imaging of DF 44, using the blue arm of LRIS. A total of 1080 s was obtained over the two nights, distributed over six dithered 180 s exposures. The data were reduced using standard techniques. In addition to a domeflat, a sky flat was used to correct for remaining variation in the background. As the galaxy was imaged on independent regions of the detector, the sky flat was created from the six science exposures themselves. The FWHM seeing in the final, combined image is 1″.0. The image was calibrated using SDSS g and r photometry of stars in the DF 44 field, using V = g − 0.52(g − r) − 0.03 (Jester et al. 2005). 3. REDSHIFT MEASUREMENT The LRIS spectrum of DF 44 is shown in Figure 2. Only the blue side spectrum is shown, as the red spectrum has much lower S/N per resolution element. No absolute calibration of the spectrum was attempted, but the relative flux as a function of wavelength is correct to ∼10% (as determined from the residuals Figure 1. Imaging of DF 44. Location of DF 44 with respect to neighboring galaxies ((a); CFHT image) and with respect to the center of the Coma cluster ((b); Dragonfly discovery imaging). Panels (c) and (d) show the newly obtained Keck LRIS V-band image, before and after adaptive smoothing. Panels (e) and (f) show the best-fitting single component GALFIT model (Peng et al. 2002) and the residual after subtracting this model from (d). 2 The Astrophysical Journal Letters, 804:L26 (5pp), 2015 May 1 van Dokkum et al.
- 3. between our calibrated spectrum of Feige 110 and the one in Hamuy et al. 1992). The spectrum resembles those of early-type galaxies: we unambiguously identify the Ca II H+K lines, the G- band at 4300 Å, and several other metal lines. The Balmer lines Hβ, Hγ, and Hδ are also detected. No emission lines are found. The redshift of DF 44 was measured by cross-correlating the spectrum with a range of templates of stars and galaxies, obtained from the SDSS library.7 The best-fitting redshift is cz = 6280 ± 120 km s−1 . The redshift distribution in a 2.2 degree2 region of the Coma cluster (Mobasher et al. 2001) is shown on the right. The mean redshift of the cluster is cz = 7090 km s−1 (Geller et al. 1999), with a dispersion of ∼1100 km s−1 (e.g., Colless & Dunn 1996; Mobasher et al. 2001). We conclude that DF 44 is a member of the Coma cluster and is located at a distance of ≈100 Mpc. We also fitted the spectrum with the flexible stellar population synthesis (FSPS) models of Conroy et al. (2009), using the methodology of Conroy & van Dokkum (2012). This fit simultaneously determines the best-fitting velocity disper- sion, age, and metallicity, along with the redshift. Unfortu- nately, the S/N of the spectrum (≈5 per Å) is too low for stable constraints on these parameters, even when the elemental abundance ratios are fixed to the Solar values. The red line in Figure 2 is the best-fitting FSPS model, after matching its continuum shape to that of DF 44. 4. STRUCTURE The Keck V-band image of DF 44 is shown in Figure 1(c). In Figure 1(d) we show a version of the image that was smoothed adaptively, to bring out the low surface brightness emission at large radii. This smoothing was done for display purposes only; the analysis was done on the original, unsmoothed image. We note that the Dragonfly image of DF 44 (see vD15) reaches fainter surface brightness levels than the Keck image but is difficult to interpret due to confusion with neighboring objects. The galaxy has a regular, elliptical morphology, and there is no evidence for tidal features, spiral arms, or star-forming regions, at least down to μ(V)∼28 mag arcsec−2 . We fit elliptical isophotes to the image to measure the surface brightness profile and to determine whether there is evidence for isophotal twists or other irregularities. Prior to the fit, all other objects in the image were masked carefully. The sky background was determined from empty areas just outside of the region displayed in Figure 1 and subtracted. The 1σ uncertainty in this background is approximately ∼ − μ V( ) 29 mag arcsec 2 and is propagated into the errors in the surface brightness profile. The surface brightness profile of DF 44 is shown in Figure 3(a). The surface brightness is approximately constant at μ(V) ≈ 24.6 mag arcsec−2 within r = 3″, and then falls off to reach μ(V) ≈ 28 mag arcsec−2 at r = 20″. The inner profile, highlighted in the inset, is influenced by the point-spread function (PSF). We corrected the profile for the effects of the PSF following the procedure outlined in Section 3 of Szomoru et al. (2012). First, a 2D Sérsic (1968) model, convolved with the PSF, was fitted to the image using GALFIT (Peng et al. 2002). Then, the residuals of this fit were added to an unconvolved 2D Sérsic model, and the surface brightness profile was measured from this PSF-corrected image. The solid symbols in Figure 3(a) show this PSF-corrected profile. The gray line shows the best-fitting Sérsic (1968) model. Note that this model has a constant ellipticity and position angle. It is a good fit to the observed profile: the rms in the difference between the solid points and the gray solid line is 0.08 mag. The Sérsic index of this model is n = 0.89 ± 0.06, and the best-fitting effective radius is = ″ ± ″r 8. 9 0. 6e . At the distance of the Coma cluster of =D 98A Mpc this corresponds to = ±r 4.3 0.3e kpc. The total observed magnitude of the model is =m 18.9V , and the absolute magnitude is = −M 16.1V . These results are consistent with our earlier measurement based on shallower CFHT data; specifically, if we force n = 1 we find re = 4.5 kpc, compared to re = 4.6 kpc from the CFHT data (vD15). Figure 2. Spectrum of DF 44, obtained in 5400 s with LRIS on the Keck I telescope. Top panel: two-dimensional spectrum. The left axis indicates the position along the slit, in arcseconds. Bottom panel: one-dimensional spectrum, extracted from the 2D spectrum (black line). The spectrum was smoothed with a 4.6 Å box car filter. The red line shows the smoothed best-fitting model spectrum. The galaxy has an early-type spectrum and a redshift of cz=6280±120 km s−1 . The histogram on the right shows the redshift distribution of Coma, from Mobasher et al. (2001). The red line marks the redshift of DF 44. 7 http://www.sdss2.org/dr3/algorithms/spectemplates/index.html 3 The Astrophysical Journal Letters, 804:L26 (5pp), 2015 May 1 van Dokkum et al.
- 4. Panels (b) and (c) of Figure 3 show the variation in the ellipticity and position angle as a function of radius. The radial variation in position is not shown, as the center of the best- fitting ellipse is always within 1″ of the mean position. There is some evidence that the inner < ″r 3 ( <r 1.5 kpc) is structu- rally distinct from the rest of the galaxy: the surface brightness is depressed compared to an exponential model (broken gray line; this depression is why the best-fitting Sérsic index is 0.9 rather than 1) and the galaxy appears more flattened (axis ratio b/a ≈ 0.5 versus ≈0.7 at r 5″). The red line shows the result of a two-component GALFIT fit, with the Sérsic index of the second component fixed to n = 1. The inner component has a Sérsic index of n = 0.69, an effective radius of re,i = 7″.5, and an axis ratio b/a = 0.57; the outer component has n ≡ 1, re, o = 14″.9, and b/a = 0.73. The effective radius of the combined model is 8″.4, very similar to that of the single-component fit. 5. DISCUSSION The key result of this paper is the confirmation that one of the largest UDGs in the field of Coma is a member of the cluster. In vD15 we had already argued that the 47 diffuse objects we discovered with the Dragonfly Telephoto Array are very likely cluster members, but this was not based on direct distance measurements. The objects with the largest apparent sizes are most likely to be in the foreground, and by confirming the distance to DF 44 we can be confident that most, and perhaps all, of the 47 galaxies are cluster members. We note that this is not the first distance measurement to a large, diffuse galaxy. Caldwell (2006) measured the distance to even fainter (but also smaller) galaxies in the Virgo cluster from the location of the tip of the red giant branch. Dalcanton et al. (1997) measured redshifts of seven large field galaxies with central surface brightness in the range =μ V( ) 23– 25 mag arcsec−2 . Two of these galaxies, R-127-1 and M-161-1, may be similar to DF 44: they have no detected emission lines and they have similar sizes and surface brightness profiles. And XIX is the only known example of a faint galaxy with >r 1.5e kpc in the Local Group (McConnachie et al. 2008). In Figure 4 we place DF 44 in context with these other UDGs, as well as with other classes of quiescent (i.e., not star- forming) objects (see Brodie et al. 2011).8 The UDG data are taken from Table 1 in vD15, with =r b a r( )e e,circ 0.5 ,maj. With =b a 0.68, the circularized effective radius of DF 44 is 3.5 kpc. Solid red lines indicate the approximate UDG selection limits of vD15, converted to the axes of Figure 4: >r 1.3e,circ kpc and >μ V( , 0) 23.5. The broken red line indicates the approximate detection limit of vD15 ( ≲μ V( , 0) 25.5; this is driven by the depth of the CFHT imaging that was used for confirmation). UDGs highlight the enormous range that exists in both axes of the size–luminosity diagram: at their magnitude they are a factor of >100 larger than ultra-compact dwarfs and at their size they are a factor of >100 fainter than normal elliptical galaxies. Interestingly all three classes of galaxies inhabit the same environments and have broadly similar stellar populations. A striking feature of Figure 4 is the apparent gap between the largest UDGs and giant elliptical galaxies of the same size (that is, there are very few quiescent galaxies with >r 3e kpc and − < < −M20 17V ). We caution, however, that the Brodie et al. sample was not designed to be complete in this domain and that such objects would fall outside of the vD15 criteria. The spectrum of DF 44 does not provide new information on the formation of UDGs, beyond confirming that they have an early-type spectrum and no significant ongoing star formation. The deeper imaging enables us to address one particular explanation for the existence of UDGs, namely that they appear large because they have extensive tidal debris around them (see Koch et al. 2012 for a spectacular example of such a galaxy). Such tidal debris might be expected if UDGs are in the process of being disrupted by the tidal field of the cluster (e.g., Moore et al. 1996; Gnedin 2003). The Keck image of DF 44 does not provide evidence for this scenario: the galaxy does not appear to be Figure 3. Surface brightness (a), axis ratio (b), and position angle (c) of DF 44 as a function of distance along the major axis. Open symbols are the observed profile; solid symbols are corrected for the effects of the PSF (see text). In all panels the gray solid line is the best-fitting single component 2D Sérsic model, with constant axis ratio and position angle. This model has a Sérsic index n = 0.9 and an effective radius = ″r 8. 9e , corresponding to 4.3 kpc at the distance of DF 44. The gray broken line is an exponential fit, and the red line is a two-component fit. The two-component fit has an effective radius of = ″r 8. 4e . The inset shows the inner part of the surface brightness profile. In the central < ″r 3 ( <r 1.5 kpc) the profile is depressed compared to the exponential fit. 8 Most of the data in this figure come from the SAGES database (http://sages. ucolick.org/spectral_database.html). 4 The Astrophysical Journal Letters, 804:L26 (5pp), 2015 May 1 van Dokkum et al.
- 5. in the process of disruption, and the half-light radii are unlikely to be affected by tidal features. We note, however, that distortions may exist at fainter magnitudes. The central depression in the surface brightness profile (relative to an exponential profile) is a common feature in dwarf spheroidal galaxies (Irwin & Hatzidimitriou 1995; McConnachie 2012; Merritt et al. 2014) and may be evidence of the importance of stellar feedback (e.g., Read & Gilmore 2005; Stinson et al. 2013). It may be that this feedback suppressed star formation at early times (see, e.g., Oppenheimer & Davé 2006; Scannapieco et al. 2008; Stinson et al. 2013) and that gas expelled in the associated winds was swept up in the intracluster medium (ICM) (e.g., Abadi et al. 1999; Mori & Burkert 2000) rather than falling back to the disk. In this scenario Coma UDGs could be considered “failed” ∼L* galaxies, that lost their gas to the ICM. Key to understanding UDGs is to know how much dark matter they have and, particularly, whether their halos resemble those of other galaxies of the same size or those of other galaxies of the same luminosity. The fact that UDGs are able to survive in the tidal field of Coma implies that they are dark matter-dominated (see vD15), but a quantitative mass measurement can only be obtained from internal kinematics. We calculate the expected stellar velocity dispersion as a function of radius using simple spherical mass models with stars and Navarro et al. (1997) dark matter halos, and a correlation between dark matter density and scale radius as in Spitler et al. (2012). If the dark matter halos of UDGs are similar to those of dwarf galaxies (with assumed = ×M 6 10vir 10 ⊙M ) their luminosity-weighted velocity dispersions are expected to be ∼35 km s−1 within the stellar effective radius. By contrast, if their halos are similar to those of L* galaxies (with assumed = ×M 1.8 10vir 12 ⊙M ), their dispersions are9 ∼60 km s−1 . In this paper we have shown what can be achieved in 1.5 hr with a traditional long-slit spectrograph on a large telescope. Using long exposure times with low surface brightness-optimized integral field units (such as the planned eKeck Cosmic Web Imager; Martin et al. 2010), it should be possible to measure dynamical masses, ages, and metallicities of these enigmatic objects. The authors wish to recognize and acknowledge the very significant cultural role and reverence that the summit of Mauna Kea has always had within the indigenous Hawaiian community. We are most fortunate to have the opportunity to conduct observations from this mountain. We thank Nicola Pastorello for an independent check of the redshift measurement. Support from NSF grants AST-1312376, AST-1109878, and AST-1211995 is gratefully acknowledged. We also acknowledge the support of the Dunlap Institute, funded through an endowment established by the David Dunlap family and the University of Toronto. REFERENCES Abadi, M. G., Moore, B., & Bower, R. G. 1999, MNRAS, 308, 947 Abraham, R. G., & van Dokkum, P. G. 2014, PASP, 126, 55 Brodie, J. P., Romanowsky, A. J., Strader, J., & Forbes, D. A. 2011, AJ, 142, 199 Caldwell, N. 2006, ApJ, 651, 822 Chiboucas, K., Tully, R. B., Marzke, R. O., et al. 2011, ApJ, 737, 86 Colless, M., & Dunn, A. M. 1996, ApJ, 458, 435 Conroy, C., Gunn, J. E., & White, M. 2009, ApJ, 699, 486 Conroy, C., & van Dokkum, P. 2012, ApJ, 747, 69 Dalcanton, J. J., Spergel, D. N., Gunn, J. E., Schmidt, M., & Schneider, D. P. 1997, AJ, 114, 635 Geller, M. J., Diaferio, A., & Kurtz, M. J. 1999, ApJL, 517, L23 Gnedin, O. Y. 2003, ApJ, 589, 752 Hamuy, M., Walker, A. R., Suntzeff, N. B., et al. 1992, PASP, 104, 533 Irwin, M., & Hatzidimitriou, D. 1995, MNRAS, 277, 1354 Jester, S., Schneider, D. P., Richards, G. T., et al. 2005, AJ, 130, 873 Koch, A., Burkert, A., Rich, R. M., et al. 2012, ApJL, 755, L13 Kubo, J. M., Stebbins, A., Annis, J., et al. 2007, ApJ, 671, 1466 Martin, C., Moore, A., Morrissey, P., et al. 2010, Proc. SPIE, 7735, 77350M McConnachie, A. W. 2012, AJ, 144, 4 McConnachie, A. W., Huxor, A., Martin, N. F., et al. 2008, ApJ, 688, 1009 McDonald, M., Courteau, S., Tully, R. B., & Roediger, J. 2011, MNRAS, 414, 2055 Merritt, A., van Dokkum, P., & Abraham, R. 2014, ApJL, 787, L37 Mobasher, B., Bridges, T. J., Carter, D., et al. 2001, ApJS, 137, 279 Moore, B., Katz, N., Lake, G., Dressler, A., & Oemler, A. 1996, Natur, 379, 613 Mori, M., & Burkert, A. 2000, ApJ, 538, 559 Navarro, J. F., Frenk, C. S., & White, S. D. M. 1997, ApJ, 490, 493 Oke, J. B., Cohen, J. G., Carr, M., et al. 1995, PASP, 107, 375 Oppenheimer, B. D., & Davé, R. 2006, MNRAS, 373, 1265 Peng, C. Y., Ho, L. C., Impey, C. D., & Rix, H.-W. 2002, AJ, 124, 266 Read, J. I., & Gilmore, G. 2005, MNRAS, 356, 107 Scannapieco, C., Tissera, P. B., White, S. D. M., & Springel, V. 2008, MNRAS, 389, 1137 Sérsic, J. L. 1968, Atlas de Galaxias Australes (Cordoba, Argentina: Observatorio Astronomico) Spitler, L. R., Romanowsky, A. J., Diemand, J., et al. 2012, MNRAS, 423, 2177 Stinson, G. S., Brook, C., Macciò, A. V., et al. 2013, MNRAS, 428, 129 Szomoru, D., Franx, M., & van Dokkum, P. G. 2012, ApJ, 749, 121 van Dokkum, P. G., Abraham, R., & Merritt, A. 2015, ApJL, 798, L45 van Dokkum, P. G., & Conroy, C. 2012, ApJ, 760, 70 (vD15) Figure 4. Relation between projected circularized half-light radius and absolute V-band magnitude for quiescent (early-type) objects, adapted from Brodie et al. (2011). Solid symbols denote distance-confirmed objects. Red open circles are ultra-diffuse galaxies from vD15, assuming that they are all members of the Coma cluster. The solid star is DF 44. The red lines indicate the approximate selection (solid) and detection (dotted) limits of vD15. Red solid circles are ultra- compact dwarfs in the Coma cluster (Chiboucas et al. 2011), which have a factor of ∼107 higher 3D stellar density than the Coma UDGs. Black solid symbols are other diffuse galaxies with confirmed distances from the literature: the circles are the field galaxies R-127-1 and M-161-1 (Dalcanton et al. 1997), the triangles are the Virgo cluster galaxies N lsb 10 and SW2 lsb31 (Caldwell 2006), and the square is the Local Group galaxy And XIX (McConnachie et al. 2008). The gray point near DF 44 is the Virgo galaxy VCC 1661, which appears to be an erroneous measurement (McDonald et al. 2011). 9 In either scenario the stellar mass does not contribute to the measured dispersion; the stars-only expectation for the velocity dispersion is ∼7 km s−1 , for =M L 1.3Vstars . 5 The Astrophysical Journal Letters, 804:L26 (5pp), 2015 May 1 van Dokkum et al.