SlideShare uma empresa Scribd logo
1 de 46
Baixar para ler offline
Interstellar Dust Grains                                                                                                                                                     1


                                                              Interstellar Dust Grains

                                       B. T. Draine
                                       Princeton University Observatory, Princeton, NJ 08544 USA
                                       draine@astro.princeton.edu
arXiv:astro-ph/0304489v1 28 Apr 2003


                                       KEYWORDS: infrared astronomy, interstellar medium, interstellar grains, light scattering,
                                                molecular clouds


                                       ABSTRACT: This review surveys the observed properties of interstellar dust grains: the
                                       wavelength-dependent extinction of starlight, including absorption features, from UV to infrared;
                                       optical luminescence; infrared emission; microwave emission; optical, UV, and X-ray scattering
                                       by dust; and polarization of starlight and of infrared emission. The relationship between presolar
                                       grains in meteorites and the interstellar grain population is discussed. Candidate grain materials
                                       and abundance constraints are considered. A dust model consisting of amorphous silicate grains,
                                       graphite grains, and polycyclic aromatic hydrocarbons is compared with observed emission and
                                       scattering. Some issues concerning evolution of interstellar dust are discussed.


                                       CONTENTS

                                       INTRODUCTION . . . . . . . . . . . . . . . . . . . . . . . . . . . . . . . . . . . .                                                                                          2

                                       EXTINCTION . . . . . . . . . . . . . . . . . . . . . . . . . . . . . . . . . . . . . .                                                                                        3
                                          Milky Way Dust . . . . . . . . . . . . . . . . . . . . . . . . . . . . . . . . . . . . . . .                                                                               3
                                          Dust in Other Galaxies . . . . . . . . . . . . . . . . . . . . . . . . . . . . . . . . . . . .                                                                             6

                                       SPECTROSCOPY OF DUST                             . . . . . . . . . . . . . . . . . . . . . . . . . . . . .                                                                    9
                                               ˚
                                          2175A Feature: Aromatic C? . . . . . .                            .   .   .   .   .   .   .   .   .   .   .   .   .   .   .   .   .   .   .   .   .   .   .   .   .   .    9
                                          Silicate Features . . . . . . . . . . . . .                       .   .   .   .   .   .   .   .   .   .   .   .   .   .   .   .   .   .   .   .   .   .   .   .   .   .   10
                                          Diffuse Interstellar Bands . . . . . . . .                         .   .   .   .   .   .   .   .   .   .   .   .   .   .   .   .   .   .   .   .   .   .   .   .   .   .   13
                                          3.4µm Feature: Aliphatic C-H Stretch .                            .   .   .   .   .   .   .   .   .   .   .   .   .   .   .   .   .   .   .   .   .   .   .   .   .   .   14
                                          Ice Features . . . . . . . . . . . . . . . .                      .   .   .   .   .   .   .   .   .   .   .   .   .   .   .   .   .   .   .   .   .   .   .   .   .   .   14
                                          3.3, 6.2, 7.7, 8.6, 11.3µm PAH Features                           .   .   .   .   .   .   .   .   .   .   .   .   .   .   .   .   .   .   .   .   .   .   .   .   .   .   15
                                          X-Ray Absorption Edges . . . . . . . . .                          .   .   .   .   .   .   .   .   .   .   .   .   .   .   .   .   .   .   .   .   .   .   .   .   .   .   17
                                          Extended Red Emission . . . . . . . . .                           .   .   .   .   .   .   .   .   .   .   .   .   .   .   .   .   .   .   .   .   .   .   .   .   .   .   17

                                       PRESOLAR GRAINS IN METEORITES AND INTERPLANETARY DUST                                                                                                                . .     18

                                       CANDIDATE GRAIN MATERIALS . . . . . . . . . . . . . . . . . . . . . . . . . .                                                                                                20
                                          Silicates . . . . . . . . .   .   .   .   .   .   .   .   .   .   .   .   .   .   .   .   .   .   .   .   .   .   .   .   .   .   .   .   .   .   .   .   .   .   .   .   20
                                          Carbonaceous Materials        .   .   .   .   .   .   .   .   .   .   .   .   .   .   .   .   .   .   .   .   .   .   .   .   .   .   .   .   .   .   .   .   .   .   .   21
                                          SiC . . . . . . . . . . . .   .   .   .   .   .   .   .   .   .   .   .   .   .   .   .   .   .   .   .   .   .   .   .   .   .   .   .   .   .   .   .   .   .   .   .   21
                                          Carbonates . . . . . . .      .   .   .   .   .   .   .   .   .   .   .   .   .   .   .   .   .   .   .   .   .   .   .   .   .   .   .   .   .   .   .   .   .   .   .   21

                                       POLARIZATION . . . . . . . . . . . . . . . . . . . . . . . . . . . . . . . . . . . .                                                                                         22
                                          Optical-UV Polarization . . . . . . . . . . . . . . . . . . . . . . . . . . . . . . . . . . .                                                                             22
                                          Polarized Far-Infrared Emission . . . . . . . . . . . . . . . . . . . . . . . . . . . . . .                                                                               22
Annu. Rev. Astron. Astrophys. 2002 41           Preprint astro-ph/...

A PROVISIONAL GRAIN MODEL . . . . . . . . . . . . . . . . . . . . . . . . . .                        23

SCATTERING           . . . . . . . . . . . . . . . . . . . . . . . . . . . . . . . . . . . . .       25
    Optical and UV . . . . . . . . . . . . . . . . . . . . . . . . . . . . . . . . . . . . . . . .   25
    X-Ray Scattering . . . . . . . . . . . . . . . . . . . . . . . . . . . . . . . . . . . . . . .   26

INFRARED EMISSION               . . . . . . . . . . . . . . . . . . . . . . . . . . . . . . . .      28

MICROWAVE EMISSION . . . . . . . . . . . . . . . . . . . . . . . . . . . . . . .                     31
    Spinning Grains . . . . . . . . . . . . . . . . . . . . . . . . . . . . . . . . . . . . . . .    31
    Magnetic Grains? . . . . . . . . . . . . . . . . . . . . . . . . . . . . . . . . . . . . . . .   32

ABUNDANCE ISSUES . . . . . . . . . . . . . . . . . . . . . . . . . . . . . . . . .                   33

GRAIN ALIGNMENT               . . . . . . . . . . . . . . . . . . . . . . . . . . . . . . . . .      35

EVOLUTION OF THE GRAIN POPULATION . . . . . . . . . . . . . . . . . . .                              36

FUTURE DIRECTIONS . . . . . . . . . . . . . . . . . . . . . . . . . . . . . . . .                    38


1    INTRODUCTION
Dust grains play a central role in the astrophysics of the interstellar medium, from
the thermodynamics and chemistry of the gas, to the dynamics of star formation.
In addition, dust shapes the spectra of galaxies: radiation at short wavelengths
is attenuated, and energy is radiated in the infrared. It is estimated that 30% or
more of the energy emitted as starlight in the Universe is reradiated by dust in
the infrared (Bernstein et al. 2002). Interstellar dust determines what galaxies
look like, how the interstellar medium (ISM) in a galaxy behaves, and the very
process of star formation that creates a visible galaxy.
   This review summarizes current knowledge of the abundance, composition,
and sizes of interstellar dust grains, as indicated by observations of extinction,
scattering, and emission from dust, supplemented by evidence from interstellar
gas phase abundances and presolar grains in meteorites. The term “dust grain” is
understood here to extend down to molecules containing tens of atoms, as there
is no discontinuity in the physics as the particle size decreases from microns to
Angstroms.
   The distribution of gas and dust in the Galaxy – the structure of the interstellar
medium – is not discussed.
   The astrophysics of interstellar dust is not covered in this review. This includes
the physical optics of small particles, charging of dust grains, heating and cooling
of dust grains, chemistry on dust grain surfaces, forces and torques on dust grains,
sputtering and shattering of dust grains, and alignment of dust with the magnetic
field; an introduction to these topics can be found elsewhere (Kr¨gel 2002, Draine
                                                                    u
2003a).
   The review does not attempt to survey or compare different models proposed
for interstellar dust. One dust model is introduced to illustrate modeling of
absorption, scattering, and infrared emission from interstellar dust.
   It is not possible to cite all of the important papers in this area; only a few
articles are cited in connection with each topic. The reader is encouraged to
also consult prior reviews by Savage & Mathis (1979), Mathis (1990, 1993, 2000),
Draine (1995), Witt (2000a), Witt (2000b), Voshchinnikov (2002), and the book

                                                   2
Interstellar Dust Grains                                                          3

by Whittet (2003). Dorschner & Henning (1995) discuss the metamorphosis of
interstellar dust.

2     EXTINCTION
The existence of interstellar dust was first inferred from obscuration, or “extinc-
tion”, of starlight (Trumpler 1930). Much of our knowledge of interstellar dust
continues to be based on studies of the wavelength-dependence of this attenua-
tion, often referred to as “reddening” because of the tendency for the extinction to
be greater in the blue than in the red. The wavelength-dependence strongly con-
strains the grain size distribution, and spectral features (§3) reveal the chemical
composition.
   The extinction is most reliably determined using the “pair method” – com-
paring spectrophotometry of two stars of the same spectral class; if one star has
negligible foreground dust while the second star is heavily reddened, compari-
son of the two spectra, together with the assumption that the dust extinction
goes to zero at very long wavelength, allows one to determine the extinction
                   0
Aλ ≡ 2.5 log10 (Fλ /Fλ ) as a function of wavelength λ, where Fλ is the observed
flux and Fλ  0 is the flux in the absence of extinction. The “pair method” has been

used to measure extinction curves for many sightlines, in many cases over a range
of wavelengths extending from the near-infrared to the vacuum UV.

2.1     Milky Way Dust
2.1.1   OPTICAL-UV EXTINCTION CURVES
The dimensionless quantity RV ≡ AV /(AB − AV ) is a common measure of the
slope of the extinction curve in the optical region. Very large grains would pro-
duce gray extinction with RV → ∞. Rayleigh scattering (Aλ ∝ λ−4 ) would
produce very steep extinction with RV ≈ 1.2. RV is known to vary from one
sightline to another, from values as low as 2.1 (toward HD 210121) (Welty &
Fowler 1992) to values as large as 5.6-5.8 (toward HD 36982) (Cardelli et al.
1989, Fitzpatrick 1999). Cardelli et al. (1989) showed that normalized extinction
curves Aλ /AI (using the I band extinction to normalize) could be approximated
by a seven-parameter function of wavelength λ:

                    Aλ /AI ≈ f (λ; RV , C1 , C2 , C3 , C4 , λ0 , γ) .           (1)
                           ˚
At wavelengths λ > 3030A, the function f (λ) depends only on λ and the single
parameter RV . The parameters C3 , λ0 , and γ determine the strength and shape
of the 2175˚ “bump”, and the coefficients C1 , C2 , and C4 determine the slope
            A
and curvature of the continuous extinction at λ < 3030˚.  A
   Cardelli et al. (1989) show that if the single quantity RV is known, it is possi-
ble to estimate the values of the other six parameters (C1−4 , λ0 , γ) so that the
optical-UV extinction can be approximated by a one-parameter family of curves.
However, if the UV extinction has been measured, an improved fit to the obser-
vations can be obtained by fitting C1−4 , λ0 and γ to the measured extinction.
   Empirical extinction curves in diffuse clouds show relatively little variation in
                                              <   <
the infrared, and for wavelengths 0.7 µm ∼ λ ∼ 8 µm the function (1) appears
to be approximately “universal” (i.e., independent of RV ) in diffuse clouds [in
4                                                                                    Draine


Figure 1: Extinction curves from prescription of Fitzpatrick (1999), with diffuse interstellar
bands (DIBs) added as described in §3.3. The DIBs are barely visible on this plot.


dense clouds grains acquire “ice” mantles (§3.5) which alter the extinction]. Fitz-
patrick (1999) pays careful attention to the effects of finite-width photometric
bandpasses, and gives modified formulae which appear to improve the overall fit
to observations of ice-free dust. The Cardelli et al. (1989) and Fitzpatrick (1999)
fits for RV = 3.1 are compared in §8 (Table 4).
   Figure 1 shows extinction curves calculated using the F99 parametrization for
RV = 2.1, 2.5, 3.1, 4.0, and 5.5. The coefficients in the Cardelli et al. (1989) or
Fitzpatrick (1999) fitting formulae can be adjusted to improve the fit to specific
sightlines; such a fit is shown for the extreme case of HD 210121, showing that
the UV extinction can differ significantly from the average behavior for the same
value of RV .
   “Pair method” determinations of the reddening law for many sightlines indicate
that RV ≈ 3.1 for the “average” extinction law for diffuse regions in the local
Milky Way (Savage & Mathis 1979, Cardelli et al. 1989). Sightlines intersecting
clouds with larger extinction per cloud tend to have larger values of RV ; the
larger RV values may indicate grain growth by accretion and coagulation.
   Another approach to determining the wavelength-dependent extinction is to use
star counts or galaxy counts as a function of apparent brightness. Szomoru &
Guhathakurta (1999) use UBVRI photometry of Galactic field stars to determine
the extinction law; for the four high-latitude clouds they studied, they conclude
          <
that RV ∼ 2, well below the value RV ≈ 3.1 which is widely considered to be
“average”, and comparable to the most extreme values of RV ever found in studies
of individual stars (RV = 2.1 for HD 210121). Further study is needed to reconcile
this apparent conflict.
   Udalski (2002) uses V and I photometry of “red clump giants” to study the
reddening law. Toward the LMC he infers RV ≈ 3.1, but toward Galactic bulge
Interstellar Dust Grains                                                        5

regions he finds RV ≈ 1.8 − 2.5.
   Sloan Digital Sky Survey (SDSS) photometry (Lupton et al. 2003) can be
used to study the reddening toward stars at the “blue tip” of the main sequence
(Finkbeiner et al. 2003b). The observed reddening appears to be consistent with
RV ≈ 3.1. Galaxy surface brightnesses can also be used; SDSS galaxy photometry
is consistent with RV = 3.1 (Schlegel et al. 2003).

2.1.2   EXTINCTION PER H
Using H Lyman-α and absorption lines of H2 to determine the total H column
density NH , Bohlin et al. (1978) found

                  NH /(AB − AV ) = 5.8 × 1021 cm−2 mag−1      ,                (2)

              NH /AV ≈ 1.87 × 1021 cm−2 mag−1      for RV = 3.1    ,           (3)
to be representative of dust in diffuse regions. For RV = 3.1, the F99 reddening
fit gives AIC /AV = 0.554 for Cousins I band (λ = 0.802 µm), thus

               AIC /NH ≈ 2.96 × 10⁻²² mag cm2     for RV = 3.1 .               (4)
                                                  >
If the extinction curve is really universal for λ ∼ 0.7 µm we might expect eq. (4)
to apply independent of RV .
   Rachford et al. (2002) report H and H2 column densities for 16 sightlines
                                                                            −1
through diffuse and “translucent” clouds. Figure 2 shows AIC /NH versus RV for
the 14 sightlines with NH known to better than a factor 1.5 . The IC band extinc-
tion AIC has been estimated from AB − AV and RV using the F99 RV -dependent
reddening law.
   Figure 2 appears to show that AIC /NH is not universal for local Milky Way
dust: the IC band extinction per H deviates from the ratio (4) when RV deviates
from 3.1, in the sense that AIC /NH increases when RV is larger (larger grains).
We note that the trend in AIC /NH could be in part the result of errors in de-
termination of RV , (i.e., errors in estimating AV , since E(B − V ) is probably
accurate to better than 10% for these stars), but the data appear to show a real
trend. A least-squares fit, constrained to pass through (4), gives

            AIC /NH ≈ [2.96 − 3.55 (3.1/RV − 1)] × 10−22 mag cm2       .       (5)

   Figure 3 shows Aλ /NH , the extinction per H, estimated from the F99 extinction
fits and eq. (5). If the F99 extinction fits and eq. (5) are both correct, the
                                   >
extinction per H increases for λ ∼ 0.3 µm when RV increases. Presumably this
is due to increased scattering by the grains as the grain size increases.

2.1.3   INFRARED EXTINCTION
Between ∼ 0.9 µm and ∼ 5 µm the continuous extinction curve can be approx-
imated by a power-law, Aλ ∝ λ−β , with β ≈ 1.61 (Rieke & Lebofsky 1985),
1.70 (Whittet 1988), 1.75 (Draine 1989b), ∼1.8 (Martin & Whittet 1990), ∼1.8
(Whittet et al. 1993), or 1.70 (Bertoldi et al. 1999, Rosenthal et al. 2000).
  The extinction in the 5–8 µm region is controversial (see Figure 4). Draine
(1989b) concluded that the observational evidence was consistent with Aλ ∝
λ−1.75 out to λ ≈ 6 µm. Using ISO observations of H recombination lines, Lutz
6                                                                                         Draine


Figure 2: AI /NH for 14 sightlines through translucent clouds (Rachford et al. 2002), as a
function of 1/RV , with RV determined by IR photometry (circles, RV ± 0.2); polarization λmax
(triangles, RV ± 10%); or UV extinction curve (diamonds, RV ± 10%). Vertical error bars show
1-σ uncertainty due to errors in NH ; tilted error bars show effects of errors in RV . Least-squares
fit [eq. 5)] is shown.


et al. (1996) find that the extinction toward Sgr A∗ does not decline with increas-
ing λ in the 4–8 µm region. However, studies using H2 rovibrational lines in the
Orion molecular cloud, (Bertoldi et al. 1999, Rosenthal et al. 2000) find that the
extinction continues to decline with increasing λ to a minimum at ∼6.5 µm. The
wavelength dependence of the continuous dust extinction in the Orion molecular
cloud could conceivably differ from that on the sightline to Sgr A∗ ; alternatively,
perhaps the H recombination line intensity ratios differ from the “case B” re-
combination assumed by Lutz et al. It is interesting to see in Figure 4 that the
Weingartner & Draine (2001a) grain model for RV = 5.5 is in rough agreement
with the Lutz et al. results toward the galactic center. Further observational
study of the 5–8 µm extinction is needed.
   In addition to this continuous extinction, there are strong absorption features
at 9.7 µm and 18 µm due to silicates (§3.2), a hydrocarbon feature at 3.4 µm
(§3.4), and PAH absorption at 6.2 µm (§3.6). The extinction in molecular clouds
also shows additional bands due to ice mantles (§3.5).

2.2    Dust in Other Galaxies
Dust in the Milky Way varies from one sightline to another. It is obviously
of great interest to study the dust in other galaxies, both in order to correct
observations for the extinction by the dust, but also to inform our understanding
of dust astrophysics.
   Our knowledge of the extinction law for dust in other galaxies is greatest for
the Large and Small Magellanic Clouds (LMC and SMC), where we can study the
Interstellar Dust Grains                                                                7


Figure 3: Aλ /NH for different values of RV , using F99 extinction curve fit and AI /NH from
eq. (5).


extinction for individual stars, but some progress has been made in determining
the wavelength-dependence of extinction in more distant galaxies.

2.2.1      MAGELLANIC CLOUDS
Not surprisingly, there are regional variations within the LMC and SMC. Stars
more than ∼500 pc away from the 30 Doradus region of the LMC have RV ≈ 3.2
and an extinction law that appears to be quite similar to the Milky Way diffuse
cloud extinction law (Fitzpatrick 1986, Misselt et al. 1999). The reddening per
H atom E(B − V )/NH ≈ 4.5 × 10⁻²³ cm2 /H (Koorneef 1982, Fitzpatrick 1985),
approximately 40% of the Milky Way value. This is approximately consistent with
the LMC metallicity: LMC H II regions have Ne/H≈ (3.5 ± 1.4) × 10−5 (Kurt &
Dufour 1998), ∼30% of the solar Ne/H (= 1.2 × 10⁻⁴ ) (Grevesse & Sauval 1998).
Stars in or near 30 Dor have extinction curves which have a weakened 2175˚   A
feature (Fitzpatrick 1986, Misselt et al. 1999).
   In the SMC, stars in the “bar” region have extinction curves which appear to
lack the 2175˚ feature. The reddening per H is only E(B − V )/NH = 2.2 ×
              A
10−23 cm2 /H, ∼13% of the Milky Way value, again consistent with the SMC
metallicity: SMC H II regions have Ne/H≈ (1.6 ± 0.2) × 10−5 (Dufour 1984, Kurt
& Dufour 1998), or 14% of the solar Ne/H, and the gas-phase C/H is only 6% of
solar.
   Weingartner & Draine (2001a) are able to reproduce the observed extinction
laws in the LMC and SMC using appropriate mixtures of carbonaceous and sil-
icate grains. The sightlines in the SMC bar which lack the 2175˚ extinction
                                                                   A
feature can be reproduced by models which lack carbonaceous grains with radii
  <
a ∼ 0.02 µm.
8                                                                                       Draine


Figure 4: Infrared extinction, relative to extinction at K (2.2 µm), inferred by Rosenthal et al.
(2000) for dust in the OMC-1 molecular cloud, and by Lutz et al. (1996) for dust toward Sgr
A∗ , and as calculated for the Weingartner & Draine (2001a) grain models for RV = 3.1 (60ppm
C in PAH) and RV = 5.5 (30ppm C in PAH). The 6.2 µm absorption feature in the Weingartner
& Draine (2001a) grain models is due to PAHs.


2.2.2   M31
Bianchi et al. (1996) present UV extinction curves toward selected bright stars
in M31, finding an extinction law similar to the average Milky Way extinction
curve, but with the 2175˚ feature possibly somewhat weaker than in the Milky
                         A
Way.

2.2.3   OTHER GALAXIES
There are several different approaches to determining the extinction curve for
dust in galaxies where individual stars cannot be resolved.
   The dust extinction law can be determined when a foreground galaxy overlaps
a background galaxy. Berlind et al. (1997) find the extinction curve for dust
in the spiral arm of NGC 2207 to resemble the Milky Way extinction law for
RV = 5.0; the interarm dust appears to be even grayer. However, the flatness
of the extinction curve could be due in part to unresolved optically-thick dust
patches in the foreground galaxy.
   Keel & White (2001a) find the extinction law in the spiral galaxy AM 1316-241
to be close to the Milky Way mean extinction, with RV = 3.4 ± 0.2; for the spiral
galaxy AM 0500-620 the dust extinction law appears to be somewhat steeper
than the Milky Way average, with RV ≈ 2.5 ± 0.4. Keel & White (2001b) find
the extinction law in the Sc galaxy NGC 3314A to be close to the Milky Way
mean, with RV = 3.5± 0.2 over galactocentric radii 1.6–3.8 kpc, with no evidence
for any radial trend in reddening law.
Interstellar Dust Grains                                                         9

   From observations of the overall emission spectrum Calzetti (2001) infers the
internal extinction by dust in starburst galaxies. The inferred reddening law is
relatively gray compared to the Galactic reddening law, and shows no evidence
of a 2175˚ feature. It is not clear to what extent the flatness of the apparent
           A
reddening law may be due to the effects of radiative transfer in optically-thick
distributions of stars and dust.
   Searches have been made for the 2175˚ extinction feature in QSO spectra
                                            A
(McKee & Petrosian 1974). Malhotra (1997) reports a statistical detection in a
sample of 92 QSOs, but Pitman et al. (2000) argue that the detection was not
statistically significant.
   Gravitationally-lensed QSOs with multiple images can be used to determine
the extinction law if the intrinsic spectrum is assumed to be time-independent.
Falco et al. (1999) determine extinction laws in galaxies out to z = 1.01, with RV
estimates from 1.5 to 7.2. Toft et al. (2000) find the extinction curve in a galaxy
                          <     <
at z = 0.44 to have 1.3 ∼ RV ∼ 2.0. Motta et al. (2002) find that the dust in a
lensing galaxy at z = 0.83 is consistent with a standard Milky Way extinction
law for RV = 2.1 ± 0.9, including an extinction bump at 2175˚.  A

3     SPECTROSCOPY OF DUST
The composition of interstellar dust remains controversial. While meteorites (§4)
provide us with genuine specimens of interstellar grains for examination, these
are subject to severe selection effects, and cannot be considered representative of
interstellar grains. Our only direct information on the composition of interstellar
dust comes from spectral features in extinction, scattering, or emission.

3.1   2175˚ Feature: Aromatic C?
          A
By far the strongest spectral feature is the broad “bump” in the extinction curve
                  ˚
centered at ∼2175A (see Figure 1).
  Fitzpatrick & Massa (1986) showed that the observed 2175˚ feature can be
                                                               A
accurately fit with a Drude profile
                                            C0 γ 2
                       ∆Cext (λ) =                         ,                   (6)
                                     (λ/λ0 − λ0 /λ)2 + γ 2
                       ˚
peaking at λ0 = 2175A (or λ−1 = 4.60 µm−1 ) and with a broadening parameter
                               0
γ = 0.216 (corresponding to FWHM γλ0 = 469˚, or γλ0 = 0.992 µm−1 ). The
                                                  A        −1

strength of the absorption is such that on an average diffuse cloud sightline in
the Milky Way, the 2175˚ profile corresponds to an oscillator strength per H
                           A
nucleon nX fX /nH ≈ 9.3 × 10⁻⁶ (Draine 1989a). Since we expect the oscillator
                            <
strength per molecule fX ∼ 0.5, it can be concluded that the carrier molecule
must contain one or more elements from {C,O,Mg,Si,Fe}, as these are the only
                                                                  >
condensible elements with sufficiently high abundances nX /nH ∼ 4 × 10⁻⁵ in the
ISM.
   Fitzpatrick & Massa (1986) show that the width of the feature varies consider-
ably from one sightline to another. The FWHM has an average value 0.992 µm−1 ,
but the distribution has a ±2σ variation of ±12%. This variability in FWHM is
in contrast to the fact that the central wavelength λ0 is nearly invariant from one
sightline to another: although variations are detected, λ0 shows ±2σ variations
of only ±0.46%.
10                                                                             Draine

   Immediately following discovery of the 2175˚ feature by Stecher (1965), Stecher
                                                  A
& Donn (1965) pointed out that small graphite particles would produce absorp-
tion very similar to the observed feature. Although non-carbonaceous carriers
have been proposed (e.g., OH− on small silicate grains: Steel & Duley 1987),
it now seems likely that some form of graphitic carbon is responsible for the
observed feature.
   The C atoms in graphite are bound to one another in hexagonal sheets. Each C
atom has 4 valence electrons (2s2 2p2 ); 3 of these are in trigonal sp2 or σ orbitals;
the remaining electron is in a delocalized π orbital, which is shared among the C-
C bonds. The individual sheets of carbon atoms are held parallel to one another
only by weak van der Waals forces. Absorption of a photon can excite a π electron
to an excited orbital (π ∗ ); this π → π ∗ transition is responsible for the absorption
feature peaking at ∼ 2175˚. Using the dielectric function of graphite (Draine &
                              A
Lee 1984), one finds that randomly-oriented small graphite spheres would have
an oscillator strength f = 0.16 per C atom (Draine 1989a). Thus the observed
2175˚ extinction feature would require C/H=5.8×10−5 in small graphite spheres,
     A
compatible with interstellar abundance constraints.
   Although graphite is an attractive candidate, the graphite hypothesis does not
appear to have a natural way to accomodate the observed variations in FWHM
of the profile while at the same time holding λ0 nearly constant: variations in
graphite grain shape and size produce variations in FWHM, but these are ac-
companied by changes in λ0 (Draine & Malhotra 1993).
   Mennella et al. (1998) propose that the 2175˚ feature is due to UV-processed
                                                    A
HAC particles, but do not appear to have actually measured in the lab a profile
matching the interstellar 2175˚ feature.
                                  A
   Wada et al. (1999) propose that the 2175˚ feature is due to onion-like hyper-
                                                 A
fullerene carbon particles. While these particles do have an absorption peak near
2200˚, the feature appears to be broader than the interstellar profile.
     A
   The carbon atom skeleton of polycyclic aromatic hydrocarbon (PAH) molecules
is very similar to a portion of a graphite sheet, with similar electronic wavefunc-
tions. It is therefore not surprising that PAH molecules generally have strong
π → π ∗ absorption in the 2000–2500˚ region. Thus large PAH molecules are
                                          A
candidates to be the carrier of the interstellar 2175˚ feature – this is a natural
                                                          A
extension of the graphite hypothesis.
   The grain model of Weingartner & Draine (2001a) and Li & Draine (2001b)
has C/H=6.0 × 10−5 in PAH molecules or clusters containing from 20 to 105 C
atoms – this population of PAH molecules is required to reproduce the observed
infrared emission (see §9). Absorption profiles are not known for PAH molecules
of the sizes characteristic of the interstellar PAHs, but one would expect a similar
π → π ∗ oscillator strength per C as for graphite, or f ≈ 0.16. Thus we see that
in this grain model, the 2175˚ extinction feature is expected to be primarily –
                                  A
perhaps entirely – due to large PAH molecules.
   In this interpretation, the observed band profile would be due to a mixture of
PAHs, and the observed variations in FWHM (and small variations in λ0 ) would
result from differences in the PAH mix from one sightline to another.

3.2   Silicate Features
The infrared extinction includes a strong absorption feature peaking at ∼9.7 µm.
Silicate minerals generally have strong absorption resonances near 10 µm due
Interstellar Dust Grains                                                                         11

to the Si-O stretching mode, and it seems virtually certain that the interstellar
9.7 µm feature is due to absorption by interstellar silicate material. This con-
clusion is strengthened by the fact that a 10 µm emission feature is observed
in outflows from cool oxygen-rich stars (which would be expected to condense
silicate dust) but not in the outflows from carbon-rich stars (where silicates do
not form, because all of the oxygen is locked up in CO). There is also a broad
feature at 18 µm which is presumed to be the O-Si-O bending mode in silicates
(McCarthy et al. 1980; Smith et al. 2000).
   The Trapezium (Gillett et al. 1975) emission implies τ (λ) with FWHM≈3.45 µm,
whereas µ Cep (Russell et al. 1975) has FWHM=2.3 µm, so the silicate properties
are not universal. On sightlines dominated by relatively diffuse clouds (e.g., to-
ward the B5 hypergiant Cyg OB2-12 or distant WC stars) the 9.7 µm absorption
appears to be better fit by the narrower µ Cep profile (Roche & Aitken 1984,
Bowey et al. 1998). The silicates in molecular clouds, however, seem better fit by
the broader Trapezium profile (Bowey et al. 1998).
   The strength of the 9.7 µm feature relative to AV has been measured toward
Cyg OB2-12 and toward WC stars. The studies in Table 1 together indicate
AV /∆τ9.7 = 18.5 ± 2.0, where the uncertainty includes a subjective allowance for
systematic errors in the model-fitting.

                     Table 1: Silicate 9.7 µm Feature Strength
  Sightline      l      b       d  AV       ∆τ9.7       AV /∆τ9.7 ref
                 (◦ )  (◦ )   (kpc)(mag)
  Gal. center     0     0      8.5 34 ± 4   3.6 ± 0.3    9±1       Roche & Aitken (1985)
  Cyg OB2-12 80.10 0.83        1.7 10       0.58          17.2     Roche & Aitken (1984)
  “                                10.2     0.54          18.9     Whittet et al. (1997)
  “                                10.2     0.64          15.9     Bowey et al. (1998)
  WR98A        358.13 -0.03   1.90 12.5     0.62          20.2     van der Hucht et al. (1996)
  “                                11.2     0.64          17.4     Schutte et al. (1998)
  WR112        12.14 -1.19    4.15 13       0.61          21.3     Roche & Aitken (1984)
  “                                11.9     0.64          18.6     van der Hucht et al. (1996)
  “                                12.0     0.56          21.4     Schutte et al. (1998)
  WR118        21.80 -0.22    3.13 13.3     0.69          19.3     Roche & Aitken (1984)
  “                                12.6     0.65          19.4     van der Hucht et al. (1996)
  “                                12.8     0.71          18.0     Schutte et al. (1998)
         Local Diffuse ISM                               18.5 ± 2   overall


   The interstellar 9.7 µm feature is broad and relatively featureless, as opposed to
absorption profiles measured in the laboratory for crystalline silicates, which show
considerable structure which can be used to identify the precise mineral. The
absence of substructure in the interstellar profile is believed to indicate that the
interstellar silicates are largely amorphous rather than crystalline. Amorphous
or glassy silicates can be produced in the laboratory by ion bombardment of
initially crystalline material (Kraetschmer & Huffman 1979), formation in smokes
(Day 1979), rapid quenching of a melt (J¨ger et al. 1994) or deposition following
                                           a
evaporation (Koike & Tsuchiyama 1992, Stephens et al. 1995, Scott & Duley
1996). The laboratory absorption profiles are in some cases quite similar to the
interstellar profile, supporting the view that interstellar silicates are amorphous.
   The observed strength per H nucleon of the interstellar silicate band appears to
require that close to 100% of the solar abundance of Si, Fe, and Mg be condensed
into amorphous grains. Mathis (1998) has argued that the observed strength can
12                                                                          Draine

only be reproduced if silicate grains are “fluffy”, with ≥25% vacuum, as in the
grain model of Mathis & Whiffen (1989).
   The observed 10 µm profile appears to be consistent with amorphous material
with a composition in the olivine family, Mg2x Fe2−2x SiO4 . Since Mg and Fe are
of approximately equal abundance in the Sun, it would be reasonable to have
x ≈ 0.5. Li & Draine (2001a) conclude that spectrophotometry of the 9.7 µm
feature in extinction toward Cyg OB2-12 (Bowey et al. 1998) limits the fraction
                                         <
of the Si in crystalline silicates to be ∼ 5%. Demyk et al. (1999) find that for
two protostellar objects, at most 2% of the silicates could be crystalline.
   However, Bowey & Adamson (2002) argue that the observed 10 µm profile
toward Cyg OB2-12 is consistent with a mixture of amorphous silicates (40% by
mass) and 8 crystalline pyroxenes (60% by mass); each of the crystalline species in
their mix contributes ∼7.5% by mass, and the fine structure in the 10 µm profile
appears to be consistent with the observations. However, this interpretation
raises various concerns:
     • The lab measurements were for powders in a KBr matrix; spectra in vacuo
       would be different. Bowey & Adamson (2002) state that the “KBr shift”
       is minimal, but it would be expected to be significant near these strong
       resonances.
     • A mix of crystalline grains that gives a smooth absorption profile will not
       give a smooth emission profile unless the different crystalline materials are
       heated to the same temperature.
     • The different crystalline types have distinct far-infrared modes. The smooth-
       ness of the far-infrared spectra of star-forming regions places upper limits
       on crystalline abundances. For example, the proposed mixture has ∼7.5%
       of the Si atoms in diopside, but the observations of Onaka & Okada (2003)
                                      <
       (see below) limit diopside to ∼ 2% of interstellar Si.
     • It is not apparent that the proposed mixture would be consistent with the
       18 µm extinction profile.
     • The polarization profile of grains near strong resonances is sensitive to the
       dielectric function. It is not apparent that the proposed mixture would be
       consistent with spectropolarimetric constraints (see below).
Further study of these points is urgently required. In the text below it is assumed
that interstellar silicates are predominantly amorphous, but the reader should
keep in mind that a significant crystalline fraction may be possible.
   The 9.7 and 18 µm silicate features can be observed in polarization, either in
absorption or in emission. For strong resonances (such as the two silicate fea-
tures), the polarization profile differs from the absorption profile, so that spec-
tropolarimetry can constrain the dielectric function of the grain material (Martin
1975). The observed intensity and polarization across the 9.7 µm feature appear
to be approximately consistent with the “astronomical silicate” dielectric func-
tion estimated by Draine & Lee (1984), but the observed 20 µm polarization is
stronger than expected for that dielectric function (Aitken et al. 1989, Smith et
al. 2000).
   Onaka & Okada (2003) report detection of an emission feature at 65 µm which
may be due to diopside CaMgSi2 O6 , containing 5-10% of interstellar Ca (cor-
responding to 0.35-0.7% of interstellar Si); if confirmed, this would be the first
evidence for crystalline silicates in the ISM. While crystalline silicates are not
Interstellar Dust Grains                                                            13

abundant in the ISM, there is evidence from distinctive emission features for
their presence in dust disks around main-sequence stars (see Artymowicz 2000
for a summary), young stellar objects and evolved stars (see Waelkens et al. 2000
for a summary), and in some solar-system comets (see Hanner 1999 for a sum-
mary); see §5.1 below. Nevertheless, even in these systems most of the silicate
material remains amorphous.


                                                    ˚
Figure 5: Diffuse interstellar bands in the 5700-6670A region, using DIB parameters from
Jenniskens & Desert (1994).


3.3   Diffuse Interstellar Bands
The observed extinction curve includes a large number of weak extinction fea-
tures, known as the “diffuse interstellar bands”, or DIBs. The DIBs have FWHM
 ∼ 1˚, too broad to be due to molecules with ∼ 5 atoms in the gas phase, and
 > A                                              <

are therefore features of the grain population. Jenniskens & Desert (1994) list
154 “certain” DIBs in the interval 0.38–0.868 µm, plus an additional 52 “prob-
able” detections. Figure 5 shows an average extinction curve for 1.5 µm−1 <
λ−1 < 1.75 µm−1 , a wavelength range which includes several strong DIBs, most
notably the DIB at 5780˚. This curve consists of the smooth extinction calcu-
                          A
lated using the Fitzpatrick (1999) parametrization plus individual diffuse bands
approximated by Drude profiles with central wavelengths, FWHM, and strengths
from the tabulation of Jenniskens & Desert.
   The first DIBs were discovered over 80 years ago (Heger 1922) and their in-
terstellar nature was established 69 years ago (Merrill 1934), yet to date not
a single DIB has been convincingly identified! Some of the DIBs may be ab-
sorption features produced by individual PAH molecules in the interstellar PAH
mixture. D´sert et al. (1995) report a positive correlation between the strength of
            e
the 2175˚ bump and the strength of certain DIBs. High resolution observations
          A
14                                                                          Draine

of the 5797˚ and 6614˚ DIBs show fine structure which could be indicative of
            A             A
rotational bands (Kerr et al. 1996, 1998).
   DIBs have recently been detected toward reddened stars in the LMC and SMC
(Ehrenfreund et al. 2002).
   If the DIBs were due to absorption in the aligned grains responsible for the po-
larization of starlight (§6) there should be excess polarization associated with the
DIBs (Martin & Angel 1974, Purcell & Shapiro 1977). All attempts to measure
polarization structure associated with DIBs have yielded only upper limits (see
Adamson & Whittet 1995) that appear to require that at least the DIBs that
have been studied originate in non-aligned material, consistent with a molecular
origin.
   At this time the carriers of the DIBs remain unknown, but it seems likely
that at least some are due to large molecules/ultrasmall grains, possibly of PAH
composition.

3.4   3.4µm Feature: Aliphatic C-H Stretch
                                                                           >
A broad extinction feature at 3.4 µm is measurable on sightlines with AV ∼ 10 mag
(Adamson et al. 1990). The feature appears to be present in diffuse atomic re-
gions (in contrast to the “ice” features, see §3.5), and therefore is likely due to
“refractory” grain material. The C-H stretching mode in aliphatic (chain-like)
hydrocarbons occurs at 3.4 µm. Since such hydrocarbons are plausible grain con-
stituents, the observed 3.4 µm absorption is generally attributed to the aliphatic
C-H stretch (Sandford et al. 1991).
   Unfortunately, aliphatic hydrocarbons show considerable variation in the C-H
band strength, so it has not been possible to use the measured 3.4 µm feature
to determine the abundance of aliphatic hydrocarbon material in the interstellar
grain population, nor is it possible to identify the specific hydrocarbon mate-
rial (Pendleton & Allamandola 2002). Sandford et al. (1991, 1995) suggest that
the 3.4 µm feature in the diffuse ISM is due mainly to short saturated aliphatic
chains containing ∼4% of the total C abundance. Greenberg et al. (1995) sug-
gest that the 3.4 µm feature is due to carbonaceous organic residues produced by
UV photolysis of ice mantles; Duley et al. (1998) attribute the feature to hydro-
genated amorphous carbon (HAC) material incorporating 20–25% of the total C
abundance;
   In grain models where the 3.4 µm absorption is assumed to arise in hydrocarbon
mantles coating silicate grains (e.g., Li & Greenberg 1997), the 3.4 µm feature
would be polarized when the 9.7 µm silicate feature is polarized; this allows a
direct test of the silicate core/hydrocarbon mantle model for interstellar dust (Li
& Greenberg 2002).

3.5   Ice Features
Sightlines passing through dense molecular clouds typically show additional ab-
sorption features. The strongest feature is the 3.1 µm O-H stretching mode in
solid H2 O. Whittet et al. (1988) showed that in the Taurus dark cloud complex,
the strength of this feature is approximately given by

                        0                         <
                                           for AV ∼ 3.3 mag ,
             ∆τ3.1 ≈                              >                             (7)
                        0.093(AV − 3.3mag) for AV ∼ 3.3 mag ,
Interstellar Dust Grains                                                          15

suggesting that dust in regions with AV > 3.3 has an ice coating, whereas dust
in regions with AV < 3.3 is iceless. The 3.1 µm feature is accompanied by a
number of weaker features due to H2 O, plus additional features due to CO2 ,
NH3 , CO, CH3 OH, CH4 , and other species. The features due to different species
often overlap, and the positions and shapes of particular spectral features can
be sensitive to the composition of the frozen mixture, complicating abundance
determinations. Table 2 gives the abundances relative to H2 O estimated for
two sightlines into dense star-forming regions (W33A and W3:IRS5) and for the
sightline to Sgr A∗ at the Galactic Center. Although all three sightlines have
similar CO2 /H2 O ratios, the abundances of other species (e.g., CH3 OH) vary
considerably from one sightline to another. The composition of the ice mantle
must be sensitive to both local environment and history.

                             Table 2: Major Ice Components
                  X            λ       ∆τλ                 N (X)/N (H2 O)
                            (µm)      W33A       W33A         W3:IRS5     GC
                H2 O         3.1a   5.5 ± 0.5d      1            1         1
                XCN          4.62      1.4d       .035d
                 CO          4.67      1.3e       .081e       .030e    < 0.12h
                H2 CO       5.81j      0.17j      .065j         -      < .024h
                 CH4          7.7     0.11f       .016d      .0043f     .024h
                NH3          9.0k                < 0.05l     < .035f   0.2-0.3g
               CH3 OH        9.8b   0.9 ± 0.2d    0.18d      < .004f   < .04h
                CO2         15.2c     0.58e       0.13e       0.13e     0.14e
a
  Also 6.0, 13.5, 45µm
b
  Also 4.27µm
c
  Also 3.53, 6.85µm
d
  Gibb et al. (2000)
e
  Gerakines et al. (1999)
f
  G¨rtler et al. (2002)
    u
g
  Lacy et al. (1998)
h
  Chiar et al. (2000)
j
  Keane et al. (2001)
k
  Also 2.27, 2.96, 3.48µm
l
  Taban et al. (2003)


  The grains in star-forming clouds are often aligned (see §6.2), and the radiation
reaching us from embedded sources is often polarized. Polarization has been
measured in the features at 3.1 µm (H2 O), 4.6 µm (XCN) and 4.67 µm (CO)
(Chrysostomou et al. 1996, Hough et al. 1996).

3.6   3.3, 6.2, 7.7, 8.6, 11.3µm PAH Features
Many emission nebulae (HII regions, planetary nebulae) and reflection nebulae
show emission in the 3–15 µm region that is far stronger than expected from
a ∼ 100˚ grains heated by the ambient radiation field and emitting thermally.
  >     A
Much of the emission is concentrated in five features at 3.3, 6.2, 7.7, 8.6, and
11.3 µm (see Figure 6). Leger & Puget (1984) identified these features as the
optically-active vibrational modes of PAH molecules. When H atoms are attached
to the edge of an aromatic ring skeleton, there are characteristic optically-active
16                                                                               Draine


Figure 6: PAH emission features in the 5–15 µm spectrum of the reflection nebula NGC 7023.

vibrational modes (Allamandola et al. 1989):
     • C-H stretching mode at 3.3 µm
     • C-C stretching mode at 6.2 µm
     • C-C stretching mode at 7.7 µm
     • C-H in-plane bending mode at 8.6 µm
     • C-H out-of-plane bending mode with wavelength depending on the number
       of neighboring H atoms:
         –   11.3 µm for “mono” H (no adjacent H)
         –   12.0 µm for “duo” H (2 contiguous H)
         –   12.7 µm for “trio” H (3 contiguous H)
         –   13.55 µm for “quartet” H (4 contiguous H)
Examples of “mono”, “duo”, “trio”, and “quartet” sites are indicated in Figure
7. Although the broadness of the observed features precludes identification of
specific PAH molecules, a population of PAH molecules appears to provide a
natural explanation for the observed emission spectrum, where the vibrational
excitation is assumed to be the result of “internal conversion” of energy following
absorption of an optical or UV photon (Leger & Puget 1984, Allamandola et al.
1989).
  There should in principle be absorption associated with these emission features.
An absorption feature at 6.2 µm (see Figure 4) has been observed (Schutte et al.
1998, Chiar et al. 2000). It matches closely the expected 6.2 µm absorption feature
(Li & Draine 2001b).
Interstellar Dust Grains                                                           17


Figure 7: The structure of 4 PAH molecules. Examples of mono, duo, trio, and quartet H
sites are indicated.


3.7    X-Ray Absorption Edges
Interstellar grains absorb and scatter X-rays. The X-ray absorption by atoms
such as C, O, Mg, Si, and Fe will show photoelectric “absorption edges” similar
to atoms in the gas phase, but the precise energy and structure of the absorption
edge will be dependent on the chemical nature of the grain material (Forrey et
al. 1998, Draine 2003b). Significant structure in both scattering and absorption
is expected near the C K (284 eV), O K (538 eV), Fe L2,3 (708, 721 eV), Mg K
(1311 eV), Si K (1846 eV), and Fe K (7123 eV) edges (Draine 2003b). The
Chandra observatory has been used to study the absorption edges of O (Paerels
et al. 2001, Takei et al. 2002) and O, Mg, Si, and Fe (Schulz et al. 2002) but it
has not yet proved possible to identify the chemical form in which the solid-phase
Mg, Si, Fe and O are bound.

3.8    Extended Red Emission
The “extended red emission” (ERE) from dust grains provides a potentially im-
portant clue to the composition of interstellar dust. The ERE consists of a
broad featureless emission band between ∼ 5400˚ and ∼ 9000˚, peaking at
                                                   A              A
    ˚ ∼ λp ∼ 8200A, and with a FWHM in the range 600–1000˚. The peak
6100A  <    <      ˚                                               A
wavelength λp and band profile appear to vary from one region to another.
  First observed in the Red Rectangle (Schmidt et al. 1980), ERE has since been
seen in a wide variety of dusty environments, including reflection nebulae (Witt
& Schild 1985, Witt & Boroson 1990), planetary nebulae (Furton & Witt 1990),
HII regions (Darbon et al. 2000), the diffuse ISM of our Galaxy (Gordon et al.
1998, Szomoru & Guhathakurta 1998), and from other galaxies (Pierini et al.
2002).
18                                                                          Draine

   The ERE must be photoluminescence: absorption of a starlight photon followed
by emission of a lower energy photoluminescence photon. Based on the detection
of ERE from the diffuse ISM, the photon conversion efficiency of interstellar dust
is estimated to be 10%±3% (Gordon et al. 1998, Szomoru & Guhathakurta 1998).
The photoluminescence efficiency of the ERE carrier must exceed this, since it is
presumably not the only UV/visible photon absorber.
   The luminescing substance remains uncertain. Candidate ERE materials in-
clude HAC (Duley 1985, Witt & Schild 1988), PAHs (d’Hendecourt et al. 1986),
quenched carbonaceous composite (Sakata et al. 1992), C60 (Webster 1993), coal
(Papoular et al. 1996), silicon nanoparticles (Ledoux et al. 1998, Witt et al. 1998,
Smith & Witt 2002), and carbon nanoparticles (Seahra & Duley 1999).
   Most candidate materials appear unable to match the observed ERE spec-
tra and efficiency (Witt et al. 1998). Lab studies of the luminescence spectrum
of hydrogenated amorphous carbon (HAC) appeared to show a good match to
observed ERE spectra (Witt & Schild 1988) provided the HAC is annealed suf-
ficiently to shift the luminescence into the red, where it is observed; however,
such red-luminescing HAC has a very low photoluminescence efficiency (Furton
& Witt 1993, Rusli et al. 1996) that is incompatible with the high efficiency
required to explain the ERE from the diffuse ISM.
   Each of the nanoparticle hypotheses appears to have difficulties: (1) Seahra &
Duley (1999) argue that small carbon particles with mixed sp2 /sp3 bonding can
reproduce the observed ERE profile and required efficiency, but they predict a
second ERE peak at ∼ 1 µm which does not appear to be present in NGC 7023
(Gordon et al. 2000). (2) The PAH hypothesis has difficulty with (a) ERE emis-
sion and PAH emission having differing spatial distributions in HII regions (Sivan
& Perrin 1993, Darbon et al. 2000), and (b) nondetection of ERE in reflection
nebulae illuminated by stars with Teff < 7000 K (Darbon et al. 1999), whereas
PAH emission bands are seen in these regions. (3) The silicon nanoparticle hy-
pothesis appears to be ruled out by nondetection of ∼ 20 µm emission that should
result from single-photon heating (see §9) in the silicon nanoparticle model (Li
& Draine 2002a).
   Recently, two new emission features have been reported in the near-infrared,
at 1.15 and 1.5 µm (Gordon et al. 2000). Smith et al. (2001) propose that the
1.5 µm feature is due to β-FeSi2 .
   Although it would appear that all current proposals have been ruled out, the
arguments against them are not yet conclusive. For example, perhaps it is possi-
ble to prepare HAC samples that achieve a higher photoluminescence efficiency,
or there may be some way to explain the lack of PAH emission seen in the Bub-
ble nebula, or silicon nanoparticles might be part of larger structures. At this
point it seems appropriate to continue consideration of HAC, PAHs, and silicon
nanoparticles as candidate ERE carriers.

4    PRESOLAR GRAINS IN METEORITES AND INTERPLAN-
     ETARY DUST
The most primitive meteorites contain presolar grains, which are recognized by
virtue of isotopically anomalous composition – see Hoppe & Zinner (2000) for a
recent review. Table 3 lists the six presolar grain types that have been identified
thus far, along with their abundance (fraction of the total mass) in the bulk
Interstellar Dust Grains                                                                19

meteorite. Nanodiamond (sp3 -bonded carbon) grains make up 0.05% = 500 ppm
of the meteorite. A tiny fraction of the nanodiamond particles contain a trapped
Xe atom; the isotopic abundances of the trapped Xe suggests formation in SN
ejecta. SiC grains are the next most abundant by mass (6 ppm), with isotopic
patterns that indicate formation primarily in outflows from AGB stars. About
0.5% of the SiC grains are of “Type X”, with isotopic abundances, including live
44 Ti (T
        1/2 = 59 yr) at the time of grain formation, which suggest formation in
Type II supernovae. About 1 ppm of the meteorite consists of graphitic (sp2 -
bonded carbon) grains, formed in AGB stars, supernovae, and novae. Al2 O3
corundum grains are found, at least some of which appear to have formed in
outflows from red giants and AGB stars. Finally, there are also Si3 N4 grains
which appear to have a SN II origin.

           Table 3: Presolar Grains in Meteorites (Hoppe & Zinner 2000)
               Composition          diameter( µm) Abundancea           Originsb
               C(diamond)                0.002        5 × 10⁻⁴           SN
               SiCc                     0.3–20        6 × 10⁻⁶          AGB
               C(graphite)d              1–20         1 × 10⁻⁶    AGB,SN II,nova
               SiC type X                 1–5         6 × 10⁻⁸           SN
               Al2 O3 (corundum)         0.5-3        3 × 10⁻⁸        RG,AGB
               Si3 N4                     ∼1          2 × 10⁻⁹          SN II
               a
                 Overall abundance in primitive carbonaceous chondrite meteorites.
            b
              SN = supernova; AGB = asymptotic giant branch star; RG = red giant
                     c
                       SiC grains sometimes contain very small TiC inclusions.
       d
           graphite grains sometimes contain very small TiC, ZrC, and MoC inclusions.


   It is important to recognize that the procedures used to search for presolar
grains in meteorites begin with chemical treatments designed to dissolve the
silicate matrix in which the presolar grains are embedded. It therefore comes as
no surprise that silicates are not present in Table 3. It should also be recognized
that the formation of even the most primitive meteorites involved temperatures
high enough to melt rocks, in an environment which was presumably oxidizing
(since the solar nebula had O/C > 1). Therefore the relative abundances in Table
3 probably have more to do with the ability of grain types to survive a period of
exposure to a hot, oxidizing environment than with interstellar abundance.
   Much more informative would be the abundances of presolar grains in cometary
material. A “core sample” would be ideal, but at this time there is no planned
mission for returning a sample of pristine cometary ice to Earth. However, the
Stardust mission (Brownlee et al. 2000) will collect cometary dust on an aerogel
panel during the 6.1 km s−1 encounter of the Stardust spacecraft with Comet
Wild 2 in January 2004, and return it to Earth.
   Interstellar grains enter the solar system, and have been detected by the
Ulysses and Galileo spacecraft; the impact rate is consistent with expectations
                                                     >
for a ≈ 0.3 µm grains, but the impact rate for a ∼ 1 µm grains is much larger
than expected for the average interstellar dust distribution (Frisch et al. 1999,
Weingartner & Draine 2001a). The Stardust mission will expose an aerogel panel
to interstellar grains flowing through the solar system; with ∼ 25km s−1 impact
speeds, these grains are likely to be destroyed, but their residue in the aerogel
can be analyzed for total mass and composition. We await the return of Stardust
in January 2006.
20                                                                              Draine

   Active comets release their dust grains, which become part of the interplan-
etary dust particle (IDP) population. IDPs can be collected from the Earth’s
atmosphere (Brownlee 1985). Bradley (1994) identifies a class of glassy silicate
IDPs, known as GEMS (Glass with Embedded Metals and Sulfides), which ap-
pear to be presolar. Most GEMS are between 0.1 and 0.5 µm in diameter –
similar to the sizes of interstellar silicates (see Figure 8). The 8 − 13 µm infrared
absorption spectrum of these grains is similar to interstellar silicates (Bradley et
al. 1999).

5     CANDIDATE GRAIN MATERIALS
Based on the observations and clues described above, it is possible to formulate
a short list of candidate materials for the bulk of interstellar dust. We will omit
from consideration “rare” materials like Al2 O3 – even though Al is depleted from
the gas phase, given the solar abundance of Al (Al/H = 3.1 × 10⁻⁶ ) aluminum-
based materials account for only a few % of interstellar grain mass.

5.1   Silicates
There is little doubt that silicate material contributes a substantial fraction of
the total mass of interstellar dust. As discussed above (§3.2), in the ISM, at least
∼95% of the silicate material is amorphous (Li & Draine 2002a). In some cir-
cumstellar disks the crystalline fraction appears to be higher, although it appears
that the bulk of the silicates remain amorphous. Bouwman et al. (2001) find that
5-10% of the olivine mass is crystalline in the dust around Herbig Ae/Be stars.
   Cosmic abundances dictate that the dominant metal ions in silicates will be
either Mg, Fe, or both. There are two general chemical classes of crystalline
silicates: Mg-Fe pyroxenes Mgx Fe1−x SiO3 (including enstatite MgSiO3 and fer-
rosilite FeSiO3 ) and olivines Mg2x Fe2−2x SiO4 (including forsterite Mg2 SiO4 and
fayalite Fe2 SiO4 ). There are two different crystalline structures for the pyroxenes:
orthopyroxene and clinopyroxene.
   The optical constants of various crystalline pyroxenes have been measured by
J¨ger et al. (1998) and Chihara et al. (2002); crystalline olivines have been mea-
  a
sured by J¨ger et al. (1998), Koike et al. (1999), and Suto et al. (2002).
            a
   As noted above, some circumstellar dust exhibits emission features character-
istic of crystalline silicates, and from the locations and strengths of these features
it is possible to infer the Mg:Fe ratio. In all cases thus far the crystalline silicate
material appears to be very Mg-rich and Fe-poor, consistent with pure forsterite
and enstatite (Tielens et al. 1998, Molster et al. 2002a). Molster et al. (2002b)
report that enstatite MgSiO3 is more abundant than forsterite Mg2 SiO4 around
most evolved stars.
   Si is generally heavily depleted in the ISM. If Si is predominantly in silicates,
and if Fe is not present in silicates, then the interstellar silicates would be expected
to be enstatite MgSiO3 . The Fe would then presumably be in either metallic Fe
or in oxide form (FeO, Fe2 O3 , Fe3 O4 ). However, while there is evidence for Mg-
rich silicate in circumstellar dust, we do not yet have a reliable indication of the
composition of interstellar silicates, so an appreciable Fe fraction, and olivine-like
composition, are not ruled out.
   Observed gas-phase abundances of Mg, Fe, and Si, and variations in these
abundances from one cloud to another, have been interpreted as indicating that
Interstellar Dust Grains                                                           21

silicate grains may have a Mg-rich mantle and Fe-rich core (Spitzer & Fitzpatrick
1993). The total ratio of (Fe+Mg) atoms to Si atoms in grains is estimated
to be ∼3.4:1 (Fitzpatrick 1997), ∼3:1 (Howk et al. 1999) – in excess of the 2:1
ratio expected for olivines, suggesting that metal oxides or metallic Fe may be
present in addition to silicates. However, these conclusions depend upon assumed
values of the total interstellar abundances; Sofia & Meyer (2001) conclude that
the (Fe+Mg):Si ratio in interstellar dust is actually close to 2:1 for both “halo”
dust and the dust in the well-studied ζOph cloud.
   The composition of interstellar silicates remains uncertain, but the study by
Sofia & Meyer (2001) suggest that olivine MgFeSiO4 appears to be a reasonable
approximation.

5.2     Carbonaceous Materials
By “carbonaceous” we mean materials which are predominantly C by mass, in-
cluding:
      • Diamond: sp3 -bonded carbon.
      • Graphite: sp2 -bonded carbon, either monocrystalline or polycrystalline.
      • Amorphous or glassy carbon: a mixture of sp2 - and sp3 -bonded carbon,
        with only short-range order.
      • Hydrogenated amorphous carbon: amorphous carbon with an appreciable
        hydrogen fraction.
      • Polycyclic aromatic hydrocarbons: sp2 -bonded carbon with peripheral H
        (see §3.6).
      • Aliphatic (chainlike) hydrocarbons (see §3.4)
The presence of sp2 -bonded carbon is indicated by the 2175˚ feature and the
                                                              A
PAH emission bands. The 2175A    ˚ feature requires sp2 -bonded carbon in small
(a ∼ 100˚) particles (in larger particles the 2175˚ feature is suppressed), and
    <    A                                        A
single-photon excitation of the PAH emission features requires very small par-
             <
ticles, with ∼ 104 C atoms. A PAH population incorporating a C abundance
C/H≈ 60 × 10−6 appears able to account for both the PAH emission features
(§3.6) and the 2175˚ feature (§3.1).
                   A

5.3     SiC
SiC grains are found in meteorites (§4) and an emission feature at 11.3 µm is ob-
served in the spectra of many carbon stars (Treffers & Cohen 1974, Blanco et al.
1998). However, absence of the 11.3 µm feature in the interstellar extinction indi-
cates that the abundance of Si in SiC dust is less than 5% of the abundance of Si
in silicates (Whittet et al. 1990). Accordingly, SiC grains, although undoubtedly
present in the ISM, are not a major component of the interstellar grain mix.

5.4     Carbonates
Calcite CaCO3 and dolomite CaMg(CO3 )2 have been detected in dusty disks
within the planetary nebulae NGC6302 and NGC6537 (Kemper et al. 2002),
but these carbonates are estimated to contribute less than 1% of the dust mass.
Carbonates are evidently not a major component of the interstellar grain mix.
22                                                                          Draine

6     POLARIZATION

6.1   Optical-UV Polarization
Light reaching us from reddened stars is often linearly polarized, because the ex-
tinction depends on the polarization mode. The degree of polarization as a func-
tion of wavelength can be approximated by the “Serkowski law”, a 3-parameter
empirical fitting function (Serkowski 1973):

                     p(λ) = pmax exp −K(ln(λ/λmax ))2        ,                  (8)

where λmax ≈ 5500˚ and K ≈ 1 on typical sightlines through diffuse clouds.
                     A
The polarization arises from differential extinction by aligned dust grains, and
will depend on the degree of alignment with the local magnetic field, the angle
between the local magnetic field and the line of sight, and the degree to which
the direction of the magnetic field varies along the line of sight. Studies of many
sightlines (Serkowski et al. 1975) find that
                                <
                           pmax ∼ 0.03A(λmax )/mag      ,                       (9)

where A(λ) is the (polarization-averaged) extinction at wavelength λ. Interstellar
dust grains must be sufficiently nonspherical and sufficiently aligned so that at
λmax one polarization mode is extincted ∼6% more than the other polarization
mode. Values of pmax /A(λmax ) < 0.03/mag are presumed to result when the
magnetic field is disordered or not transverse to the line-of-sight, or from regions
where the degree of grain alignment is lower.
  The wavelength λmax varies from one sightline to another, and is correlated
with the value of RV , with

                         RV ≈ 3.67(λmax /5500˚) − 0.29
                                             A                                 (10)

(Clayton & Mathis 1988), and

                          K ≈ 1.02(λmax /5500˚) − 0.10
                                             A                                 (11)

(Wilking et al. 1982). The Serkowski law provides quite a good fit to the data for
           <   <
0.8 µm−1 ∼ λ ∼ 3 µm−1 . Observations in the vacuum UV (Anderson et al. 1996,
Clayton et al. 1996, Wolff et al. 1997) show that the degree of polarization con-
tinues to decline with decreasing wavelength. This implies that the small grains
responsible for the rising extinction in the vacuum UV are inefficient polarizers
– they are either nearly spherical or minimally aligned (Kim & Martin 1995).
   Most stars show no polarization excess in the 2175˚ feature but two do: a
                                                        A
2175˚ polarization feature is detected in HD 197770 and HD 147933-4 (Wolff et
     A
al. 1997).

6.2   Polarized Far-Infrared Emission
The aligned dust grains that polarize starlight will also produce linearly-polarized
infrared emission, because for an isotropic dielectric function a submicron grain
will radiate most effectively when the E field is parallel to the “long” axis of the
grain. It is now possible to map this polarized emission from dense regions. For
example, the W51 star-forming region has been mapped at 100 µm (Dotson etal
Interstellar Dust Grains                                                         23

2000), 850 µm (Chrysostomou et al. 2002), and 1.3mm (Lai et al. 2001), with
linear polarizations as large as 10% observed at 1.3mm.
   Hildebrand et al. (1999) have discussed the wavelength-dependence of the mea-
sured polarization for dense cloud cores and envelopes. The data suggest that
the grain alignment is larger in warmer regions.
   Observations of quiescent clouds are consistent with no grain alignment in the
central regions (Goodman et al. 1995, Padoan et al. 2001).
   Radiative torques due to anisotropic starlight play an important role in the
process of grain alignment (Draine & Weingartner 1997). These torques would be
ineffective in the central regions of quiescent dark clouds where external starlight
is heavily attenuated. In star-forming clouds such as M17 or W51, however,
starlight is provided within the clouds by recently-formed stars.

7   A PROVISIONAL GRAIN MODEL
Although we have quite good observational determinations of the extinction in the
near-infrared, optical, and UV regions, the extinction and scattering properties
of interstellar grains at very short wavelengths and very long wavelengths are
probably best obtained by calculating them using a physical grain model that has
been constrained by a variety of observations, including observations of extinction
and infrared emission.
   Mathis et al. (1977) discovered that the average interstellar extinction could be
satisfactorily reproduced by a grain model containing two components – graphite
grains and silicate grains. Remarkably, the extinction curve was reproduced very
well if both grain components had power-law size distributions, dn/da ∝ a−3.5 ,
truncated at a minimum size a− ≈ 50˚ and a maximum size a+ ≈ 2500˚. The
                                        A                                    A
success of this grain model led Draine & Lee (1984) to refine the optical constants,
and extend the treatment into the mid- and far-infrared. The graphite-silicate
model was applied in the X-ray region by Laor & Draine (1993).
   At the time when the “graphite-silicate” model was developed, PAHs had not
been recognized as a major interstellar grain material. With the recognition
that the interstellar grain population appears to include a substantial population
of ultrasmall grains with PAH composition, the “graphite-silicate” model has
recently been extended in a very natural way: the carbonaceous grains are now
assumed to be PAH molecules when very small, but to have physical and chemical
properties that can be approximated by grains of bulk graphite when larger than
                            >
∼ 0.01 µm (containing N ∼ 106 C atoms). The properties of the carbonaceous
grains are taken to change smoothly from PAH-like to graphite-like as the grain
size is increased.
   Models developed to account for the infrared emission spectrum of interstel-
lar dust require that the PAH population contain ∼ 15% of the interstellar C
abundance. These particles necessarily make a major contribution to the UV
extinction. Weingartner & Draine (2001a) have found size distributions for the
grains that, including the PAHs, are consistent with the extinction produced by
the interstellar grain population, and with the size distribution of the PAHs ad-
justed to reproduce the observed infrared emission from the diffuse ISM (Li &
Draine 2001b).
   The grain size distribution adopted by Weingartner & Draine (2001a) for aver-
age Milky Way dust (with RV = 3.1) is shown in Figure 8, but with abundances
24                                                                                Draine

reduced by a factor 0.93 to reproduce AIC /NH from eq. (4). The carbonaceous
grain distribution is trimodal: The peak at a ≈ 0.3 µm is required to reproduce
the observed extinction curve; the peak at a ≈ .0005 µm is required to reproduce
the 3 − 12 µm PAH emission features; and the peak at a ≈ 0.005 µm improves the
fit to the observed emission near 60 µm. The peaks at ∼ 0.3 µm and ∼ .0005 µm
are certainly real, but the peak at .005 µm could be an artifact of errors in the
adopted grain optical and FIR cross sections.


Figure 8: Size distributions for carbonaceous-silicate grain model of Weingartner & Draine
(2001a) for Milky Way dust with RV = 3.1, but with abundances decreased by a factor 0.93
(see text).

   The dielectric functions of graphite and “astrosilicate” (including structure at
X-ray absorption edges) have been reestimated by Draine (2003b). The extinction
and scattering cross sections per H nucleon, calculated for the Weingartner &
                                                                       >
Draine (2001a) grain model, are shown in Figs. 9 and 10. For λ ∼ 20 µm, the
extinction calculated for this grain model can be approximated by τ /NH ≈ 5 ×
10−25 cm2 (λ/100 µm)−2 , as seen in Figure 10. The scattering varies as expected
                               >
for Rayleigh scattering for λ ∼ 4 µm: τsca /NH ≈ 1.0 × 10⁻²¹ cm2 (λ/ µm)−4 .
   This provisional dust model does not include a component to reproduce the
observed 3.4 µm absorption feature (§3.4). If the graphite in the a ∼ 200˚ car-
                                                                        >    A
bonaceous grains is replaced with a mixture of graphite and aliphatic hydrocar-
bons, it seems likely that the extinction curve, including the 3.4 µm feature, could
be reproduced with only slight adjustments to the grain size distribution.
   The Weingartner & Draine (2001a) model has AV /∆τ9.7 = 14.2 (see Tables 4 –
6), 25% smaller than the observed value 18.5 for diffuse cloud dust (see Table 1).
Evidently the silicate abundance or the silicate band strength should be reduced
by ∼ 30%.
Interstellar Dust Grains                                                              25


Figure 9: Extinction and scattering calculated for Weingartner & Draine (2001a) model for
RV = 3.1 Milky Way dust, but with abundances reduced by factor 0.93 (see text).


8     SCATTERING

8.1   Optical and UV
Observations of light reflected from dust grains provides another test of dust grain
models. Individual reflection nebulae are bright, but comparisons with models
are uncertain because the scattering geometry is in general poorly-determined:
the illuminating star could be in front of the dust cloud (in which case the typical
scattering angle would be large) or it could be embedded within it (in which case
forward scattering by the dust grains between us and the star would dominate).
   The “diffuse galactic light” (DGL) consists of starlight scattered off the dust in
the diffuse ISM, illuminated by the general interstellar starlight radiation field.
Since we think we have independent knowledge of the spatial distribution of both
stars and dust, studies of dust properties using the DGL do not suffer from
geometric ambiguity. However, the DGL is faint (and must be distinguished
from the direct light from faint stars), and attempts to infer the grain albedo
and scattering asymmetry factor g ≡ cos θ often find that there can be a one-
parameter family of (albedo,g) values which are consistent with the observations.
   Figs. 11 and 12 show various observational estimates of albedo and g as a
function of wavelength for interstellar dust, based on observations of the DGL.
Determinations of grain scattering properties in the reflection nebulae NGC 7023
(Witt et al. 1992), IC435 (Calzetti et al. 1995), NGC 2023 (Burgh et al. 2002),
and the Pleiades (Gibson & Nordsieck 2003) are also shown.
    1. There does appear to be evidence for a decrease in albedo from the optical
       to the vacuum UV, although the results for NGC 7023 and IC435 at λ−1 >
       5 µm−1 do not conform.
26                                                                                 Draine


Figure 10: Extinction and scattering calculated for Weingartner & Draine (2001a) model for
RV = 3.1 Milky Way dust, but with abundances reduced by factor 0.93 (see text). The dashed
lines show the asymptotic behavior of the absorption (∝ λ−2 ) and scattering (∝ λ−4 ) cross
sections.


     2. The data are consistent with (but do not require) a rise in the scattering
        asymmetry factor g from optical to UV.
     3. The data in Figs. 11 and 12 appear to be consistent with the albedo and g
        calculated for the carbonaceous-silicate grain model.
The scatter in the results of different studies [e.g., the albedo and g near λ ≈
1600˚ (λ−1 ≈ 6.25 µm−1 ) in Figs. 11 and 12] serves as a warning that determining
    A
the albedo is model-dependent, requires accurate photometry, and, in the case
of photodissociation regions like NGC 7023, NGC 2023, or IC 435, may require
subtraction of fluorescent emission from H2 .

8.2    X-Ray Scattering
Interstellar grains scatter X-rays through small scattering angles, and as a result
X-ray point sources can appear to be surrounded by a diffuse “halo” of X-rays
scattered by dust grains between us and the source (Overbeck 1965, Hayakawa
1970, Martin 1970). Measurements of such halos provide a quantitative test of
interstellar grain models (Catura 1983, Mauche & Gorenstein 1986, Mitsuda et
al. 1990, Mathis & Lee 1991, Clark et al. 1994, Woo et al. 1994, Mathis et al.
1995, Predehl & Klose 1996, Smith & Dwek 1998, Witt et al. 2001, Smith et al.
2002).
   ROSAT observations of Nova Cygni 1992 provide the best observational data
at this time. Mathis et al. (1995) concluded that the observed halo on day 291
(after optical maximum) was best explained if the larger (a ≥ 0.1 µm) interstellar
grains had a “fluffy” morphology, with a void fraction ≥ 25% – if the grains were
Interstellar Dust Grains                                                                 27


Figure 11: Solid lines: scattering albedo calculated for Weingartner & Draine (2001a) model
for Milky Way dust with RV = 3.1, 4.0, and 5.5. Symbols: observational determinations. After
Draine (2003b).


compact the scattering halo would be stronger than observed. Smith & Dwek
(1998) argued that Mathis et al. (1995) had overestimated the scattering due
to their use of the Rayleigh-Gans approximation, and that in fact the observed
X-ray halo was consistent with compact grains. The same data was reconsidered
by Witt et al. (2001), who concluded that the observed halo intensity at small
scattering angles required a substantial population of large (a ≥ 1 µm) grains.
   Draine & Tan (2003) have revisited this question. Using data for 9 epochs, they
find that the Weingartner & Draine (2001a) PAH/graphite/silicate grain model
– with no adjustment to the size distribution – is consistent with the observed
X-ray halo, for 50′′ –3000′′ halo angles. Observations with ROSAT and Chandra
of other sources at energies between 0.7 and 4 keV also appear to be in general
agreement with the scattering expected for this grain model (Draine 2003b).
28                                                                                 Draine


Figure 12: Solid lines: Scattering asymmetry factor g = cos θ calculated for Weingartner &
Draine (2001a) model for Milky Way dust with RV = 3.1, 4.0, and 5.5. Symbols: observational
determinations. After Draine (2003b).


9    INFRARED EMISSION
Heating of interstellar dust grains is primarily by absorption of starlight (colli-
sional heating dominates only in dense regions in dark clouds – where the starlight
intensity has been severely attenuated – or in dense, hot, shocked gas). Since the
heating by starlight photons is quantized and stochastic, the temperature of a
dust grain is time-dependent. Figure 13 shows the temperature histories of 4
dust grains, heated by the average starlight background, and cooled by emis-
sion of infrared photons, over a time span of about 1 day. It is apparent that
for grains heated by the average starlight background, grains with radii a ∼ 200˚
                                                                           >     A
can be approximated as having a steady temperature. Grains with radii a ∼ 50˚,
                                                                            <    A
however, undergo very large temperature excursions, and the notion of “average
temperature” is not applicable. Most of the infrared power radiated by such
small grains occurs during brief intervals following photon arrivals, when the
grain temperature is close to the peak.
   In order to calculate the time-averaged emission spectrum for such small grains,
Interstellar Dust Grains                                                              29

          Table 4: Absorption and Scattering for 5 µm > λ > 0.1 µm           a
                          b      c                             d
                 CCM89    F99                       model
                                                               f
       λ   bande Aλ /AIC Aλ /AIC Aλ /AIC albedo cos θ       Cext              κabs
                                                             2
      µm                                                   cm /H             cm2 /g
     4.750  M             .0619   .0456   0.164 -.041 1.29×10⁻²³           5.76×10²
     3.800   L′           .0866   .0700   0.245 -.013 1.97×10⁻²³           7.97×10²
     3.450   L    .0931   0.103   .0845   0.282  .006   2.38×10⁻²³         9.16×10²
     2.190   K    0.190   0.212   0.197   0.439 0.131 5.56×10⁻²³           1.67×10³
     1.630   H    0.304   0.321   0.324   0.520 0.209 9.15×10⁻²³           2.35×10³
     1.220   J    0.485   0.489   0.514   0.585 0.289 1.45×10⁻²²           3.22×10³
     1.000        0.682   0.668   0.707   0.623 0.363 1.99×10⁻²²           4.02×10³
    0.9000        0.792   0.819   0.836   0.642 0.401 2.36×10⁻²²           4.53×10³
    0.8930   z    0.803   0.830   0.847   0.643 0.404 2.39×10⁻²²           4.57×10³
    0.8655  IJ    0.855   0.879   0.889   0.647 0.414 2.51×10⁻²²           4.73×10³
    0.8020  IC    1.000   1.000   1.000   0.658 0.438 2.82×10⁻²²           5.17×10³
    0.7480   i    1.134   1.125   1.111   0.665 0.459 3.13×10⁻²²           5.62×10³
    0.7000        1.246   1.255   1.226   0.671 0.479 3.46×10⁻²²           6.09×10³
    0.6492 RC     1.365   1.419   1.368   0.674 0.500 3.86×10⁻²²           6.72×10³
    0.6415 RJ     1.381   1.442   1.391   0.675 0.503 3.92×10⁻²²           6.83×10³
    0.6165   r    1.443   1.531   1.472   0.676 0.513 4.15×10⁻²²           7.21×10³
    0.5470   V    1.665   1.805   1.735   0.674 0.538 4.89×10⁻²²           8.55×10³
    0.4685   g    2.045   2.238   2.114   0.661 0.560 5.96×10⁻²²           1.08×10⁴
    0.4405   B    2.187   2.396   2.273   0.653 0.565 6.41×10⁻²²           1.19×10⁴
    0.3635   U    2.550   2.813   2.847   0.616 0.569 8.03×10⁻²²           1.65×10⁴
    0.3550   u    2.612   2.866   2.847   0.616 0.569 8.03×10⁻²²           1.65×10⁴
    0.3000        3.005   3.306   3.328   0.582 0.556 9.38×10⁻²²           2.10×10⁴
    0.2500        3.826   4.163   4.150   0.530 0.542 1.17×10⁻²¹           2.95×10⁴
    0.2300        4.729   5.115   5.052   0.459 0.545 1.42×10⁻²¹           4.12×10⁴
    0.2200        5.209   5.584   5.478   0.428 0.551 1.54×10⁻²¹           4.73×10⁴
    0.2175        5.264   5.626   5.515   0.424 0.554 1.56×10⁻²¹           4.79×10⁴
    0.2150        5.277   5.624   5.507   0.423 0.557 1.55×10⁻²¹           4.80×10⁴
    0.2100        5.173   5.503   5.381   0.428 0.563 1.52×10⁻²¹           4.64×10⁴
    0.2000        4.698   5.052   4.926   0.452 0.576 1.39×10⁻²¹           4.07×10⁴
    0.1900        4.322   4.705   4.542   0.466 0.594 1.28×10⁻²¹           3.66×10⁴
    0.1800        4.164   4.546   4.340   0.457 0.614 1.22×10⁻²¹           3.56×10⁴
    0.1600        4.232   4.585   4.346   0.403 0.653 1.23×10⁻²¹           3.92×10⁴
    0.1400        4.692   5.057   4.838   0.360 0.678 1.36×10⁻²¹           4.67×10⁴
    0.1200        5.928   6.234   5.787   0.321 0.675 1.63×10⁻²¹           5.93×10⁴
    0.1000                        7.492   0.273 0.649 2.11×10⁻²¹           8.23×10⁴
a
  Tabulated data is available at http://www.astro.princeton.edu/∼draine/dust/dust.html
b
  Cardelli et al. (1989) extinction fit for RV = 3.1
c
  Fitzpatrick (1999) extinction fit for RV = 3.1
d
   RV = 3.1 Milky Way dust model of Weingartner & Draine (2001a) but with abundances
reduced by 0.93, and using optical constants from Draine (2003b)
e
   λeff for JHKLL′ M from Bessell & Brett (1988); RJ IJ from Johnson (1965); Cousins
U BV RC IC from Fukugita et al. (1996); SDSS ugriz from Gunn (2002, private communica-
tion).
f
  Aλ = (2.5/ ln 10)Cext (λ)NH = 1.086Cext (λ)NH
g
  κabs (λ) = absorption cross section per unit dust mass. For this model, MH /Mdust = 90.


one must calculate the energy distribution function dP/dE, for grains of a par-
ticular size, where dP is the probability that a grain will have vibrational energy
in interval (E, E + dE). To solve for dP/dE, one must first calculate the specific
heat for the grain, and the cross sections for absorption and emission of photons.
Monte-Carlo simulations can be used to obtain dP/dE, but it is more efficient
30                                                                          Draine

                  Table 5: Absorption and Scatteringa for λ > 5 µm
                                                        a           a
               λ     Aλ /AIC   albedo   cos(θ)       Cext         κabs
                                                      2             2
              µm      model                         cm /H        cm /g
             1000.   .00002    .00000   -.004    5.48×10⁻²⁷   2.94×10⁻¹
             850.0   .00003    .00000   -.005    7.15×10⁻²⁷   3.83×10⁻¹
             350.0   .00013    .00000   -.005    3.58×10⁻²⁶    1.92×100
             200.0   .00042    .00001   -.004    1.19×10⁻²⁵    6.37×100
             140.0   .00092    .00001    .000    2.59×10⁻²⁵    1.39×101
             100.0   .00180    .00003    .007    5.07×10⁻²⁵    2.71×101
             60.00    .0058    .00007    .000    1.62×10⁻²⁴    8.70×101
             40.00    .0156    .00014   -.016    4.40×10⁻²⁴    2.36×10²
             25.00    .0317    .00031   -.025    8.95×10⁻²⁴    4.79×10²
             18.00    .0514    .00066   -.026    1.45×10⁻²³    7.76×10²
             14.00    .0327    .00283   -.029    9.22×10⁻²⁴    4.92×10²
             12.00    .0622    .00301   -.029    1.75×10⁻²³    9.37×10²
             9.700    0.140     .003    -.036    3.94×10⁻²³    2.10×10³
             8.000    .0491     .017    -.050    1.38×10⁻²³    7.29×10²
             7.000    .0270     .055    -.053    7.60×10⁻²⁴    3.85×10²
             6.000    .0329     .088    -.052    9.27×10⁻²⁴    4.53×10²
a   See Table 4

to solve for the steady-state dP/dE (Guhathakurta & Draine 1989, Draine & Li
2001).
   The notion of “temperature” is somewhat problematic for very small grains,
but one can define the instantaneous vibrational temperature as being equal to
the temperature T (E) at which the expectation value of the energy would be
equal to the actual grain energy; this is the temperature plotted in Figure 13.
Draine & Li (2001) have shown that a “thermal” estimate for the grain emissivity
is a good approximation, even for grains containing as few as ∼ 30 atoms.
   The infrared and far-infrared glow from interstellar dust can be measured, and
a dust model must be able to reproduce the observed intensity and spectrum.
                                           >
The diffuse ISM at galactic latitudes |b| ∼ 20◦ provides a particularly clean test,
because we have good estimates for the intensity of the starlight heating the dust,
and the observed 21 cm emission provides accurate gas column densities which,
for an assumed dust-to-gas ratio, determine the column density of dust. Although
the surface brightness of the infrared emission is low, it has been detected by IRAS
and COBE after averaging over large areas of sky. Figure 14 shows the observed
emissivity per H nucleon, based on COBE-FIRAS and COBE-DIRBE photome-
try. 3.0-4.5 µm and 4.5-11.3 µm spectra, measured at b ≈ 0 by the IRTS satellite
have been added to the plot, normalized to agree with the DIRBE photometry
in the 3.5, 5.0, and 12 µm bands.
   In this dust model, approximately 20% of the absorbed starlight energy is
reradiated at λ < 12 µm by PAHs. The same grain model, applied to reflection
nebulae, can acount for the observed dependence of dust emission spectrum on
temperature of illuminating star (Li & Draine 2002b). With appropriate changes
to the grain mixture, the model can also account for the observed IR emission
from the SMC (Li & Draine 2002c).
                                                               >
   Approximately two thirds of the radiated power is at λ ∼ 50 µm – this is emis-
sion from a ∼ > .01 µm grains that are maintained at a nearly steady temperature

∼ 15 − 20 K by starlight. The remaining ∼ one third of the radiated power is
from grains with radii a ∼ 50˚ that are cooling following “temperature spikes”
                           <    A
Interstellar Dust Grains                                                         31

                  Table 6: Absorption and Scatteringa for λ < 0.1 µm
                                                               a          a
              λ       hν    Aλ /AIC   albedo   cos(θ)       Cext        κabs
                                                             2            2
             µm       eV     model                         cm /H       cm /g
           .09120    13.6    8.256    0.248    0.658    2.33×10⁻²¹   9.37×10⁴
           .04881    25.4    5.574    0.291    0.813    1.57×10⁻²¹   5.97×10⁴
           .02339    53.0    3.355    0.366    0.953    9.46×10⁻²²   3.21×10⁴
           .02279    54.4    3.577    0.369    0.949    1.01×10⁻²¹   3.41×10⁴
           .02214    56.0    3.469    0.393    0.950    9.78×10⁻²²   3.18×10⁴
           .01240    100     2.564    0.452    0.988    7.23×10⁻²²   2.12×10⁴
           .01170    106     2.908    0.432    0.985    8.20×10⁻²²   2.49×10⁴
          .006199     200    2.000    0.578    0.997    5.64×10⁻²²   1.27×10⁴
          .004397     282    1.426    0.619    0.999    4.02×10⁻²²   8.20×10³
          .004350     285    2.355    0.452    0.998    6.64×10⁻²²   1.95×10⁴
          .004133     300    1.812    0.517    0.999    5.11×10⁻²²   1.32×10⁴
          .002480     500    0.971    0.632    1.000    2.74×10⁻²²   5.40×10³
          .002317    535     0.691    0.386    1.000    1.95×10⁻²²   6.40×10³
          .002305    538     1.325    0.355    1.000    3.74×10⁻²²   1.29×10⁴
          .002296    540     1.138    0.453    1.000    3.21×10⁻²²   9.40×10³
          .002254    550     1.056    0.478    1.000    2.98×10⁻²²   8.32×10³
          .001759    705     0.575    0.433    1.000    1.62×10⁻²²   4.92×10³
          .001751    708     1.219    0.353    1.000    3.44×10⁻²²   1.19×10⁴
          .001734    715     0.799    0.515    1.000    2.25×10⁻²²   5.84×10³
          .001720    721     0.941    0.432    1.000    2.65×10⁻²²   8.07×10³
          .001710    725     0.845    0.503    1.000    2.38×10⁻²²   6.33×10³
          .001550    800     0.751    0.514    1.000    2.12×10⁻²²   5.51×10³
          .001240    1000    0.563    0.564    1.000    1.59×10⁻²²   3.71×10³
          .000620    2000    0.181    0.584    1.000    5.10×10⁻²³   1.14×10³
a   see Table 4

resulting from absorption of individual starlight photons. We can immediately
see the following: (A) The grain population must contain enough a ∼ 50˚ grains
                                                                     <   A
to account for ∼ one third of the absorption of starlight. (B) The resemblance of
the 3–12 µm emission spectrum from the diffuse ISM to the emission spectrum
expected from polycyclic aromatic hydrocarbon (PAH) molecules, radicals, and
ions implies that a large fraction of the smallest grains must be PAHs. Figure
15 shows the emission calculated for the PAH/carbon/silicate dust model illumi-
nated by the average interstellar radiation field spectrum.
   The far-infrared emission is a good tracer of interstellar dust. The IRAS and
DIRBE all-sky maps can be used to infer the dust column density (Schlegel et
al. 1998).

10     MICROWAVE EMISSION

10.1 Spinning Grains
Theoretical models to account for the observed infrared emission require large
numbers of extremely small dust grains that, following absorption of starlight
photons, radiate in their optically-active vibrational modes. In addition to vi-
brating, these grains will rotate, with rotation rates reaching tens of GHz. If they
have electric dipole moments, there will be rotational emission from these grains
at microwave frequencies. Various workers have considered microwave emission
from spinning grains (Erickson 1957, Hoyle & Wickramasinghe 1970, Ferrara &
32                                                                                      Draine


Figure 13: A day in the life of 4 carbonaceous grains, heated by the local interstellar radiation
field. τabs is the mean time between photon absorptions (Draine & Li 2001).


Dettmar 1994). The rotational emission from this grain population has been es-
timated by Draine & Lazarian (1998a,b), who showed that it could account for
dust-correlated microwave emission that was discovered by Kogut et al. (1996a,b)
in studies of the angular structure of the cosmic microwave background.
   The theoretical estimate for the rotational emission, plus the low-frequency
tail of the vibrational emission, is shown in Figure 16. Figure 16 also shows
results from a number of observational studies – some over large areas of the
sky, others over smaller regions. Finkbeiner et al. (2002) detect dust-correlated
microwave emission in pointed observations of a dark cloud (L1622) and toward
LPH 201.663+1.643, a diffuse HII region behind heavy obscuration. Most re-
cently, Finkbeiner et al. (2003a) use 8 and 14 GHz surveys to map the anomalous
microwave emission from the Galactic plane.
   With the exception of the observations toward LPH 201.663+1.643, the ob-
served microwave emission appears to be generally consistent with the theoretical
prediction for emission from spinning dust grains.
   The observed microwave emission from LPH 201.663+1.643 is, however, an
order of magnitude stronger than would be expected from the observed column
of dust. While the rotational emission from spinning dust grains does depend
on environment Draine & Lazarian (1998b), it does not appear possible to ex-
plain the strong emission observed in this direction using reasonable variations
in environmental conditions.

10.2 Magnetic Grains?
Although rotational emission from spinning grains is a natural prediction for a
dust model with large numbers of small grains, other emission mechanisms are
Interstellar Dust Grains                                                               33


Figure 14: Observed emission from diffuse interstellar dust. Crosses: IRAS (Boulanger &
Perault 1988); Squares: COBE-FIRAS (Finkbeiner et al. 1999); Diamonds: COBE-DIRBE
(Arendt et al. 1998); Heavy Curve: IRTS (Onaka et al. 1996, Tanaka et al. 1996). The total
power ∼ 5.1 × 10⁻²⁴ erg s−1 /H is estimated from the interpolated broken line.


also possible, including thermal magnetic dipole radiation from magnetic grains
(Draine & Lazarian 1999). We know that Fe contributes a significant fraction of
the interstellar dust mass; if some of this Fe is in ferrimagnetic or ferromagnetic
compounds, grains containing these compounds would emit magnetic dipole ra-
diation. The idea is that the magnetization of the magnetic domains in the grain
would fluctuate around the minimum-energy state; these fluctuations would be
at GHz frequencies, and the fluctuating magnetization would generate electro-
magnetic radiation. If an appreciable fraction of the Fe in interstellar grains were
in magnetite Fe3 O4 , it is estimated that the resulting thermal magnetic dipole
emission would be comparable to the observed microwave emission. The power
radiated per grain is simply proportional to the mass of magnetic material in that
grain, and proportional to the grain temperature. Since it is presumed that most
of the magnetic material would be in large grains, it would be expected that the
large grains would account for the bulk of the magnetic dipole emission.
   It is therefore possible that the observed microwave emission may contain ap-
preciable contributions from both (ultrasmall) spinning grains and (large) mag-
netic grains.

11    ABUNDANCE ISSUES
Dust population models that are constructed to reproduce the observed wavelength-
dependent extinction are found to imply substantial abundances of elements in
grain material – approaching or exceeding the abundances believed to be appro-
priate to interstellar matter. Kim & Martin (1996) referred to the “C/H crisis”,
Interestelar dust grains

Mais conteúdo relacionado

Mais procurados

Catalog dental-general
Catalog dental-generalCatalog dental-general
Catalog dental-generalMIGUEL CHAVEZ
 
SOALAN SAINS Section a
SOALAN SAINS Section aSOALAN SAINS Section a
SOALAN SAINS Section aAs Ramanoon
 
دفتر يومي معدل
دفتر يومي معدلدفتر يومي معدل
دفتر يومي معدلguest696cefa
 
Campaign Business Plan - Irish - Spring 2014
Campaign Business Plan - Irish - Spring 2014Campaign Business Plan - Irish - Spring 2014
Campaign Business Plan - Irish - Spring 2014Jacquelyn Tolliver
 
Deep Blue: Examining Cerenkov Radiation Through Non-traditional Media
Deep Blue: Examining Cerenkov Radiation Through Non-traditional MediaDeep Blue: Examining Cerenkov Radiation Through Non-traditional Media
Deep Blue: Examining Cerenkov Radiation Through Non-traditional MediaIan Flower
 
2016 أنشطة اللغة العربية للصف الأول الابتدائى لكتاب سلاح التلميذ
 2016 أنشطة اللغة العربية للصف الأول الابتدائى لكتاب سلاح التلميذ 2016 أنشطة اللغة العربية للصف الأول الابتدائى لكتاب سلاح التلميذ
2016 أنشطة اللغة العربية للصف الأول الابتدائى لكتاب سلاح التلميذأمنية وجدى
 
Shade Sail Specification - 340PRO
Shade Sail Specification - 340PROShade Sail Specification - 340PRO
Shade Sail Specification - 340PROColin Lawrence
 
RVulic Project Samples
RVulic Project SamplesRVulic Project Samples
RVulic Project SamplesRebecca Vulic
 
AND.©OFFICE..the advertising design and brand identity agency.©Copyright2015
AND.©OFFICE..the advertising design and brand identity agency.©Copyright2015AND.©OFFICE..the advertising design and brand identity agency.©Copyright2015
AND.©OFFICE..the advertising design and brand identity agency.©Copyright2015Eric Nuijten
 
Autoclave & Sterilizers
Autoclave & SterilizersAutoclave & Sterilizers
Autoclave & SterilizersRahul
 
Diagnostic Equipments & Products
Diagnostic Equipments & ProductsDiagnostic Equipments & Products
Diagnostic Equipments & ProductsRahul
 
Why Choose Magento For Your Online Business?
Why Choose Magento For Your Online Business?Why Choose Magento For Your Online Business?
Why Choose Magento For Your Online Business?Innopplinc
 

Mais procurados (18)

Catalog dental-general
Catalog dental-generalCatalog dental-general
Catalog dental-general
 
Storage Virtualization for Efficient Operations
Storage Virtualization for Efficient OperationsStorage Virtualization for Efficient Operations
Storage Virtualization for Efficient Operations
 
Diamond Tool Catalog
Diamond Tool CatalogDiamond Tool Catalog
Diamond Tool Catalog
 
2010 icc report
2010 icc report2010 icc report
2010 icc report
 
Fiche
FicheFiche
Fiche
 
SOALAN SAINS Section a
SOALAN SAINS Section aSOALAN SAINS Section a
SOALAN SAINS Section a
 
دفتر يومي معدل
دفتر يومي معدلدفتر يومي معدل
دفتر يومي معدل
 
Campaign Business Plan - Irish - Spring 2014
Campaign Business Plan - Irish - Spring 2014Campaign Business Plan - Irish - Spring 2014
Campaign Business Plan - Irish - Spring 2014
 
Deep Blue: Examining Cerenkov Radiation Through Non-traditional Media
Deep Blue: Examining Cerenkov Radiation Through Non-traditional MediaDeep Blue: Examining Cerenkov Radiation Through Non-traditional Media
Deep Blue: Examining Cerenkov Radiation Through Non-traditional Media
 
2016 أنشطة اللغة العربية للصف الأول الابتدائى لكتاب سلاح التلميذ
 2016 أنشطة اللغة العربية للصف الأول الابتدائى لكتاب سلاح التلميذ 2016 أنشطة اللغة العربية للصف الأول الابتدائى لكتاب سلاح التلميذ
2016 أنشطة اللغة العربية للصف الأول الابتدائى لكتاب سلاح التلميذ
 
Folha para estudos
Folha para estudosFolha para estudos
Folha para estudos
 
Shade Sail Specification - 340PRO
Shade Sail Specification - 340PROShade Sail Specification - 340PRO
Shade Sail Specification - 340PRO
 
RVulic Project Samples
RVulic Project SamplesRVulic Project Samples
RVulic Project Samples
 
AND.©OFFICE..the advertising design and brand identity agency.©Copyright2015
AND.©OFFICE..the advertising design and brand identity agency.©Copyright2015AND.©OFFICE..the advertising design and brand identity agency.©Copyright2015
AND.©OFFICE..the advertising design and brand identity agency.©Copyright2015
 
Autoclave & Sterilizers
Autoclave & SterilizersAutoclave & Sterilizers
Autoclave & Sterilizers
 
DigitalSins
DigitalSinsDigitalSins
DigitalSins
 
Diagnostic Equipments & Products
Diagnostic Equipments & ProductsDiagnostic Equipments & Products
Diagnostic Equipments & Products
 
Why Choose Magento For Your Online Business?
Why Choose Magento For Your Online Business?Why Choose Magento For Your Online Business?
Why Choose Magento For Your Online Business?
 

Destaque

Superwind phenomenon in_m82
Superwind phenomenon in_m82Superwind phenomenon in_m82
Superwind phenomenon in_m82Sérgio Sacani
 
Solar nebula magnetic_fields_recorded_in_the_semarkona_meteorite
Solar nebula magnetic_fields_recorded_in_the_semarkona_meteoriteSolar nebula magnetic_fields_recorded_in_the_semarkona_meteorite
Solar nebula magnetic_fields_recorded_in_the_semarkona_meteoriteSérgio Sacani
 
Rings in the_haloes_of_planetary_nebulae
Rings in the_haloes_of_planetary_nebulaeRings in the_haloes_of_planetary_nebulae
Rings in the_haloes_of_planetary_nebulaeSérgio Sacani
 
High resolution image_of_a_cometary_globule_in_helix_nebula
High resolution image_of_a_cometary_globule_in_helix_nebulaHigh resolution image_of_a_cometary_globule_in_helix_nebula
High resolution image_of_a_cometary_globule_in_helix_nebulaSérgio Sacani
 
Exoplanets per milk_way_stars
Exoplanets per milk_way_starsExoplanets per milk_way_stars
Exoplanets per milk_way_starsSérgio Sacani
 

Destaque (9)

Superwind phenomenon in_m82
Superwind phenomenon in_m82Superwind phenomenon in_m82
Superwind phenomenon in_m82
 
Nature10611
Nature10611Nature10611
Nature10611
 
Hartmann wood 1971
Hartmann wood 1971Hartmann wood 1971
Hartmann wood 1971
 
Solar nebula magnetic_fields_recorded_in_the_semarkona_meteorite
Solar nebula magnetic_fields_recorded_in_the_semarkona_meteoriteSolar nebula magnetic_fields_recorded_in_the_semarkona_meteorite
Solar nebula magnetic_fields_recorded_in_the_semarkona_meteorite
 
Retangular galaxy
Retangular galaxyRetangular galaxy
Retangular galaxy
 
Rings in the_haloes_of_planetary_nebulae
Rings in the_haloes_of_planetary_nebulaeRings in the_haloes_of_planetary_nebulae
Rings in the_haloes_of_planetary_nebulae
 
High resolution image_of_a_cometary_globule_in_helix_nebula
High resolution image_of_a_cometary_globule_in_helix_nebulaHigh resolution image_of_a_cometary_globule_in_helix_nebula
High resolution image_of_a_cometary_globule_in_helix_nebula
 
Revisao eliptica
Revisao elipticaRevisao eliptica
Revisao eliptica
 
Exoplanets per milk_way_stars
Exoplanets per milk_way_starsExoplanets per milk_way_stars
Exoplanets per milk_way_stars
 

Semelhante a Interestelar dust grains

Rapport de stage: Optimisation d'une starshade
Rapport de stage: Optimisation d'une starshadeRapport de stage: Optimisation d'une starshade
Rapport de stage: Optimisation d'une starshadecbellisario
 
Climate Change Road Map
Climate Change Road MapClimate Change Road Map
Climate Change Road MapShane Mitchell
 
Fundamental "Nano-effects" - Nanoscience and nanotechnologies
Fundamental "Nano-effects" - Nanoscience and nanotechnologiesFundamental "Nano-effects" - Nanoscience and nanotechnologies
Fundamental "Nano-effects" - Nanoscience and nanotechnologiesNANOYOU
 
Shipboard training manual
Shipboard training manualShipboard training manual
Shipboard training manualgclme
 
CALM DURING THE STORM:Best Practices in Multicast Security
CALM DURING THE STORM:Best Practices in Multicast SecurityCALM DURING THE STORM:Best Practices in Multicast Security
CALM DURING THE STORM:Best Practices in Multicast SecurityJohnson Liu
 
01 tt2530eu02al 01_introduction
01 tt2530eu02al 01_introduction01 tt2530eu02al 01_introduction
01 tt2530eu02al 01_introductionKARLOZ215
 
Interior Landscape Plants for Indoor Air Pollution Abatement
Interior Landscape Plants for Indoor Air Pollution AbatementInterior Landscape Plants for Indoor Air Pollution Abatement
Interior Landscape Plants for Indoor Air Pollution AbatementElisaMendelsohn
 
Oil palm by-products as lightweight aggregate in concrete - a review
Oil palm by-products as lightweight aggregate in concrete - a reviewOil palm by-products as lightweight aggregate in concrete - a review
Oil palm by-products as lightweight aggregate in concrete - a reviewUniversity of Malaya
 
Gps carminCar Lease in Europe - Drivers HandBook - Renault USAat tomtom manual
Gps carminCar Lease in Europe - Drivers HandBook - Renault USAat  tomtom manualGps carminCar Lease in Europe - Drivers HandBook - Renault USAat  tomtom manual
Gps carminCar Lease in Europe - Drivers HandBook - Renault USAat tomtom manualAdrian Bert
 
Vehicle dynamics De Tradus
Vehicle dynamics De TradusVehicle dynamics De Tradus
Vehicle dynamics De TradusEdward Radulescu
 
Fabrication methods - Nanoscience and nanotechnologies
Fabrication methods - Nanoscience and nanotechnologiesFabrication methods - Nanoscience and nanotechnologies
Fabrication methods - Nanoscience and nanotechnologiesNANOYOU
 
NUCLEAR PHYSICS AND REACTOR THEORY.pdf
NUCLEAR PHYSICS AND REACTOR THEORY.pdfNUCLEAR PHYSICS AND REACTOR THEORY.pdf
NUCLEAR PHYSICS AND REACTOR THEORY.pdfPiyushPriyadarshi27
 
Application of nanotechnologies: environment
Application of nanotechnologies: environmentApplication of nanotechnologies: environment
Application of nanotechnologies: environmentNANOYOU
 
Shelbourne Valley Walkability Report May 2011
Shelbourne Valley Walkability Report May 2011Shelbourne Valley Walkability Report May 2011
Shelbourne Valley Walkability Report May 2011Henrich_Creative
 
Woods towoodshop
Woods towoodshopWoods towoodshop
Woods towoodshopWisam Ankah
 
Geophysics: Detecting Stress in Mines
Geophysics: Detecting Stress in MinesGeophysics: Detecting Stress in Mines
Geophysics: Detecting Stress in Minesali oncel
 
Compelling fact about plastics.pdf
Compelling fact about plastics.pdfCompelling fact about plastics.pdf
Compelling fact about plastics.pdfssuser5f0aff
 
Do-it-Yourself (DIY) hands-on activities about nanoscale science designed for...
Do-it-Yourself (DIY) hands-on activities about nanoscale science designed for...Do-it-Yourself (DIY) hands-on activities about nanoscale science designed for...
Do-it-Yourself (DIY) hands-on activities about nanoscale science designed for...Isabel Jaramillo
 

Semelhante a Interestelar dust grains (20)

Rapport de stage: Optimisation d'une starshade
Rapport de stage: Optimisation d'une starshadeRapport de stage: Optimisation d'une starshade
Rapport de stage: Optimisation d'une starshade
 
Climate Change Road Map
Climate Change Road MapClimate Change Road Map
Climate Change Road Map
 
Tham Thau Nguoc
Tham Thau NguocTham Thau Nguoc
Tham Thau Nguoc
 
Fundamental "Nano-effects" - Nanoscience and nanotechnologies
Fundamental "Nano-effects" - Nanoscience and nanotechnologiesFundamental "Nano-effects" - Nanoscience and nanotechnologies
Fundamental "Nano-effects" - Nanoscience and nanotechnologies
 
Shipboard training manual
Shipboard training manualShipboard training manual
Shipboard training manual
 
CALM DURING THE STORM:Best Practices in Multicast Security
CALM DURING THE STORM:Best Practices in Multicast SecurityCALM DURING THE STORM:Best Practices in Multicast Security
CALM DURING THE STORM:Best Practices in Multicast Security
 
01 tt2530eu02al 01_introduction
01 tt2530eu02al 01_introduction01 tt2530eu02al 01_introduction
01 tt2530eu02al 01_introduction
 
Interior Landscape Plants for Indoor Air Pollution Abatement
Interior Landscape Plants for Indoor Air Pollution AbatementInterior Landscape Plants for Indoor Air Pollution Abatement
Interior Landscape Plants for Indoor Air Pollution Abatement
 
E1071
E1071E1071
E1071
 
Oil palm by-products as lightweight aggregate in concrete - a review
Oil palm by-products as lightweight aggregate in concrete - a reviewOil palm by-products as lightweight aggregate in concrete - a review
Oil palm by-products as lightweight aggregate in concrete - a review
 
Gps carminCar Lease in Europe - Drivers HandBook - Renault USAat tomtom manual
Gps carminCar Lease in Europe - Drivers HandBook - Renault USAat  tomtom manualGps carminCar Lease in Europe - Drivers HandBook - Renault USAat  tomtom manual
Gps carminCar Lease in Europe - Drivers HandBook - Renault USAat tomtom manual
 
Vehicle dynamics De Tradus
Vehicle dynamics De TradusVehicle dynamics De Tradus
Vehicle dynamics De Tradus
 
Fabrication methods - Nanoscience and nanotechnologies
Fabrication methods - Nanoscience and nanotechnologiesFabrication methods - Nanoscience and nanotechnologies
Fabrication methods - Nanoscience and nanotechnologies
 
NUCLEAR PHYSICS AND REACTOR THEORY.pdf
NUCLEAR PHYSICS AND REACTOR THEORY.pdfNUCLEAR PHYSICS AND REACTOR THEORY.pdf
NUCLEAR PHYSICS AND REACTOR THEORY.pdf
 
Application of nanotechnologies: environment
Application of nanotechnologies: environmentApplication of nanotechnologies: environment
Application of nanotechnologies: environment
 
Shelbourne Valley Walkability Report May 2011
Shelbourne Valley Walkability Report May 2011Shelbourne Valley Walkability Report May 2011
Shelbourne Valley Walkability Report May 2011
 
Woods towoodshop
Woods towoodshopWoods towoodshop
Woods towoodshop
 
Geophysics: Detecting Stress in Mines
Geophysics: Detecting Stress in MinesGeophysics: Detecting Stress in Mines
Geophysics: Detecting Stress in Mines
 
Compelling fact about plastics.pdf
Compelling fact about plastics.pdfCompelling fact about plastics.pdf
Compelling fact about plastics.pdf
 
Do-it-Yourself (DIY) hands-on activities about nanoscale science designed for...
Do-it-Yourself (DIY) hands-on activities about nanoscale science designed for...Do-it-Yourself (DIY) hands-on activities about nanoscale science designed for...
Do-it-Yourself (DIY) hands-on activities about nanoscale science designed for...
 

Mais de Sérgio Sacani

Biogenic Sulfur Gases as Biosignatures on Temperate Sub-Neptune Waterworlds
Biogenic Sulfur Gases as Biosignatures on Temperate Sub-Neptune WaterworldsBiogenic Sulfur Gases as Biosignatures on Temperate Sub-Neptune Waterworlds
Biogenic Sulfur Gases as Biosignatures on Temperate Sub-Neptune WaterworldsSérgio Sacani
 
Asymmetry in the atmosphere of the ultra-hot Jupiter WASP-76 b
Asymmetry in the atmosphere of the ultra-hot Jupiter WASP-76 bAsymmetry in the atmosphere of the ultra-hot Jupiter WASP-76 b
Asymmetry in the atmosphere of the ultra-hot Jupiter WASP-76 bSérgio Sacani
 
Formation of low mass protostars and their circumstellar disks
Formation of low mass protostars and their circumstellar disksFormation of low mass protostars and their circumstellar disks
Formation of low mass protostars and their circumstellar disksSérgio Sacani
 
Nightside clouds and disequilibrium chemistry on the hot Jupiter WASP-43b
Nightside clouds and disequilibrium chemistry on the hot Jupiter WASP-43bNightside clouds and disequilibrium chemistry on the hot Jupiter WASP-43b
Nightside clouds and disequilibrium chemistry on the hot Jupiter WASP-43bSérgio Sacani
 
Discovery of an Accretion Streamer and a Slow Wide-angle Outflow around FUOri...
Discovery of an Accretion Streamer and a Slow Wide-angle Outflow around FUOri...Discovery of an Accretion Streamer and a Slow Wide-angle Outflow around FUOri...
Discovery of an Accretion Streamer and a Slow Wide-angle Outflow around FUOri...Sérgio Sacani
 
Disentangling the origin of chemical differences using GHOST
Disentangling the origin of chemical differences using GHOSTDisentangling the origin of chemical differences using GHOST
Disentangling the origin of chemical differences using GHOSTSérgio Sacani
 
All-domain Anomaly Resolution Office U.S. Department of Defense (U) Case: “Eg...
All-domain Anomaly Resolution Office U.S. Department of Defense (U) Case: “Eg...All-domain Anomaly Resolution Office U.S. Department of Defense (U) Case: “Eg...
All-domain Anomaly Resolution Office U.S. Department of Defense (U) Case: “Eg...Sérgio Sacani
 
PossibleEoarcheanRecordsoftheGeomagneticFieldPreservedintheIsuaSupracrustalBe...
PossibleEoarcheanRecordsoftheGeomagneticFieldPreservedintheIsuaSupracrustalBe...PossibleEoarcheanRecordsoftheGeomagneticFieldPreservedintheIsuaSupracrustalBe...
PossibleEoarcheanRecordsoftheGeomagneticFieldPreservedintheIsuaSupracrustalBe...Sérgio Sacani
 
Isotopic evidence of long-lived volcanism on Io
Isotopic evidence of long-lived volcanism on IoIsotopic evidence of long-lived volcanism on Io
Isotopic evidence of long-lived volcanism on IoSérgio Sacani
 
Hubble Asteroid Hunter III. Physical properties of newly found asteroids
Hubble Asteroid Hunter III. Physical properties of newly found asteroidsHubble Asteroid Hunter III. Physical properties of newly found asteroids
Hubble Asteroid Hunter III. Physical properties of newly found asteroidsSérgio Sacani
 
Observational constraints on mergers creating magnetism in massive stars
Observational constraints on mergers creating magnetism in massive starsObservational constraints on mergers creating magnetism in massive stars
Observational constraints on mergers creating magnetism in massive starsSérgio Sacani
 
Observation of Gravitational Waves from the Coalescence of a 2.5–4.5 M⊙ Compa...
Observation of Gravitational Waves from the Coalescence of a 2.5–4.5 M⊙ Compa...Observation of Gravitational Waves from the Coalescence of a 2.5–4.5 M⊙ Compa...
Observation of Gravitational Waves from the Coalescence of a 2.5–4.5 M⊙ Compa...Sérgio Sacani
 
The SAMI Galaxy Sur v ey: galaxy spin is more strongly correlated with stella...
The SAMI Galaxy Sur v ey: galaxy spin is more strongly correlated with stella...The SAMI Galaxy Sur v ey: galaxy spin is more strongly correlated with stella...
The SAMI Galaxy Sur v ey: galaxy spin is more strongly correlated with stella...Sérgio Sacani
 
Is Betelgeuse Really Rotating? Synthetic ALMA Observations of Large-scale Con...
Is Betelgeuse Really Rotating? Synthetic ALMA Observations of Large-scale Con...Is Betelgeuse Really Rotating? Synthetic ALMA Observations of Large-scale Con...
Is Betelgeuse Really Rotating? Synthetic ALMA Observations of Large-scale Con...Sérgio Sacani
 
First Direct Imaging of a Kelvin–Helmholtz Instability by PSP/WISPR
First Direct Imaging of a Kelvin–Helmholtz Instability by PSP/WISPRFirst Direct Imaging of a Kelvin–Helmholtz Instability by PSP/WISPR
First Direct Imaging of a Kelvin–Helmholtz Instability by PSP/WISPRSérgio Sacani
 
The Sun’s differential rotation is controlled by high- latitude baroclinicall...
The Sun’s differential rotation is controlled by high- latitude baroclinicall...The Sun’s differential rotation is controlled by high- latitude baroclinicall...
The Sun’s differential rotation is controlled by high- latitude baroclinicall...Sérgio Sacani
 
Hydrogen Column Density Variability in a Sample of Local Compton-Thin AGN
Hydrogen Column Density Variability in a Sample of Local Compton-Thin AGNHydrogen Column Density Variability in a Sample of Local Compton-Thin AGN
Hydrogen Column Density Variability in a Sample of Local Compton-Thin AGNSérgio Sacani
 
Huygens - Exploring Titan A Mysterious World
Huygens - Exploring Titan A Mysterious WorldHuygens - Exploring Titan A Mysterious World
Huygens - Exploring Titan A Mysterious WorldSérgio Sacani
 
The Radcliffe Wave Of Milk Way is oscillating
The Radcliffe Wave Of Milk Way  is oscillatingThe Radcliffe Wave Of Milk Way  is oscillating
The Radcliffe Wave Of Milk Way is oscillatingSérgio Sacani
 
Thermonuclear explosions on neutron stars reveal the speed of their jets
Thermonuclear explosions on neutron stars reveal the speed of their jetsThermonuclear explosions on neutron stars reveal the speed of their jets
Thermonuclear explosions on neutron stars reveal the speed of their jetsSérgio Sacani
 

Mais de Sérgio Sacani (20)

Biogenic Sulfur Gases as Biosignatures on Temperate Sub-Neptune Waterworlds
Biogenic Sulfur Gases as Biosignatures on Temperate Sub-Neptune WaterworldsBiogenic Sulfur Gases as Biosignatures on Temperate Sub-Neptune Waterworlds
Biogenic Sulfur Gases as Biosignatures on Temperate Sub-Neptune Waterworlds
 
Asymmetry in the atmosphere of the ultra-hot Jupiter WASP-76 b
Asymmetry in the atmosphere of the ultra-hot Jupiter WASP-76 bAsymmetry in the atmosphere of the ultra-hot Jupiter WASP-76 b
Asymmetry in the atmosphere of the ultra-hot Jupiter WASP-76 b
 
Formation of low mass protostars and their circumstellar disks
Formation of low mass protostars and their circumstellar disksFormation of low mass protostars and their circumstellar disks
Formation of low mass protostars and their circumstellar disks
 
Nightside clouds and disequilibrium chemistry on the hot Jupiter WASP-43b
Nightside clouds and disequilibrium chemistry on the hot Jupiter WASP-43bNightside clouds and disequilibrium chemistry on the hot Jupiter WASP-43b
Nightside clouds and disequilibrium chemistry on the hot Jupiter WASP-43b
 
Discovery of an Accretion Streamer and a Slow Wide-angle Outflow around FUOri...
Discovery of an Accretion Streamer and a Slow Wide-angle Outflow around FUOri...Discovery of an Accretion Streamer and a Slow Wide-angle Outflow around FUOri...
Discovery of an Accretion Streamer and a Slow Wide-angle Outflow around FUOri...
 
Disentangling the origin of chemical differences using GHOST
Disentangling the origin of chemical differences using GHOSTDisentangling the origin of chemical differences using GHOST
Disentangling the origin of chemical differences using GHOST
 
All-domain Anomaly Resolution Office U.S. Department of Defense (U) Case: “Eg...
All-domain Anomaly Resolution Office U.S. Department of Defense (U) Case: “Eg...All-domain Anomaly Resolution Office U.S. Department of Defense (U) Case: “Eg...
All-domain Anomaly Resolution Office U.S. Department of Defense (U) Case: “Eg...
 
PossibleEoarcheanRecordsoftheGeomagneticFieldPreservedintheIsuaSupracrustalBe...
PossibleEoarcheanRecordsoftheGeomagneticFieldPreservedintheIsuaSupracrustalBe...PossibleEoarcheanRecordsoftheGeomagneticFieldPreservedintheIsuaSupracrustalBe...
PossibleEoarcheanRecordsoftheGeomagneticFieldPreservedintheIsuaSupracrustalBe...
 
Isotopic evidence of long-lived volcanism on Io
Isotopic evidence of long-lived volcanism on IoIsotopic evidence of long-lived volcanism on Io
Isotopic evidence of long-lived volcanism on Io
 
Hubble Asteroid Hunter III. Physical properties of newly found asteroids
Hubble Asteroid Hunter III. Physical properties of newly found asteroidsHubble Asteroid Hunter III. Physical properties of newly found asteroids
Hubble Asteroid Hunter III. Physical properties of newly found asteroids
 
Observational constraints on mergers creating magnetism in massive stars
Observational constraints on mergers creating magnetism in massive starsObservational constraints on mergers creating magnetism in massive stars
Observational constraints on mergers creating magnetism in massive stars
 
Observation of Gravitational Waves from the Coalescence of a 2.5–4.5 M⊙ Compa...
Observation of Gravitational Waves from the Coalescence of a 2.5–4.5 M⊙ Compa...Observation of Gravitational Waves from the Coalescence of a 2.5–4.5 M⊙ Compa...
Observation of Gravitational Waves from the Coalescence of a 2.5–4.5 M⊙ Compa...
 
The SAMI Galaxy Sur v ey: galaxy spin is more strongly correlated with stella...
The SAMI Galaxy Sur v ey: galaxy spin is more strongly correlated with stella...The SAMI Galaxy Sur v ey: galaxy spin is more strongly correlated with stella...
The SAMI Galaxy Sur v ey: galaxy spin is more strongly correlated with stella...
 
Is Betelgeuse Really Rotating? Synthetic ALMA Observations of Large-scale Con...
Is Betelgeuse Really Rotating? Synthetic ALMA Observations of Large-scale Con...Is Betelgeuse Really Rotating? Synthetic ALMA Observations of Large-scale Con...
Is Betelgeuse Really Rotating? Synthetic ALMA Observations of Large-scale Con...
 
First Direct Imaging of a Kelvin–Helmholtz Instability by PSP/WISPR
First Direct Imaging of a Kelvin–Helmholtz Instability by PSP/WISPRFirst Direct Imaging of a Kelvin–Helmholtz Instability by PSP/WISPR
First Direct Imaging of a Kelvin–Helmholtz Instability by PSP/WISPR
 
The Sun’s differential rotation is controlled by high- latitude baroclinicall...
The Sun’s differential rotation is controlled by high- latitude baroclinicall...The Sun’s differential rotation is controlled by high- latitude baroclinicall...
The Sun’s differential rotation is controlled by high- latitude baroclinicall...
 
Hydrogen Column Density Variability in a Sample of Local Compton-Thin AGN
Hydrogen Column Density Variability in a Sample of Local Compton-Thin AGNHydrogen Column Density Variability in a Sample of Local Compton-Thin AGN
Hydrogen Column Density Variability in a Sample of Local Compton-Thin AGN
 
Huygens - Exploring Titan A Mysterious World
Huygens - Exploring Titan A Mysterious WorldHuygens - Exploring Titan A Mysterious World
Huygens - Exploring Titan A Mysterious World
 
The Radcliffe Wave Of Milk Way is oscillating
The Radcliffe Wave Of Milk Way  is oscillatingThe Radcliffe Wave Of Milk Way  is oscillating
The Radcliffe Wave Of Milk Way is oscillating
 
Thermonuclear explosions on neutron stars reveal the speed of their jets
Thermonuclear explosions on neutron stars reveal the speed of their jetsThermonuclear explosions on neutron stars reveal the speed of their jets
Thermonuclear explosions on neutron stars reveal the speed of their jets
 

Último

Workshop - Best of Both Worlds_ Combine KG and Vector search for enhanced R...
Workshop - Best of Both Worlds_ Combine  KG and Vector search for  enhanced R...Workshop - Best of Both Worlds_ Combine  KG and Vector search for  enhanced R...
Workshop - Best of Both Worlds_ Combine KG and Vector search for enhanced R...Neo4j
 
Advantages of Hiring UIUX Design Service Providers for Your Business
Advantages of Hiring UIUX Design Service Providers for Your BusinessAdvantages of Hiring UIUX Design Service Providers for Your Business
Advantages of Hiring UIUX Design Service Providers for Your BusinessPixlogix Infotech
 
2024: Domino Containers - The Next Step. News from the Domino Container commu...
2024: Domino Containers - The Next Step. News from the Domino Container commu...2024: Domino Containers - The Next Step. News from the Domino Container commu...
2024: Domino Containers - The Next Step. News from the Domino Container commu...Martijn de Jong
 
GenAI Risks & Security Meetup 01052024.pdf
GenAI Risks & Security Meetup 01052024.pdfGenAI Risks & Security Meetup 01052024.pdf
GenAI Risks & Security Meetup 01052024.pdflior mazor
 
The 7 Things I Know About Cyber Security After 25 Years | April 2024
The 7 Things I Know About Cyber Security After 25 Years | April 2024The 7 Things I Know About Cyber Security After 25 Years | April 2024
The 7 Things I Know About Cyber Security After 25 Years | April 2024Rafal Los
 
HTML Injection Attacks: Impact and Mitigation Strategies
HTML Injection Attacks: Impact and Mitigation StrategiesHTML Injection Attacks: Impact and Mitigation Strategies
HTML Injection Attacks: Impact and Mitigation StrategiesBoston Institute of Analytics
 
How to Troubleshoot Apps for the Modern Connected Worker
How to Troubleshoot Apps for the Modern Connected WorkerHow to Troubleshoot Apps for the Modern Connected Worker
How to Troubleshoot Apps for the Modern Connected WorkerThousandEyes
 
AWS Community Day CPH - Three problems of Terraform
AWS Community Day CPH - Three problems of TerraformAWS Community Day CPH - Three problems of Terraform
AWS Community Day CPH - Three problems of TerraformAndrey Devyatkin
 
🐬 The future of MySQL is Postgres 🐘
🐬  The future of MySQL is Postgres   🐘🐬  The future of MySQL is Postgres   🐘
🐬 The future of MySQL is Postgres 🐘RTylerCroy
 
Real Time Object Detection Using Open CV
Real Time Object Detection Using Open CVReal Time Object Detection Using Open CV
Real Time Object Detection Using Open CVKhem
 
[2024]Digital Global Overview Report 2024 Meltwater.pdf
[2024]Digital Global Overview Report 2024 Meltwater.pdf[2024]Digital Global Overview Report 2024 Meltwater.pdf
[2024]Digital Global Overview Report 2024 Meltwater.pdfhans926745
 
Boost Fertility New Invention Ups Success Rates.pdf
Boost Fertility New Invention Ups Success Rates.pdfBoost Fertility New Invention Ups Success Rates.pdf
Boost Fertility New Invention Ups Success Rates.pdfsudhanshuwaghmare1
 
What Are The Drone Anti-jamming Systems Technology?
What Are The Drone Anti-jamming Systems Technology?What Are The Drone Anti-jamming Systems Technology?
What Are The Drone Anti-jamming Systems Technology?Antenna Manufacturer Coco
 
A Domino Admins Adventures (Engage 2024)
A Domino Admins Adventures (Engage 2024)A Domino Admins Adventures (Engage 2024)
A Domino Admins Adventures (Engage 2024)Gabriella Davis
 
ProductAnonymous-April2024-WinProductDiscovery-MelissaKlemke
ProductAnonymous-April2024-WinProductDiscovery-MelissaKlemkeProductAnonymous-April2024-WinProductDiscovery-MelissaKlemke
ProductAnonymous-April2024-WinProductDiscovery-MelissaKlemkeProduct Anonymous
 
Apidays New York 2024 - Scaling API-first by Ian Reasor and Radu Cotescu, Adobe
Apidays New York 2024 - Scaling API-first by Ian Reasor and Radu Cotescu, AdobeApidays New York 2024 - Scaling API-first by Ian Reasor and Radu Cotescu, Adobe
Apidays New York 2024 - Scaling API-first by Ian Reasor and Radu Cotescu, Adobeapidays
 
Finology Group – Insurtech Innovation Award 2024
Finology Group – Insurtech Innovation Award 2024Finology Group – Insurtech Innovation Award 2024
Finology Group – Insurtech Innovation Award 2024The Digital Insurer
 
Strategies for Landing an Oracle DBA Job as a Fresher
Strategies for Landing an Oracle DBA Job as a FresherStrategies for Landing an Oracle DBA Job as a Fresher
Strategies for Landing an Oracle DBA Job as a FresherRemote DBA Services
 
Automating Google Workspace (GWS) & more with Apps Script
Automating Google Workspace (GWS) & more with Apps ScriptAutomating Google Workspace (GWS) & more with Apps Script
Automating Google Workspace (GWS) & more with Apps Scriptwesley chun
 
Driving Behavioral Change for Information Management through Data-Driven Gree...
Driving Behavioral Change for Information Management through Data-Driven Gree...Driving Behavioral Change for Information Management through Data-Driven Gree...
Driving Behavioral Change for Information Management through Data-Driven Gree...Enterprise Knowledge
 

Último (20)

Workshop - Best of Both Worlds_ Combine KG and Vector search for enhanced R...
Workshop - Best of Both Worlds_ Combine  KG and Vector search for  enhanced R...Workshop - Best of Both Worlds_ Combine  KG and Vector search for  enhanced R...
Workshop - Best of Both Worlds_ Combine KG and Vector search for enhanced R...
 
Advantages of Hiring UIUX Design Service Providers for Your Business
Advantages of Hiring UIUX Design Service Providers for Your BusinessAdvantages of Hiring UIUX Design Service Providers for Your Business
Advantages of Hiring UIUX Design Service Providers for Your Business
 
2024: Domino Containers - The Next Step. News from the Domino Container commu...
2024: Domino Containers - The Next Step. News from the Domino Container commu...2024: Domino Containers - The Next Step. News from the Domino Container commu...
2024: Domino Containers - The Next Step. News from the Domino Container commu...
 
GenAI Risks & Security Meetup 01052024.pdf
GenAI Risks & Security Meetup 01052024.pdfGenAI Risks & Security Meetup 01052024.pdf
GenAI Risks & Security Meetup 01052024.pdf
 
The 7 Things I Know About Cyber Security After 25 Years | April 2024
The 7 Things I Know About Cyber Security After 25 Years | April 2024The 7 Things I Know About Cyber Security After 25 Years | April 2024
The 7 Things I Know About Cyber Security After 25 Years | April 2024
 
HTML Injection Attacks: Impact and Mitigation Strategies
HTML Injection Attacks: Impact and Mitigation StrategiesHTML Injection Attacks: Impact and Mitigation Strategies
HTML Injection Attacks: Impact and Mitigation Strategies
 
How to Troubleshoot Apps for the Modern Connected Worker
How to Troubleshoot Apps for the Modern Connected WorkerHow to Troubleshoot Apps for the Modern Connected Worker
How to Troubleshoot Apps for the Modern Connected Worker
 
AWS Community Day CPH - Three problems of Terraform
AWS Community Day CPH - Three problems of TerraformAWS Community Day CPH - Three problems of Terraform
AWS Community Day CPH - Three problems of Terraform
 
🐬 The future of MySQL is Postgres 🐘
🐬  The future of MySQL is Postgres   🐘🐬  The future of MySQL is Postgres   🐘
🐬 The future of MySQL is Postgres 🐘
 
Real Time Object Detection Using Open CV
Real Time Object Detection Using Open CVReal Time Object Detection Using Open CV
Real Time Object Detection Using Open CV
 
[2024]Digital Global Overview Report 2024 Meltwater.pdf
[2024]Digital Global Overview Report 2024 Meltwater.pdf[2024]Digital Global Overview Report 2024 Meltwater.pdf
[2024]Digital Global Overview Report 2024 Meltwater.pdf
 
Boost Fertility New Invention Ups Success Rates.pdf
Boost Fertility New Invention Ups Success Rates.pdfBoost Fertility New Invention Ups Success Rates.pdf
Boost Fertility New Invention Ups Success Rates.pdf
 
What Are The Drone Anti-jamming Systems Technology?
What Are The Drone Anti-jamming Systems Technology?What Are The Drone Anti-jamming Systems Technology?
What Are The Drone Anti-jamming Systems Technology?
 
A Domino Admins Adventures (Engage 2024)
A Domino Admins Adventures (Engage 2024)A Domino Admins Adventures (Engage 2024)
A Domino Admins Adventures (Engage 2024)
 
ProductAnonymous-April2024-WinProductDiscovery-MelissaKlemke
ProductAnonymous-April2024-WinProductDiscovery-MelissaKlemkeProductAnonymous-April2024-WinProductDiscovery-MelissaKlemke
ProductAnonymous-April2024-WinProductDiscovery-MelissaKlemke
 
Apidays New York 2024 - Scaling API-first by Ian Reasor and Radu Cotescu, Adobe
Apidays New York 2024 - Scaling API-first by Ian Reasor and Radu Cotescu, AdobeApidays New York 2024 - Scaling API-first by Ian Reasor and Radu Cotescu, Adobe
Apidays New York 2024 - Scaling API-first by Ian Reasor and Radu Cotescu, Adobe
 
Finology Group – Insurtech Innovation Award 2024
Finology Group – Insurtech Innovation Award 2024Finology Group – Insurtech Innovation Award 2024
Finology Group – Insurtech Innovation Award 2024
 
Strategies for Landing an Oracle DBA Job as a Fresher
Strategies for Landing an Oracle DBA Job as a FresherStrategies for Landing an Oracle DBA Job as a Fresher
Strategies for Landing an Oracle DBA Job as a Fresher
 
Automating Google Workspace (GWS) & more with Apps Script
Automating Google Workspace (GWS) & more with Apps ScriptAutomating Google Workspace (GWS) & more with Apps Script
Automating Google Workspace (GWS) & more with Apps Script
 
Driving Behavioral Change for Information Management through Data-Driven Gree...
Driving Behavioral Change for Information Management through Data-Driven Gree...Driving Behavioral Change for Information Management through Data-Driven Gree...
Driving Behavioral Change for Information Management through Data-Driven Gree...
 

Interestelar dust grains

  • 1. Interstellar Dust Grains 1 Interstellar Dust Grains B. T. Draine Princeton University Observatory, Princeton, NJ 08544 USA draine@astro.princeton.edu arXiv:astro-ph/0304489v1 28 Apr 2003 KEYWORDS: infrared astronomy, interstellar medium, interstellar grains, light scattering, molecular clouds ABSTRACT: This review surveys the observed properties of interstellar dust grains: the wavelength-dependent extinction of starlight, including absorption features, from UV to infrared; optical luminescence; infrared emission; microwave emission; optical, UV, and X-ray scattering by dust; and polarization of starlight and of infrared emission. The relationship between presolar grains in meteorites and the interstellar grain population is discussed. Candidate grain materials and abundance constraints are considered. A dust model consisting of amorphous silicate grains, graphite grains, and polycyclic aromatic hydrocarbons is compared with observed emission and scattering. Some issues concerning evolution of interstellar dust are discussed. CONTENTS INTRODUCTION . . . . . . . . . . . . . . . . . . . . . . . . . . . . . . . . . . . . 2 EXTINCTION . . . . . . . . . . . . . . . . . . . . . . . . . . . . . . . . . . . . . . 3 Milky Way Dust . . . . . . . . . . . . . . . . . . . . . . . . . . . . . . . . . . . . . . . 3 Dust in Other Galaxies . . . . . . . . . . . . . . . . . . . . . . . . . . . . . . . . . . . . 6 SPECTROSCOPY OF DUST . . . . . . . . . . . . . . . . . . . . . . . . . . . . . 9 ˚ 2175A Feature: Aromatic C? . . . . . . . . . . . . . . . . . . . . . . . . . . . . . . . . 9 Silicate Features . . . . . . . . . . . . . . . . . . . . . . . . . . . . . . . . . . . . . . . 10 Diffuse Interstellar Bands . . . . . . . . . . . . . . . . . . . . . . . . . . . . . . . . . . 13 3.4µm Feature: Aliphatic C-H Stretch . . . . . . . . . . . . . . . . . . . . . . . . . . . 14 Ice Features . . . . . . . . . . . . . . . . . . . . . . . . . . . . . . . . . . . . . . . . . . 14 3.3, 6.2, 7.7, 8.6, 11.3µm PAH Features . . . . . . . . . . . . . . . . . . . . . . . . . . 15 X-Ray Absorption Edges . . . . . . . . . . . . . . . . . . . . . . . . . . . . . . . . . . . 17 Extended Red Emission . . . . . . . . . . . . . . . . . . . . . . . . . . . . . . . . . . . 17 PRESOLAR GRAINS IN METEORITES AND INTERPLANETARY DUST . . 18 CANDIDATE GRAIN MATERIALS . . . . . . . . . . . . . . . . . . . . . . . . . . 20 Silicates . . . . . . . . . . . . . . . . . . . . . . . . . . . . . . . . . . . . . . . . . . . . 20 Carbonaceous Materials . . . . . . . . . . . . . . . . . . . . . . . . . . . . . . . . . . . 21 SiC . . . . . . . . . . . . . . . . . . . . . . . . . . . . . . . . . . . . . . . . . . . . . . . 21 Carbonates . . . . . . . . . . . . . . . . . . . . . . . . . . . . . . . . . . . . . . . . . . 21 POLARIZATION . . . . . . . . . . . . . . . . . . . . . . . . . . . . . . . . . . . . 22 Optical-UV Polarization . . . . . . . . . . . . . . . . . . . . . . . . . . . . . . . . . . . 22 Polarized Far-Infrared Emission . . . . . . . . . . . . . . . . . . . . . . . . . . . . . . 22
  • 2. Annu. Rev. Astron. Astrophys. 2002 41 Preprint astro-ph/... A PROVISIONAL GRAIN MODEL . . . . . . . . . . . . . . . . . . . . . . . . . . 23 SCATTERING . . . . . . . . . . . . . . . . . . . . . . . . . . . . . . . . . . . . . 25 Optical and UV . . . . . . . . . . . . . . . . . . . . . . . . . . . . . . . . . . . . . . . . 25 X-Ray Scattering . . . . . . . . . . . . . . . . . . . . . . . . . . . . . . . . . . . . . . . 26 INFRARED EMISSION . . . . . . . . . . . . . . . . . . . . . . . . . . . . . . . . 28 MICROWAVE EMISSION . . . . . . . . . . . . . . . . . . . . . . . . . . . . . . . 31 Spinning Grains . . . . . . . . . . . . . . . . . . . . . . . . . . . . . . . . . . . . . . . 31 Magnetic Grains? . . . . . . . . . . . . . . . . . . . . . . . . . . . . . . . . . . . . . . . 32 ABUNDANCE ISSUES . . . . . . . . . . . . . . . . . . . . . . . . . . . . . . . . . 33 GRAIN ALIGNMENT . . . . . . . . . . . . . . . . . . . . . . . . . . . . . . . . . 35 EVOLUTION OF THE GRAIN POPULATION . . . . . . . . . . . . . . . . . . . 36 FUTURE DIRECTIONS . . . . . . . . . . . . . . . . . . . . . . . . . . . . . . . . 38 1 INTRODUCTION Dust grains play a central role in the astrophysics of the interstellar medium, from the thermodynamics and chemistry of the gas, to the dynamics of star formation. In addition, dust shapes the spectra of galaxies: radiation at short wavelengths is attenuated, and energy is radiated in the infrared. It is estimated that 30% or more of the energy emitted as starlight in the Universe is reradiated by dust in the infrared (Bernstein et al. 2002). Interstellar dust determines what galaxies look like, how the interstellar medium (ISM) in a galaxy behaves, and the very process of star formation that creates a visible galaxy. This review summarizes current knowledge of the abundance, composition, and sizes of interstellar dust grains, as indicated by observations of extinction, scattering, and emission from dust, supplemented by evidence from interstellar gas phase abundances and presolar grains in meteorites. The term “dust grain” is understood here to extend down to molecules containing tens of atoms, as there is no discontinuity in the physics as the particle size decreases from microns to Angstroms. The distribution of gas and dust in the Galaxy – the structure of the interstellar medium – is not discussed. The astrophysics of interstellar dust is not covered in this review. This includes the physical optics of small particles, charging of dust grains, heating and cooling of dust grains, chemistry on dust grain surfaces, forces and torques on dust grains, sputtering and shattering of dust grains, and alignment of dust with the magnetic field; an introduction to these topics can be found elsewhere (Kr¨gel 2002, Draine u 2003a). The review does not attempt to survey or compare different models proposed for interstellar dust. One dust model is introduced to illustrate modeling of absorption, scattering, and infrared emission from interstellar dust. It is not possible to cite all of the important papers in this area; only a few articles are cited in connection with each topic. The reader is encouraged to also consult prior reviews by Savage & Mathis (1979), Mathis (1990, 1993, 2000), Draine (1995), Witt (2000a), Witt (2000b), Voshchinnikov (2002), and the book 2
  • 3. Interstellar Dust Grains 3 by Whittet (2003). Dorschner & Henning (1995) discuss the metamorphosis of interstellar dust. 2 EXTINCTION The existence of interstellar dust was first inferred from obscuration, or “extinc- tion”, of starlight (Trumpler 1930). Much of our knowledge of interstellar dust continues to be based on studies of the wavelength-dependence of this attenua- tion, often referred to as “reddening” because of the tendency for the extinction to be greater in the blue than in the red. The wavelength-dependence strongly con- strains the grain size distribution, and spectral features (§3) reveal the chemical composition. The extinction is most reliably determined using the “pair method” – com- paring spectrophotometry of two stars of the same spectral class; if one star has negligible foreground dust while the second star is heavily reddened, compari- son of the two spectra, together with the assumption that the dust extinction goes to zero at very long wavelength, allows one to determine the extinction 0 Aλ ≡ 2.5 log10 (Fλ /Fλ ) as a function of wavelength λ, where Fλ is the observed flux and Fλ 0 is the flux in the absence of extinction. The “pair method” has been used to measure extinction curves for many sightlines, in many cases over a range of wavelengths extending from the near-infrared to the vacuum UV. 2.1 Milky Way Dust 2.1.1 OPTICAL-UV EXTINCTION CURVES The dimensionless quantity RV ≡ AV /(AB − AV ) is a common measure of the slope of the extinction curve in the optical region. Very large grains would pro- duce gray extinction with RV → ∞. Rayleigh scattering (Aλ ∝ λ−4 ) would produce very steep extinction with RV ≈ 1.2. RV is known to vary from one sightline to another, from values as low as 2.1 (toward HD 210121) (Welty & Fowler 1992) to values as large as 5.6-5.8 (toward HD 36982) (Cardelli et al. 1989, Fitzpatrick 1999). Cardelli et al. (1989) showed that normalized extinction curves Aλ /AI (using the I band extinction to normalize) could be approximated by a seven-parameter function of wavelength λ: Aλ /AI ≈ f (λ; RV , C1 , C2 , C3 , C4 , λ0 , γ) . (1) ˚ At wavelengths λ > 3030A, the function f (λ) depends only on λ and the single parameter RV . The parameters C3 , λ0 , and γ determine the strength and shape of the 2175˚ “bump”, and the coefficients C1 , C2 , and C4 determine the slope A and curvature of the continuous extinction at λ < 3030˚. A Cardelli et al. (1989) show that if the single quantity RV is known, it is possi- ble to estimate the values of the other six parameters (C1−4 , λ0 , γ) so that the optical-UV extinction can be approximated by a one-parameter family of curves. However, if the UV extinction has been measured, an improved fit to the obser- vations can be obtained by fitting C1−4 , λ0 and γ to the measured extinction. Empirical extinction curves in diffuse clouds show relatively little variation in < < the infrared, and for wavelengths 0.7 µm ∼ λ ∼ 8 µm the function (1) appears to be approximately “universal” (i.e., independent of RV ) in diffuse clouds [in
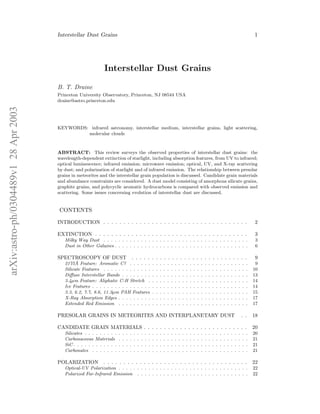
  • 4. 4 Draine Figure 1: Extinction curves from prescription of Fitzpatrick (1999), with diffuse interstellar bands (DIBs) added as described in §3.3. The DIBs are barely visible on this plot. dense clouds grains acquire “ice” mantles (§3.5) which alter the extinction]. Fitz- patrick (1999) pays careful attention to the effects of finite-width photometric bandpasses, and gives modified formulae which appear to improve the overall fit to observations of ice-free dust. The Cardelli et al. (1989) and Fitzpatrick (1999) fits for RV = 3.1 are compared in §8 (Table 4). Figure 1 shows extinction curves calculated using the F99 parametrization for RV = 2.1, 2.5, 3.1, 4.0, and 5.5. The coefficients in the Cardelli et al. (1989) or Fitzpatrick (1999) fitting formulae can be adjusted to improve the fit to specific sightlines; such a fit is shown for the extreme case of HD 210121, showing that the UV extinction can differ significantly from the average behavior for the same value of RV . “Pair method” determinations of the reddening law for many sightlines indicate that RV ≈ 3.1 for the “average” extinction law for diffuse regions in the local Milky Way (Savage & Mathis 1979, Cardelli et al. 1989). Sightlines intersecting clouds with larger extinction per cloud tend to have larger values of RV ; the larger RV values may indicate grain growth by accretion and coagulation. Another approach to determining the wavelength-dependent extinction is to use star counts or galaxy counts as a function of apparent brightness. Szomoru & Guhathakurta (1999) use UBVRI photometry of Galactic field stars to determine the extinction law; for the four high-latitude clouds they studied, they conclude < that RV ∼ 2, well below the value RV ≈ 3.1 which is widely considered to be “average”, and comparable to the most extreme values of RV ever found in studies of individual stars (RV = 2.1 for HD 210121). Further study is needed to reconcile this apparent conflict. Udalski (2002) uses V and I photometry of “red clump giants” to study the reddening law. Toward the LMC he infers RV ≈ 3.1, but toward Galactic bulge
  • 5. Interstellar Dust Grains 5 regions he finds RV ≈ 1.8 − 2.5. Sloan Digital Sky Survey (SDSS) photometry (Lupton et al. 2003) can be used to study the reddening toward stars at the “blue tip” of the main sequence (Finkbeiner et al. 2003b). The observed reddening appears to be consistent with RV ≈ 3.1. Galaxy surface brightnesses can also be used; SDSS galaxy photometry is consistent with RV = 3.1 (Schlegel et al. 2003). 2.1.2 EXTINCTION PER H Using H Lyman-α and absorption lines of H2 to determine the total H column density NH , Bohlin et al. (1978) found NH /(AB − AV ) = 5.8 × 1021 cm−2 mag−1 , (2) NH /AV ≈ 1.87 × 1021 cm−2 mag−1 for RV = 3.1 , (3) to be representative of dust in diffuse regions. For RV = 3.1, the F99 reddening fit gives AIC /AV = 0.554 for Cousins I band (λ = 0.802 µm), thus AIC /NH ≈ 2.96 × 10⁻²² mag cm2 for RV = 3.1 . (4) > If the extinction curve is really universal for λ ∼ 0.7 µm we might expect eq. (4) to apply independent of RV . Rachford et al. (2002) report H and H2 column densities for 16 sightlines −1 through diffuse and “translucent” clouds. Figure 2 shows AIC /NH versus RV for the 14 sightlines with NH known to better than a factor 1.5 . The IC band extinc- tion AIC has been estimated from AB − AV and RV using the F99 RV -dependent reddening law. Figure 2 appears to show that AIC /NH is not universal for local Milky Way dust: the IC band extinction per H deviates from the ratio (4) when RV deviates from 3.1, in the sense that AIC /NH increases when RV is larger (larger grains). We note that the trend in AIC /NH could be in part the result of errors in de- termination of RV , (i.e., errors in estimating AV , since E(B − V ) is probably accurate to better than 10% for these stars), but the data appear to show a real trend. A least-squares fit, constrained to pass through (4), gives AIC /NH ≈ [2.96 − 3.55 (3.1/RV − 1)] × 10−22 mag cm2 . (5) Figure 3 shows Aλ /NH , the extinction per H, estimated from the F99 extinction fits and eq. (5). If the F99 extinction fits and eq. (5) are both correct, the > extinction per H increases for λ ∼ 0.3 µm when RV increases. Presumably this is due to increased scattering by the grains as the grain size increases. 2.1.3 INFRARED EXTINCTION Between ∼ 0.9 µm and ∼ 5 µm the continuous extinction curve can be approx- imated by a power-law, Aλ ∝ λ−β , with β ≈ 1.61 (Rieke & Lebofsky 1985), 1.70 (Whittet 1988), 1.75 (Draine 1989b), ∼1.8 (Martin & Whittet 1990), ∼1.8 (Whittet et al. 1993), or 1.70 (Bertoldi et al. 1999, Rosenthal et al. 2000). The extinction in the 5–8 µm region is controversial (see Figure 4). Draine (1989b) concluded that the observational evidence was consistent with Aλ ∝ λ−1.75 out to λ ≈ 6 µm. Using ISO observations of H recombination lines, Lutz
  • 6. 6 Draine Figure 2: AI /NH for 14 sightlines through translucent clouds (Rachford et al. 2002), as a function of 1/RV , with RV determined by IR photometry (circles, RV ± 0.2); polarization λmax (triangles, RV ± 10%); or UV extinction curve (diamonds, RV ± 10%). Vertical error bars show 1-σ uncertainty due to errors in NH ; tilted error bars show effects of errors in RV . Least-squares fit [eq. 5)] is shown. et al. (1996) find that the extinction toward Sgr A∗ does not decline with increas- ing λ in the 4–8 µm region. However, studies using H2 rovibrational lines in the Orion molecular cloud, (Bertoldi et al. 1999, Rosenthal et al. 2000) find that the extinction continues to decline with increasing λ to a minimum at ∼6.5 µm. The wavelength dependence of the continuous dust extinction in the Orion molecular cloud could conceivably differ from that on the sightline to Sgr A∗ ; alternatively, perhaps the H recombination line intensity ratios differ from the “case B” re- combination assumed by Lutz et al. It is interesting to see in Figure 4 that the Weingartner & Draine (2001a) grain model for RV = 5.5 is in rough agreement with the Lutz et al. results toward the galactic center. Further observational study of the 5–8 µm extinction is needed. In addition to this continuous extinction, there are strong absorption features at 9.7 µm and 18 µm due to silicates (§3.2), a hydrocarbon feature at 3.4 µm (§3.4), and PAH absorption at 6.2 µm (§3.6). The extinction in molecular clouds also shows additional bands due to ice mantles (§3.5). 2.2 Dust in Other Galaxies Dust in the Milky Way varies from one sightline to another. It is obviously of great interest to study the dust in other galaxies, both in order to correct observations for the extinction by the dust, but also to inform our understanding of dust astrophysics. Our knowledge of the extinction law for dust in other galaxies is greatest for the Large and Small Magellanic Clouds (LMC and SMC), where we can study the
  • 7. Interstellar Dust Grains 7 Figure 3: Aλ /NH for different values of RV , using F99 extinction curve fit and AI /NH from eq. (5). extinction for individual stars, but some progress has been made in determining the wavelength-dependence of extinction in more distant galaxies. 2.2.1 MAGELLANIC CLOUDS Not surprisingly, there are regional variations within the LMC and SMC. Stars more than ∼500 pc away from the 30 Doradus region of the LMC have RV ≈ 3.2 and an extinction law that appears to be quite similar to the Milky Way diffuse cloud extinction law (Fitzpatrick 1986, Misselt et al. 1999). The reddening per H atom E(B − V )/NH ≈ 4.5 × 10⁻²³ cm2 /H (Koorneef 1982, Fitzpatrick 1985), approximately 40% of the Milky Way value. This is approximately consistent with the LMC metallicity: LMC H II regions have Ne/H≈ (3.5 ± 1.4) × 10−5 (Kurt & Dufour 1998), ∼30% of the solar Ne/H (= 1.2 × 10⁻⁴ ) (Grevesse & Sauval 1998). Stars in or near 30 Dor have extinction curves which have a weakened 2175˚ A feature (Fitzpatrick 1986, Misselt et al. 1999). In the SMC, stars in the “bar” region have extinction curves which appear to lack the 2175˚ feature. The reddening per H is only E(B − V )/NH = 2.2 × A 10−23 cm2 /H, ∼13% of the Milky Way value, again consistent with the SMC metallicity: SMC H II regions have Ne/H≈ (1.6 ± 0.2) × 10−5 (Dufour 1984, Kurt & Dufour 1998), or 14% of the solar Ne/H, and the gas-phase C/H is only 6% of solar. Weingartner & Draine (2001a) are able to reproduce the observed extinction laws in the LMC and SMC using appropriate mixtures of carbonaceous and sil- icate grains. The sightlines in the SMC bar which lack the 2175˚ extinction A feature can be reproduced by models which lack carbonaceous grains with radii < a ∼ 0.02 µm.
  • 8. 8 Draine Figure 4: Infrared extinction, relative to extinction at K (2.2 µm), inferred by Rosenthal et al. (2000) for dust in the OMC-1 molecular cloud, and by Lutz et al. (1996) for dust toward Sgr A∗ , and as calculated for the Weingartner & Draine (2001a) grain models for RV = 3.1 (60ppm C in PAH) and RV = 5.5 (30ppm C in PAH). The 6.2 µm absorption feature in the Weingartner & Draine (2001a) grain models is due to PAHs. 2.2.2 M31 Bianchi et al. (1996) present UV extinction curves toward selected bright stars in M31, finding an extinction law similar to the average Milky Way extinction curve, but with the 2175˚ feature possibly somewhat weaker than in the Milky A Way. 2.2.3 OTHER GALAXIES There are several different approaches to determining the extinction curve for dust in galaxies where individual stars cannot be resolved. The dust extinction law can be determined when a foreground galaxy overlaps a background galaxy. Berlind et al. (1997) find the extinction curve for dust in the spiral arm of NGC 2207 to resemble the Milky Way extinction law for RV = 5.0; the interarm dust appears to be even grayer. However, the flatness of the extinction curve could be due in part to unresolved optically-thick dust patches in the foreground galaxy. Keel & White (2001a) find the extinction law in the spiral galaxy AM 1316-241 to be close to the Milky Way mean extinction, with RV = 3.4 ± 0.2; for the spiral galaxy AM 0500-620 the dust extinction law appears to be somewhat steeper than the Milky Way average, with RV ≈ 2.5 ± 0.4. Keel & White (2001b) find the extinction law in the Sc galaxy NGC 3314A to be close to the Milky Way mean, with RV = 3.5± 0.2 over galactocentric radii 1.6–3.8 kpc, with no evidence for any radial trend in reddening law.
  • 9. Interstellar Dust Grains 9 From observations of the overall emission spectrum Calzetti (2001) infers the internal extinction by dust in starburst galaxies. The inferred reddening law is relatively gray compared to the Galactic reddening law, and shows no evidence of a 2175˚ feature. It is not clear to what extent the flatness of the apparent A reddening law may be due to the effects of radiative transfer in optically-thick distributions of stars and dust. Searches have been made for the 2175˚ extinction feature in QSO spectra A (McKee & Petrosian 1974). Malhotra (1997) reports a statistical detection in a sample of 92 QSOs, but Pitman et al. (2000) argue that the detection was not statistically significant. Gravitationally-lensed QSOs with multiple images can be used to determine the extinction law if the intrinsic spectrum is assumed to be time-independent. Falco et al. (1999) determine extinction laws in galaxies out to z = 1.01, with RV estimates from 1.5 to 7.2. Toft et al. (2000) find the extinction curve in a galaxy < < at z = 0.44 to have 1.3 ∼ RV ∼ 2.0. Motta et al. (2002) find that the dust in a lensing galaxy at z = 0.83 is consistent with a standard Milky Way extinction law for RV = 2.1 ± 0.9, including an extinction bump at 2175˚. A 3 SPECTROSCOPY OF DUST The composition of interstellar dust remains controversial. While meteorites (§4) provide us with genuine specimens of interstellar grains for examination, these are subject to severe selection effects, and cannot be considered representative of interstellar grains. Our only direct information on the composition of interstellar dust comes from spectral features in extinction, scattering, or emission. 3.1 2175˚ Feature: Aromatic C? A By far the strongest spectral feature is the broad “bump” in the extinction curve ˚ centered at ∼2175A (see Figure 1). Fitzpatrick & Massa (1986) showed that the observed 2175˚ feature can be A accurately fit with a Drude profile C0 γ 2 ∆Cext (λ) = , (6) (λ/λ0 − λ0 /λ)2 + γ 2 ˚ peaking at λ0 = 2175A (or λ−1 = 4.60 µm−1 ) and with a broadening parameter 0 γ = 0.216 (corresponding to FWHM γλ0 = 469˚, or γλ0 = 0.992 µm−1 ). The A −1 strength of the absorption is such that on an average diffuse cloud sightline in the Milky Way, the 2175˚ profile corresponds to an oscillator strength per H A nucleon nX fX /nH ≈ 9.3 × 10⁻⁶ (Draine 1989a). Since we expect the oscillator < strength per molecule fX ∼ 0.5, it can be concluded that the carrier molecule must contain one or more elements from {C,O,Mg,Si,Fe}, as these are the only > condensible elements with sufficiently high abundances nX /nH ∼ 4 × 10⁻⁵ in the ISM. Fitzpatrick & Massa (1986) show that the width of the feature varies consider- ably from one sightline to another. The FWHM has an average value 0.992 µm−1 , but the distribution has a ±2σ variation of ±12%. This variability in FWHM is in contrast to the fact that the central wavelength λ0 is nearly invariant from one sightline to another: although variations are detected, λ0 shows ±2σ variations of only ±0.46%.
  • 10. 10 Draine Immediately following discovery of the 2175˚ feature by Stecher (1965), Stecher A & Donn (1965) pointed out that small graphite particles would produce absorp- tion very similar to the observed feature. Although non-carbonaceous carriers have been proposed (e.g., OH− on small silicate grains: Steel & Duley 1987), it now seems likely that some form of graphitic carbon is responsible for the observed feature. The C atoms in graphite are bound to one another in hexagonal sheets. Each C atom has 4 valence electrons (2s2 2p2 ); 3 of these are in trigonal sp2 or σ orbitals; the remaining electron is in a delocalized π orbital, which is shared among the C- C bonds. The individual sheets of carbon atoms are held parallel to one another only by weak van der Waals forces. Absorption of a photon can excite a π electron to an excited orbital (π ∗ ); this π → π ∗ transition is responsible for the absorption feature peaking at ∼ 2175˚. Using the dielectric function of graphite (Draine & A Lee 1984), one finds that randomly-oriented small graphite spheres would have an oscillator strength f = 0.16 per C atom (Draine 1989a). Thus the observed 2175˚ extinction feature would require C/H=5.8×10−5 in small graphite spheres, A compatible with interstellar abundance constraints. Although graphite is an attractive candidate, the graphite hypothesis does not appear to have a natural way to accomodate the observed variations in FWHM of the profile while at the same time holding λ0 nearly constant: variations in graphite grain shape and size produce variations in FWHM, but these are ac- companied by changes in λ0 (Draine & Malhotra 1993). Mennella et al. (1998) propose that the 2175˚ feature is due to UV-processed A HAC particles, but do not appear to have actually measured in the lab a profile matching the interstellar 2175˚ feature. A Wada et al. (1999) propose that the 2175˚ feature is due to onion-like hyper- A fullerene carbon particles. While these particles do have an absorption peak near 2200˚, the feature appears to be broader than the interstellar profile. A The carbon atom skeleton of polycyclic aromatic hydrocarbon (PAH) molecules is very similar to a portion of a graphite sheet, with similar electronic wavefunc- tions. It is therefore not surprising that PAH molecules generally have strong π → π ∗ absorption in the 2000–2500˚ region. Thus large PAH molecules are A candidates to be the carrier of the interstellar 2175˚ feature – this is a natural A extension of the graphite hypothesis. The grain model of Weingartner & Draine (2001a) and Li & Draine (2001b) has C/H=6.0 × 10−5 in PAH molecules or clusters containing from 20 to 105 C atoms – this population of PAH molecules is required to reproduce the observed infrared emission (see §9). Absorption profiles are not known for PAH molecules of the sizes characteristic of the interstellar PAHs, but one would expect a similar π → π ∗ oscillator strength per C as for graphite, or f ≈ 0.16. Thus we see that in this grain model, the 2175˚ extinction feature is expected to be primarily – A perhaps entirely – due to large PAH molecules. In this interpretation, the observed band profile would be due to a mixture of PAHs, and the observed variations in FWHM (and small variations in λ0 ) would result from differences in the PAH mix from one sightline to another. 3.2 Silicate Features The infrared extinction includes a strong absorption feature peaking at ∼9.7 µm. Silicate minerals generally have strong absorption resonances near 10 µm due
  • 11. Interstellar Dust Grains 11 to the Si-O stretching mode, and it seems virtually certain that the interstellar 9.7 µm feature is due to absorption by interstellar silicate material. This con- clusion is strengthened by the fact that a 10 µm emission feature is observed in outflows from cool oxygen-rich stars (which would be expected to condense silicate dust) but not in the outflows from carbon-rich stars (where silicates do not form, because all of the oxygen is locked up in CO). There is also a broad feature at 18 µm which is presumed to be the O-Si-O bending mode in silicates (McCarthy et al. 1980; Smith et al. 2000). The Trapezium (Gillett et al. 1975) emission implies τ (λ) with FWHM≈3.45 µm, whereas µ Cep (Russell et al. 1975) has FWHM=2.3 µm, so the silicate properties are not universal. On sightlines dominated by relatively diffuse clouds (e.g., to- ward the B5 hypergiant Cyg OB2-12 or distant WC stars) the 9.7 µm absorption appears to be better fit by the narrower µ Cep profile (Roche & Aitken 1984, Bowey et al. 1998). The silicates in molecular clouds, however, seem better fit by the broader Trapezium profile (Bowey et al. 1998). The strength of the 9.7 µm feature relative to AV has been measured toward Cyg OB2-12 and toward WC stars. The studies in Table 1 together indicate AV /∆τ9.7 = 18.5 ± 2.0, where the uncertainty includes a subjective allowance for systematic errors in the model-fitting. Table 1: Silicate 9.7 µm Feature Strength Sightline l b d AV ∆τ9.7 AV /∆τ9.7 ref (◦ ) (◦ ) (kpc)(mag) Gal. center 0 0 8.5 34 ± 4 3.6 ± 0.3 9±1 Roche & Aitken (1985) Cyg OB2-12 80.10 0.83 1.7 10 0.58 17.2 Roche & Aitken (1984) “ 10.2 0.54 18.9 Whittet et al. (1997) “ 10.2 0.64 15.9 Bowey et al. (1998) WR98A 358.13 -0.03 1.90 12.5 0.62 20.2 van der Hucht et al. (1996) “ 11.2 0.64 17.4 Schutte et al. (1998) WR112 12.14 -1.19 4.15 13 0.61 21.3 Roche & Aitken (1984) “ 11.9 0.64 18.6 van der Hucht et al. (1996) “ 12.0 0.56 21.4 Schutte et al. (1998) WR118 21.80 -0.22 3.13 13.3 0.69 19.3 Roche & Aitken (1984) “ 12.6 0.65 19.4 van der Hucht et al. (1996) “ 12.8 0.71 18.0 Schutte et al. (1998) Local Diffuse ISM 18.5 ± 2 overall The interstellar 9.7 µm feature is broad and relatively featureless, as opposed to absorption profiles measured in the laboratory for crystalline silicates, which show considerable structure which can be used to identify the precise mineral. The absence of substructure in the interstellar profile is believed to indicate that the interstellar silicates are largely amorphous rather than crystalline. Amorphous or glassy silicates can be produced in the laboratory by ion bombardment of initially crystalline material (Kraetschmer & Huffman 1979), formation in smokes (Day 1979), rapid quenching of a melt (J¨ger et al. 1994) or deposition following a evaporation (Koike & Tsuchiyama 1992, Stephens et al. 1995, Scott & Duley 1996). The laboratory absorption profiles are in some cases quite similar to the interstellar profile, supporting the view that interstellar silicates are amorphous. The observed strength per H nucleon of the interstellar silicate band appears to require that close to 100% of the solar abundance of Si, Fe, and Mg be condensed into amorphous grains. Mathis (1998) has argued that the observed strength can
  • 12. 12 Draine only be reproduced if silicate grains are “fluffy”, with ≥25% vacuum, as in the grain model of Mathis & Whiffen (1989). The observed 10 µm profile appears to be consistent with amorphous material with a composition in the olivine family, Mg2x Fe2−2x SiO4 . Since Mg and Fe are of approximately equal abundance in the Sun, it would be reasonable to have x ≈ 0.5. Li & Draine (2001a) conclude that spectrophotometry of the 9.7 µm feature in extinction toward Cyg OB2-12 (Bowey et al. 1998) limits the fraction < of the Si in crystalline silicates to be ∼ 5%. Demyk et al. (1999) find that for two protostellar objects, at most 2% of the silicates could be crystalline. However, Bowey & Adamson (2002) argue that the observed 10 µm profile toward Cyg OB2-12 is consistent with a mixture of amorphous silicates (40% by mass) and 8 crystalline pyroxenes (60% by mass); each of the crystalline species in their mix contributes ∼7.5% by mass, and the fine structure in the 10 µm profile appears to be consistent with the observations. However, this interpretation raises various concerns: • The lab measurements were for powders in a KBr matrix; spectra in vacuo would be different. Bowey & Adamson (2002) state that the “KBr shift” is minimal, but it would be expected to be significant near these strong resonances. • A mix of crystalline grains that gives a smooth absorption profile will not give a smooth emission profile unless the different crystalline materials are heated to the same temperature. • The different crystalline types have distinct far-infrared modes. The smooth- ness of the far-infrared spectra of star-forming regions places upper limits on crystalline abundances. For example, the proposed mixture has ∼7.5% of the Si atoms in diopside, but the observations of Onaka & Okada (2003) < (see below) limit diopside to ∼ 2% of interstellar Si. • It is not apparent that the proposed mixture would be consistent with the 18 µm extinction profile. • The polarization profile of grains near strong resonances is sensitive to the dielectric function. It is not apparent that the proposed mixture would be consistent with spectropolarimetric constraints (see below). Further study of these points is urgently required. In the text below it is assumed that interstellar silicates are predominantly amorphous, but the reader should keep in mind that a significant crystalline fraction may be possible. The 9.7 and 18 µm silicate features can be observed in polarization, either in absorption or in emission. For strong resonances (such as the two silicate fea- tures), the polarization profile differs from the absorption profile, so that spec- tropolarimetry can constrain the dielectric function of the grain material (Martin 1975). The observed intensity and polarization across the 9.7 µm feature appear to be approximately consistent with the “astronomical silicate” dielectric func- tion estimated by Draine & Lee (1984), but the observed 20 µm polarization is stronger than expected for that dielectric function (Aitken et al. 1989, Smith et al. 2000). Onaka & Okada (2003) report detection of an emission feature at 65 µm which may be due to diopside CaMgSi2 O6 , containing 5-10% of interstellar Ca (cor- responding to 0.35-0.7% of interstellar Si); if confirmed, this would be the first evidence for crystalline silicates in the ISM. While crystalline silicates are not
  • 13. Interstellar Dust Grains 13 abundant in the ISM, there is evidence from distinctive emission features for their presence in dust disks around main-sequence stars (see Artymowicz 2000 for a summary), young stellar objects and evolved stars (see Waelkens et al. 2000 for a summary), and in some solar-system comets (see Hanner 1999 for a sum- mary); see §5.1 below. Nevertheless, even in these systems most of the silicate material remains amorphous. ˚ Figure 5: Diffuse interstellar bands in the 5700-6670A region, using DIB parameters from Jenniskens & Desert (1994). 3.3 Diffuse Interstellar Bands The observed extinction curve includes a large number of weak extinction fea- tures, known as the “diffuse interstellar bands”, or DIBs. The DIBs have FWHM ∼ 1˚, too broad to be due to molecules with ∼ 5 atoms in the gas phase, and > A < are therefore features of the grain population. Jenniskens & Desert (1994) list 154 “certain” DIBs in the interval 0.38–0.868 µm, plus an additional 52 “prob- able” detections. Figure 5 shows an average extinction curve for 1.5 µm−1 < λ−1 < 1.75 µm−1 , a wavelength range which includes several strong DIBs, most notably the DIB at 5780˚. This curve consists of the smooth extinction calcu- A lated using the Fitzpatrick (1999) parametrization plus individual diffuse bands approximated by Drude profiles with central wavelengths, FWHM, and strengths from the tabulation of Jenniskens & Desert. The first DIBs were discovered over 80 years ago (Heger 1922) and their in- terstellar nature was established 69 years ago (Merrill 1934), yet to date not a single DIB has been convincingly identified! Some of the DIBs may be ab- sorption features produced by individual PAH molecules in the interstellar PAH mixture. D´sert et al. (1995) report a positive correlation between the strength of e the 2175˚ bump and the strength of certain DIBs. High resolution observations A
  • 14. 14 Draine of the 5797˚ and 6614˚ DIBs show fine structure which could be indicative of A A rotational bands (Kerr et al. 1996, 1998). DIBs have recently been detected toward reddened stars in the LMC and SMC (Ehrenfreund et al. 2002). If the DIBs were due to absorption in the aligned grains responsible for the po- larization of starlight (§6) there should be excess polarization associated with the DIBs (Martin & Angel 1974, Purcell & Shapiro 1977). All attempts to measure polarization structure associated with DIBs have yielded only upper limits (see Adamson & Whittet 1995) that appear to require that at least the DIBs that have been studied originate in non-aligned material, consistent with a molecular origin. At this time the carriers of the DIBs remain unknown, but it seems likely that at least some are due to large molecules/ultrasmall grains, possibly of PAH composition. 3.4 3.4µm Feature: Aliphatic C-H Stretch > A broad extinction feature at 3.4 µm is measurable on sightlines with AV ∼ 10 mag (Adamson et al. 1990). The feature appears to be present in diffuse atomic re- gions (in contrast to the “ice” features, see §3.5), and therefore is likely due to “refractory” grain material. The C-H stretching mode in aliphatic (chain-like) hydrocarbons occurs at 3.4 µm. Since such hydrocarbons are plausible grain con- stituents, the observed 3.4 µm absorption is generally attributed to the aliphatic C-H stretch (Sandford et al. 1991). Unfortunately, aliphatic hydrocarbons show considerable variation in the C-H band strength, so it has not been possible to use the measured 3.4 µm feature to determine the abundance of aliphatic hydrocarbon material in the interstellar grain population, nor is it possible to identify the specific hydrocarbon mate- rial (Pendleton & Allamandola 2002). Sandford et al. (1991, 1995) suggest that the 3.4 µm feature in the diffuse ISM is due mainly to short saturated aliphatic chains containing ∼4% of the total C abundance. Greenberg et al. (1995) sug- gest that the 3.4 µm feature is due to carbonaceous organic residues produced by UV photolysis of ice mantles; Duley et al. (1998) attribute the feature to hydro- genated amorphous carbon (HAC) material incorporating 20–25% of the total C abundance; In grain models where the 3.4 µm absorption is assumed to arise in hydrocarbon mantles coating silicate grains (e.g., Li & Greenberg 1997), the 3.4 µm feature would be polarized when the 9.7 µm silicate feature is polarized; this allows a direct test of the silicate core/hydrocarbon mantle model for interstellar dust (Li & Greenberg 2002). 3.5 Ice Features Sightlines passing through dense molecular clouds typically show additional ab- sorption features. The strongest feature is the 3.1 µm O-H stretching mode in solid H2 O. Whittet et al. (1988) showed that in the Taurus dark cloud complex, the strength of this feature is approximately given by 0 < for AV ∼ 3.3 mag , ∆τ3.1 ≈ > (7) 0.093(AV − 3.3mag) for AV ∼ 3.3 mag ,
  • 15. Interstellar Dust Grains 15 suggesting that dust in regions with AV > 3.3 has an ice coating, whereas dust in regions with AV < 3.3 is iceless. The 3.1 µm feature is accompanied by a number of weaker features due to H2 O, plus additional features due to CO2 , NH3 , CO, CH3 OH, CH4 , and other species. The features due to different species often overlap, and the positions and shapes of particular spectral features can be sensitive to the composition of the frozen mixture, complicating abundance determinations. Table 2 gives the abundances relative to H2 O estimated for two sightlines into dense star-forming regions (W33A and W3:IRS5) and for the sightline to Sgr A∗ at the Galactic Center. Although all three sightlines have similar CO2 /H2 O ratios, the abundances of other species (e.g., CH3 OH) vary considerably from one sightline to another. The composition of the ice mantle must be sensitive to both local environment and history. Table 2: Major Ice Components X λ ∆τλ N (X)/N (H2 O) (µm) W33A W33A W3:IRS5 GC H2 O 3.1a 5.5 ± 0.5d 1 1 1 XCN 4.62 1.4d .035d CO 4.67 1.3e .081e .030e < 0.12h H2 CO 5.81j 0.17j .065j - < .024h CH4 7.7 0.11f .016d .0043f .024h NH3 9.0k < 0.05l < .035f 0.2-0.3g CH3 OH 9.8b 0.9 ± 0.2d 0.18d < .004f < .04h CO2 15.2c 0.58e 0.13e 0.13e 0.14e a Also 6.0, 13.5, 45µm b Also 4.27µm c Also 3.53, 6.85µm d Gibb et al. (2000) e Gerakines et al. (1999) f G¨rtler et al. (2002) u g Lacy et al. (1998) h Chiar et al. (2000) j Keane et al. (2001) k Also 2.27, 2.96, 3.48µm l Taban et al. (2003) The grains in star-forming clouds are often aligned (see §6.2), and the radiation reaching us from embedded sources is often polarized. Polarization has been measured in the features at 3.1 µm (H2 O), 4.6 µm (XCN) and 4.67 µm (CO) (Chrysostomou et al. 1996, Hough et al. 1996). 3.6 3.3, 6.2, 7.7, 8.6, 11.3µm PAH Features Many emission nebulae (HII regions, planetary nebulae) and reflection nebulae show emission in the 3–15 µm region that is far stronger than expected from a ∼ 100˚ grains heated by the ambient radiation field and emitting thermally. > A Much of the emission is concentrated in five features at 3.3, 6.2, 7.7, 8.6, and 11.3 µm (see Figure 6). Leger & Puget (1984) identified these features as the optically-active vibrational modes of PAH molecules. When H atoms are attached to the edge of an aromatic ring skeleton, there are characteristic optically-active
  • 16. 16 Draine Figure 6: PAH emission features in the 5–15 µm spectrum of the reflection nebula NGC 7023. vibrational modes (Allamandola et al. 1989): • C-H stretching mode at 3.3 µm • C-C stretching mode at 6.2 µm • C-C stretching mode at 7.7 µm • C-H in-plane bending mode at 8.6 µm • C-H out-of-plane bending mode with wavelength depending on the number of neighboring H atoms: – 11.3 µm for “mono” H (no adjacent H) – 12.0 µm for “duo” H (2 contiguous H) – 12.7 µm for “trio” H (3 contiguous H) – 13.55 µm for “quartet” H (4 contiguous H) Examples of “mono”, “duo”, “trio”, and “quartet” sites are indicated in Figure 7. Although the broadness of the observed features precludes identification of specific PAH molecules, a population of PAH molecules appears to provide a natural explanation for the observed emission spectrum, where the vibrational excitation is assumed to be the result of “internal conversion” of energy following absorption of an optical or UV photon (Leger & Puget 1984, Allamandola et al. 1989). There should in principle be absorption associated with these emission features. An absorption feature at 6.2 µm (see Figure 4) has been observed (Schutte et al. 1998, Chiar et al. 2000). It matches closely the expected 6.2 µm absorption feature (Li & Draine 2001b).
  • 17. Interstellar Dust Grains 17 Figure 7: The structure of 4 PAH molecules. Examples of mono, duo, trio, and quartet H sites are indicated. 3.7 X-Ray Absorption Edges Interstellar grains absorb and scatter X-rays. The X-ray absorption by atoms such as C, O, Mg, Si, and Fe will show photoelectric “absorption edges” similar to atoms in the gas phase, but the precise energy and structure of the absorption edge will be dependent on the chemical nature of the grain material (Forrey et al. 1998, Draine 2003b). Significant structure in both scattering and absorption is expected near the C K (284 eV), O K (538 eV), Fe L2,3 (708, 721 eV), Mg K (1311 eV), Si K (1846 eV), and Fe K (7123 eV) edges (Draine 2003b). The Chandra observatory has been used to study the absorption edges of O (Paerels et al. 2001, Takei et al. 2002) and O, Mg, Si, and Fe (Schulz et al. 2002) but it has not yet proved possible to identify the chemical form in which the solid-phase Mg, Si, Fe and O are bound. 3.8 Extended Red Emission The “extended red emission” (ERE) from dust grains provides a potentially im- portant clue to the composition of interstellar dust. The ERE consists of a broad featureless emission band between ∼ 5400˚ and ∼ 9000˚, peaking at A A ˚ ∼ λp ∼ 8200A, and with a FWHM in the range 600–1000˚. The peak 6100A < < ˚ A wavelength λp and band profile appear to vary from one region to another. First observed in the Red Rectangle (Schmidt et al. 1980), ERE has since been seen in a wide variety of dusty environments, including reflection nebulae (Witt & Schild 1985, Witt & Boroson 1990), planetary nebulae (Furton & Witt 1990), HII regions (Darbon et al. 2000), the diffuse ISM of our Galaxy (Gordon et al. 1998, Szomoru & Guhathakurta 1998), and from other galaxies (Pierini et al. 2002).
  • 18. 18 Draine The ERE must be photoluminescence: absorption of a starlight photon followed by emission of a lower energy photoluminescence photon. Based on the detection of ERE from the diffuse ISM, the photon conversion efficiency of interstellar dust is estimated to be 10%±3% (Gordon et al. 1998, Szomoru & Guhathakurta 1998). The photoluminescence efficiency of the ERE carrier must exceed this, since it is presumably not the only UV/visible photon absorber. The luminescing substance remains uncertain. Candidate ERE materials in- clude HAC (Duley 1985, Witt & Schild 1988), PAHs (d’Hendecourt et al. 1986), quenched carbonaceous composite (Sakata et al. 1992), C60 (Webster 1993), coal (Papoular et al. 1996), silicon nanoparticles (Ledoux et al. 1998, Witt et al. 1998, Smith & Witt 2002), and carbon nanoparticles (Seahra & Duley 1999). Most candidate materials appear unable to match the observed ERE spec- tra and efficiency (Witt et al. 1998). Lab studies of the luminescence spectrum of hydrogenated amorphous carbon (HAC) appeared to show a good match to observed ERE spectra (Witt & Schild 1988) provided the HAC is annealed suf- ficiently to shift the luminescence into the red, where it is observed; however, such red-luminescing HAC has a very low photoluminescence efficiency (Furton & Witt 1993, Rusli et al. 1996) that is incompatible with the high efficiency required to explain the ERE from the diffuse ISM. Each of the nanoparticle hypotheses appears to have difficulties: (1) Seahra & Duley (1999) argue that small carbon particles with mixed sp2 /sp3 bonding can reproduce the observed ERE profile and required efficiency, but they predict a second ERE peak at ∼ 1 µm which does not appear to be present in NGC 7023 (Gordon et al. 2000). (2) The PAH hypothesis has difficulty with (a) ERE emis- sion and PAH emission having differing spatial distributions in HII regions (Sivan & Perrin 1993, Darbon et al. 2000), and (b) nondetection of ERE in reflection nebulae illuminated by stars with Teff < 7000 K (Darbon et al. 1999), whereas PAH emission bands are seen in these regions. (3) The silicon nanoparticle hy- pothesis appears to be ruled out by nondetection of ∼ 20 µm emission that should result from single-photon heating (see §9) in the silicon nanoparticle model (Li & Draine 2002a). Recently, two new emission features have been reported in the near-infrared, at 1.15 and 1.5 µm (Gordon et al. 2000). Smith et al. (2001) propose that the 1.5 µm feature is due to β-FeSi2 . Although it would appear that all current proposals have been ruled out, the arguments against them are not yet conclusive. For example, perhaps it is possi- ble to prepare HAC samples that achieve a higher photoluminescence efficiency, or there may be some way to explain the lack of PAH emission seen in the Bub- ble nebula, or silicon nanoparticles might be part of larger structures. At this point it seems appropriate to continue consideration of HAC, PAHs, and silicon nanoparticles as candidate ERE carriers. 4 PRESOLAR GRAINS IN METEORITES AND INTERPLAN- ETARY DUST The most primitive meteorites contain presolar grains, which are recognized by virtue of isotopically anomalous composition – see Hoppe & Zinner (2000) for a recent review. Table 3 lists the six presolar grain types that have been identified thus far, along with their abundance (fraction of the total mass) in the bulk
  • 19. Interstellar Dust Grains 19 meteorite. Nanodiamond (sp3 -bonded carbon) grains make up 0.05% = 500 ppm of the meteorite. A tiny fraction of the nanodiamond particles contain a trapped Xe atom; the isotopic abundances of the trapped Xe suggests formation in SN ejecta. SiC grains are the next most abundant by mass (6 ppm), with isotopic patterns that indicate formation primarily in outflows from AGB stars. About 0.5% of the SiC grains are of “Type X”, with isotopic abundances, including live 44 Ti (T 1/2 = 59 yr) at the time of grain formation, which suggest formation in Type II supernovae. About 1 ppm of the meteorite consists of graphitic (sp2 - bonded carbon) grains, formed in AGB stars, supernovae, and novae. Al2 O3 corundum grains are found, at least some of which appear to have formed in outflows from red giants and AGB stars. Finally, there are also Si3 N4 grains which appear to have a SN II origin. Table 3: Presolar Grains in Meteorites (Hoppe & Zinner 2000) Composition diameter( µm) Abundancea Originsb C(diamond) 0.002 5 × 10⁻⁴ SN SiCc 0.3–20 6 × 10⁻⁶ AGB C(graphite)d 1–20 1 × 10⁻⁶ AGB,SN II,nova SiC type X 1–5 6 × 10⁻⁸ SN Al2 O3 (corundum) 0.5-3 3 × 10⁻⁸ RG,AGB Si3 N4 ∼1 2 × 10⁻⁹ SN II a Overall abundance in primitive carbonaceous chondrite meteorites. b SN = supernova; AGB = asymptotic giant branch star; RG = red giant c SiC grains sometimes contain very small TiC inclusions. d graphite grains sometimes contain very small TiC, ZrC, and MoC inclusions. It is important to recognize that the procedures used to search for presolar grains in meteorites begin with chemical treatments designed to dissolve the silicate matrix in which the presolar grains are embedded. It therefore comes as no surprise that silicates are not present in Table 3. It should also be recognized that the formation of even the most primitive meteorites involved temperatures high enough to melt rocks, in an environment which was presumably oxidizing (since the solar nebula had O/C > 1). Therefore the relative abundances in Table 3 probably have more to do with the ability of grain types to survive a period of exposure to a hot, oxidizing environment than with interstellar abundance. Much more informative would be the abundances of presolar grains in cometary material. A “core sample” would be ideal, but at this time there is no planned mission for returning a sample of pristine cometary ice to Earth. However, the Stardust mission (Brownlee et al. 2000) will collect cometary dust on an aerogel panel during the 6.1 km s−1 encounter of the Stardust spacecraft with Comet Wild 2 in January 2004, and return it to Earth. Interstellar grains enter the solar system, and have been detected by the Ulysses and Galileo spacecraft; the impact rate is consistent with expectations > for a ≈ 0.3 µm grains, but the impact rate for a ∼ 1 µm grains is much larger than expected for the average interstellar dust distribution (Frisch et al. 1999, Weingartner & Draine 2001a). The Stardust mission will expose an aerogel panel to interstellar grains flowing through the solar system; with ∼ 25km s−1 impact speeds, these grains are likely to be destroyed, but their residue in the aerogel can be analyzed for total mass and composition. We await the return of Stardust in January 2006.
  • 20. 20 Draine Active comets release their dust grains, which become part of the interplan- etary dust particle (IDP) population. IDPs can be collected from the Earth’s atmosphere (Brownlee 1985). Bradley (1994) identifies a class of glassy silicate IDPs, known as GEMS (Glass with Embedded Metals and Sulfides), which ap- pear to be presolar. Most GEMS are between 0.1 and 0.5 µm in diameter – similar to the sizes of interstellar silicates (see Figure 8). The 8 − 13 µm infrared absorption spectrum of these grains is similar to interstellar silicates (Bradley et al. 1999). 5 CANDIDATE GRAIN MATERIALS Based on the observations and clues described above, it is possible to formulate a short list of candidate materials for the bulk of interstellar dust. We will omit from consideration “rare” materials like Al2 O3 – even though Al is depleted from the gas phase, given the solar abundance of Al (Al/H = 3.1 × 10⁻⁶ ) aluminum- based materials account for only a few % of interstellar grain mass. 5.1 Silicates There is little doubt that silicate material contributes a substantial fraction of the total mass of interstellar dust. As discussed above (§3.2), in the ISM, at least ∼95% of the silicate material is amorphous (Li & Draine 2002a). In some cir- cumstellar disks the crystalline fraction appears to be higher, although it appears that the bulk of the silicates remain amorphous. Bouwman et al. (2001) find that 5-10% of the olivine mass is crystalline in the dust around Herbig Ae/Be stars. Cosmic abundances dictate that the dominant metal ions in silicates will be either Mg, Fe, or both. There are two general chemical classes of crystalline silicates: Mg-Fe pyroxenes Mgx Fe1−x SiO3 (including enstatite MgSiO3 and fer- rosilite FeSiO3 ) and olivines Mg2x Fe2−2x SiO4 (including forsterite Mg2 SiO4 and fayalite Fe2 SiO4 ). There are two different crystalline structures for the pyroxenes: orthopyroxene and clinopyroxene. The optical constants of various crystalline pyroxenes have been measured by J¨ger et al. (1998) and Chihara et al. (2002); crystalline olivines have been mea- a sured by J¨ger et al. (1998), Koike et al. (1999), and Suto et al. (2002). a As noted above, some circumstellar dust exhibits emission features character- istic of crystalline silicates, and from the locations and strengths of these features it is possible to infer the Mg:Fe ratio. In all cases thus far the crystalline silicate material appears to be very Mg-rich and Fe-poor, consistent with pure forsterite and enstatite (Tielens et al. 1998, Molster et al. 2002a). Molster et al. (2002b) report that enstatite MgSiO3 is more abundant than forsterite Mg2 SiO4 around most evolved stars. Si is generally heavily depleted in the ISM. If Si is predominantly in silicates, and if Fe is not present in silicates, then the interstellar silicates would be expected to be enstatite MgSiO3 . The Fe would then presumably be in either metallic Fe or in oxide form (FeO, Fe2 O3 , Fe3 O4 ). However, while there is evidence for Mg- rich silicate in circumstellar dust, we do not yet have a reliable indication of the composition of interstellar silicates, so an appreciable Fe fraction, and olivine-like composition, are not ruled out. Observed gas-phase abundances of Mg, Fe, and Si, and variations in these abundances from one cloud to another, have been interpreted as indicating that
  • 21. Interstellar Dust Grains 21 silicate grains may have a Mg-rich mantle and Fe-rich core (Spitzer & Fitzpatrick 1993). The total ratio of (Fe+Mg) atoms to Si atoms in grains is estimated to be ∼3.4:1 (Fitzpatrick 1997), ∼3:1 (Howk et al. 1999) – in excess of the 2:1 ratio expected for olivines, suggesting that metal oxides or metallic Fe may be present in addition to silicates. However, these conclusions depend upon assumed values of the total interstellar abundances; Sofia & Meyer (2001) conclude that the (Fe+Mg):Si ratio in interstellar dust is actually close to 2:1 for both “halo” dust and the dust in the well-studied ζOph cloud. The composition of interstellar silicates remains uncertain, but the study by Sofia & Meyer (2001) suggest that olivine MgFeSiO4 appears to be a reasonable approximation. 5.2 Carbonaceous Materials By “carbonaceous” we mean materials which are predominantly C by mass, in- cluding: • Diamond: sp3 -bonded carbon. • Graphite: sp2 -bonded carbon, either monocrystalline or polycrystalline. • Amorphous or glassy carbon: a mixture of sp2 - and sp3 -bonded carbon, with only short-range order. • Hydrogenated amorphous carbon: amorphous carbon with an appreciable hydrogen fraction. • Polycyclic aromatic hydrocarbons: sp2 -bonded carbon with peripheral H (see §3.6). • Aliphatic (chainlike) hydrocarbons (see §3.4) The presence of sp2 -bonded carbon is indicated by the 2175˚ feature and the A PAH emission bands. The 2175A ˚ feature requires sp2 -bonded carbon in small (a ∼ 100˚) particles (in larger particles the 2175˚ feature is suppressed), and < A A single-photon excitation of the PAH emission features requires very small par- < ticles, with ∼ 104 C atoms. A PAH population incorporating a C abundance C/H≈ 60 × 10−6 appears able to account for both the PAH emission features (§3.6) and the 2175˚ feature (§3.1). A 5.3 SiC SiC grains are found in meteorites (§4) and an emission feature at 11.3 µm is ob- served in the spectra of many carbon stars (Treffers & Cohen 1974, Blanco et al. 1998). However, absence of the 11.3 µm feature in the interstellar extinction indi- cates that the abundance of Si in SiC dust is less than 5% of the abundance of Si in silicates (Whittet et al. 1990). Accordingly, SiC grains, although undoubtedly present in the ISM, are not a major component of the interstellar grain mix. 5.4 Carbonates Calcite CaCO3 and dolomite CaMg(CO3 )2 have been detected in dusty disks within the planetary nebulae NGC6302 and NGC6537 (Kemper et al. 2002), but these carbonates are estimated to contribute less than 1% of the dust mass. Carbonates are evidently not a major component of the interstellar grain mix.
  • 22. 22 Draine 6 POLARIZATION 6.1 Optical-UV Polarization Light reaching us from reddened stars is often linearly polarized, because the ex- tinction depends on the polarization mode. The degree of polarization as a func- tion of wavelength can be approximated by the “Serkowski law”, a 3-parameter empirical fitting function (Serkowski 1973): p(λ) = pmax exp −K(ln(λ/λmax ))2 , (8) where λmax ≈ 5500˚ and K ≈ 1 on typical sightlines through diffuse clouds. A The polarization arises from differential extinction by aligned dust grains, and will depend on the degree of alignment with the local magnetic field, the angle between the local magnetic field and the line of sight, and the degree to which the direction of the magnetic field varies along the line of sight. Studies of many sightlines (Serkowski et al. 1975) find that < pmax ∼ 0.03A(λmax )/mag , (9) where A(λ) is the (polarization-averaged) extinction at wavelength λ. Interstellar dust grains must be sufficiently nonspherical and sufficiently aligned so that at λmax one polarization mode is extincted ∼6% more than the other polarization mode. Values of pmax /A(λmax ) < 0.03/mag are presumed to result when the magnetic field is disordered or not transverse to the line-of-sight, or from regions where the degree of grain alignment is lower. The wavelength λmax varies from one sightline to another, and is correlated with the value of RV , with RV ≈ 3.67(λmax /5500˚) − 0.29 A (10) (Clayton & Mathis 1988), and K ≈ 1.02(λmax /5500˚) − 0.10 A (11) (Wilking et al. 1982). The Serkowski law provides quite a good fit to the data for < < 0.8 µm−1 ∼ λ ∼ 3 µm−1 . Observations in the vacuum UV (Anderson et al. 1996, Clayton et al. 1996, Wolff et al. 1997) show that the degree of polarization con- tinues to decline with decreasing wavelength. This implies that the small grains responsible for the rising extinction in the vacuum UV are inefficient polarizers – they are either nearly spherical or minimally aligned (Kim & Martin 1995). Most stars show no polarization excess in the 2175˚ feature but two do: a A 2175˚ polarization feature is detected in HD 197770 and HD 147933-4 (Wolff et A al. 1997). 6.2 Polarized Far-Infrared Emission The aligned dust grains that polarize starlight will also produce linearly-polarized infrared emission, because for an isotropic dielectric function a submicron grain will radiate most effectively when the E field is parallel to the “long” axis of the grain. It is now possible to map this polarized emission from dense regions. For example, the W51 star-forming region has been mapped at 100 µm (Dotson etal
  • 23. Interstellar Dust Grains 23 2000), 850 µm (Chrysostomou et al. 2002), and 1.3mm (Lai et al. 2001), with linear polarizations as large as 10% observed at 1.3mm. Hildebrand et al. (1999) have discussed the wavelength-dependence of the mea- sured polarization for dense cloud cores and envelopes. The data suggest that the grain alignment is larger in warmer regions. Observations of quiescent clouds are consistent with no grain alignment in the central regions (Goodman et al. 1995, Padoan et al. 2001). Radiative torques due to anisotropic starlight play an important role in the process of grain alignment (Draine & Weingartner 1997). These torques would be ineffective in the central regions of quiescent dark clouds where external starlight is heavily attenuated. In star-forming clouds such as M17 or W51, however, starlight is provided within the clouds by recently-formed stars. 7 A PROVISIONAL GRAIN MODEL Although we have quite good observational determinations of the extinction in the near-infrared, optical, and UV regions, the extinction and scattering properties of interstellar grains at very short wavelengths and very long wavelengths are probably best obtained by calculating them using a physical grain model that has been constrained by a variety of observations, including observations of extinction and infrared emission. Mathis et al. (1977) discovered that the average interstellar extinction could be satisfactorily reproduced by a grain model containing two components – graphite grains and silicate grains. Remarkably, the extinction curve was reproduced very well if both grain components had power-law size distributions, dn/da ∝ a−3.5 , truncated at a minimum size a− ≈ 50˚ and a maximum size a+ ≈ 2500˚. The A A success of this grain model led Draine & Lee (1984) to refine the optical constants, and extend the treatment into the mid- and far-infrared. The graphite-silicate model was applied in the X-ray region by Laor & Draine (1993). At the time when the “graphite-silicate” model was developed, PAHs had not been recognized as a major interstellar grain material. With the recognition that the interstellar grain population appears to include a substantial population of ultrasmall grains with PAH composition, the “graphite-silicate” model has recently been extended in a very natural way: the carbonaceous grains are now assumed to be PAH molecules when very small, but to have physical and chemical properties that can be approximated by grains of bulk graphite when larger than > ∼ 0.01 µm (containing N ∼ 106 C atoms). The properties of the carbonaceous grains are taken to change smoothly from PAH-like to graphite-like as the grain size is increased. Models developed to account for the infrared emission spectrum of interstel- lar dust require that the PAH population contain ∼ 15% of the interstellar C abundance. These particles necessarily make a major contribution to the UV extinction. Weingartner & Draine (2001a) have found size distributions for the grains that, including the PAHs, are consistent with the extinction produced by the interstellar grain population, and with the size distribution of the PAHs ad- justed to reproduce the observed infrared emission from the diffuse ISM (Li & Draine 2001b). The grain size distribution adopted by Weingartner & Draine (2001a) for aver- age Milky Way dust (with RV = 3.1) is shown in Figure 8, but with abundances
  • 24. 24 Draine reduced by a factor 0.93 to reproduce AIC /NH from eq. (4). The carbonaceous grain distribution is trimodal: The peak at a ≈ 0.3 µm is required to reproduce the observed extinction curve; the peak at a ≈ .0005 µm is required to reproduce the 3 − 12 µm PAH emission features; and the peak at a ≈ 0.005 µm improves the fit to the observed emission near 60 µm. The peaks at ∼ 0.3 µm and ∼ .0005 µm are certainly real, but the peak at .005 µm could be an artifact of errors in the adopted grain optical and FIR cross sections. Figure 8: Size distributions for carbonaceous-silicate grain model of Weingartner & Draine (2001a) for Milky Way dust with RV = 3.1, but with abundances decreased by a factor 0.93 (see text). The dielectric functions of graphite and “astrosilicate” (including structure at X-ray absorption edges) have been reestimated by Draine (2003b). The extinction and scattering cross sections per H nucleon, calculated for the Weingartner & > Draine (2001a) grain model, are shown in Figs. 9 and 10. For λ ∼ 20 µm, the extinction calculated for this grain model can be approximated by τ /NH ≈ 5 × 10⁻²⁵ cm2 (λ/100 µm)−2 , as seen in Figure 10. The scattering varies as expected > for Rayleigh scattering for λ ∼ 4 µm: τsca /NH ≈ 1.0 × 10⁻²¹ cm2 (λ/ µm)−4 . This provisional dust model does not include a component to reproduce the observed 3.4 µm absorption feature (§3.4). If the graphite in the a ∼ 200˚ car- > A bonaceous grains is replaced with a mixture of graphite and aliphatic hydrocar- bons, it seems likely that the extinction curve, including the 3.4 µm feature, could be reproduced with only slight adjustments to the grain size distribution. The Weingartner & Draine (2001a) model has AV /∆τ9.7 = 14.2 (see Tables 4 – 6), 25% smaller than the observed value 18.5 for diffuse cloud dust (see Table 1). Evidently the silicate abundance or the silicate band strength should be reduced by ∼ 30%.
  • 25. Interstellar Dust Grains 25 Figure 9: Extinction and scattering calculated for Weingartner & Draine (2001a) model for RV = 3.1 Milky Way dust, but with abundances reduced by factor 0.93 (see text). 8 SCATTERING 8.1 Optical and UV Observations of light reflected from dust grains provides another test of dust grain models. Individual reflection nebulae are bright, but comparisons with models are uncertain because the scattering geometry is in general poorly-determined: the illuminating star could be in front of the dust cloud (in which case the typical scattering angle would be large) or it could be embedded within it (in which case forward scattering by the dust grains between us and the star would dominate). The “diffuse galactic light” (DGL) consists of starlight scattered off the dust in the diffuse ISM, illuminated by the general interstellar starlight radiation field. Since we think we have independent knowledge of the spatial distribution of both stars and dust, studies of dust properties using the DGL do not suffer from geometric ambiguity. However, the DGL is faint (and must be distinguished from the direct light from faint stars), and attempts to infer the grain albedo and scattering asymmetry factor g ≡ cos θ often find that there can be a one- parameter family of (albedo,g) values which are consistent with the observations. Figs. 11 and 12 show various observational estimates of albedo and g as a function of wavelength for interstellar dust, based on observations of the DGL. Determinations of grain scattering properties in the reflection nebulae NGC 7023 (Witt et al. 1992), IC435 (Calzetti et al. 1995), NGC 2023 (Burgh et al. 2002), and the Pleiades (Gibson & Nordsieck 2003) are also shown. 1. There does appear to be evidence for a decrease in albedo from the optical to the vacuum UV, although the results for NGC 7023 and IC435 at λ−1 > 5 µm−1 do not conform.
  • 26. 26 Draine Figure 10: Extinction and scattering calculated for Weingartner & Draine (2001a) model for RV = 3.1 Milky Way dust, but with abundances reduced by factor 0.93 (see text). The dashed lines show the asymptotic behavior of the absorption (∝ λ−2 ) and scattering (∝ λ−4 ) cross sections. 2. The data are consistent with (but do not require) a rise in the scattering asymmetry factor g from optical to UV. 3. The data in Figs. 11 and 12 appear to be consistent with the albedo and g calculated for the carbonaceous-silicate grain model. The scatter in the results of different studies [e.g., the albedo and g near λ ≈ 1600˚ (λ−1 ≈ 6.25 µm−1 ) in Figs. 11 and 12] serves as a warning that determining A the albedo is model-dependent, requires accurate photometry, and, in the case of photodissociation regions like NGC 7023, NGC 2023, or IC 435, may require subtraction of fluorescent emission from H2 . 8.2 X-Ray Scattering Interstellar grains scatter X-rays through small scattering angles, and as a result X-ray point sources can appear to be surrounded by a diffuse “halo” of X-rays scattered by dust grains between us and the source (Overbeck 1965, Hayakawa 1970, Martin 1970). Measurements of such halos provide a quantitative test of interstellar grain models (Catura 1983, Mauche & Gorenstein 1986, Mitsuda et al. 1990, Mathis & Lee 1991, Clark et al. 1994, Woo et al. 1994, Mathis et al. 1995, Predehl & Klose 1996, Smith & Dwek 1998, Witt et al. 2001, Smith et al. 2002). ROSAT observations of Nova Cygni 1992 provide the best observational data at this time. Mathis et al. (1995) concluded that the observed halo on day 291 (after optical maximum) was best explained if the larger (a ≥ 0.1 µm) interstellar grains had a “fluffy” morphology, with a void fraction ≥ 25% – if the grains were
  • 27. Interstellar Dust Grains 27 Figure 11: Solid lines: scattering albedo calculated for Weingartner & Draine (2001a) model for Milky Way dust with RV = 3.1, 4.0, and 5.5. Symbols: observational determinations. After Draine (2003b). compact the scattering halo would be stronger than observed. Smith & Dwek (1998) argued that Mathis et al. (1995) had overestimated the scattering due to their use of the Rayleigh-Gans approximation, and that in fact the observed X-ray halo was consistent with compact grains. The same data was reconsidered by Witt et al. (2001), who concluded that the observed halo intensity at small scattering angles required a substantial population of large (a ≥ 1 µm) grains. Draine & Tan (2003) have revisited this question. Using data for 9 epochs, they find that the Weingartner & Draine (2001a) PAH/graphite/silicate grain model – with no adjustment to the size distribution – is consistent with the observed X-ray halo, for 50′′ –3000′′ halo angles. Observations with ROSAT and Chandra of other sources at energies between 0.7 and 4 keV also appear to be in general agreement with the scattering expected for this grain model (Draine 2003b).
  • 28. 28 Draine Figure 12: Solid lines: Scattering asymmetry factor g = cos θ calculated for Weingartner & Draine (2001a) model for Milky Way dust with RV = 3.1, 4.0, and 5.5. Symbols: observational determinations. After Draine (2003b). 9 INFRARED EMISSION Heating of interstellar dust grains is primarily by absorption of starlight (colli- sional heating dominates only in dense regions in dark clouds – where the starlight intensity has been severely attenuated – or in dense, hot, shocked gas). Since the heating by starlight photons is quantized and stochastic, the temperature of a dust grain is time-dependent. Figure 13 shows the temperature histories of 4 dust grains, heated by the average starlight background, and cooled by emis- sion of infrared photons, over a time span of about 1 day. It is apparent that for grains heated by the average starlight background, grains with radii a ∼ 200˚ > A can be approximated as having a steady temperature. Grains with radii a ∼ 50˚, < A however, undergo very large temperature excursions, and the notion of “average temperature” is not applicable. Most of the infrared power radiated by such small grains occurs during brief intervals following photon arrivals, when the grain temperature is close to the peak. In order to calculate the time-averaged emission spectrum for such small grains,
  • 29. Interstellar Dust Grains 29 Table 4: Absorption and Scattering for 5 µm > λ > 0.1 µm a b c d CCM89 F99 model f λ bande Aλ /AIC Aλ /AIC Aλ /AIC albedo cos θ Cext κabs 2 µm cm /H cm2 /g 4.750 M .0619 .0456 0.164 -.041 1.29×10⁻²³ 5.76×10² 3.800 L′ .0866 .0700 0.245 -.013 1.97×10⁻²³ 7.97×10² 3.450 L .0931 0.103 .0845 0.282 .006 2.38×10⁻²³ 9.16×10² 2.190 K 0.190 0.212 0.197 0.439 0.131 5.56×10⁻²³ 1.67×10³ 1.630 H 0.304 0.321 0.324 0.520 0.209 9.15×10⁻²³ 2.35×10³ 1.220 J 0.485 0.489 0.514 0.585 0.289 1.45×10⁻²² 3.22×10³ 1.000 0.682 0.668 0.707 0.623 0.363 1.99×10⁻²² 4.02×10³ 0.9000 0.792 0.819 0.836 0.642 0.401 2.36×10⁻²² 4.53×10³ 0.8930 z 0.803 0.830 0.847 0.643 0.404 2.39×10⁻²² 4.57×10³ 0.8655 IJ 0.855 0.879 0.889 0.647 0.414 2.51×10⁻²² 4.73×10³ 0.8020 IC 1.000 1.000 1.000 0.658 0.438 2.82×10⁻²² 5.17×10³ 0.7480 i 1.134 1.125 1.111 0.665 0.459 3.13×10⁻²² 5.62×10³ 0.7000 1.246 1.255 1.226 0.671 0.479 3.46×10⁻²² 6.09×10³ 0.6492 RC 1.365 1.419 1.368 0.674 0.500 3.86×10⁻²² 6.72×10³ 0.6415 RJ 1.381 1.442 1.391 0.675 0.503 3.92×10⁻²² 6.83×10³ 0.6165 r 1.443 1.531 1.472 0.676 0.513 4.15×10⁻²² 7.21×10³ 0.5470 V 1.665 1.805 1.735 0.674 0.538 4.89×10⁻²² 8.55×10³ 0.4685 g 2.045 2.238 2.114 0.661 0.560 5.96×10⁻²² 1.08×10⁴ 0.4405 B 2.187 2.396 2.273 0.653 0.565 6.41×10⁻²² 1.19×10⁴ 0.3635 U 2.550 2.813 2.847 0.616 0.569 8.03×10⁻²² 1.65×10⁴ 0.3550 u 2.612 2.866 2.847 0.616 0.569 8.03×10⁻²² 1.65×10⁴ 0.3000 3.005 3.306 3.328 0.582 0.556 9.38×10⁻²² 2.10×10⁴ 0.2500 3.826 4.163 4.150 0.530 0.542 1.17×10⁻²¹ 2.95×10⁴ 0.2300 4.729 5.115 5.052 0.459 0.545 1.42×10⁻²¹ 4.12×10⁴ 0.2200 5.209 5.584 5.478 0.428 0.551 1.54×10⁻²¹ 4.73×10⁴ 0.2175 5.264 5.626 5.515 0.424 0.554 1.56×10⁻²¹ 4.79×10⁴ 0.2150 5.277 5.624 5.507 0.423 0.557 1.55×10⁻²¹ 4.80×10⁴ 0.2100 5.173 5.503 5.381 0.428 0.563 1.52×10⁻²¹ 4.64×10⁴ 0.2000 4.698 5.052 4.926 0.452 0.576 1.39×10⁻²¹ 4.07×10⁴ 0.1900 4.322 4.705 4.542 0.466 0.594 1.28×10⁻²¹ 3.66×10⁴ 0.1800 4.164 4.546 4.340 0.457 0.614 1.22×10⁻²¹ 3.56×10⁴ 0.1600 4.232 4.585 4.346 0.403 0.653 1.23×10⁻²¹ 3.92×10⁴ 0.1400 4.692 5.057 4.838 0.360 0.678 1.36×10⁻²¹ 4.67×10⁴ 0.1200 5.928 6.234 5.787 0.321 0.675 1.63×10⁻²¹ 5.93×10⁴ 0.1000 7.492 0.273 0.649 2.11×10⁻²¹ 8.23×10⁴ a Tabulated data is available at http://www.astro.princeton.edu/∼draine/dust/dust.html b Cardelli et al. (1989) extinction fit for RV = 3.1 c Fitzpatrick (1999) extinction fit for RV = 3.1 d RV = 3.1 Milky Way dust model of Weingartner & Draine (2001a) but with abundances reduced by 0.93, and using optical constants from Draine (2003b) e λeff for JHKLL′ M from Bessell & Brett (1988); RJ IJ from Johnson (1965); Cousins U BV RC IC from Fukugita et al. (1996); SDSS ugriz from Gunn (2002, private communica- tion). f Aλ = (2.5/ ln 10)Cext (λ)NH = 1.086Cext (λ)NH g κabs (λ) = absorption cross section per unit dust mass. For this model, MH /Mdust = 90. one must calculate the energy distribution function dP/dE, for grains of a par- ticular size, where dP is the probability that a grain will have vibrational energy in interval (E, E + dE). To solve for dP/dE, one must first calculate the specific heat for the grain, and the cross sections for absorption and emission of photons. Monte-Carlo simulations can be used to obtain dP/dE, but it is more efficient
  • 30. 30 Draine Table 5: Absorption and Scatteringa for λ > 5 µm a a λ Aλ /AIC albedo cos(θ) Cext κabs 2 2 µm model cm /H cm /g 1000. .00002 .00000 -.004 5.48×10⁻²⁷ 2.94×10⁻¹ 850.0 .00003 .00000 -.005 7.15×10⁻²⁷ 3.83×10⁻¹ 350.0 .00013 .00000 -.005 3.58×10⁻²⁶ 1.92×100 200.0 .00042 .00001 -.004 1.19×10⁻²⁵ 6.37×100 140.0 .00092 .00001 .000 2.59×10⁻²⁵ 1.39×101 100.0 .00180 .00003 .007 5.07×10⁻²⁵ 2.71×101 60.00 .0058 .00007 .000 1.62×10⁻²⁴ 8.70×101 40.00 .0156 .00014 -.016 4.40×10⁻²⁴ 2.36×10² 25.00 .0317 .00031 -.025 8.95×10⁻²⁴ 4.79×10² 18.00 .0514 .00066 -.026 1.45×10⁻²³ 7.76×10² 14.00 .0327 .00283 -.029 9.22×10⁻²⁴ 4.92×10² 12.00 .0622 .00301 -.029 1.75×10⁻²³ 9.37×10² 9.700 0.140 .003 -.036 3.94×10⁻²³ 2.10×10³ 8.000 .0491 .017 -.050 1.38×10⁻²³ 7.29×10² 7.000 .0270 .055 -.053 7.60×10⁻²⁴ 3.85×10² 6.000 .0329 .088 -.052 9.27×10⁻²⁴ 4.53×10² a See Table 4 to solve for the steady-state dP/dE (Guhathakurta & Draine 1989, Draine & Li 2001). The notion of “temperature” is somewhat problematic for very small grains, but one can define the instantaneous vibrational temperature as being equal to the temperature T (E) at which the expectation value of the energy would be equal to the actual grain energy; this is the temperature plotted in Figure 13. Draine & Li (2001) have shown that a “thermal” estimate for the grain emissivity is a good approximation, even for grains containing as few as ∼ 30 atoms. The infrared and far-infrared glow from interstellar dust can be measured, and a dust model must be able to reproduce the observed intensity and spectrum. > The diffuse ISM at galactic latitudes |b| ∼ 20◦ provides a particularly clean test, because we have good estimates for the intensity of the starlight heating the dust, and the observed 21 cm emission provides accurate gas column densities which, for an assumed dust-to-gas ratio, determine the column density of dust. Although the surface brightness of the infrared emission is low, it has been detected by IRAS and COBE after averaging over large areas of sky. Figure 14 shows the observed emissivity per H nucleon, based on COBE-FIRAS and COBE-DIRBE photome- try. 3.0-4.5 µm and 4.5-11.3 µm spectra, measured at b ≈ 0 by the IRTS satellite have been added to the plot, normalized to agree with the DIRBE photometry in the 3.5, 5.0, and 12 µm bands. In this dust model, approximately 20% of the absorbed starlight energy is reradiated at λ < 12 µm by PAHs. The same grain model, applied to reflection nebulae, can acount for the observed dependence of dust emission spectrum on temperature of illuminating star (Li & Draine 2002b). With appropriate changes to the grain mixture, the model can also account for the observed IR emission from the SMC (Li & Draine 2002c). > Approximately two thirds of the radiated power is at λ ∼ 50 µm – this is emis- sion from a ∼ > .01 µm grains that are maintained at a nearly steady temperature ∼ 15 − 20 K by starlight. The remaining ∼ one third of the radiated power is from grains with radii a ∼ 50˚ that are cooling following “temperature spikes” < A
  • 31. Interstellar Dust Grains 31 Table 6: Absorption and Scatteringa for λ < 0.1 µm a a λ hν Aλ /AIC albedo cos(θ) Cext κabs 2 2 µm eV model cm /H cm /g .09120 13.6 8.256 0.248 0.658 2.33×10⁻²¹ 9.37×10⁴ .04881 25.4 5.574 0.291 0.813 1.57×10⁻²¹ 5.97×10⁴ .02339 53.0 3.355 0.366 0.953 9.46×10⁻²² 3.21×10⁴ .02279 54.4 3.577 0.369 0.949 1.01×10⁻²¹ 3.41×10⁴ .02214 56.0 3.469 0.393 0.950 9.78×10⁻²² 3.18×10⁴ .01240 100 2.564 0.452 0.988 7.23×10⁻²² 2.12×10⁴ .01170 106 2.908 0.432 0.985 8.20×10⁻²² 2.49×10⁴ .006199 200 2.000 0.578 0.997 5.64×10⁻²² 1.27×10⁴ .004397 282 1.426 0.619 0.999 4.02×10⁻²² 8.20×10³ .004350 285 2.355 0.452 0.998 6.64×10⁻²² 1.95×10⁴ .004133 300 1.812 0.517 0.999 5.11×10⁻²² 1.32×10⁴ .002480 500 0.971 0.632 1.000 2.74×10⁻²² 5.40×10³ .002317 535 0.691 0.386 1.000 1.95×10⁻²² 6.40×10³ .002305 538 1.325 0.355 1.000 3.74×10⁻²² 1.29×10⁴ .002296 540 1.138 0.453 1.000 3.21×10⁻²² 9.40×10³ .002254 550 1.056 0.478 1.000 2.98×10⁻²² 8.32×10³ .001759 705 0.575 0.433 1.000 1.62×10⁻²² 4.92×10³ .001751 708 1.219 0.353 1.000 3.44×10⁻²² 1.19×10⁴ .001734 715 0.799 0.515 1.000 2.25×10⁻²² 5.84×10³ .001720 721 0.941 0.432 1.000 2.65×10⁻²² 8.07×10³ .001710 725 0.845 0.503 1.000 2.38×10⁻²² 6.33×10³ .001550 800 0.751 0.514 1.000 2.12×10⁻²² 5.51×10³ .001240 1000 0.563 0.564 1.000 1.59×10⁻²² 3.71×10³ .000620 2000 0.181 0.584 1.000 5.10×10⁻²³ 1.14×10³ a see Table 4 resulting from absorption of individual starlight photons. We can immediately see the following: (A) The grain population must contain enough a ∼ 50˚ grains < A to account for ∼ one third of the absorption of starlight. (B) The resemblance of the 3–12 µm emission spectrum from the diffuse ISM to the emission spectrum expected from polycyclic aromatic hydrocarbon (PAH) molecules, radicals, and ions implies that a large fraction of the smallest grains must be PAHs. Figure 15 shows the emission calculated for the PAH/carbon/silicate dust model illumi- nated by the average interstellar radiation field spectrum. The far-infrared emission is a good tracer of interstellar dust. The IRAS and DIRBE all-sky maps can be used to infer the dust column density (Schlegel et al. 1998). 10 MICROWAVE EMISSION 10.1 Spinning Grains Theoretical models to account for the observed infrared emission require large numbers of extremely small dust grains that, following absorption of starlight photons, radiate in their optically-active vibrational modes. In addition to vi- brating, these grains will rotate, with rotation rates reaching tens of GHz. If they have electric dipole moments, there will be rotational emission from these grains at microwave frequencies. Various workers have considered microwave emission from spinning grains (Erickson 1957, Hoyle & Wickramasinghe 1970, Ferrara &
  • 32. 32 Draine Figure 13: A day in the life of 4 carbonaceous grains, heated by the local interstellar radiation field. τabs is the mean time between photon absorptions (Draine & Li 2001). Dettmar 1994). The rotational emission from this grain population has been es- timated by Draine & Lazarian (1998a,b), who showed that it could account for dust-correlated microwave emission that was discovered by Kogut et al. (1996a,b) in studies of the angular structure of the cosmic microwave background. The theoretical estimate for the rotational emission, plus the low-frequency tail of the vibrational emission, is shown in Figure 16. Figure 16 also shows results from a number of observational studies – some over large areas of the sky, others over smaller regions. Finkbeiner et al. (2002) detect dust-correlated microwave emission in pointed observations of a dark cloud (L1622) and toward LPH 201.663+1.643, a diffuse HII region behind heavy obscuration. Most re- cently, Finkbeiner et al. (2003a) use 8 and 14 GHz surveys to map the anomalous microwave emission from the Galactic plane. With the exception of the observations toward LPH 201.663+1.643, the ob- served microwave emission appears to be generally consistent with the theoretical prediction for emission from spinning dust grains. The observed microwave emission from LPH 201.663+1.643 is, however, an order of magnitude stronger than would be expected from the observed column of dust. While the rotational emission from spinning dust grains does depend on environment Draine & Lazarian (1998b), it does not appear possible to ex- plain the strong emission observed in this direction using reasonable variations in environmental conditions. 10.2 Magnetic Grains? Although rotational emission from spinning grains is a natural prediction for a dust model with large numbers of small grains, other emission mechanisms are
  • 33. Interstellar Dust Grains 33 Figure 14: Observed emission from diffuse interstellar dust. Crosses: IRAS (Boulanger & Perault 1988); Squares: COBE-FIRAS (Finkbeiner et al. 1999); Diamonds: COBE-DIRBE (Arendt et al. 1998); Heavy Curve: IRTS (Onaka et al. 1996, Tanaka et al. 1996). The total power ∼ 5.1 × 10⁻²⁴ erg s−1 /H is estimated from the interpolated broken line. also possible, including thermal magnetic dipole radiation from magnetic grains (Draine & Lazarian 1999). We know that Fe contributes a significant fraction of the interstellar dust mass; if some of this Fe is in ferrimagnetic or ferromagnetic compounds, grains containing these compounds would emit magnetic dipole ra- diation. The idea is that the magnetization of the magnetic domains in the grain would fluctuate around the minimum-energy state; these fluctuations would be at GHz frequencies, and the fluctuating magnetization would generate electro- magnetic radiation. If an appreciable fraction of the Fe in interstellar grains were in magnetite Fe3 O4 , it is estimated that the resulting thermal magnetic dipole emission would be comparable to the observed microwave emission. The power radiated per grain is simply proportional to the mass of magnetic material in that grain, and proportional to the grain temperature. Since it is presumed that most of the magnetic material would be in large grains, it would be expected that the large grains would account for the bulk of the magnetic dipole emission. It is therefore possible that the observed microwave emission may contain ap- preciable contributions from both (ultrasmall) spinning grains and (large) mag- netic grains. 11 ABUNDANCE ISSUES Dust population models that are constructed to reproduce the observed wavelength- dependent extinction are found to imply substantial abundances of elements in grain material – approaching or exceeding the abundances believed to be appro- priate to interstellar matter. Kim & Martin (1996) referred to the “C/H crisis”,