SlideShare uma empresa Scribd logo
1 de 7
Baixar para ler offline
2 8 s e p t e m b e r 2 0 1 7 | V O L 5 4 9 | N A T U RE | 5 0 7
Letter doi:10.1038/nature23645
Earth’s volatile contents established by melting and
vaporization
C. Ashley Norris1
& Bernard J. Wood1
The silicate Earth is strongly depleted in moderately volatile
elements (such as lead, zinc, indium and alkali elements) relative
to CI chondrites, the meteorites that compositionally most closely
resemble the Sun1
. This depletion may be explained qualitatively
by accretion of 10 to 20 per cent of a volatile-rich body to a reduced
volatile-free proto-Earth2,3
, followed by partial extraction of some
elements to the core1
. However, there are several unanswered
questions regarding the sources of Earth’s volatiles4,5
, notably the
overabundance of indium in the silicate Earth. Here we examine
the melting processes that occurred during accretion on Earth
and precursor bodies and report vaporization experiments under
conditions of fixed temperature and oxygen fugacity. We find that
the pattern of volatile element depletion in the silicate Earth is
consistent with partial melting and vaporization rather than with
simple accretion of a volatile-rich chondrite-like body. We argue that
melting and vaporization on precursor bodies and possibly during
the giant Moon-forming impact6–8
were responsible for establishing
the observed abundances of moderately volatile elements in Earth.
Earth accreted from asteroidal and protoplanetary bodies over
a timescale of 30–100 Myr (ref. 9). On the basis of observations of
­igneous, metallic and achondritic meteorites, it is assumed that many
of these asteroidal components formed within a few million years of
the origin of the Solar System and underwent an early phase of melting
and vaporization, with heat sources such as the decay of 26
Al (ref. 9). For
example, volatile-poor Vesta seems to have formed within 4 Myr of the
origin of the Solar System and to have undergone melting, volatile loss10
and volcanism for a further 35 Myr (ref. 11). During Earth’s protracted
accretion, unmelted and previously melted, variably volatile-depleted
bodies were added in impacts that became progressively more violent,
terminating with the giant impact (or impacts) that led to the forma-
tion of the Moon6,12
. Modelling of the accretion process and applying
constraints on the basis of the partitioning of siderophile elements
between core and silicate mantle leads to the conclusion that Earth
was periodically covered by a ‘magma ocean’ of molten silicate13–15
.
Models of the giant impact also suggest that it led to wholesale melting
of the silicate Earth, extremely high surface temperatures with partial
vaporization of the silicate melt12,16
, and the generation of a proto-lunar
disk of melt and vapour. Some volatile loss can take place from this
proto-lunar disk by hydrodynamic escape17
. Atmospheric loss from
Earth during the magma-ocean phase18
and loss of moderately volatile
Zn (refs 8, 19) and K (ref. 7) from the Moon are confirmed by recent
isotopic measurements.
As anticipated from the previous discussion, the silicate Earth is
strongly depleted in moderately volatile elements such as Pb, Tl, Zn,
Sb, Bi and Ag relative to the solar composition as represented by CI
chondrites. Figure 1 illustrates these depletions in a graph of ­element
concentration in the silicate Earth1
, normalized to abundance in CI
chondrites, plotted against a measure of element volatility. This ­measure
is assumed, following general practice, to correlate with the temperature
at which 50% of the element would be condensed from a gas of solar
composition20
. For comparison, we show the depletion pattern of CV
carbonaceous chondrites21
, meteorites that are also ­volatile-depleted
relative to CI chondrites and that have never undergone planetary
­processes of melting and core formation.
From Fig. 1 it can be seen that, although there is a general trend
of declining relative abundance both in the silicate Earth and in CV
chondrites with increasing volatility (decreasing condensation temper-
ature), there are many elements that, in the silicate Earth, fall below the
trend. Such cases are frequently ascribed to extraction into the core, the
elements being dissolved either in segregating Fe-rich metal22
during
accretion or in a putative sulfide ‘Hadean matte’ in the final stages of
core formation2
. Therefore, for example, elements such as Au, Cu, Ag
and S are known to partition strongly into both molten Fe metal22
and
liquid FeS at elevated temperature, whereas the more abundant Na, K,
B and F show negligible tendencies to follow Fe and FeS into the core.
Core formation has clearly reduced the concentrations of relatively
non-volatile elements such as Fe, Ni, Mo and W in the silicate Earth23
,
so it is reasonable to apply the same principle to the volatile elements
shown in Fig. 1. However, this approach to understanding the chemical
composition of the silicate Earth implicitly relies on the assumption that
the moderately volatile elements were added to Earth during accretion
by a body with a mass of 10%–20% that of Earth that had CI-chondrite-
like ratios of these elements. Late arrival of such a body seems to be the
most reasonable explanation of the Pd/Ag and 107
Ag/109
Ag ratios of
the silicate Earth3
. This body has also been suggested to have been the
Moon-forming impactor2
. Further depletions as shown for Au, Ag and
1
Department of Earth Sciences, University of Oxford, South Parks Road, Oxford OX1 3AN, UK.
50% condensation temperature (K)
500
Normalizedconcentration
100
10–1
10–2
10–3 CV chondrites
B
F
Na
S
Cl
K
As
Se
Br
Rb
Te
I
Cs
AuIncreasing
partitioning
into the core?
Ag
Bi
Cd
Cr
Cu
Ga
Ge
In
Pb
Sb
Sn
Tl
Zn
1,1001,000900800700600
Figure 1 | Concentrations in the bulk silicate Earth of moderately
volatile elements. Concentrations are plotted against the temperature at
which 50% of the element would be condensed at a pressure of 10−4
bar
from a gas of Solar System composition16
, and are expressed relative to
concentrations in CI chondrite meteorites1
(normalized to a concentration
ratio of Mg of 1.0). Elements studied here are shown as filled coloured
symbols (see legend). Open squares refer to elements not specifically
addressed by our study. Open circles refer to all elements in CV chondrites.
Error bars, 1 s.d. The arrow labelled ‘increasing partitioning into the core’
refers to one possible way of explaining high depletions of elements such as
S, Se, Tl, Bi and Ag.
© 2017 Macmillan Publishers Limited, part of Springer Nature. All rights reserved.
5 0 8 | N A T U RE | V O L 5 4 9 | 2 8 s e p t e m b e r 2 0 1 7
LetterRESEARCH
other elements are then ascribed to the aforementioned core-forming
processes1
. However, despite the flexibility of the approach in terms
of the conditions (pressure, temperature and metal composition) of
core formation, which can be varied to match the depletion pattern,
the abundances of numerous elements remain difficult to explain.
In, for example, has a much lower condensation temperature than
Zn and is more siderophile and more chalcophile than Zn22
, yet is
­relatively more abundant in the silicate Earth1
. In is also much more
abundant in the silicate Earth than Tl, despite having a similar con-
densation ­temperature (Fig. 1) and being more siderophile and more
­chalcophile22
. Cs is strongly depleted despite not partitioning into either
metal or sulfide24
. The same applies to the halogens. Cu and Ag have
virtually identical partitioning into sulfide and metal22
and very similar
condensation temperatures, yet Cu is substantially more abundant than
Ag. Therefore, the pattern of abundance shown in Fig. 1 cannot be
explained solely by the addition of volatiles in a CI-chondrite-like body
followed by partial core formation. Of the other processes involved in
the formation and differentiation of Earth, melting on precursor bodies
and on the protoplanet must have led to partial vaporization of the most
volatile elements, and it is this process that we consider here.
To measure the loss of volatile elements to the vapour phase directly,
we constructed a 1-atm gas mixing furnace with stirring apparatus (see
Methods and Extended Data Tables 1 and 2). The device is capable of
stirring a 4.5-cm3
crucible of silicate melt at temperatures of up to
1,700 °C in an entirely gas-tight assembly. Flowing CO/CO2 mixtures
were used to control oxygen fugacity (fO2
). The crucible and stirrer
mechanism are made of high-purity nickel and products were drop-
quenched into a water bath at the end of the experiment. The silicate
starting material was a natural basalt from the Reykjanes Ridge, Iceland,
which was crushed, ground and mixed with a trace element mixture of
oxide powders to yield concentrations of 300–500 μ​g g−1
per element.
Volatile-loss experiments were performed at 1,300 °C and a range of
flog( )O2
values from −​7 to −​13. This fO2
range represents values from
just less than that of the Ni–NiO buffer, down to 2.3 logarithmic units
below that of the Fe–FeO buffer. The former (upper) value is charac-
teristic of the modern mantle25
; the latter (lower) value corresponds to
the case of molten peridotitic mantle in equilibrium with Fe and hence
simulates conditions during core formation.
All products presented as a mass of homogeneous black glass
­containing no observable gas bubbles.
Major element compositions of the products were determined using
a scanning electron microscope (SEM) with an energy-­dispersive
detector (Extended Data Table 1). Trace element concentrations
were measured using laser-ablation inductively coupled plasma mass
­spectrometry (LA-ICP-MS; Methods and Extended Data Table 2).
Samples were inspected for homogeneity using an SEM with back-­
scattered electron (BSE) imaging, X-ray mapping, and repeated spot
analysis using an energy-dispersive spectrometer (EDS). In all cases,
the major element composition of the samples appeared to be homoge-
neous to the precision of these techniques (approximately 2% ­relative
standard deviation, r.s.d.). Repeated trace element analysis using
LA-ICP-MS showed that most elements were homogeneous to ­better
than the single-spot precision, approximately 5%–10% r.s.d. In the high
concentration range of 400–500 μ​g g−1
, the intra-spot variation was
less than 5% r.s.d. for Ag, Ga, In, Mo, Pb, Sn, W and Zn; that of Bi, Cd,
Cu, Ge, Sb and Tl was in the range 10%–15% r.s.d. Unsurprisingly,
the most depleted samples at an abundance of 1–10 μ​g g−1
had larger
intra-spot variation and greater uncertainty for each point. The most
variable elements were Bi, Ge and Sb (25% r.s.d.), then Ag, Cd, Sn and
Zn (10%–15% r.s.d.), with the rest exhibiting less than 10% r.s.d.
Over the duration of the experiment, volatile elements partitioned
into the gas phase and were flushed from the furnace by the constant
stream of CO/CO2 gas. For these volatile-loss experiments, the surface
of the melt was continuously replenished by the stirring mechanism
and diffusion of the element in the melt can be neglected as a kinetic
factor.
In Fig. 2 we show a time series of experiments performed at
fO2
 =​ 10−7
 atm (0.3 logarithmic units below the Ni–NiO buffer). As can
be seen, loss is continuous with time and, under these conditions and
in contrast to condensation (Fig. 1), In is less volatile than Cu and Ag.
Time (min)
0
Normalizedconcentration
0.0
0.2
0.4
0.6
0.8
1.0
1.2
Ag
Cd
Cu
In
Zn
18016014012010080604020
Figure 2 | Concentrations of selected elements in product silicate
glasses. Concentrations are normalized to starting concentrations, for a
time series performed at 1,300 °C and an oxygen fugacity of 10−7
 atm. This
oxygen fugacity is about 0.3 logarithmic units below the Ni–NiO buffer.
The order of volatility is Cd >​ Ag >​ Cu >​ In >​ Zn, in marked contrast to
the anticipated relative volatilities from the condensation temperatures of
Fig. 1. Error bars, 1 s.d. The open circle indicates the starting point for all
elements; curves are arbitrary ‘by eye’ fits.
log(fO2
)
–14
100
10–1
10–2
10–3
Ag
Bi
Cd
Cr
Cu
Ga
Ge
In
Pb
Sb
Sn
Tl
Zn
Volatilityfactor
Fe–FeO Ni–NiO
–13 –12 –11 –10 –9 –8 –7 –6
Figure 3 | Volatility factors as a function of oxygen fugacity. These
experiments were performed at 1,300 °C. Volatility factors were calculated
from the ratios of initial to final concentrations of the elements after
60-min reaction in the constantly stirred melt. Indicative error bars (left)
of ±​10% and ±​20% are greater than 1 s.d. for virtually all elements and
conditions (see text).
© 2017 Macmillan Publishers Limited, part of Springer Nature. All rights reserved.
2 8 s e p t e m b e r 2 0 1 7 | V O L 5 4 9 | N A T U RE | 5 0 9
Letter RESEARCH
To compare volatile loss from the silicate melt for each element, we
define a ‘volatility factor’ FM of trace element M to be the final concen-
tration of the trace element divided by the initial concentration in the
starting mixture. Low values correspond to high volatility. To determine
the relative volatilities of the elements and their dependence on oxygen
fugacity, it was necessary to fix the time during the ­experiment at which
volatility factors were compared. This time must be one at which most
elements exhibit some volatility and at which the order of the elements
when ranked by volatility is unchanging with time. It must not be so
long that some of the elements of interest are no longer detectable by
our analytical method. From Fig. 2 it is clear that the correct volatility
order is established in 10–30 min and that some elements are almost
completely lost after 3 h, even at the relatively oxidizing flog( )O2
value
of −​7. Given these constraints, we opted to compare volatility factors
after 60 min. This was simply a convenient time and was not chosen
with any particular hypothesis in mind. All of the volatility factors
shown in Fig. 3 therefore refer to experiments of 60-min duration.
The volatility factors of trace elements are plotted against oxygen
fugacity in Fig. 3. There is a clear increase in volatility with decreasing
oxygen fugacity, indicating that the gas species are more reduced than
the oxide species in the melt.
In young solar systems, the nebular H2-rich gas is believed to disperse
after about 3 Myr (ref. 26), meaning that, thereafter, the conditions of
melting induced by radioactive decay and impacts are set by the solid
silicate and metal components equilibrated within the planetary or
protoplanetary body. In the case of Earth, Mars and Vesta, the oxygen
fugacity imposed by core–mantle equilibrium would be in the range
1–3 logarithmic units below Fe–FeO equilibrium14,27
. This means that
at 1,300 °C oxygen fugacities of 10−11
–10−13
 atm would be ­appropriate
for estimating volatilities from molten or partially molten silicate
­bodies undergoing core formation. Under these conditions, as shown in
Fig. 3, In is less volatile than Cu, Zn, Pb and Ag, all of which have higher
condensation temperatures (Fig. 1). The principal reason for this result
is that solar gases have high concentrations of H2S and H2O, and In has
stable gaseous S and OH species (InS, In2S and InOH), which stabilize
it in the gas phase. These gas species are absent from our experiments.
Their presence in a solar gas nevertheless provides a clue to the origin
of the In ‘anomaly’. This anomaly is readily explained if the ­moderately
volatile element contents of the silicate Earth were established by
melt–vapour reactions during melting after the disappearance of the
nebular gas. Such reactions might reasonably have been established
on small precursor bodies for which gravitational escape would have
been ­possible or conceivably during the Moon-forming impact when
instabilities in the silicate vapour may have induced substantial loss of
the Earth–Moon atmosphere17
.
In Fig. 4 we plot the silicate Earth abundances of the elements that
we have studied against volatility factors under conditions of 1,300 °C
and flog( )O2
 =​ −​13 and −​11. As can be seen, the pattern of depletion
agrees closely with the volatility factors that we measured under
­conditions appropriate for core formation on precursor bodies and
Earth. In, Cu and Zn all have similar volatilities, consistent with their
similar relative abundances in the silicate Earth, whereas Sn is more
volatile and Cd, Ag and Ge much more volatile than Zn, also consistent
with their relative abundances. The plateau in abundance for low
­volatility factors in Fig. 4 are at abundances close to 1%. This value
implies that low concentrations have been augmented by a chondritic
component believed to have delivered 2% ±​ 1% of Earth’s C, H and
some noble gases28
and/or the ‘late veneer’, which delivered approxi-
mately 0.5% of Earth’s highly siderophile elements after core formation
ceased29
.
In conclusion, we have shown that the pattern of volatile element
abundance in the silicate Earth (Fig. 4) is much more consistent
with measured volatilities from silicate melt at low oxygen fugacities
than it is with volatilities (condensation temperatures) in a solar gas
(Fig. 1). The data strongly suggest that the pattern of volatile element
­depletion was established by melt–vapour reaction (evaporation and
re-­condensation) in the absence of the reducing nebular gas. We
­envisage these processes taking place on small molten precursor ­bodies
where gravitational escape of volatiles is likely, or possibly in the Earth–
Moon system after the giant impact.
Online Content Methods, along with any additional Extended Data display items
and Source Data, are available in the online version of the paper; references
unique to these sections appear only in the online paper.
received 8 February; accepted 4 July 2017.
1.	 Palme, H. & O’Neill, H. in Treatise on Geochemistry Vol. 3, Ch. 1, 1–39 (Elsevier,
2014).
2.	 O’Neill, H. S. The origin of the Moon and the early history of the Earth—a chemical
model. Part 2: the Earth. Geochim. Cosmochim. Acta 55, 1159–1172 (1991).
3.	 Schönbächler, M., Carlson, R. W., Horan, M. F., Mock, T. D. & Hauri, E. H.
Heterogeneous accretion and the moderately volatile element budget of Earth.
Science 328, 884–887 (2010).
4.	 Wang, Z. C., Laurenz, V., Petitgirard, S. & Becker, H. Earth’s moderately volatile
element composition may not be chondritic: evidence from In, Cd and Zn.
Earth Planet. Sci. Lett. 435, 136–146 (2016).
5.	 Witt-Eickschen, G., Palme, H., O’Neill, H. S. C. & Allen, C. M. The geochemistry of
the volatile trace elements As, Cd, Ga, In and Sn in the Earth’s mantle: new
evidence from in situ analyses of mantle xenoliths. Geochim. Cosmochim. Acta
73, 1755–1778 (2009).
6.	 Canup, R. M. & Asphaug, E. Origin of the Moon in a giant impact near the end
of the Earth’s formation. Nature 412, 708–712 (2001).
7.	 Wang, K. & Jacobsen, S. B. Potassium isotopic evidence for a high-energy giant
impact origin of the Moon. Nature 538, 487–490 (2016).
10–1
10–2 10–3 10–2 10–1 10010–1 100
10–2
Volatility factor Volatility factor
Ag
Bi
Cd
Cr
Cu
Ga
Ge
In
Pb
Sb
Sn
Tl
Zn
Ag
Tl
Late veneer
Increasing volatility
Normalizedconcentration
Figure 4 | Concentrations in the bulk silicate Earth plotted as a function
of measured volatility factors. These experiments were performed at
1,300 °C and at flog( )O2
 =​ −​11 (left) and flog( )O2
 =​ −​13 (right).
Concentrations are given relative to concentrations in CI chondrite
meteorites1
(normalized to a concentration ratio of Mg of 1.0). Vertical
error bars are as in Fig. 1. Horizontal error bars are 2 standard errors. The
line labelled ‘late veneer’ refers to the region in which the late addition of
approximately 0.5% of chondritic material could have increased the
concentrations of the most volatile elements.
© 2017 Macmillan Publishers Limited, part of Springer Nature. All rights reserved.
5 1 0 | N A T U RE | V O L 5 4 9 | 2 8 s e p t e m b e r 2 0 1 7
LetterRESEARCH
8.	 Paniello, R. C., Day, J. M. D. & Moynier, F. Zinc isotopic evidence for the origin of
the Moon. Nature 490, 376–379 (2012).
9.	 Kleine, T. et al. Hf-W chronology of the accretion and early evolution of asteroids
and terrestrial planets. Geochim. Cosmochim. Acta 73, 5150–5188 (200).
10.	 Moynier, F. et al. Planetary-scale strontium isotopic heterogeneity and the age of
volatile depletion of early Solar System materials. Astrophys. J. 758, 45 (2012).
11.	 Roszjar, J. et al. Prolonged magmatism on 4 Vesta inferred from Hf-W analyses
of eucrite zircon. Earth Planet. Sci. Lett. 452, 216–226 (2016).
12.	 C´uk, M., Hamilton, D. P., Lock, S. J. & Stewart, S. T. Tidal evolution of the Moon from
a high-obliquity, high-angular-momentum Earth. Nature 539, 402–406 (2016).
13.	 Li, J. & Agee, C. B. Geochemistry of mantle–core differentiation at high
pressure. Nature 381, 686–689 (1996).
14.	 Wade, J. & Wood, B. J. Core formation and the oxidation state of the Earth.
Earth Planet. Sci. Lett. 236, 78–95 (2005).
15.	 Rubie, D. C. et al. Accretion and differentiation of the terrestrial planets with
implications for the compositions of early-formed Solar System bodies and
accretion of water. Icarus 248, 89–108 (2015).
16.	 Canup, R. M. Simulations of a late lunar-forming impact. Icarus 168, 433–456
(2004).
17.	 Genda, H. & Abe, Y. Modification of a proto-lunar disk by hydrodynamic escape
of silicate vapor. Earth Planets Space 55, 53–57 (2003).
18.	 Tucker, J. M. & Mukhopadhyay, S. Evidence for multiple magma ocean
outgassing and atmospheric loss episodes from mantle noble gases. Earth
Planet. Sci. Lett. 393, 254–265 (2014).
19.	 Kato, C., Moynier, F., Valdes, M. C., Dhaliwal, J. K. & Day, J. M. D. Extensive
volatile loss during formation and differentiation of the Moon. Nat. Commun. 6,
7617 (2015).
20.	 Lodders, K. Solar System abundances and condensation temperatures of the
elements. Astrophys. J. 591, 1220–1247 (2003).
21.	 Wasson, J. T. & Kallemeyn, G. W. Compositions of chondrites. Phil. Trans. R. Soc.
Lond. A 325, 535–544 (1988).
22.	 Wood, B. J., Kiseeva, E. S. & Mirolo, F. J. Accretion and core formation: the
effects of sulfur on metal–silicate partition coefficients. Geochim. Cosmochim.
Acta 145, 248–267 (2014).
23.	 McDonough, W. F. & Sun, S.-s. The composition of the Earth. Chem. Geol. 120,
223–253 (1995).
Acknowledgements This research was supported by grants from the European
Research Council (267764) and the Science and Technology Facilities Council
(UK) to B.J.W. and a Studentship to C.A.N. from the STFC. We thank D. Dingwell
and his group in Munich for advice on furnace design and G. Fitton (Edinburgh)
for donating the basalt.
Author Contributions C.A.N. constructed the furnace, performed the
experiments and analyses, and contributed to writing the manuscript. B.J.W.
conceived the project, provided guidance and wrote a substantial part of the
manuscript.
Author Information Reprints and permissions information is available at
www.nature.com/reprints. The authors declare no competing financial interests.
Readers are welcome to comment on the online version of the paper. Publisher’s
note: Springer Nature remains neutral with regard to jurisdictional claims in
published maps and institutional affiliations. Correspondence and requests for
materials should be addressed to B.J.W. (bernie.wood@earth.ox.ac.uk).
Reviewer Information Nature thanks S. Jacobsen, F. Moynier and E. Young for
their contribution to the peer review of this work.
24.	 Mills, N. M., Agee, C. B. & Draper, D. S. Metal–silicate partitioning of cesium:
implications for core formation. Geochim. Cosmochim. Acta 71, 4066–4081
(2007).
25.	 Wood, B. J., Bryndzia, L. T. & Johnson, K. E. Mantle oxidation state and its
relationship to tectonic environment and fluid speciation. Science 248,
337–345 (1990).
26.	 Evans, N. J. II et al. The Spitzer c2d legacy results: star-formation rates and
efficiencies; evolution and lifetimes. Astrophys. J. Suppl. Ser. 181, 321–350
(2009).
27.	 Righter, K. & Drake, M. J. Core formation in Earth’s Moon, Mars, and Vesta.
Icarus 124, 513–529 (1996).
28.	 Marty, B. The origins and concentrations of water, carbon, nitrogen and noble
gases on Earth. Earth Planet. Sci. Lett. 313–314, 56–66 (2012).
29.	 Wang, Z. C. & Becker, H. Ratios of S, Se and Te in the silicate Earth require a
volatile-rich late veneer. Nature 499, 328–331 (2013).
© 2017 Macmillan Publishers Limited, part of Springer Nature. All rights reserved.
Letter RESEARCH
30.	 Dingwell, D. B., O’Neill, H. S. C., Ertel, W. & Spettel, B. The solubility and
oxidation state of nickel in silicate melt at low oxygen fugacities: results using a
mechanically assisted equilibration technique. Geochim. Cosmochim. Acta 58,
1967–1974 (1994).
31.	 Deines, P., Nafziger, R. H., Ulmer, G. C. & Woermann, E. Temperature–oxygen
fugacity tables for selected gas mixtures in system C–H–O at one atmosphere
total pressure. Metall. Trans. B 7, 143 (1976).
32.	 Jochum, K. P. et al. MPI-DING glasses: new geological reference materials for
in situ Pb isotope analysis. Geochem. Geophys. Geosyst. 6, Q10008 (2005).
33.	 Jochum, K. P. et al. GeoReM: a new geochemical database for reference
materials and isotopic standards. Geostand. Geoanal. Res. 29, 333–338 (2005).
34.	 Griffin, W. L., Powell, W. J., Pearson, N. J. & O’Reilly, S. Y. GLITTER: data reduction
software for laser ablation ICP–MS. In Laser Ablation ICP–MS in the Earth
Sciences: Current Practices and Outstanding Issues (ed. Sylvestor, P.) 308–311
(Mineralogical Association of Canada, Short Course Series Vol. 40, 2008).
Methods
To directly measure the loss of volatile elements to the vapour phase, we ­constructed
a 1-atm gas mixing furnace with stirring apparatus. This device is capable of
stirring a 4.5-cm3
crucible of silicate melt at temperatures up to 1,700 °C. In situ
stirring mechanisms have previously30
been integrated into gas-mixing ­furnaces,
but our design features an entirely gas-tight assembly and a rapid quenching
mechanism. The furnace tube is made from high-purity alumina with heating
elements of molybdenum disilicide. The crucible and stirrer mechanism are made
of high-purity nickel. The purity of the nickel was verified by LA-ICP-MS (see
Methods section ‘Analysis’) to contain <​3 μ​g g−1
of the trace elements of interest,
except for Cu, which was slightly elevated at 30 μ​g g−1
but still well below the
concentration in the sample. Experiments were quenched in a water bath upon
conclusion.
The starting material was made from natural basalt dredged from Reykjanes
Ridge, Iceland, crushed in a Fritsch steel-jaw rock crusher before being ground to
a fine grey powder using a Tema agate disk mill. To ensure a sufficient supply of
material, approximately 500 g of material was crushed. A trace element mixture was
formulated to target final compositions of 300–500 μ​g g−1
per element, weighed out
from reagent-grade oxide powders. The trace element mixture was ground with
a quarter of the powdered basalt in an agate mortar. The remainder of the basalt
was added in three stages and ground together with the initial mixtures in a large
agate mortar. In total, 60 g of the starting material was prepared and stored in a
desiccator to maintain dryness.
To determine the trace element composition of the starting mixture, a portion
of sample was melted and quenched to a glass in a high-pressure piston cylinder
experiment. This experiment was run at 1.5 GPa and 1,500 °C in a graphite capsule
for 5 min. The product was mounted in acrylic, ground and polished with diamond
paste before analysis by EDS and LA-ICP-MS (see below for analytical method).
The composition of the starting mixture is shown in Extended Data Tables 1 and 2.
Volatile-loss experiments were performed at 1,300 °C and a range of flog( )O2
values from −​7 to −​13. The oxygen fugacity of the experiments was controlled
using a constant CO/CO2 gas mixture, apportioned according to the tables in
ref. 31. We verified the oxygen fugacity before and after each experiment using a
solid zirconia potentiometric oxygen sensor.
For each experiment, 3 g of material was weighed out, pressed into a 12-mm-­
diameter pellet with a 10-t press and placed inside the crucible. The crucible is
keyed into the top of an alumina pedestal, which is inserted into the hot furnace
from below. A second key between the pedestal and the base of the furnace ensures
that the crucible resists the turning moment from the stirrer. The assembly takes
1–2 min to come to temperature, with the sample melting at around 1,250 °C. The
stirrer was inserted from above, penetrating the molten sample by ­approximately
8 mm, and the furnace sealed. The stirrer was driven with a d.c. motor via a
pulse-width modulated motor controller. At 20% output power, the stirrer rotates
­constantly at 30 r.p.m. All experiments used the same stirring rate.
At the end of the experiment, the stirrer was stopped and a trapdoor in the
bottom of the furnace opened, allowing the pedestal and assembly to fall freely
into a water bath.
All of the experiments presented as a mass of homogenous black glass
­containing no observable gas bubbles. Most samples filled at least half of the
4.5-cm3
crucible, with a small amount of material fracturing and breaking free into
the water bath. Analysis of any loose shards showed the same composition as the
primary mass of sample. The samples were mounted in acrylic resin, ground and
polished with diamond paste before analysis.
Analysis. Samples were imaged using an FEI Quanta FEG 650 SEM and analysed
using on Oxford X-MaxN
standardless EDS from Oxford Instruments mounted
on the same instrument. Analysis was performed at 20 kV with a focused spot
(diameter of <​1 μ​m) and 3-nA beam current, measured by an absorbed current
meter attached to the sample stage. All of the standardless analyses of these basaltic
glass samples were checked for accuracy against the secondary glass standards
GSE-1G, GSD-1G and GSC-1G32,33
, and against MPI Ding basaltic glasses before
each analytical session.
All of the experiments showed major element compositions (see Extended Data
Table 1) that were uniform to within the precision of the analysis. In all of the
samples, the only change in major element composition was a variation in nickel
concentration of the melt, ranging from 0.2% to 2.56% NiO. If the nickel content
is removed and the remaining fraction normalized to 100%, then the composition
remains unchanged.
Trace element analysis was performed by LA-ICP-MS with a 213-nm
Nd:YAG laser (New Wave Research) and ‘large format’ cell connected to a Perkin
Elmer NexION 400Q ICP. The ICP was tuned for stability, minimal mass bias
(U/Th ≈​ 1.1 on SRM NIST610) and oxide production (ThO/Th <​ 0.2%),
with a ­typical ­nebulizer gas flow of 450 ml min−1
and constant helium flow of
800 ml min−1
. The USGS basaltic glass standard GSE-1G was used as a ­primary
calibration ­standard, with 43
Ca as the internal standard, standard-sample
­bracketing and data reduction by Glitter34
. The laser was fired at 5 Hz with a 50-μ​m
round spot, 4 J cm−2
of on-sample fluence, and scanned at 3 μ​m s−1
over 180 μ​m
for 60 s of signal. Between samples the cell was allowed to washout for 120 s. A 20-s
gas blank was collected before each ablation, and standards were sampled every
45 min. The following isotopes were measured for quantification of each element:
107
Ag, 209
Bi, 111
Cd, 53
Cr, 65
Cu, 71
Ga, 74
Ge, 115
In, 95
Mo, 208
Pb, 121
Sb, 118
Sn, 203
Tl, 51
V,
182
W and 66
Zn. A small (<​0.1%) overlap correction was applied for 115
Sn on 115
In.
The detection limit for most elements was below 0.1 μ​g g−1
, which was more than
adequate for quantification of these samples, with all concentrations (see Extended
Data Table 2) well above the detection limit.
To assess variations in the trace element composition of the melt, the laser was
scanned at random locations across the exposed surface of the glass. All of the
results show excellent trace element homogeneity. In the experiments performed at
more reducing conditions, nickel blebs formed in the glass and were inadvertently
sampled by the laser. Any signals from nickel blebs were discarded in the analysis.
Laser tracks were ablated perpendicular to the accessible surface of the glass.
With a 40-μ​m spot it was possible to detect quantitative changes in the trace
­element composition. At this spatial resolution there was no observable change
in the composition of any trace element at the surface of the melt, indicating that
the stirring mechanism worked as designed and provided a continuous turnover
of material throughout the experiment.
As well as nickel migrating into the melt, the nickel capsule absorbed small
amounts of some trace elements. To assess the magnitude of this loss, several
LA-ICP-MS scans were performed from the glass into the neighbouring crucible.
These scans show a small diffusion profile for some elements (Ag, Bi, Cu, In and Sb),
extending up to a maximum distance of 200 μ​m into the crucible. The effect of
this diffusion would be to artificially enhance the perceived volatile loss of those
elements. We attempted to quantify this effect, and our assessment is that a worst-
case 200-μ​m ‘rind’ of enriched material on the inside of the crucible can equate to
no more than 5% of the total volume of the melt. As such, diffusion into the capsule
material can be neglected in these experiments.
Results. Over the duration of each experiment, volatile elements partition into the
gas phase and are flushed from the furnace by the constant stream of CO and CO2
gas. Owing to the stirring mechanism, the surface of the melt is continuously
replenished and diffusion of the element in the melt can be neglected. The longer
the duration of the experiment, the more of each element is lost to the vapour
phase. As shown in Fig. 2, the relative degrees of volatile loss do not change with
time. To quantitatively assess the volatile loss, the volatility factor is defined as the
concentration at the end of the experiment divided by the starting ­concentration.
In this study, the 60-min duration was chosen to achieve measurable depletion for
the entire range of elements. Experiments were performed at a range of time dura-
tions at flog( )O2
 =​ −​7, and at 60 min for flog( )O2
 =​ −​9, −​11 and −​13. The com-
positions of each experiment are shown in Extended Data Tables 1 and 2.
Data availability. All data supporting the findings of this study are available within
the paper and its Extended Data. Source Data for Figs 1–4 are available in the
online version of the paper.
© 2017 Macmillan Publishers Limited, part of Springer Nature. All rights reserved.
LetterRESEARCH
Extended Data Table 1 | Major element compositions (in wt %) of starting material (EBT1) and product glasses from experiments
F006 to F019
1σ refers to 1 standard deviation and N to the number of analyses. EBT1 and F006 to F019 are experiment identifiers.
© 2017 Macmillan Publishers Limited, part of Springer Nature. All rights reserved.
Letter RESEARCH
Extended Data Table 2 | Trace element concentrations (in p.p.m.) and standard deviations (σ) of starting material and product glasses
based on N analyses
© 2017 Macmillan Publishers Limited, part of Springer Nature. All rights reserved.

Mais conteúdo relacionado

Semelhante a Earth’s volatile contents established by melting and vaporization

The divergent fates of primitive hydrospheric water on Earth and Mars
The divergent fates of primitive hydrospheric water on Earth and MarsThe divergent fates of primitive hydrospheric water on Earth and Mars
The divergent fates of primitive hydrospheric water on Earth and MarsSérgio Sacani
 
Wilde Carlin Geochem Modelling PMD-CRC 2006
Wilde Carlin Geochem Modelling PMD-CRC 2006Wilde Carlin Geochem Modelling PMD-CRC 2006
Wilde Carlin Geochem Modelling PMD-CRC 2006drwilde
 
Earth-and-Life-Science-Q1-Week 4.pdf
Earth-and-Life-Science-Q1-Week 4.pdfEarth-and-Life-Science-Q1-Week 4.pdf
Earth-and-Life-Science-Q1-Week 4.pdfEdchelo1
 
ZEISES SALT - KPtCl3(C 2 H 4) Paper #3November 18,.docx
ZEISES SALT - KPtCl3(C 2 H 4)              Paper #3November 18,.docxZEISES SALT - KPtCl3(C 2 H 4)              Paper #3November 18,.docx
ZEISES SALT - KPtCl3(C 2 H 4) Paper #3November 18,.docxdanielfoster65629
 
Clay%20Mineralogy.pptx
Clay%20Mineralogy.pptxClay%20Mineralogy.pptx
Clay%20Mineralogy.pptxDilipPaytm
 
geomorph1 kfsfhfsgfsufsh f hsk s udhds fdh.pptx
geomorph1 kfsfhfsgfsufsh f hsk   s udhds fdh.pptxgeomorph1 kfsfhfsgfsufsh f hsk   s udhds fdh.pptx
geomorph1 kfsfhfsgfsufsh f hsk s udhds fdh.pptxQuartzAcademy
 
Global Warming
Global WarmingGlobal Warming
Global WarmingGilroy ECA
 
Still the Biggest Control Knob : Carbon Dioxide in Earth&rsquo;s Climate History
Still the Biggest Control Knob: Carbon Dioxide in Earth&rsquo;s Climate HistoryStill the Biggest Control Knob: Carbon Dioxide in Earth&rsquo;s Climate History
Still the Biggest Control Knob : Carbon Dioxide in Earth&rsquo;s Climate HistorySERC at Carleton College
 
LinkedIn_The_FukushimaNuclearAccident_A Geological_Warning_CESIUM 137
LinkedIn_The_FukushimaNuclearAccident_A Geological_Warning_CESIUM 137LinkedIn_The_FukushimaNuclearAccident_A Geological_Warning_CESIUM 137
LinkedIn_The_FukushimaNuclearAccident_A Geological_Warning_CESIUM 137Judy B. Gardiner
 
Chemical weathering and formation of clay minerals.pptx
Chemical weathering and formation of clay minerals.pptxChemical weathering and formation of clay minerals.pptx
Chemical weathering and formation of clay minerals.pptxIsmailKatun1
 
porphyry Cu-Mo.ppt
porphyry Cu-Mo.pptporphyry Cu-Mo.ppt
porphyry Cu-Mo.pptssuserdf29f0
 
International Journal of Engineering Research and Development (IJERD)
International Journal of Engineering Research and Development (IJERD)International Journal of Engineering Research and Development (IJERD)
International Journal of Engineering Research and Development (IJERD)IJERD Editor
 
Still the Biggest Control Knob : Carbon Dioxide in Earth's Climate "History"
Still the Biggest Control Knob: Carbon Dioxide in Earth's Climate "History"Still the Biggest Control Knob: Carbon Dioxide in Earth's Climate "History"
Still the Biggest Control Knob : Carbon Dioxide in Earth's Climate "History"SERC at Carleton College
 

Semelhante a Earth’s volatile contents established by melting and vaporization (20)

The divergent fates of primitive hydrospheric water on Earth and Mars
The divergent fates of primitive hydrospheric water on Earth and MarsThe divergent fates of primitive hydrospheric water on Earth and Mars
The divergent fates of primitive hydrospheric water on Earth and Mars
 
Wilde Carlin Geochem Modelling PMD-CRC 2006
Wilde Carlin Geochem Modelling PMD-CRC 2006Wilde Carlin Geochem Modelling PMD-CRC 2006
Wilde Carlin Geochem Modelling PMD-CRC 2006
 
Studying the Effect of Counter Ions on the Gas Selectivity and Volatile Organ...
Studying the Effect of Counter Ions on the Gas Selectivity and Volatile Organ...Studying the Effect of Counter Ions on the Gas Selectivity and Volatile Organ...
Studying the Effect of Counter Ions on the Gas Selectivity and Volatile Organ...
 
Earth-and-Life-Science-Q1-Week 4.pdf
Earth-and-Life-Science-Q1-Week 4.pdfEarth-and-Life-Science-Q1-Week 4.pdf
Earth-and-Life-Science-Q1-Week 4.pdf
 
Rose and Brenan (2001)
Rose and Brenan (2001)Rose and Brenan (2001)
Rose and Brenan (2001)
 
ZEISES SALT - KPtCl3(C 2 H 4) Paper #3November 18,.docx
ZEISES SALT - KPtCl3(C 2 H 4)              Paper #3November 18,.docxZEISES SALT - KPtCl3(C 2 H 4)              Paper #3November 18,.docx
ZEISES SALT - KPtCl3(C 2 H 4) Paper #3November 18,.docx
 
Cobalt
CobaltCobalt
Cobalt
 
Clay%20Mineralogy.pptx
Clay%20Mineralogy.pptxClay%20Mineralogy.pptx
Clay%20Mineralogy.pptx
 
geomorph1 kfsfhfsgfsufsh f hsk s udhds fdh.pptx
geomorph1 kfsfhfsgfsufsh f hsk   s udhds fdh.pptxgeomorph1 kfsfhfsgfsufsh f hsk   s udhds fdh.pptx
geomorph1 kfsfhfsgfsufsh f hsk s udhds fdh.pptx
 
Global Warming
Global WarmingGlobal Warming
Global Warming
 
Still the Biggest Control Knob : Carbon Dioxide in Earth&rsquo;s Climate History
Still the Biggest Control Knob: Carbon Dioxide in Earth&rsquo;s Climate HistoryStill the Biggest Control Knob: Carbon Dioxide in Earth&rsquo;s Climate History
Still the Biggest Control Knob : Carbon Dioxide in Earth&rsquo;s Climate History
 
Greenhouse effect
Greenhouse effectGreenhouse effect
Greenhouse effect
 
LinkedIn_The_FukushimaNuclearAccident_A Geological_Warning_CESIUM 137
LinkedIn_The_FukushimaNuclearAccident_A Geological_Warning_CESIUM 137LinkedIn_The_FukushimaNuclearAccident_A Geological_Warning_CESIUM 137
LinkedIn_The_FukushimaNuclearAccident_A Geological_Warning_CESIUM 137
 
Chemical weathering and formation of clay minerals.pptx
Chemical weathering and formation of clay minerals.pptxChemical weathering and formation of clay minerals.pptx
Chemical weathering and formation of clay minerals.pptx
 
Adsorption
AdsorptionAdsorption
Adsorption
 
porphyry Cu-Mo.ppt
porphyry Cu-Mo.pptporphyry Cu-Mo.ppt
porphyry Cu-Mo.ppt
 
06 Woods-Robinson&Paige2014
06 Woods-Robinson&Paige201406 Woods-Robinson&Paige2014
06 Woods-Robinson&Paige2014
 
International Journal of Engineering Research and Development (IJERD)
International Journal of Engineering Research and Development (IJERD)International Journal of Engineering Research and Development (IJERD)
International Journal of Engineering Research and Development (IJERD)
 
Still the Biggest Control Knob : Carbon Dioxide in Earth's Climate "History"
Still the Biggest Control Knob: Carbon Dioxide in Earth's Climate "History"Still the Biggest Control Knob: Carbon Dioxide in Earth's Climate "History"
Still the Biggest Control Knob : Carbon Dioxide in Earth's Climate "History"
 
Water Chemistry.ppt
Water Chemistry.pptWater Chemistry.ppt
Water Chemistry.ppt
 

Mais de Sérgio Sacani

TransientOffsetin14CAftertheCarringtonEventRecordedbyPolarTreeRings
TransientOffsetin14CAftertheCarringtonEventRecordedbyPolarTreeRingsTransientOffsetin14CAftertheCarringtonEventRecordedbyPolarTreeRings
TransientOffsetin14CAftertheCarringtonEventRecordedbyPolarTreeRingsSérgio Sacani
 
Biogenic Sulfur Gases as Biosignatures on Temperate Sub-Neptune Waterworlds
Biogenic Sulfur Gases as Biosignatures on Temperate Sub-Neptune WaterworldsBiogenic Sulfur Gases as Biosignatures on Temperate Sub-Neptune Waterworlds
Biogenic Sulfur Gases as Biosignatures on Temperate Sub-Neptune WaterworldsSérgio Sacani
 
Asymmetry in the atmosphere of the ultra-hot Jupiter WASP-76 b
Asymmetry in the atmosphere of the ultra-hot Jupiter WASP-76 bAsymmetry in the atmosphere of the ultra-hot Jupiter WASP-76 b
Asymmetry in the atmosphere of the ultra-hot Jupiter WASP-76 bSérgio Sacani
 
Formation of low mass protostars and their circumstellar disks
Formation of low mass protostars and their circumstellar disksFormation of low mass protostars and their circumstellar disks
Formation of low mass protostars and their circumstellar disksSérgio Sacani
 
Nightside clouds and disequilibrium chemistry on the hot Jupiter WASP-43b
Nightside clouds and disequilibrium chemistry on the hot Jupiter WASP-43bNightside clouds and disequilibrium chemistry on the hot Jupiter WASP-43b
Nightside clouds and disequilibrium chemistry on the hot Jupiter WASP-43bSérgio Sacani
 
Discovery of an Accretion Streamer and a Slow Wide-angle Outflow around FUOri...
Discovery of an Accretion Streamer and a Slow Wide-angle Outflow around FUOri...Discovery of an Accretion Streamer and a Slow Wide-angle Outflow around FUOri...
Discovery of an Accretion Streamer and a Slow Wide-angle Outflow around FUOri...Sérgio Sacani
 
Disentangling the origin of chemical differences using GHOST
Disentangling the origin of chemical differences using GHOSTDisentangling the origin of chemical differences using GHOST
Disentangling the origin of chemical differences using GHOSTSérgio Sacani
 
All-domain Anomaly Resolution Office U.S. Department of Defense (U) Case: “Eg...
All-domain Anomaly Resolution Office U.S. Department of Defense (U) Case: “Eg...All-domain Anomaly Resolution Office U.S. Department of Defense (U) Case: “Eg...
All-domain Anomaly Resolution Office U.S. Department of Defense (U) Case: “Eg...Sérgio Sacani
 
PossibleEoarcheanRecordsoftheGeomagneticFieldPreservedintheIsuaSupracrustalBe...
PossibleEoarcheanRecordsoftheGeomagneticFieldPreservedintheIsuaSupracrustalBe...PossibleEoarcheanRecordsoftheGeomagneticFieldPreservedintheIsuaSupracrustalBe...
PossibleEoarcheanRecordsoftheGeomagneticFieldPreservedintheIsuaSupracrustalBe...Sérgio Sacani
 
Isotopic evidence of long-lived volcanism on Io
Isotopic evidence of long-lived volcanism on IoIsotopic evidence of long-lived volcanism on Io
Isotopic evidence of long-lived volcanism on IoSérgio Sacani
 
Hubble Asteroid Hunter III. Physical properties of newly found asteroids
Hubble Asteroid Hunter III. Physical properties of newly found asteroidsHubble Asteroid Hunter III. Physical properties of newly found asteroids
Hubble Asteroid Hunter III. Physical properties of newly found asteroidsSérgio Sacani
 
Observational constraints on mergers creating magnetism in massive stars
Observational constraints on mergers creating magnetism in massive starsObservational constraints on mergers creating magnetism in massive stars
Observational constraints on mergers creating magnetism in massive starsSérgio Sacani
 
Observation of Gravitational Waves from the Coalescence of a 2.5–4.5 M⊙ Compa...
Observation of Gravitational Waves from the Coalescence of a 2.5–4.5 M⊙ Compa...Observation of Gravitational Waves from the Coalescence of a 2.5–4.5 M⊙ Compa...
Observation of Gravitational Waves from the Coalescence of a 2.5–4.5 M⊙ Compa...Sérgio Sacani
 
The SAMI Galaxy Sur v ey: galaxy spin is more strongly correlated with stella...
The SAMI Galaxy Sur v ey: galaxy spin is more strongly correlated with stella...The SAMI Galaxy Sur v ey: galaxy spin is more strongly correlated with stella...
The SAMI Galaxy Sur v ey: galaxy spin is more strongly correlated with stella...Sérgio Sacani
 
Is Betelgeuse Really Rotating? Synthetic ALMA Observations of Large-scale Con...
Is Betelgeuse Really Rotating? Synthetic ALMA Observations of Large-scale Con...Is Betelgeuse Really Rotating? Synthetic ALMA Observations of Large-scale Con...
Is Betelgeuse Really Rotating? Synthetic ALMA Observations of Large-scale Con...Sérgio Sacani
 
First Direct Imaging of a Kelvin–Helmholtz Instability by PSP/WISPR
First Direct Imaging of a Kelvin–Helmholtz Instability by PSP/WISPRFirst Direct Imaging of a Kelvin–Helmholtz Instability by PSP/WISPR
First Direct Imaging of a Kelvin–Helmholtz Instability by PSP/WISPRSérgio Sacani
 
The Sun’s differential rotation is controlled by high- latitude baroclinicall...
The Sun’s differential rotation is controlled by high- latitude baroclinicall...The Sun’s differential rotation is controlled by high- latitude baroclinicall...
The Sun’s differential rotation is controlled by high- latitude baroclinicall...Sérgio Sacani
 
Hydrogen Column Density Variability in a Sample of Local Compton-Thin AGN
Hydrogen Column Density Variability in a Sample of Local Compton-Thin AGNHydrogen Column Density Variability in a Sample of Local Compton-Thin AGN
Hydrogen Column Density Variability in a Sample of Local Compton-Thin AGNSérgio Sacani
 
Huygens - Exploring Titan A Mysterious World
Huygens - Exploring Titan A Mysterious WorldHuygens - Exploring Titan A Mysterious World
Huygens - Exploring Titan A Mysterious WorldSérgio Sacani
 
The Radcliffe Wave Of Milk Way is oscillating
The Radcliffe Wave Of Milk Way  is oscillatingThe Radcliffe Wave Of Milk Way  is oscillating
The Radcliffe Wave Of Milk Way is oscillatingSérgio Sacani
 

Mais de Sérgio Sacani (20)

TransientOffsetin14CAftertheCarringtonEventRecordedbyPolarTreeRings
TransientOffsetin14CAftertheCarringtonEventRecordedbyPolarTreeRingsTransientOffsetin14CAftertheCarringtonEventRecordedbyPolarTreeRings
TransientOffsetin14CAftertheCarringtonEventRecordedbyPolarTreeRings
 
Biogenic Sulfur Gases as Biosignatures on Temperate Sub-Neptune Waterworlds
Biogenic Sulfur Gases as Biosignatures on Temperate Sub-Neptune WaterworldsBiogenic Sulfur Gases as Biosignatures on Temperate Sub-Neptune Waterworlds
Biogenic Sulfur Gases as Biosignatures on Temperate Sub-Neptune Waterworlds
 
Asymmetry in the atmosphere of the ultra-hot Jupiter WASP-76 b
Asymmetry in the atmosphere of the ultra-hot Jupiter WASP-76 bAsymmetry in the atmosphere of the ultra-hot Jupiter WASP-76 b
Asymmetry in the atmosphere of the ultra-hot Jupiter WASP-76 b
 
Formation of low mass protostars and their circumstellar disks
Formation of low mass protostars and their circumstellar disksFormation of low mass protostars and their circumstellar disks
Formation of low mass protostars and their circumstellar disks
 
Nightside clouds and disequilibrium chemistry on the hot Jupiter WASP-43b
Nightside clouds and disequilibrium chemistry on the hot Jupiter WASP-43bNightside clouds and disequilibrium chemistry on the hot Jupiter WASP-43b
Nightside clouds and disequilibrium chemistry on the hot Jupiter WASP-43b
 
Discovery of an Accretion Streamer and a Slow Wide-angle Outflow around FUOri...
Discovery of an Accretion Streamer and a Slow Wide-angle Outflow around FUOri...Discovery of an Accretion Streamer and a Slow Wide-angle Outflow around FUOri...
Discovery of an Accretion Streamer and a Slow Wide-angle Outflow around FUOri...
 
Disentangling the origin of chemical differences using GHOST
Disentangling the origin of chemical differences using GHOSTDisentangling the origin of chemical differences using GHOST
Disentangling the origin of chemical differences using GHOST
 
All-domain Anomaly Resolution Office U.S. Department of Defense (U) Case: “Eg...
All-domain Anomaly Resolution Office U.S. Department of Defense (U) Case: “Eg...All-domain Anomaly Resolution Office U.S. Department of Defense (U) Case: “Eg...
All-domain Anomaly Resolution Office U.S. Department of Defense (U) Case: “Eg...
 
PossibleEoarcheanRecordsoftheGeomagneticFieldPreservedintheIsuaSupracrustalBe...
PossibleEoarcheanRecordsoftheGeomagneticFieldPreservedintheIsuaSupracrustalBe...PossibleEoarcheanRecordsoftheGeomagneticFieldPreservedintheIsuaSupracrustalBe...
PossibleEoarcheanRecordsoftheGeomagneticFieldPreservedintheIsuaSupracrustalBe...
 
Isotopic evidence of long-lived volcanism on Io
Isotopic evidence of long-lived volcanism on IoIsotopic evidence of long-lived volcanism on Io
Isotopic evidence of long-lived volcanism on Io
 
Hubble Asteroid Hunter III. Physical properties of newly found asteroids
Hubble Asteroid Hunter III. Physical properties of newly found asteroidsHubble Asteroid Hunter III. Physical properties of newly found asteroids
Hubble Asteroid Hunter III. Physical properties of newly found asteroids
 
Observational constraints on mergers creating magnetism in massive stars
Observational constraints on mergers creating magnetism in massive starsObservational constraints on mergers creating magnetism in massive stars
Observational constraints on mergers creating magnetism in massive stars
 
Observation of Gravitational Waves from the Coalescence of a 2.5–4.5 M⊙ Compa...
Observation of Gravitational Waves from the Coalescence of a 2.5–4.5 M⊙ Compa...Observation of Gravitational Waves from the Coalescence of a 2.5–4.5 M⊙ Compa...
Observation of Gravitational Waves from the Coalescence of a 2.5–4.5 M⊙ Compa...
 
The SAMI Galaxy Sur v ey: galaxy spin is more strongly correlated with stella...
The SAMI Galaxy Sur v ey: galaxy spin is more strongly correlated with stella...The SAMI Galaxy Sur v ey: galaxy spin is more strongly correlated with stella...
The SAMI Galaxy Sur v ey: galaxy spin is more strongly correlated with stella...
 
Is Betelgeuse Really Rotating? Synthetic ALMA Observations of Large-scale Con...
Is Betelgeuse Really Rotating? Synthetic ALMA Observations of Large-scale Con...Is Betelgeuse Really Rotating? Synthetic ALMA Observations of Large-scale Con...
Is Betelgeuse Really Rotating? Synthetic ALMA Observations of Large-scale Con...
 
First Direct Imaging of a Kelvin–Helmholtz Instability by PSP/WISPR
First Direct Imaging of a Kelvin–Helmholtz Instability by PSP/WISPRFirst Direct Imaging of a Kelvin–Helmholtz Instability by PSP/WISPR
First Direct Imaging of a Kelvin–Helmholtz Instability by PSP/WISPR
 
The Sun’s differential rotation is controlled by high- latitude baroclinicall...
The Sun’s differential rotation is controlled by high- latitude baroclinicall...The Sun’s differential rotation is controlled by high- latitude baroclinicall...
The Sun’s differential rotation is controlled by high- latitude baroclinicall...
 
Hydrogen Column Density Variability in a Sample of Local Compton-Thin AGN
Hydrogen Column Density Variability in a Sample of Local Compton-Thin AGNHydrogen Column Density Variability in a Sample of Local Compton-Thin AGN
Hydrogen Column Density Variability in a Sample of Local Compton-Thin AGN
 
Huygens - Exploring Titan A Mysterious World
Huygens - Exploring Titan A Mysterious WorldHuygens - Exploring Titan A Mysterious World
Huygens - Exploring Titan A Mysterious World
 
The Radcliffe Wave Of Milk Way is oscillating
The Radcliffe Wave Of Milk Way  is oscillatingThe Radcliffe Wave Of Milk Way  is oscillating
The Radcliffe Wave Of Milk Way is oscillating
 

Último

Human genetics..........................pptx
Human genetics..........................pptxHuman genetics..........................pptx
Human genetics..........................pptxSilpa
 
Thyroid Physiology_Dr.E. Muralinath_ Associate Professor
Thyroid Physiology_Dr.E. Muralinath_ Associate ProfessorThyroid Physiology_Dr.E. Muralinath_ Associate Professor
Thyroid Physiology_Dr.E. Muralinath_ Associate Professormuralinath2
 
Factory Acceptance Test( FAT).pptx .
Factory Acceptance Test( FAT).pptx       .Factory Acceptance Test( FAT).pptx       .
Factory Acceptance Test( FAT).pptx .Poonam Aher Patil
 
FAIRSpectra - Enabling the FAIRification of Analytical Science
FAIRSpectra - Enabling the FAIRification of Analytical ScienceFAIRSpectra - Enabling the FAIRification of Analytical Science
FAIRSpectra - Enabling the FAIRification of Analytical ScienceAlex Henderson
 
GBSN - Biochemistry (Unit 1)
GBSN - Biochemistry (Unit 1)GBSN - Biochemistry (Unit 1)
GBSN - Biochemistry (Unit 1)Areesha Ahmad
 
Pulmonary drug delivery system M.pharm -2nd sem P'ceutics
Pulmonary drug delivery system M.pharm -2nd sem P'ceuticsPulmonary drug delivery system M.pharm -2nd sem P'ceutics
Pulmonary drug delivery system M.pharm -2nd sem P'ceuticssakshisoni2385
 
Velocity and Acceleration PowerPoint.ppt
Velocity and Acceleration PowerPoint.pptVelocity and Acceleration PowerPoint.ppt
Velocity and Acceleration PowerPoint.pptRakeshMohan42
 
POGONATUM : morphology, anatomy, reproduction etc.
POGONATUM : morphology, anatomy, reproduction etc.POGONATUM : morphology, anatomy, reproduction etc.
POGONATUM : morphology, anatomy, reproduction etc.Silpa
 
Stages in the normal growth curve
Stages in the normal growth curveStages in the normal growth curve
Stages in the normal growth curveAreesha Ahmad
 
Digital Dentistry.Digital Dentistryvv.pptx
Digital Dentistry.Digital Dentistryvv.pptxDigital Dentistry.Digital Dentistryvv.pptx
Digital Dentistry.Digital Dentistryvv.pptxMohamedFarag457087
 
Molecular markers- RFLP, RAPD, AFLP, SNP etc.
Molecular markers- RFLP, RAPD, AFLP, SNP etc.Molecular markers- RFLP, RAPD, AFLP, SNP etc.
Molecular markers- RFLP, RAPD, AFLP, SNP etc.Silpa
 
Human & Veterinary Respiratory Physilogy_DR.E.Muralinath_Associate Professor....
Human & Veterinary Respiratory Physilogy_DR.E.Muralinath_Associate Professor....Human & Veterinary Respiratory Physilogy_DR.E.Muralinath_Associate Professor....
Human & Veterinary Respiratory Physilogy_DR.E.Muralinath_Associate Professor....muralinath2
 
GBSN - Microbiology (Unit 3)
GBSN - Microbiology (Unit 3)GBSN - Microbiology (Unit 3)
GBSN - Microbiology (Unit 3)Areesha Ahmad
 
development of diagnostic enzyme assay to detect leuser virus
development of diagnostic enzyme assay to detect leuser virusdevelopment of diagnostic enzyme assay to detect leuser virus
development of diagnostic enzyme assay to detect leuser virusNazaninKarimi6
 
Call Girls Ahmedabad +917728919243 call me Independent Escort Service
Call Girls Ahmedabad +917728919243 call me Independent Escort ServiceCall Girls Ahmedabad +917728919243 call me Independent Escort Service
Call Girls Ahmedabad +917728919243 call me Independent Escort Serviceshivanisharma5244
 
Selaginella: features, morphology ,anatomy and reproduction.
Selaginella: features, morphology ,anatomy and reproduction.Selaginella: features, morphology ,anatomy and reproduction.
Selaginella: features, morphology ,anatomy and reproduction.Silpa
 
Use of mutants in understanding seedling development.pptx
Use of mutants in understanding seedling development.pptxUse of mutants in understanding seedling development.pptx
Use of mutants in understanding seedling development.pptxRenuJangid3
 
GBSN - Microbiology (Unit 2)
GBSN - Microbiology (Unit 2)GBSN - Microbiology (Unit 2)
GBSN - Microbiology (Unit 2)Areesha Ahmad
 

Último (20)

Human genetics..........................pptx
Human genetics..........................pptxHuman genetics..........................pptx
Human genetics..........................pptx
 
Thyroid Physiology_Dr.E. Muralinath_ Associate Professor
Thyroid Physiology_Dr.E. Muralinath_ Associate ProfessorThyroid Physiology_Dr.E. Muralinath_ Associate Professor
Thyroid Physiology_Dr.E. Muralinath_ Associate Professor
 
Factory Acceptance Test( FAT).pptx .
Factory Acceptance Test( FAT).pptx       .Factory Acceptance Test( FAT).pptx       .
Factory Acceptance Test( FAT).pptx .
 
FAIRSpectra - Enabling the FAIRification of Analytical Science
FAIRSpectra - Enabling the FAIRification of Analytical ScienceFAIRSpectra - Enabling the FAIRification of Analytical Science
FAIRSpectra - Enabling the FAIRification of Analytical Science
 
GBSN - Biochemistry (Unit 1)
GBSN - Biochemistry (Unit 1)GBSN - Biochemistry (Unit 1)
GBSN - Biochemistry (Unit 1)
 
Pulmonary drug delivery system M.pharm -2nd sem P'ceutics
Pulmonary drug delivery system M.pharm -2nd sem P'ceuticsPulmonary drug delivery system M.pharm -2nd sem P'ceutics
Pulmonary drug delivery system M.pharm -2nd sem P'ceutics
 
Velocity and Acceleration PowerPoint.ppt
Velocity and Acceleration PowerPoint.pptVelocity and Acceleration PowerPoint.ppt
Velocity and Acceleration PowerPoint.ppt
 
POGONATUM : morphology, anatomy, reproduction etc.
POGONATUM : morphology, anatomy, reproduction etc.POGONATUM : morphology, anatomy, reproduction etc.
POGONATUM : morphology, anatomy, reproduction etc.
 
Stages in the normal growth curve
Stages in the normal growth curveStages in the normal growth curve
Stages in the normal growth curve
 
Digital Dentistry.Digital Dentistryvv.pptx
Digital Dentistry.Digital Dentistryvv.pptxDigital Dentistry.Digital Dentistryvv.pptx
Digital Dentistry.Digital Dentistryvv.pptx
 
Site Acceptance Test .
Site Acceptance Test                    .Site Acceptance Test                    .
Site Acceptance Test .
 
Clean In Place(CIP).pptx .
Clean In Place(CIP).pptx                 .Clean In Place(CIP).pptx                 .
Clean In Place(CIP).pptx .
 
Molecular markers- RFLP, RAPD, AFLP, SNP etc.
Molecular markers- RFLP, RAPD, AFLP, SNP etc.Molecular markers- RFLP, RAPD, AFLP, SNP etc.
Molecular markers- RFLP, RAPD, AFLP, SNP etc.
 
Human & Veterinary Respiratory Physilogy_DR.E.Muralinath_Associate Professor....
Human & Veterinary Respiratory Physilogy_DR.E.Muralinath_Associate Professor....Human & Veterinary Respiratory Physilogy_DR.E.Muralinath_Associate Professor....
Human & Veterinary Respiratory Physilogy_DR.E.Muralinath_Associate Professor....
 
GBSN - Microbiology (Unit 3)
GBSN - Microbiology (Unit 3)GBSN - Microbiology (Unit 3)
GBSN - Microbiology (Unit 3)
 
development of diagnostic enzyme assay to detect leuser virus
development of diagnostic enzyme assay to detect leuser virusdevelopment of diagnostic enzyme assay to detect leuser virus
development of diagnostic enzyme assay to detect leuser virus
 
Call Girls Ahmedabad +917728919243 call me Independent Escort Service
Call Girls Ahmedabad +917728919243 call me Independent Escort ServiceCall Girls Ahmedabad +917728919243 call me Independent Escort Service
Call Girls Ahmedabad +917728919243 call me Independent Escort Service
 
Selaginella: features, morphology ,anatomy and reproduction.
Selaginella: features, morphology ,anatomy and reproduction.Selaginella: features, morphology ,anatomy and reproduction.
Selaginella: features, morphology ,anatomy and reproduction.
 
Use of mutants in understanding seedling development.pptx
Use of mutants in understanding seedling development.pptxUse of mutants in understanding seedling development.pptx
Use of mutants in understanding seedling development.pptx
 
GBSN - Microbiology (Unit 2)
GBSN - Microbiology (Unit 2)GBSN - Microbiology (Unit 2)
GBSN - Microbiology (Unit 2)
 

Earth’s volatile contents established by melting and vaporization

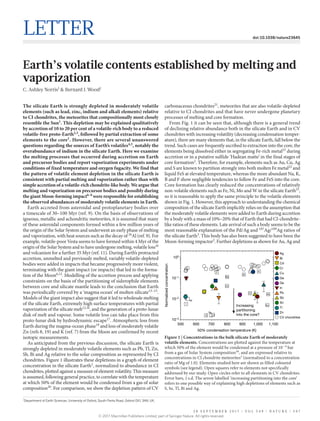
  • 1. 2 8 s e p t e m b e r 2 0 1 7 | V O L 5 4 9 | N A T U RE | 5 0 7 Letter doi:10.1038/nature23645 Earth’s volatile contents established by melting and vaporization C. Ashley Norris1 & Bernard J. Wood1 The silicate Earth is strongly depleted in moderately volatile elements (such as lead, zinc, indium and alkali elements) relative to CI chondrites, the meteorites that compositionally most closely resemble the Sun1 . This depletion may be explained qualitatively by accretion of 10 to 20 per cent of a volatile-rich body to a reduced volatile-free proto-Earth2,3 , followed by partial extraction of some elements to the core1 . However, there are several unanswered questions regarding the sources of Earth’s volatiles4,5 , notably the overabundance of indium in the silicate Earth. Here we examine the melting processes that occurred during accretion on Earth and precursor bodies and report vaporization experiments under conditions of fixed temperature and oxygen fugacity. We find that the pattern of volatile element depletion in the silicate Earth is consistent with partial melting and vaporization rather than with simple accretion of a volatile-rich chondrite-like body. We argue that melting and vaporization on precursor bodies and possibly during the giant Moon-forming impact6–8 were responsible for establishing the observed abundances of moderately volatile elements in Earth. Earth accreted from asteroidal and protoplanetary bodies over a timescale of 30–100 Myr (ref. 9). On the basis of observations of ­igneous, metallic and achondritic meteorites, it is assumed that many of these asteroidal components formed within a few million years of the origin of the Solar System and underwent an early phase of melting and vaporization, with heat sources such as the decay of 26 Al (ref. 9). For example, volatile-poor Vesta seems to have formed within 4 Myr of the origin of the Solar System and to have undergone melting, volatile loss10 and volcanism for a further 35 Myr (ref. 11). During Earth’s protracted accretion, unmelted and previously melted, variably volatile-depleted bodies were added in impacts that became progressively more violent, terminating with the giant impact (or impacts) that led to the forma- tion of the Moon6,12 . Modelling of the accretion process and applying constraints on the basis of the partitioning of siderophile elements between core and silicate mantle leads to the conclusion that Earth was periodically covered by a ‘magma ocean’ of molten silicate13–15 . Models of the giant impact also suggest that it led to wholesale melting of the silicate Earth, extremely high surface temperatures with partial vaporization of the silicate melt12,16 , and the generation of a proto-lunar disk of melt and vapour. Some volatile loss can take place from this proto-lunar disk by hydrodynamic escape17 . Atmospheric loss from Earth during the magma-ocean phase18 and loss of moderately volatile Zn (refs 8, 19) and K (ref. 7) from the Moon are confirmed by recent isotopic measurements. As anticipated from the previous discussion, the silicate Earth is strongly depleted in moderately volatile elements such as Pb, Tl, Zn, Sb, Bi and Ag relative to the solar composition as represented by CI chondrites. Figure 1 illustrates these depletions in a graph of ­element concentration in the silicate Earth1 , normalized to abundance in CI chondrites, plotted against a measure of element volatility. This ­measure is assumed, following general practice, to correlate with the temperature at which 50% of the element would be condensed from a gas of solar composition20 . For comparison, we show the depletion pattern of CV carbonaceous chondrites21 , meteorites that are also ­volatile-depleted relative to CI chondrites and that have never undergone planetary ­processes of melting and core formation. From Fig. 1 it can be seen that, although there is a general trend of declining relative abundance both in the silicate Earth and in CV chondrites with increasing volatility (decreasing condensation temper- ature), there are many elements that, in the silicate Earth, fall below the trend. Such cases are frequently ascribed to extraction into the core, the elements being dissolved either in segregating Fe-rich metal22 during accretion or in a putative sulfide ‘Hadean matte’ in the final stages of core formation2 . Therefore, for example, elements such as Au, Cu, Ag and S are known to partition strongly into both molten Fe metal22 and liquid FeS at elevated temperature, whereas the more abundant Na, K, B and F show negligible tendencies to follow Fe and FeS into the core. Core formation has clearly reduced the concentrations of relatively non-volatile elements such as Fe, Ni, Mo and W in the silicate Earth23 , so it is reasonable to apply the same principle to the volatile elements shown in Fig. 1. However, this approach to understanding the chemical composition of the silicate Earth implicitly relies on the assumption that the moderately volatile elements were added to Earth during accretion by a body with a mass of 10%–20% that of Earth that had CI-chondrite- like ratios of these elements. Late arrival of such a body seems to be the most reasonable explanation of the Pd/Ag and 107 Ag/109 Ag ratios of the silicate Earth3 . This body has also been suggested to have been the Moon-forming impactor2 . Further depletions as shown for Au, Ag and 1 Department of Earth Sciences, University of Oxford, South Parks Road, Oxford OX1 3AN, UK. 50% condensation temperature (K) 500 Normalizedconcentration 100 10–1 10–2 10–3 CV chondrites B F Na S Cl K As Se Br Rb Te I Cs AuIncreasing partitioning into the core? Ag Bi Cd Cr Cu Ga Ge In Pb Sb Sn Tl Zn 1,1001,000900800700600 Figure 1 | Concentrations in the bulk silicate Earth of moderately volatile elements. Concentrations are plotted against the temperature at which 50% of the element would be condensed at a pressure of 10−4 bar from a gas of Solar System composition16 , and are expressed relative to concentrations in CI chondrite meteorites1 (normalized to a concentration ratio of Mg of 1.0). Elements studied here are shown as filled coloured symbols (see legend). Open squares refer to elements not specifically addressed by our study. Open circles refer to all elements in CV chondrites. Error bars, 1 s.d. The arrow labelled ‘increasing partitioning into the core’ refers to one possible way of explaining high depletions of elements such as S, Se, Tl, Bi and Ag. © 2017 Macmillan Publishers Limited, part of Springer Nature. All rights reserved.
  • 2. 5 0 8 | N A T U RE | V O L 5 4 9 | 2 8 s e p t e m b e r 2 0 1 7 LetterRESEARCH other elements are then ascribed to the aforementioned core-forming processes1 . However, despite the flexibility of the approach in terms of the conditions (pressure, temperature and metal composition) of core formation, which can be varied to match the depletion pattern, the abundances of numerous elements remain difficult to explain. In, for example, has a much lower condensation temperature than Zn and is more siderophile and more chalcophile than Zn22 , yet is ­relatively more abundant in the silicate Earth1 . In is also much more abundant in the silicate Earth than Tl, despite having a similar con- densation ­temperature (Fig. 1) and being more siderophile and more ­chalcophile22 . Cs is strongly depleted despite not partitioning into either metal or sulfide24 . The same applies to the halogens. Cu and Ag have virtually identical partitioning into sulfide and metal22 and very similar condensation temperatures, yet Cu is substantially more abundant than Ag. Therefore, the pattern of abundance shown in Fig. 1 cannot be explained solely by the addition of volatiles in a CI-chondrite-like body followed by partial core formation. Of the other processes involved in the formation and differentiation of Earth, melting on precursor bodies and on the protoplanet must have led to partial vaporization of the most volatile elements, and it is this process that we consider here. To measure the loss of volatile elements to the vapour phase directly, we constructed a 1-atm gas mixing furnace with stirring apparatus (see Methods and Extended Data Tables 1 and 2). The device is capable of stirring a 4.5-cm3 crucible of silicate melt at temperatures of up to 1,700 °C in an entirely gas-tight assembly. Flowing CO/CO2 mixtures were used to control oxygen fugacity (fO2 ). The crucible and stirrer mechanism are made of high-purity nickel and products were drop- quenched into a water bath at the end of the experiment. The silicate starting material was a natural basalt from the Reykjanes Ridge, Iceland, which was crushed, ground and mixed with a trace element mixture of oxide powders to yield concentrations of 300–500 μ​g g−1 per element. Volatile-loss experiments were performed at 1,300 °C and a range of flog( )O2 values from −​7 to −​13. This fO2 range represents values from just less than that of the Ni–NiO buffer, down to 2.3 logarithmic units below that of the Fe–FeO buffer. The former (upper) value is charac- teristic of the modern mantle25 ; the latter (lower) value corresponds to the case of molten peridotitic mantle in equilibrium with Fe and hence simulates conditions during core formation. All products presented as a mass of homogeneous black glass ­containing no observable gas bubbles. Major element compositions of the products were determined using a scanning electron microscope (SEM) with an energy-­dispersive detector (Extended Data Table 1). Trace element concentrations were measured using laser-ablation inductively coupled plasma mass ­spectrometry (LA-ICP-MS; Methods and Extended Data Table 2). Samples were inspected for homogeneity using an SEM with back-­ scattered electron (BSE) imaging, X-ray mapping, and repeated spot analysis using an energy-dispersive spectrometer (EDS). In all cases, the major element composition of the samples appeared to be homoge- neous to the precision of these techniques (approximately 2% ­relative standard deviation, r.s.d.). Repeated trace element analysis using LA-ICP-MS showed that most elements were homogeneous to ­better than the single-spot precision, approximately 5%–10% r.s.d. In the high concentration range of 400–500 μ​g g−1 , the intra-spot variation was less than 5% r.s.d. for Ag, Ga, In, Mo, Pb, Sn, W and Zn; that of Bi, Cd, Cu, Ge, Sb and Tl was in the range 10%–15% r.s.d. Unsurprisingly, the most depleted samples at an abundance of 1–10 μ​g g−1 had larger intra-spot variation and greater uncertainty for each point. The most variable elements were Bi, Ge and Sb (25% r.s.d.), then Ag, Cd, Sn and Zn (10%–15% r.s.d.), with the rest exhibiting less than 10% r.s.d. Over the duration of the experiment, volatile elements partitioned into the gas phase and were flushed from the furnace by the constant stream of CO/CO2 gas. For these volatile-loss experiments, the surface of the melt was continuously replenished by the stirring mechanism and diffusion of the element in the melt can be neglected as a kinetic factor. In Fig. 2 we show a time series of experiments performed at fO2  =​ 10−7  atm (0.3 logarithmic units below the Ni–NiO buffer). As can be seen, loss is continuous with time and, under these conditions and in contrast to condensation (Fig. 1), In is less volatile than Cu and Ag. Time (min) 0 Normalizedconcentration 0.0 0.2 0.4 0.6 0.8 1.0 1.2 Ag Cd Cu In Zn 18016014012010080604020 Figure 2 | Concentrations of selected elements in product silicate glasses. Concentrations are normalized to starting concentrations, for a time series performed at 1,300 °C and an oxygen fugacity of 10−7  atm. This oxygen fugacity is about 0.3 logarithmic units below the Ni–NiO buffer. The order of volatility is Cd >​ Ag >​ Cu >​ In >​ Zn, in marked contrast to the anticipated relative volatilities from the condensation temperatures of Fig. 1. Error bars, 1 s.d. The open circle indicates the starting point for all elements; curves are arbitrary ‘by eye’ fits. log(fO2 ) –14 100 10–1 10–2 10–3 Ag Bi Cd Cr Cu Ga Ge In Pb Sb Sn Tl Zn Volatilityfactor Fe–FeO Ni–NiO –13 –12 –11 –10 –9 –8 –7 –6 Figure 3 | Volatility factors as a function of oxygen fugacity. These experiments were performed at 1,300 °C. Volatility factors were calculated from the ratios of initial to final concentrations of the elements after 60-min reaction in the constantly stirred melt. Indicative error bars (left) of ±​10% and ±​20% are greater than 1 s.d. for virtually all elements and conditions (see text). © 2017 Macmillan Publishers Limited, part of Springer Nature. All rights reserved.
  • 3. 2 8 s e p t e m b e r 2 0 1 7 | V O L 5 4 9 | N A T U RE | 5 0 9 Letter RESEARCH To compare volatile loss from the silicate melt for each element, we define a ‘volatility factor’ FM of trace element M to be the final concen- tration of the trace element divided by the initial concentration in the starting mixture. Low values correspond to high volatility. To determine the relative volatilities of the elements and their dependence on oxygen fugacity, it was necessary to fix the time during the ­experiment at which volatility factors were compared. This time must be one at which most elements exhibit some volatility and at which the order of the elements when ranked by volatility is unchanging with time. It must not be so long that some of the elements of interest are no longer detectable by our analytical method. From Fig. 2 it is clear that the correct volatility order is established in 10–30 min and that some elements are almost completely lost after 3 h, even at the relatively oxidizing flog( )O2 value of −​7. Given these constraints, we opted to compare volatility factors after 60 min. This was simply a convenient time and was not chosen with any particular hypothesis in mind. All of the volatility factors shown in Fig. 3 therefore refer to experiments of 60-min duration. The volatility factors of trace elements are plotted against oxygen fugacity in Fig. 3. There is a clear increase in volatility with decreasing oxygen fugacity, indicating that the gas species are more reduced than the oxide species in the melt. In young solar systems, the nebular H2-rich gas is believed to disperse after about 3 Myr (ref. 26), meaning that, thereafter, the conditions of melting induced by radioactive decay and impacts are set by the solid silicate and metal components equilibrated within the planetary or protoplanetary body. In the case of Earth, Mars and Vesta, the oxygen fugacity imposed by core–mantle equilibrium would be in the range 1–3 logarithmic units below Fe–FeO equilibrium14,27 . This means that at 1,300 °C oxygen fugacities of 10−11 –10−13  atm would be ­appropriate for estimating volatilities from molten or partially molten silicate ­bodies undergoing core formation. Under these conditions, as shown in Fig. 3, In is less volatile than Cu, Zn, Pb and Ag, all of which have higher condensation temperatures (Fig. 1). The principal reason for this result is that solar gases have high concentrations of H2S and H2O, and In has stable gaseous S and OH species (InS, In2S and InOH), which stabilize it in the gas phase. These gas species are absent from our experiments. Their presence in a solar gas nevertheless provides a clue to the origin of the In ‘anomaly’. This anomaly is readily explained if the ­moderately volatile element contents of the silicate Earth were established by melt–vapour reactions during melting after the disappearance of the nebular gas. Such reactions might reasonably have been established on small precursor bodies for which gravitational escape would have been ­possible or conceivably during the Moon-forming impact when instabilities in the silicate vapour may have induced substantial loss of the Earth–Moon atmosphere17 . In Fig. 4 we plot the silicate Earth abundances of the elements that we have studied against volatility factors under conditions of 1,300 °C and flog( )O2  =​ −​13 and −​11. As can be seen, the pattern of depletion agrees closely with the volatility factors that we measured under ­conditions appropriate for core formation on precursor bodies and Earth. In, Cu and Zn all have similar volatilities, consistent with their similar relative abundances in the silicate Earth, whereas Sn is more volatile and Cd, Ag and Ge much more volatile than Zn, also consistent with their relative abundances. The plateau in abundance for low ­volatility factors in Fig. 4 are at abundances close to 1%. This value implies that low concentrations have been augmented by a chondritic component believed to have delivered 2% ±​ 1% of Earth’s C, H and some noble gases28 and/or the ‘late veneer’, which delivered approxi- mately 0.5% of Earth’s highly siderophile elements after core formation ceased29 . In conclusion, we have shown that the pattern of volatile element abundance in the silicate Earth (Fig. 4) is much more consistent with measured volatilities from silicate melt at low oxygen fugacities than it is with volatilities (condensation temperatures) in a solar gas (Fig. 1). The data strongly suggest that the pattern of volatile element ­depletion was established by melt–vapour reaction (evaporation and re-­condensation) in the absence of the reducing nebular gas. We ­envisage these processes taking place on small molten precursor ­bodies where gravitational escape of volatiles is likely, or possibly in the Earth– Moon system after the giant impact. Online Content Methods, along with any additional Extended Data display items and Source Data, are available in the online version of the paper; references unique to these sections appear only in the online paper. received 8 February; accepted 4 July 2017. 1. Palme, H. & O’Neill, H. in Treatise on Geochemistry Vol. 3, Ch. 1, 1–39 (Elsevier, 2014). 2. O’Neill, H. S. The origin of the Moon and the early history of the Earth—a chemical model. Part 2: the Earth. Geochim. Cosmochim. Acta 55, 1159–1172 (1991). 3. Schönbächler, M., Carlson, R. W., Horan, M. F., Mock, T. D. & Hauri, E. H. Heterogeneous accretion and the moderately volatile element budget of Earth. Science 328, 884–887 (2010). 4. Wang, Z. C., Laurenz, V., Petitgirard, S. & Becker, H. Earth’s moderately volatile element composition may not be chondritic: evidence from In, Cd and Zn. Earth Planet. Sci. Lett. 435, 136–146 (2016). 5. Witt-Eickschen, G., Palme, H., O’Neill, H. S. C. & Allen, C. M. The geochemistry of the volatile trace elements As, Cd, Ga, In and Sn in the Earth’s mantle: new evidence from in situ analyses of mantle xenoliths. Geochim. Cosmochim. Acta 73, 1755–1778 (2009). 6. Canup, R. M. & Asphaug, E. Origin of the Moon in a giant impact near the end of the Earth’s formation. Nature 412, 708–712 (2001). 7. Wang, K. & Jacobsen, S. B. Potassium isotopic evidence for a high-energy giant impact origin of the Moon. Nature 538, 487–490 (2016). 10–1 10–2 10–3 10–2 10–1 10010–1 100 10–2 Volatility factor Volatility factor Ag Bi Cd Cr Cu Ga Ge In Pb Sb Sn Tl Zn Ag Tl Late veneer Increasing volatility Normalizedconcentration Figure 4 | Concentrations in the bulk silicate Earth plotted as a function of measured volatility factors. These experiments were performed at 1,300 °C and at flog( )O2  =​ −​11 (left) and flog( )O2  =​ −​13 (right). Concentrations are given relative to concentrations in CI chondrite meteorites1 (normalized to a concentration ratio of Mg of 1.0). Vertical error bars are as in Fig. 1. Horizontal error bars are 2 standard errors. The line labelled ‘late veneer’ refers to the region in which the late addition of approximately 0.5% of chondritic material could have increased the concentrations of the most volatile elements. © 2017 Macmillan Publishers Limited, part of Springer Nature. All rights reserved.
  • 4. 5 1 0 | N A T U RE | V O L 5 4 9 | 2 8 s e p t e m b e r 2 0 1 7 LetterRESEARCH 8. Paniello, R. C., Day, J. M. D. & Moynier, F. Zinc isotopic evidence for the origin of the Moon. Nature 490, 376–379 (2012). 9. Kleine, T. et al. Hf-W chronology of the accretion and early evolution of asteroids and terrestrial planets. Geochim. Cosmochim. Acta 73, 5150–5188 (200). 10. Moynier, F. et al. Planetary-scale strontium isotopic heterogeneity and the age of volatile depletion of early Solar System materials. Astrophys. J. 758, 45 (2012). 11. Roszjar, J. et al. Prolonged magmatism on 4 Vesta inferred from Hf-W analyses of eucrite zircon. Earth Planet. Sci. Lett. 452, 216–226 (2016). 12. C´uk, M., Hamilton, D. P., Lock, S. J. & Stewart, S. T. Tidal evolution of the Moon from a high-obliquity, high-angular-momentum Earth. Nature 539, 402–406 (2016). 13. Li, J. & Agee, C. B. Geochemistry of mantle–core differentiation at high pressure. Nature 381, 686–689 (1996). 14. Wade, J. & Wood, B. J. Core formation and the oxidation state of the Earth. Earth Planet. Sci. Lett. 236, 78–95 (2005). 15. Rubie, D. C. et al. Accretion and differentiation of the terrestrial planets with implications for the compositions of early-formed Solar System bodies and accretion of water. Icarus 248, 89–108 (2015). 16. Canup, R. M. Simulations of a late lunar-forming impact. Icarus 168, 433–456 (2004). 17. Genda, H. & Abe, Y. Modification of a proto-lunar disk by hydrodynamic escape of silicate vapor. Earth Planets Space 55, 53–57 (2003). 18. Tucker, J. M. & Mukhopadhyay, S. Evidence for multiple magma ocean outgassing and atmospheric loss episodes from mantle noble gases. Earth Planet. Sci. Lett. 393, 254–265 (2014). 19. Kato, C., Moynier, F., Valdes, M. C., Dhaliwal, J. K. & Day, J. M. D. Extensive volatile loss during formation and differentiation of the Moon. Nat. Commun. 6, 7617 (2015). 20. Lodders, K. Solar System abundances and condensation temperatures of the elements. Astrophys. J. 591, 1220–1247 (2003). 21. Wasson, J. T. & Kallemeyn, G. W. Compositions of chondrites. Phil. Trans. R. Soc. Lond. A 325, 535–544 (1988). 22. Wood, B. J., Kiseeva, E. S. & Mirolo, F. J. Accretion and core formation: the effects of sulfur on metal–silicate partition coefficients. Geochim. Cosmochim. Acta 145, 248–267 (2014). 23. McDonough, W. F. & Sun, S.-s. The composition of the Earth. Chem. Geol. 120, 223–253 (1995). Acknowledgements This research was supported by grants from the European Research Council (267764) and the Science and Technology Facilities Council (UK) to B.J.W. and a Studentship to C.A.N. from the STFC. We thank D. Dingwell and his group in Munich for advice on furnace design and G. Fitton (Edinburgh) for donating the basalt. Author Contributions C.A.N. constructed the furnace, performed the experiments and analyses, and contributed to writing the manuscript. B.J.W. conceived the project, provided guidance and wrote a substantial part of the manuscript. Author Information Reprints and permissions information is available at www.nature.com/reprints. The authors declare no competing financial interests. Readers are welcome to comment on the online version of the paper. Publisher’s note: Springer Nature remains neutral with regard to jurisdictional claims in published maps and institutional affiliations. Correspondence and requests for materials should be addressed to B.J.W. (bernie.wood@earth.ox.ac.uk). Reviewer Information Nature thanks S. Jacobsen, F. Moynier and E. Young for their contribution to the peer review of this work. 24. Mills, N. M., Agee, C. B. & Draper, D. S. Metal–silicate partitioning of cesium: implications for core formation. Geochim. Cosmochim. Acta 71, 4066–4081 (2007). 25. Wood, B. J., Bryndzia, L. T. & Johnson, K. E. Mantle oxidation state and its relationship to tectonic environment and fluid speciation. Science 248, 337–345 (1990). 26. Evans, N. J. II et al. The Spitzer c2d legacy results: star-formation rates and efficiencies; evolution and lifetimes. Astrophys. J. Suppl. Ser. 181, 321–350 (2009). 27. Righter, K. & Drake, M. J. Core formation in Earth’s Moon, Mars, and Vesta. Icarus 124, 513–529 (1996). 28. Marty, B. The origins and concentrations of water, carbon, nitrogen and noble gases on Earth. Earth Planet. Sci. Lett. 313–314, 56–66 (2012). 29. Wang, Z. C. & Becker, H. Ratios of S, Se and Te in the silicate Earth require a volatile-rich late veneer. Nature 499, 328–331 (2013). © 2017 Macmillan Publishers Limited, part of Springer Nature. All rights reserved.
  • 5. Letter RESEARCH 30. Dingwell, D. B., O’Neill, H. S. C., Ertel, W. & Spettel, B. The solubility and oxidation state of nickel in silicate melt at low oxygen fugacities: results using a mechanically assisted equilibration technique. Geochim. Cosmochim. Acta 58, 1967–1974 (1994). 31. Deines, P., Nafziger, R. H., Ulmer, G. C. & Woermann, E. Temperature–oxygen fugacity tables for selected gas mixtures in system C–H–O at one atmosphere total pressure. Metall. Trans. B 7, 143 (1976). 32. Jochum, K. P. et al. MPI-DING glasses: new geological reference materials for in situ Pb isotope analysis. Geochem. Geophys. Geosyst. 6, Q10008 (2005). 33. Jochum, K. P. et al. GeoReM: a new geochemical database for reference materials and isotopic standards. Geostand. Geoanal. Res. 29, 333–338 (2005). 34. Griffin, W. L., Powell, W. J., Pearson, N. J. & O’Reilly, S. Y. GLITTER: data reduction software for laser ablation ICP–MS. In Laser Ablation ICP–MS in the Earth Sciences: Current Practices and Outstanding Issues (ed. Sylvestor, P.) 308–311 (Mineralogical Association of Canada, Short Course Series Vol. 40, 2008). Methods To directly measure the loss of volatile elements to the vapour phase, we ­constructed a 1-atm gas mixing furnace with stirring apparatus. This device is capable of stirring a 4.5-cm3 crucible of silicate melt at temperatures up to 1,700 °C. In situ stirring mechanisms have previously30 been integrated into gas-mixing ­furnaces, but our design features an entirely gas-tight assembly and a rapid quenching mechanism. The furnace tube is made from high-purity alumina with heating elements of molybdenum disilicide. The crucible and stirrer mechanism are made of high-purity nickel. The purity of the nickel was verified by LA-ICP-MS (see Methods section ‘Analysis’) to contain <​3 μ​g g−1 of the trace elements of interest, except for Cu, which was slightly elevated at 30 μ​g g−1 but still well below the concentration in the sample. Experiments were quenched in a water bath upon conclusion. The starting material was made from natural basalt dredged from Reykjanes Ridge, Iceland, crushed in a Fritsch steel-jaw rock crusher before being ground to a fine grey powder using a Tema agate disk mill. To ensure a sufficient supply of material, approximately 500 g of material was crushed. A trace element mixture was formulated to target final compositions of 300–500 μ​g g−1 per element, weighed out from reagent-grade oxide powders. The trace element mixture was ground with a quarter of the powdered basalt in an agate mortar. The remainder of the basalt was added in three stages and ground together with the initial mixtures in a large agate mortar. In total, 60 g of the starting material was prepared and stored in a desiccator to maintain dryness. To determine the trace element composition of the starting mixture, a portion of sample was melted and quenched to a glass in a high-pressure piston cylinder experiment. This experiment was run at 1.5 GPa and 1,500 °C in a graphite capsule for 5 min. The product was mounted in acrylic, ground and polished with diamond paste before analysis by EDS and LA-ICP-MS (see below for analytical method). The composition of the starting mixture is shown in Extended Data Tables 1 and 2. Volatile-loss experiments were performed at 1,300 °C and a range of flog( )O2 values from −​7 to −​13. The oxygen fugacity of the experiments was controlled using a constant CO/CO2 gas mixture, apportioned according to the tables in ref. 31. We verified the oxygen fugacity before and after each experiment using a solid zirconia potentiometric oxygen sensor. For each experiment, 3 g of material was weighed out, pressed into a 12-mm-­ diameter pellet with a 10-t press and placed inside the crucible. The crucible is keyed into the top of an alumina pedestal, which is inserted into the hot furnace from below. A second key between the pedestal and the base of the furnace ensures that the crucible resists the turning moment from the stirrer. The assembly takes 1–2 min to come to temperature, with the sample melting at around 1,250 °C. The stirrer was inserted from above, penetrating the molten sample by ­approximately 8 mm, and the furnace sealed. The stirrer was driven with a d.c. motor via a pulse-width modulated motor controller. At 20% output power, the stirrer rotates ­constantly at 30 r.p.m. All experiments used the same stirring rate. At the end of the experiment, the stirrer was stopped and a trapdoor in the bottom of the furnace opened, allowing the pedestal and assembly to fall freely into a water bath. All of the experiments presented as a mass of homogenous black glass ­containing no observable gas bubbles. Most samples filled at least half of the 4.5-cm3 crucible, with a small amount of material fracturing and breaking free into the water bath. Analysis of any loose shards showed the same composition as the primary mass of sample. The samples were mounted in acrylic resin, ground and polished with diamond paste before analysis. Analysis. Samples were imaged using an FEI Quanta FEG 650 SEM and analysed using on Oxford X-MaxN standardless EDS from Oxford Instruments mounted on the same instrument. Analysis was performed at 20 kV with a focused spot (diameter of <​1 μ​m) and 3-nA beam current, measured by an absorbed current meter attached to the sample stage. All of the standardless analyses of these basaltic glass samples were checked for accuracy against the secondary glass standards GSE-1G, GSD-1G and GSC-1G32,33 , and against MPI Ding basaltic glasses before each analytical session. All of the experiments showed major element compositions (see Extended Data Table 1) that were uniform to within the precision of the analysis. In all of the samples, the only change in major element composition was a variation in nickel concentration of the melt, ranging from 0.2% to 2.56% NiO. If the nickel content is removed and the remaining fraction normalized to 100%, then the composition remains unchanged. Trace element analysis was performed by LA-ICP-MS with a 213-nm Nd:YAG laser (New Wave Research) and ‘large format’ cell connected to a Perkin Elmer NexION 400Q ICP. The ICP was tuned for stability, minimal mass bias (U/Th ≈​ 1.1 on SRM NIST610) and oxide production (ThO/Th <​ 0.2%), with a ­typical ­nebulizer gas flow of 450 ml min−1 and constant helium flow of 800 ml min−1 . The USGS basaltic glass standard GSE-1G was used as a ­primary calibration ­standard, with 43 Ca as the internal standard, standard-sample ­bracketing and data reduction by Glitter34 . The laser was fired at 5 Hz with a 50-μ​m round spot, 4 J cm−2 of on-sample fluence, and scanned at 3 μ​m s−1 over 180 μ​m for 60 s of signal. Between samples the cell was allowed to washout for 120 s. A 20-s gas blank was collected before each ablation, and standards were sampled every 45 min. The following isotopes were measured for quantification of each element: 107 Ag, 209 Bi, 111 Cd, 53 Cr, 65 Cu, 71 Ga, 74 Ge, 115 In, 95 Mo, 208 Pb, 121 Sb, 118 Sn, 203 Tl, 51 V, 182 W and 66 Zn. A small (<​0.1%) overlap correction was applied for 115 Sn on 115 In. The detection limit for most elements was below 0.1 μ​g g−1 , which was more than adequate for quantification of these samples, with all concentrations (see Extended Data Table 2) well above the detection limit. To assess variations in the trace element composition of the melt, the laser was scanned at random locations across the exposed surface of the glass. All of the results show excellent trace element homogeneity. In the experiments performed at more reducing conditions, nickel blebs formed in the glass and were inadvertently sampled by the laser. Any signals from nickel blebs were discarded in the analysis. Laser tracks were ablated perpendicular to the accessible surface of the glass. With a 40-μ​m spot it was possible to detect quantitative changes in the trace ­element composition. At this spatial resolution there was no observable change in the composition of any trace element at the surface of the melt, indicating that the stirring mechanism worked as designed and provided a continuous turnover of material throughout the experiment. As well as nickel migrating into the melt, the nickel capsule absorbed small amounts of some trace elements. To assess the magnitude of this loss, several LA-ICP-MS scans were performed from the glass into the neighbouring crucible. These scans show a small diffusion profile for some elements (Ag, Bi, Cu, In and Sb), extending up to a maximum distance of 200 μ​m into the crucible. The effect of this diffusion would be to artificially enhance the perceived volatile loss of those elements. We attempted to quantify this effect, and our assessment is that a worst- case 200-μ​m ‘rind’ of enriched material on the inside of the crucible can equate to no more than 5% of the total volume of the melt. As such, diffusion into the capsule material can be neglected in these experiments. Results. Over the duration of each experiment, volatile elements partition into the gas phase and are flushed from the furnace by the constant stream of CO and CO2 gas. Owing to the stirring mechanism, the surface of the melt is continuously replenished and diffusion of the element in the melt can be neglected. The longer the duration of the experiment, the more of each element is lost to the vapour phase. As shown in Fig. 2, the relative degrees of volatile loss do not change with time. To quantitatively assess the volatile loss, the volatility factor is defined as the concentration at the end of the experiment divided by the starting ­concentration. In this study, the 60-min duration was chosen to achieve measurable depletion for the entire range of elements. Experiments were performed at a range of time dura- tions at flog( )O2  =​ −​7, and at 60 min for flog( )O2  =​ −​9, −​11 and −​13. The com- positions of each experiment are shown in Extended Data Tables 1 and 2. Data availability. All data supporting the findings of this study are available within the paper and its Extended Data. Source Data for Figs 1–4 are available in the online version of the paper. © 2017 Macmillan Publishers Limited, part of Springer Nature. All rights reserved.
  • 6. LetterRESEARCH Extended Data Table 1 | Major element compositions (in wt %) of starting material (EBT1) and product glasses from experiments F006 to F019 1σ refers to 1 standard deviation and N to the number of analyses. EBT1 and F006 to F019 are experiment identifiers. © 2017 Macmillan Publishers Limited, part of Springer Nature. All rights reserved.
  • 7. Letter RESEARCH Extended Data Table 2 | Trace element concentrations (in p.p.m.) and standard deviations (σ) of starting material and product glasses based on N analyses © 2017 Macmillan Publishers Limited, part of Springer Nature. All rights reserved.