SlideShare uma empresa Scribd logo
1 de 7
Baixar para ler offline
Name: Hyo Ji Kim 

Enzyme Experiment 


                                     Enzyme Experiment 
Name :  Hyo Ji Kim 
Partners :  Shi Wan and Sandy 
 

Aim :    In  this  experiment,  I  would  like  to  determine  how  the  amount  of  chicken  liver  affect  the 
speed of catalase reaction. The factors might affect the speed of catalase is the amount of chicken 
liver.  This  experiment  will  be  carried  out  by  using  different  amounts  of  chicken  liver  to  measure 
oxygen production in a gas collection cylinder setting. 
 
 
Hypothesis:   If larger amount of chicken liver is used, catalase reaction occurs quicker. Therefore, 
more  oxygen  gas  will  be  produced.  In  contrast,  if  smaller  amount  of  chicken  liver  is  used,  catalase 
reaction occurs slower. Therefore, less oxygen gas will be produced. 


Variables : 
    •   Input Variable :  Amounts of Chicken Liver 

    I  will  change  the  amounts  of  chicken  liver  by  measuring  it  on  the  electronic  balance.  In  this 
    experiment, I chose to experiment 1g, 4g and 7g of chicken liver in all of the three trials. 
 
    • Output Variable :  Amount of Oxygen gas generated on different amount of chicken liver 

    I  will  measure  the  amount  of  oxygen  gas  generated  on  each  of  chicken  liver  weights  that  has 
    been decided. The generated oxygen gas will be measured using gas collection cylinder. 

         
    •   Control Variable : 
         
           1. Amount of Hydrogen peroxide 

    I will keep constant amount of hydrogen peroxide which is 50ml by measuring it in the graduated 
    cornical flask in all trials and all weights of chicken liver. 
     
             2. Concentration of Hydrogen peroxide 
                 
    I will keep similar concentration of hydrogen peroxide which is 1% in all trials and all weights of 
    chicken liver. 
              
             3. Time to measure oxgen gas observation 

  I will keep the observation time of gas collection constant by using a stopwatch and setting it to 3 
  minutes observation time in all trials and all weights of chicken liver. 


Equipments : 
     •   Forceps / Tweezers 
     •   Scalpel 
     •   Petri Dish 
     •   3 x 100ml Cornical flasks 
     •   1 stopwatch 
     •   50ml x 9 (for 3 trials and 3 different weights of chicken liver) = 450ml 1% Hydrogen peroxide 
     •   16g x 3 (for 3 trials) = 48g chicken liver 
     •   Disposable dropper 
     •   Electronic balance 
     •   Gas collection cylinder 
     •   Gas collection tube with cork 


Diagram : 


Method : 
  1.    Prepare  gas  collection  tube  set  up  according  to  the  diagram  given.  The  set  up  includes  gas 
collection cylinder and gas collection tube which is attached to the cork that could be 
fitted to the cornical flask. 
           
  2.  Prepare 3 amounts of chicken liver using the electronic balance scale. The weights should be 1g, 
4g and 7g. 
 
3.  Add 50 ml of 1% Hydrogen peroxide in the cornical flask.
  
4.  Put the measured 1 g chicken liver in the cornical flask. 
           
  5.  Quickly cork the cornical flask with the gas collection set up. 
 
  6.  Set 3 minutes in the stopwatch for gas collection time. 
           
  7.  Record how much oxygen gas was collected in the gas collection cylinder after 3 minutes. 
           
  8.  Repeat step 3 but using 4g of chicken liver. Do step 4, 5 and 6. 
           
  9.  Repeat step 3 but using 7g of chicken liver. Do step 4, 5 and 6. 
           
  10.  Repeat step 1 to 8 for second and third trials. 


Data Table : 
Table 1 : Amount of liver verses Amount of Oxygen produced 

                                                            Oxygen gas produced for 3 minutes (cm3) 

    Amount of liver (g)  Trial 1                                             Trial 2       Trial 3        Average 

    1.0                                                     12.0             13.0          17.0           14.0 

    4.0                                                     21.0             26.0          31.0           22.7 

    7.0                                                     32.0             41.0          49.0           40.7 


Graph : 

                                                   Graph 1: Amount of Liver vs 
                                                   Amount of Oxgen produced 
    Amount of Oxgen produced (cm3) 


                                      50 
                                      40 
                                      30 
                                      20 
                                      10 
                                       0 
                                            0.0      1.0       2.0    3.0        4.0    5.0     6.0    7.0        8.0 
                                                                      Amount of Liver (g) 


Conclusion :
       Our group's data is reliable for two reasons. First of all, we had precise measurements of 1g, 
4g and 7g. We set the electronic balance as 0g in order to use it and then measured the weights of 
chicken liver. With tweezers and scarpel, we even could take a very small piece of chicken liver out. 
Therefore, we could use exactly 1g, 4g and 7g chicken liver. Furthermore, our group had three trials 
for investigating with different weights of chicken liver. We repeated the experiment three times and 
always  the  same  pattern  was  discovered  from  the  results.  Having  precise  measurements  and 
repeating the experiment helped our group to get more reliable data. 

         Our  group’s  hypothesis  "more  liver  is  used,  the  more  oxygen  gas  will  be  generated" was 
correct. Liver was made up of proteins and thus it worked as enzyme in the catalase reaction. In this 
experiment, catalse in the chicken liver created bubbles and produced oxygen gas when mixed with 
hydrogen peroxide. As a result, during enzyme reaction, the more liver was used, the more oxygen 
gas was generated. In fact, the hypothesis was proved from the results in the data table above. On 
average, 1g chicken liver produced 14ml oxygen gas. 4g chicken liver generated 22.7ml oxygen gas 
on  average.  Most  massively,  7g  chicken  liver  created  the  average  of  40.7ml  oxygen  gas.  This  data 
simply showed that the amount of liver affect the amount of oxygen gas produced. Catalase reaction 
occurred  quicker  when  we  used  larger  amount  of  chicken  liver.  As  a  result,  more  oxygen  gas  was 
produced.  In  contrast,  catalase  reaction  occurred  slower  when  we  used  smaller  amount  of  chicken 
liver.  Consequently,  less  oxygen  gas  was  produced. Therefore,  our  group  made  the  correct 
hypothesis.


Evaluation :
 
             Our  group  had  not  done  the  experiment  well  for  three  errors.  First  of  all,  we  didn't  use  the 
accurate amount of 50ml Hydrogen peroxide for each trial. The 100ml cornical flasks we got didn't 
have the graduation of 50ml, so we estimated 50ml by the middle of the space between 40ml and 
60ml. Therefore, the amount of 1% Hydrogen peroxide was not all the same 50ml in each trial. This 
was the problem because the amount of Hydrogen peroxide would affect to the amount of oxygen 
gas produced from the liver. When more amount of Hydrogen peroxide was used, it would interrupt 
liver to generate oxygen gas. Thus, the error of having different amount of 50ml Hydrogen peroxide 
could affect to the whole experiment. Furthermore, the cornical flasks we had were too big that the 
cork  attached  to  the  gas  collection  tube  couldn't  stick.  This  would  be  a  big  problem  unless  we 
changed  to  other  shape  of  cornical  flasks  because  oxygen  gas  would  evaporate  to  the  air.  The 
amount  of  oxygen  gas  produced  from  different  amount  of  chicken  liver  could  be  decreased. 
Therefore, the error of having big cornical flasks would cause a big problem to the experiment. Most 
importantly, there was a failure of trial which used 10g chicken liver. 10g chicken liver produced great 
amount of oxygen gas. Finally, a piston went out from the gas collection cylinder despite 3 minutes 
didn’t  pass  yet.  We  couldn’t  measure  the  amount  of  oxygen  gas  that    10g  chicken  liver  could 
generate. Therefore, we should rearrange both 5g and 10g chicken liver to 4g and 7g.  Thus, we cut 4g 
and 7g chicken liver and did the experiment again, which wasted time. As a result, the error of setting 
10g chicken liver influenced to the entire experiment.  
 
            The experiment could improve in two ways. First of all, our group could have 3 gas collection set 
up for each weight. This would be very clear to see the difference and will make the experiment going 
faster. Moreover, our group could use already measured chicken liver. This would insure precision in 
measurements  and  will  make  our  data  more  reliable.  Furthermore,  our  grup  could  get  smaller 
cornical flasks or get bigger cork attached to the gas collection tube. This would keep the oxygen gas 
produced  from  chicken  liver,  so  we  could  correctly  observe  the  investigation  and  have  the  right 
results. At last, we could get cornical flasks that had 50ml graduation. This would make the amount 
of  Hydrogen  peroxide  constant,  so  chicken  liver  wouldn’t  be  interrupted  to  cause  catalase reaction 
and generate oxygen gas. 
 
 
      For other experiments related to this investigation, we could change : 

   ‐   The type of liver 
   ‐   The concentration of hydrogen peroxide 
   ‐   The temperature of hydrogen peroxide 
   ‐   The time of collecting oxygen gas. 

Mais conteúdo relacionado

Semelhante a Catalase hyoji

Yeast cellular respiration lab report (karen krmoyan) (1)
Yeast cellular respiration lab report (karen krmoyan) (1)Yeast cellular respiration lab report (karen krmoyan) (1)
Yeast cellular respiration lab report (karen krmoyan) (1)Mariam Ohanyan
 
Enzyme experiment
Enzyme experimentEnzyme experiment
Enzyme experimentimdoldoli
 
Data logging (rate of reaction)
Data logging (rate of reaction)Data logging (rate of reaction)
Data logging (rate of reaction)Syafiqah Razale
 
Catalase simon
Catalase simonCatalase simon
Catalase simonhunny1126
 
Catalase simon
Catalase simonCatalase simon
Catalase simonhunny1126
 
A Systemic Study of Chitin Digestion Protocols
A Systemic Study of Chitin Digestion ProtocolsA Systemic Study of Chitin Digestion Protocols
A Systemic Study of Chitin Digestion ProtocolsArjuna Karikaran
 
Irp 3 cell respiration
Irp 3   cell respirationIrp 3   cell respiration
Irp 3 cell respirationRaeAnneSmith
 
5.3 enzymes- igcse-cie-biology--ext-theory-qp
5.3 enzymes- igcse-cie-biology--ext-theory-qp5.3 enzymes- igcse-cie-biology--ext-theory-qp
5.3 enzymes- igcse-cie-biology--ext-theory-qpyasminexxy1
 
1 Objectives • Measure carbon dioxide evolution and .docx
 1 Objectives •  Measure carbon dioxide evolution and .docx 1 Objectives •  Measure carbon dioxide evolution and .docx
1 Objectives • Measure carbon dioxide evolution and .docxjoyjonna282
 
Effect of increasing concentration of ethanol on the catabolism of protein
Effect of increasing concentration of ethanol on the catabolism of proteinEffect of increasing concentration of ethanol on the catabolism of protein
Effect of increasing concentration of ethanol on the catabolism of proteinAnkitha Nikesh
 

Semelhante a Catalase hyoji (20)

Satalase eun jeong
Satalase eun jeongSatalase eun jeong
Satalase eun jeong
 
Yeast cellular respiration lab report (karen krmoyan) (1)
Yeast cellular respiration lab report (karen krmoyan) (1)Yeast cellular respiration lab report (karen krmoyan) (1)
Yeast cellular respiration lab report (karen krmoyan) (1)
 
Chemistry Lab Report 1
Chemistry Lab Report 1Chemistry Lab Report 1
Chemistry Lab Report 1
 
Enzyme experiment
Enzyme experimentEnzyme experiment
Enzyme experiment
 
Data logging (rate of reaction)
Data logging (rate of reaction)Data logging (rate of reaction)
Data logging (rate of reaction)
 
Catalase simon
Catalase simonCatalase simon
Catalase simon
 
Catalase simon
Catalase simonCatalase simon
Catalase simon
 
Liver prac
Liver pracLiver prac
Liver prac
 
Enzyme activity
Enzyme activityEnzyme activity
Enzyme activity
 
Liver prac
Liver pracLiver prac
Liver prac
 
Liver prac
Liver pracLiver prac
Liver prac
 
A Systemic Study of Chitin Digestion Protocols
A Systemic Study of Chitin Digestion ProtocolsA Systemic Study of Chitin Digestion Protocols
A Systemic Study of Chitin Digestion Protocols
 
Irp 3 cell respiration
Irp 3   cell respirationIrp 3   cell respiration
Irp 3 cell respiration
 
Ugi Poster_for_Open_House
Ugi Poster_for_Open_HouseUgi Poster_for_Open_House
Ugi Poster_for_Open_House
 
5.3 enzymes- igcse-cie-biology--ext-theory-qp
5.3 enzymes- igcse-cie-biology--ext-theory-qp5.3 enzymes- igcse-cie-biology--ext-theory-qp
5.3 enzymes- igcse-cie-biology--ext-theory-qp
 
Digital Lab 9
Digital Lab 9Digital Lab 9
Digital Lab 9
 
1 Objectives • Measure carbon dioxide evolution and .docx
 1 Objectives •  Measure carbon dioxide evolution and .docx 1 Objectives •  Measure carbon dioxide evolution and .docx
1 Objectives • Measure carbon dioxide evolution and .docx
 
1472750387.pptx
1472750387.pptx1472750387.pptx
1472750387.pptx
 
Biology Lab Report 3
Biology Lab Report 3Biology Lab Report 3
Biology Lab Report 3
 
Effect of increasing concentration of ethanol on the catabolism of protein
Effect of increasing concentration of ethanol on the catabolism of proteinEffect of increasing concentration of ethanol on the catabolism of protein
Effect of increasing concentration of ethanol on the catabolism of protein
 

Mais de Eun Jeong Kim (11)

Fire
FireFire
Fire
 
P.p design production
P.p design productionP.p design production
P.p design production
 
P.p design production
P.p design productionP.p design production
P.p design production
 
Shakespeare's works pt
Shakespeare's works ptShakespeare's works pt
Shakespeare's works pt
 
Ej7 0001
Ej7 0001Ej7 0001
Ej7 0001
 
Ej7 0001
Ej7 0001Ej7 0001
Ej7 0001
 
Ej7 0003
Ej7 0003Ej7 0003
Ej7 0003
 
Ej7 0002
Ej7 0002Ej7 0002
Ej7 0002
 
Ej7 0001
Ej7 0001Ej7 0001
Ej7 0001
 
Visiting+dong po+village 1
Visiting+dong po+village 1Visiting+dong po+village 1
Visiting+dong po+village 1
 
The world is flat
The world is flatThe world is flat
The world is flat
 

Catalase hyoji

  • 2.         Enzyme Experiment  Name :  Hyo Ji Kim  Partners :  Shi Wan and Sandy    Aim :    In  this  experiment,  I  would  like  to  determine  how  the  amount  of  chicken  liver  affect  the  speed of catalase reaction. The factors might affect the speed of catalase is the amount of chicken  liver.  This  experiment  will  be  carried  out  by  using  different  amounts  of  chicken  liver  to  measure  oxygen production in a gas collection cylinder setting.      Hypothesis:   If larger amount of chicken liver is used, catalase reaction occurs quicker. Therefore,  more  oxygen  gas  will  be  produced.  In  contrast,  if  smaller  amount  of  chicken  liver  is  used,  catalase  reaction occurs slower. Therefore, less oxygen gas will be produced.        Variables :  • Input Variable :  Amounts of Chicken Liver  I  will  change  the  amounts  of  chicken  liver  by  measuring  it  on  the  electronic  balance.  In  this  experiment, I chose to experiment 1g, 4g and 7g of chicken liver in all of the three trials. 
  • 3.   • Output Variable :  Amount of Oxygen gas generated on different amount of chicken liver  I  will  measure  the  amount  of  oxygen  gas  generated  on  each  of  chicken  liver  weights  that  has  been decided. The generated oxygen gas will be measured using gas collection cylinder.    • Control Variable :    1. Amount of Hydrogen peroxide  I will keep constant amount of hydrogen peroxide which is 50ml by measuring it in the graduated  cornical flask in all trials and all weights of chicken liver.    2. Concentration of Hydrogen peroxide    I will keep similar concentration of hydrogen peroxide which is 1% in all trials and all weights of  chicken liver.    3. Time to measure oxgen gas observation  I will keep the observation time of gas collection constant by using a stopwatch and setting it to 3  minutes observation time in all trials and all weights of chicken liver.        Equipments :    •   Forceps / Tweezers    •   Scalpel    •   Petri Dish    •   3 x 100ml Cornical flasks    •   1 stopwatch    •   50ml x 9 (for 3 trials and 3 different weights of chicken liver) = 450ml 1% Hydrogen peroxide    •   16g x 3 (for 3 trials) = 48g chicken liver    •   Disposable dropper    •   Electronic balance    •   Gas collection cylinder    •   Gas collection tube with cork       
  • 4. Diagram :      Method :    1.    Prepare  gas  collection  tube  set  up  according  to  the  diagram  given.  The  set  up  includes  gas  collection cylinder and gas collection tube which is attached to the cork that could be  fitted to the cornical flask.      2.  Prepare 3 amounts of chicken liver using the electronic balance scale. The weights should be 1g,  4g and 7g.    3.  Add 50 ml of 1% Hydrogen peroxide in the cornical flask.    4.  Put the measured 1 g chicken liver in the cornical flask.      5.  Quickly cork the cornical flask with the gas collection set up.      6.  Set 3 minutes in the stopwatch for gas collection time.      7.  Record how much oxygen gas was collected in the gas collection cylinder after 3 minutes.      8.  Repeat step 3 but using 4g of chicken liver. Do step 4, 5 and 6.      9.  Repeat step 3 but using 7g of chicken liver. Do step 4, 5 and 6.   
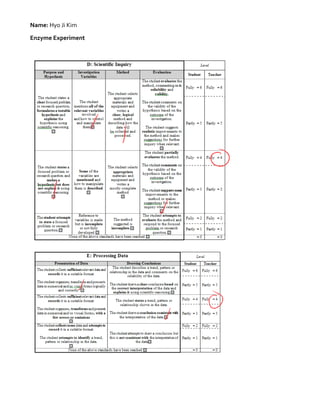
  • 5.   10.  Repeat step 1 to 8 for second and third trials.      Data Table :  Table 1 : Amount of liver verses Amount of Oxygen produced    Oxygen gas produced for 3 minutes (cm3)  Amount of liver (g)  Trial 1  Trial 2  Trial 3  Average  1.0  12.0  13.0  17.0  14.0  4.0  21.0  26.0  31.0  22.7  7.0  32.0  41.0  49.0  40.7        Graph :  Graph 1: Amount of Liver vs  Amount of Oxgen produced  Amount of Oxgen produced (cm3)  50  40  30  20  10  0  0.0  1.0  2.0  3.0  4.0  5.0  6.0  7.0  8.0  Amount of Liver (g)        Conclusion : Our group's data is reliable for two reasons. First of all, we had precise measurements of 1g,  4g and 7g. We set the electronic balance as 0g in order to use it and then measured the weights of  chicken liver. With tweezers and scarpel, we even could take a very small piece of chicken liver out. 
  • 6. Therefore, we could use exactly 1g, 4g and 7g chicken liver. Furthermore, our group had three trials  for investigating with different weights of chicken liver. We repeated the experiment three times and  always  the  same  pattern  was  discovered  from  the  results.  Having  precise  measurements  and  repeating the experiment helped our group to get more reliable data.  Our  group’s  hypothesis  "more  liver  is  used,  the  more  oxygen  gas  will  be  generated" was  correct. Liver was made up of proteins and thus it worked as enzyme in the catalase reaction. In this  experiment, catalse in the chicken liver created bubbles and produced oxygen gas when mixed with  hydrogen peroxide. As a result, during enzyme reaction, the more liver was used, the more oxygen  gas was generated. In fact, the hypothesis was proved from the results in the data table above. On  average, 1g chicken liver produced 14ml oxygen gas. 4g chicken liver generated 22.7ml oxygen gas  on  average.  Most  massively,  7g  chicken  liver  created  the  average  of  40.7ml  oxygen  gas.  This  data  simply showed that the amount of liver affect the amount of oxygen gas produced. Catalase reaction  occurred  quicker  when  we  used  larger  amount  of  chicken  liver.  As  a  result,  more  oxygen  gas  was  produced.  In  contrast,  catalase  reaction  occurred  slower  when  we  used  smaller  amount  of  chicken  liver.  Consequently,  less  oxygen  gas  was  produced. Therefore,  our  group  made  the  correct  hypothesis. Evaluation :   Our  group  had  not  done  the  experiment  well  for  three  errors.  First  of  all,  we  didn't  use  the  accurate amount of 50ml Hydrogen peroxide for each trial. The 100ml cornical flasks we got didn't  have the graduation of 50ml, so we estimated 50ml by the middle of the space between 40ml and  60ml. Therefore, the amount of 1% Hydrogen peroxide was not all the same 50ml in each trial. This  was the problem because the amount of Hydrogen peroxide would affect to the amount of oxygen  gas produced from the liver. When more amount of Hydrogen peroxide was used, it would interrupt  liver to generate oxygen gas. Thus, the error of having different amount of 50ml Hydrogen peroxide  could affect to the whole experiment. Furthermore, the cornical flasks we had were too big that the  cork  attached  to  the  gas  collection  tube  couldn't  stick.  This  would  be  a  big  problem  unless  we  changed  to  other  shape  of  cornical  flasks  because  oxygen  gas  would  evaporate  to  the  air.  The  amount  of  oxygen  gas  produced  from  different  amount  of  chicken  liver  could  be  decreased.  Therefore, the error of having big cornical flasks would cause a big problem to the experiment. Most  importantly, there was a failure of trial which used 10g chicken liver. 10g chicken liver produced great  amount of oxygen gas. Finally, a piston went out from the gas collection cylinder despite 3 minutes  didn’t  pass  yet.  We  couldn’t  measure  the  amount  of  oxygen  gas  that    10g  chicken  liver  could  generate. Therefore, we should rearrange both 5g and 10g chicken liver to 4g and 7g.  Thus, we cut 4g  and 7g chicken liver and did the experiment again, which wasted time. As a result, the error of setting  10g chicken liver influenced to the entire experiment.                 The experiment could improve in two ways. First of all, our group could have 3 gas collection set  up for each weight. This would be very clear to see the difference and will make the experiment going  faster. Moreover, our group could use already measured chicken liver. This would insure precision in  measurements  and  will  make  our  data  more  reliable.  Furthermore,  our  grup  could  get  smaller  cornical flasks or get bigger cork attached to the gas collection tube. This would keep the oxygen gas 
  • 7. produced  from  chicken  liver,  so  we  could  correctly  observe  the  investigation  and  have  the  right  results. At last, we could get cornical flasks that had 50ml graduation. This would make the amount  of  Hydrogen  peroxide  constant,  so  chicken  liver  wouldn’t  be  interrupted  to  cause  catalase reaction  and generate oxygen gas.            For other experiments related to this investigation, we could change :  ‐ The type of liver  ‐ The concentration of hydrogen peroxide  ‐ The temperature of hydrogen peroxide  ‐ The time of collecting oxygen gas.