Race and Ethnicity in Rural America
•
1 gostou•740 visualizações

Race & Ethnicity in Rural America is the third in a series of Rural Research Notes presenting data and findings from the recently released 2010 Census and American Community Survey (ACS). HAC's Research Note examines racial and ethnic characteristics of rural America, including trends and demographic shifts that have occurred since the 2000 census. This publication includes: -Figures on race and ethnicity in rural America; -An analysis of racial and ethnic minorities in rural and small town areas; -Population growth figures by race and ethicity.

Recomendados
Recomendados
Mais conteúdo relacionado
Mais procurados
Mais procurados (20)
Semelhante a Race and Ethnicity in Rural America
Semelhante a Race and Ethnicity in Rural America (20)
Mais de Housing Assistance Council
Mais de Housing Assistance Council (20)
Último
Último (20)
Race and Ethnicity in Rural America
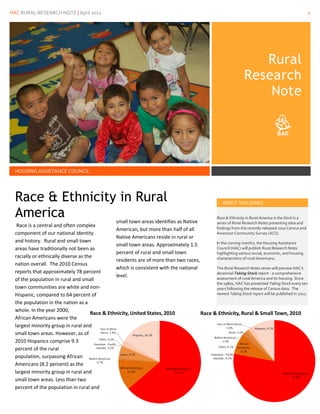
- 1. HAC RURAL RESEARCH NOTE | April 2012 1 Rural Research Note HOUSING ASSISTANCE COUNCIL Rur Race & Ethnicity in Rural ABOUT THIS SERIES America small town areas identifies as Native Race & Ethnicity in Rural America is the third in a series of Rural Research Notes presenting data and Race is a central and often complex findings from the recently released 2010 Census and American, but more than half of all component of our national identity American Community Survey (ACS). Native Americans reside in rural or and history. Rural and small town In the coming months, the Housing Assistance small town areas. Approximately 1.5 areas have traditionally not been as Council (HAC) will publish Rural Research Notes percent of rural and small town highlighting various social, economic, and housing racially or ethnically diverse as the characteristics of rural Americans. residents are of more than two races, nation overall. The 2010 Census which is consistent with the national The Rural Research Notes series will preview HAC’s reports that approximately 78 percent decennial Taking Stock report - a comprehensive level. assessment of rural America and its housing. Since of the population in rural and small the 1980s, HAC has presented Taking Stock every ten town communities are white and non- years following the release of Census data. The Hispanic, compared to 64 percent of newest Taking Stock report will be published in 2012. the population in the nation as a whole. In the year 2000, African Americans were the largest minority group in rural and small town areas. However, as of 2010 Hispanics comprise 9.3 percent of the rural population, surpassing African Americans (8.2 percent) as the largest minority group in rural and small town areas. Less than two percent of the population in rural and
- 2. HAC RURAL RESEARCH NOTE | April 2012 2 Minorities in Rural & Small Town Areas Racial and ethnic minorities Mississippi, and Louisiana. Large struggles, and increased self- comprise a relatively smaller numbers of rural Native Americans determination, the experiences and proportion of rural and small town reside on or near Native American conditions of rural minorities are populations than for the nation as a reservations and trust lands in the often overlooked given their whole. These dynamics are in part a Midwest plains, the Southwest, and relatively small populations. factor of 20th Century demographic Alaska. Moreover, it is often assumed that trends and events. the conditions that led In the “Great to these upheavals Migration,” large numbers of have been addressed. However, for rural African Americans many rural minorities, moved from the South to especially those living in cities in the North and communities that have East. Additionally there large minority has been a tendency for populations, social and recent immigrants to economic conditions settle in urban areas. continue to lag far behind those of their white The location and counterparts and urban concentration of populations overall. minorities in rural areas and small towns often differ from This harsh fact is most apparent in those of the nation as a the housing conditions in which whole. Many rural many rural minorities continue to minorities are live. Housing characteristics for clustered minorities in rural areas are geographically in regions often worse than those for rural closely tied to historical social and whites or all households economic dynamics. For example, nationally. Rural minorities are nearly 9 out of 10 rural and small more likely to live in town African Americans reside in the substandard and cost-burdened Southern region of the United More than half of housing, and are more likely to States. Rural African Americans all rural and small town Hispanics are be poor. The geographic isolation comprise an even larger portion of concentrated in the four states of and relative segregation of rural the population in the southern Texas, California, New Mexico, and minorities living in majority-minority “Black Belt” communities of Arizona. In fact, just under one- census tracts continues to be an Alabama, Georgia, Mississippi, North quarter of all rural and small town important component of poverty Carolina, South Carolina, and Hispanics live in Texas alone. and substandard housing in many Virginia, as well as the Lower Despite advances made through the rural and small town communities. Mississippi Delta states of Arkansas, civil rights movement, labor Many rural minorities are clustered geographically in regions closely tied to historical social and economic dynamics.
- 3. HAC RURAL RESEARCH NOTE | April 2012 3 FAST FACTS 77.8% White Not Hispanics as a percentage of total Rural and Small Town population 1.9 Million Increase in the number of Rural and Small Town Hispanics between 2000 and 2010 53.8% Percent of nation’s Native Americans that reside in Rural and Small Town areas A NOTE ABOUT RACE AND ETHNICITY IN THE CENSUS* Race In the 2010 Census, data on race were derived from answers to the question on race that was asked of all people. The U.S. Census Bureau collects race data in accordance with guidelines provided by the U.S. Office of Management and Budget (OMB). Race data in the Census are based on self-identification. The racial categories included in the Census questionnaire generally reflect a social definition of race recognized in this country and is not an attempt to define race biologically, anthropologically, or genetically. People answering the Census questionnaire could choose to report more than one race to indicate their racial mixture. The primary racial classifications presented by the U.S. Census Bureau include, White, Black or African American, American Indian or Alaska Native, Asian, Native Hawaiian Islander or Other Pacific Islander, Some Other Race, and, Two or More Races. Hispanic Ethnicity Hispanic or Latino refers to persons of Cuban, Mexican, Puerto Rican, South or Central American or other Spanish culture or origin regardless of race. Hispanic origin can be viewed as the heritage, nationality group, lineage, or country of birth of the person or the person’s parents or ancestors before their arrival in the United States. People who identify their origin as Hispanic, Latino, or Spanish may be any race. For the purposes of this Research Note, persons identifying as Hispanic are classified as a distinct ethnic category alongside other racial groups. For more information on race and ethnicity in the 2010 Census please consult the U.S. Census Bureau’s website, http://www.census.gov/prod/cen2010/doc/sf1.pdf. *Portions excerpted from 2010 Census Summary File 1. 2010 Census of Population and Housing. Technical Documentation, SF-1/10-2(RV) June 2011.
- 4. HAC RURAL RESEARCH NOTE | April 2012 4 Minorities Accounted for Three-Quarters of Rural & Small Town Population Growth Population Change by Race & Ethnicity, 2000 to 2010 The population in rural and small In fact, more than half of all rural and town America increased by roughly small town population growth in the 3.5 million between 2000 and 2010. last decade is attributable to However, this population growth Hispanics. ABOUT THE DATA varied widely across racial and ethnic groups. While the White Not There were modest population gains Unless otherwise noted, all data Hispanics comprise nearly 80 among rural African Americans (2.9 presented in this Research Note are percent) and Native Americans (7.5 based on HAC tabulations of the 2010 percent of the rural and small town Census, Summary File -1. population, they made up less than percent). More dramatic population one-quarter of rural population gain. increases occurred among rural and For more information on this Research Note contact the Housing Assistance small town Asians, Native Council One of the more significant Hawaiian/Pacific Islanders and demographic trends in the U.S. over persons of two or more races, all of lance@ruralhome.org the past several decades has been which experienced double digit 202-842-8600 dramatic growth in the Hispanic population gains in the previous population. In rural and small town decade. However, these racial areas the Hispanic population groups still comprise less than 3 increased by 1.9 million or 46 percent of the total rural and small percent between 2000 and 2010. town population. * *Hispanics may be of any race
- 5. HAC RURAL RESEARCH NOTE | April 2012 5
- 6. HAC RURAL RESEARCH NOTE | April 2012 6
- 7. HAC RURAL RESEARCH NOTE | April 2012 7
- 8. HAC RURAL RESEARCH NOTE | April 2012 8
- 9. HAC RURAL RESEARCH NOTE | April 2012 9 RACE & ETHNICITY BY RURAL, SUBURBAN, AND URBAN LOCATION, 2010 Rural & Small Town Suburban & Exurban Urban United States Number Percent Number Percent Number Percent Number Percent POPULATION Total Population 64,901,146 21.0% 151,693,391 49.1% 92,151,001 29.8% 308,745,538 100.0% RACE & ETHNICITY White - Not Hispanic 50,510,698 77.8% 105,718,587 69.7% 40,588,267 44.0% 196,817,552 63.7% African American 5,338,488 8.2% 16,419,093 10.8% 15,928,267 17.3% 37,685,848 12.2% Native American* 1,210,782 1.9% 667,620 0.4% 368,696 0.4% 2,247,098 0.7% Asian 630,530 1.0% 6,340,401 4.2% 7,494,193 8.1% 14,465,124 4.7% Native Hawaiian/Pacific Islander 82,871 0.1% 193,389 0.1% 205,316 0.2% 481,576 0.2% Some other race 54,901 0.1% 252,015 0.2% 297,349 0.3% 604,265 0.2% Two or more races 1,046,836 1.6% 2,853,296 1.9% 2,066,349 2.2% 5,966,481 1.9% Hispanic** 6,026,040 9.3% 19,248,990 12.7% 25,202,564 27.3% 50,477,594 16.3% RACE (Alone - Hispanic Ethnicity Not Included) White 53,715,134 82.8% 116,680,922 76.9% 53,157,209 57.7% 223,553,265 72.4% African American 5,420,217 8.4% 16,826,018 11.1% 16,683,084 18.1% 38,929,319 12.6% Native American* 1,322,876 2.0% 907,762 0.6% 701,610 0.8% 2,932,248 0.9% Asian 648,102 1.0% 6,425,214 4.2% 7,600,936 8.2% 14,674,252 4.8% Native Hawaiian/Pacific Islander 92,529 0.1% 216,384 0.1% 231,100 0.3% 540,013 0.2% Some other race 2,299,038 3.5% 6,613,076 4.4% 10,195,254 11.1% 19,107,368 6.2% Two or more races 1,401,715 2.2% 4,024,666 2.7% 3,582,692 3.9% 9,009,073 2.9% HISPANIC OR LATINO BY RACE Total Population 64,900,552 100.0% 151,694,276 100.0% 92,151,076 100.0% 308,745,538 100.0% Not Hispanic 58,874,332 90.7% 132,445,286 87.3% 66,948,782 72.7% 258,267,944 83.7% Hispanic** 6,026,220 9.3% 19,249,080 12.7% 25,202,294 27.3% 50,477,594 16.3% White 3,204,985 53.2% 10,962,265 56.9% 12,568,463 49.9% 26,735,713 53.0% African American 81,770 1.4% 406,934 2.1% 754,767 3.0% 1,243,471 2.5% Native American* 112,146 1.9% 240,144 1.2% 332,860 1.3% 685,150 1.4% Asian 17,622 0.3% 84,770 0.4% 106,736 0.4% 209,128 0.4% Native Hawaiian/Pacific Islander 9,672 0.2% 22,972 0.1% 25,793 0.1% 58,437 0.1% Some other race 2,244,185 37.2% 6,361,078 33.0% 9,897,840 39.3% 18,503,103 36.7% Two or more races 355,840 5.9% 1,170,917 6.1% 1,515,835 6.0% 3,042,592 6.0% HOUSEHOLDS BY RACE & ETHNICITY Total Households 25,016,506 100.0% 56,364,221 100.0% 35,335,565 100.0% 116,716,292 100.0% White - Not Hispanic Householder 20,806,252 83.2% 42,663,156 75.7% 18,863,672 53.4% 82,333,080 70.5% African American Householder 1,806,203 7.2% 5,865,681 10.4% 6,123,660 17.3% 13,795,544 11.8% Native American Householder* 384,925 1.5% 234,418 0.4% 139,674 0.4% 759,017 0.7% Asian Householder 184,489 0.7% 1,888,016 3.3% 2,507,283 7.1% 4,579,788 3.9% Native Hawaiian/Pacific Islander Householder 22,247 0.1% 51,542 0.1% 56,307 0.2% 130,096 0.1% Householder Some other race 12,185 0.0% 59,380 0.1% 85,937 0.2% 157,502 0.1% Householder Two or more races 271,040 1.1% 643,825 1.1% 585,034 1.7% 1,499,899 1.3% Hispanic** Householder 1,529,165 6.1% 4,958,203 8.8% 6,973,998 19.7% 13,461,366 11.5% Source: HAC Tabulations of 2010 Census of Population and Housing, Summary File 1. * Native Americans include American Indians and Alaska Natives. **Hispanics may be of any race.
- 10. HAC RURAL RESEARCH NOTE | April 2012 10 RURAL & SMALL TOWN POPULATION BY RACE AND ETHNICITY, BY STATE, 2010 Native Hawaiian/ Two or White African- Native- Pacific Other More Not Hispanic American American* Asian Islander Race Races Hispanic** State % % % % % % % % Alabama 71.4 21.9 0.7 0.5 0.0 0.1 1.2 4.3 Alaska 63.9 1.3 20.9 3.4 0.4 0.1 5.9 4.1 Arizona 57.5 1.9 14.1 1.0 0.2 0.1 1.6 23.5 Arkansas 78.9 13.9 0.6 0.6 0.0 0.0 1.4 4.5 California 54.4 2.6 1.5 2.5 0.2 0.2 2.2 36.4 Colorado 76.7 1.0 1.2 0.8 0.1 0.1 1.3 18.9 Connecticut 84.6 2.5 0.2 2.3 0.0 0.1 1.6 8.6 Delaware 74.1 13.8 0.5 1.0 0.0 0.2 1.7 8.8 Florida 69.5 12.9 0.5 0.9 0.0 0.1 1.3 14.7 Georgia 66.3 25.8 0.2 0.8 0.0 0.1 1.2 5.7 Hawaii 31.1 0.5 0.3 24.9 10.9 0.1 21.5 10.5 Idaho 83.0 0.4 1.7 0.9 0.1 0.1 1.5 12.4 Illinois 90.8 3.6 0.2 0.6 0.0 0.1 1.1 3.6 Indiana 93.3 1.3 0.2 0.5 0.0 0.1 1.0 3.6 Iowa 92.8 1.0 0.3 0.7 0.0 0.0 0.9 4.3 Kansas 83.3 2.8 0.8 1.1 0.1 0.1 2.0 9.9 Kentucky 92.2 3.9 0.2 0.4 0.0 0.1 1.2 2.0 Louisiana 63.2 31.0 1.0 0.7 0.0 0.1 1.3 2.7 Maine 95.5 0.5 0.8 0.7 0.0 0.1 1.3 1.1 Maryland 78.4 14.7 0.2 1.3 0.0 0.1 1.8 3.4 Massachusetts 87.5 2.6 0.3 2.8 0.0 0.5 2.0 4.3 Michigan 91.2 2.1 1.4 0.6 0.0 0.0 1.6 3.0 Minnesota 91.1 1.0 2.0 0.8 0.0 0.0 1.3 3.7 Mississippi 56.7 39.2 0.6 0.4 0.0 0.0 0.8 2.2 Missouri 91.4 3.1 0.5 0.6 0.1 0.0 1.5 2.8 Montana 87.7 0.2 7.0 0.5 0.0 0.0 2.0 2.5 Nebraska 87.8 0.6 1.2 0.5 0.0 0.1 0.9 8.9 Nevada 74.3 2.0 3.3 1.9 0.2 0.1 2.1 16.1 New Hampshire 94.9 0.6 0.3 1.4 0.0 0.1 1.3 1.4 New Jersey 59.4 18.2 0.6 1.5 0.1 0.1 2.2 18.0 New Mexico 38.6 1.5 15.0 0.7 0.0 0.2 1.3 42.7 New York 89.6 3.1 0.6 0.9 0.0 0.1 1.4 4.2 North Carolina 67.7 20.4 2.6 0.7 0.0 0.1 1.3 7.1 North Dakota 87.9 0.7 7.3 0.5 0.0 0.0 1.4 2.0 Ohio 93.3 2.2 0.2 0.6 0.0 0.1 1.4 2.2 Oklahoma 71.4 3.5 12.2 0.7 0.1 0.1 5.5 6.6 Oregon 83.8 0.4 2.0 0.9 0.2 0.1 2.5 10.1 Pennsylvania 92.3 2.9 0.1 0.7 0.0 0.1 1.0 2.9 Rhode Island 91.6 0.9 0.6 2.4 0.0 0.1 1.6 2.9 South Carolina 56.5 36.4 0.4 0.7 0.0 0.1 1.1 4.7 South Dakota 84.0 0.5 11.1 0.7 0.0 0.0 1.5 2.1 Tennessee 88.1 6.7 0.3 0.5 0.0 0.1 1.3 3.0 Texas 58.4 7.7 0.4 0.6 0.1 0.1 1.0 31.8 Utah 85.9 0.4 2.9 0.7 0.2 0.1 1.3 8.5 Vermont 95.3 0.6 0.4 0.8 0.0 0.1 1.5 1.4 Virginia 78.0 17.1 0.2 0.5 0.0 0.1 1.3 2.7 Washington 75.3 0.9 2.6 1.6 0.2 0.1 2.5 16.9 West Virginia 94.4 2.8 0.2 0.4 0.0 0.0 1.1 1.0 Wisconsin 93.0 0.7 1.4 0.8 0.0 0.0 1.0 3.1 Wyoming 86.7 0.4 2.6 0.7 0.1 0.1 1.3 8.2 RURAL & SMALL TOWN 77.8 8.2 1.9 1.0 0.1 0.1 1.6 9.3 * Native Americans include American Indians and Alaska Natives. ** Hispanics may be of any race Source: HAC Tabulations of the 2010 Census of Population and Housing, SF-1
- 11. HAC RURAL RESEARCH NOTE | April 2012 11 The Housing Assistance Council is a national nonprofit organization that supports affordable housing efforts in rural areas of the United States. HAC provides technical housing services, seed money loans from a revolving fund, housing program and policy assistance, and research and information services. HAC is an equal opportunity lender. HAC Rural Research Note 1025 Vermont Avenue NW Suite 606 Washington, DC 20005 202-842-8600 www.ruralhome.org Southeast Office Midwest Office Southwest Office Western Office 600 W Peachtree St., N.W. 10920 Ambassador Dr. 3939 San Pedro, N.E. 717 K Street Suite 1500 Suite 220 Suite C-7 Suite 404 Atlanta, GA 30308 Kansas City, MO 64153 Albuquerque, NM 87110 Sacramento, CA 95814 Tel.: 404-892-4824 Tel.: 816-880-0400 Tel.: 505-883-1003 Tel.: 916-706-1836 Fax: 404-892-1204 Fax: 816-880-0500 Fax: 505-883-1005 Fax: 916-706-1849 southeast@ruralhome.org midwest@ruralhome.org southwest@ruralhome.org western@ruralhome.org