SlideShare uma empresa Scribd logo
1 de 37
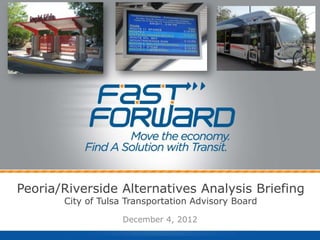
Peoria/Riverside Alternatives Analysis Briefing
       City of Tulsa Transportation Advisory Board

                    December 4, 2012
Project Background
12/4/2012                        2
Tulsa Transit Ridership by Route

                                                      FY12 Ridership
105                                                                                     458,559
222                                                                           315,269
101                                                                 260,717
112                                                       190,378
210                                               171,187
221                                              166,885
100                                             161,348
114                                    134,342
111                                   130,885
251                                   130,593
203                                  126,842
215                               113,795
117                      89,823
318                     86,605
118                    80,434
471           48,808
306           47,542


  12/4/2012                                                                                       3
Adopted Regional Transit
                               System Plan (October 2011)
 Peoria/Riverside
     Corridor

       20.2 Miles

Residents: 56,000 (1 in 7)

  Jobs: 52,000 (1 in 5)

  5,700 TOTAL daily trips
to/from downtown (13%)


12/4/2012                                               4
Major Activity Centers


Downtown                        Tulsa Tech

                                                      St. John & Hillcrest


                                                                    Utica
                                                                   Square


 Blair Property Park


                                             Cherry Street


 Mabee Center/ORU                                      Brookside


12/4/2012                                                             5
PlaniTulsa Comprehensive Plan


                             The Big “T”


12/4/2012                              6
Trip Destinations
Destinations for All trips on Route 105      Destinations for Work trips on Route 105


                                               Source: INCOG Ridership Survey, Jan. 2010
12/4/2012                                                                                  7
Ride Check Survey

• April 24-26, 2012
  (Tuesday – Thursday)
• 9 Routes surveyed
• Survey included 64% of total
  ridership, of which 25% was on
  Route 105 (Peoria)


 12/4/2012                                         8
Ride Check Survey

• Major stops at Pine, DAS, 41st
  Street, 61st Street, and 81st
  Street
• 4,000+ benefitting riders
• 20% flag stops (5% of riders)


           Grouping    On Board + Boardings
 N Peoria + S Peoria          1,681
 N Peoria + Downtown          2,819
 S Peoria + Downtown          3,728
 All Segments                 4,114


 12/4/2012                                                        9
Public Involvement
12/4/2012                        10
Public Involvement

            Steering Committee Initial Meeting (June)

            Initial round of public meetings
            July 16th & 17th

            Targeted Neighborhood Outreach


12/4/2012                                         11
Public Involvement

            985 postcards sent to Businesses

            72   Personal Letters to Neighborhood Leaders


12/4/2012                                                   12
Public Involvement


Big Ideas for Public Comments

• We need to ensure service for
  North Tulsa.

• Be conscious of where bus stops
  are placed.

• Better frequencies.

• Outreach to North Tulsa
  churches.

 12/4/2012                                   13
Bus Rapid Transit


Branded Buses                 Off-Board Fare Collection


Enhanced Boarding Platforms   Passenger Information
  12/4/2012                                               15
Operating Characteristics for Bus
                     Rapid Transit

                Service & Amenities Options
            • Less Time between buses:
                – 10 minutes in peak periods
                – 15 minutes in off-peak
            •   6am to 8pm Service Hours
            •   Low Floor, CNG Fueled Buses
            •   Traffic Signal Priority for Buses
            •   Passenger Shelters and Benches
            •   Next Bus Arrival Signs
            •   Pedestrian and Bicycle Amenities
            •   Branded Stops and Vehicles
            •   Stops Spaced Blocks ½-mile to 1 mile


12/4/2012                                        16
The Spur – Ft. Worth, TX


12/4/2012                          17
The Spur Line – Ft. Worth, TX


12/4/2012                              18
The Spur Line – Ft. Worth, TX


12/4/2012                              19
Shelters & Passenger Information


12/4/2012                               20
Stop Types


12/4/2012                21
Menu Exercise


12/4/2012                   22
Recommendations

Geography
  • Preferred limits from E.
    66th St N. to E. 81st St S.

Alignment & Stations
  •   Connection to DAS via 6th
      Street
  •   Alignment Options:
  •   Peoria Ave vs. Utica Ave. (from
      E 6th ST to E 21st ST)
  •   Multiple station platform
      shelter footprints & amenity
      options


 12/4/2012                                        23
Recommendations

• Technology & Infrastructure
   – Pedestrian improvements needed
     surrounding stations
   – Traffic signal priority, real-time
     arrival, automated ticket vending at
     select locations
• Operating Conditions
   – M-F: 5:30am – 8:30pm; 10 minute
     peak / 15-min off-peak frequency
   – Only local service on Saturday &
     Sunday (no BRT)
• Funding
   – Capital: 50/50 Federal/Local, FTA
     Very Small Starts (VSS) or TIGER
     Grants
   – Operations: Local funding


12/4/2012                                           24
Connecting to the Existing
                 Route System


12/4/2012                                25
Station Concept Examples


•12 ft Concrete platform
•Benches and/or leaning rails
•Bicycle racks, trash cans
•Branded, BRT signage and passenger information

 12/4/2012                                        26
Station Concept Examples


                            • 20 ft Concrete platform
                 •Station canopy and structural framing support
                      •LED lighting beneath station canopy
            •Benches and / or leaning rails, bicycle racks, trash cans
               •Branded, BRT signage and passenger information
              •Allowance for public art incorporated into amenities
12/4/2012                                                                27
Station Concept Examples


                                              •35 ft Concrete platform
                      •Station canopy and structural framing support
                                •LED lighting beneath station canopy
            •Benches and / or leaning rails, bicycle racks, trash cans
                 •Branded, BRT signage and passenger information
                •Allowance for public art incorporated into amenities
12/4/2012                                                     28
Station Improvement Levels


12/4/2012                          29
Station Example - Enhanced


12/4/2012                          30
Station Example - Improved


12/4/2012                          31
Station Example - Local


             Local
            Example


12/4/2012                             32
Conceptual Station Area


12/4/2012                         33
Capital & Operating Cost Estimates

12/4/2012                       34
The Challenge

              5% of MTTA Operating Budget ($900k)


                   Very Small Starts
                    Project Proposal


                 At least 3,000 benefiting riders
            10 min. headways during peak/15 off peak


12/4/2012                                              35
Capital & Operating Costs


        Preliminary Capital Cost: $20 – 25M*
        Potential 50%-80% share from Federal Transit
        Administration


        Preliminary Annual Operations costs:
        $750,000 to $1.5 Million*


                                              *Cost estimate subject to change as project
                                              progresses into preliminary engineering


12/4/2012                                                                          36
Next Steps

 November 9 – Peoria Alternatives Analysis Steering Committee #2

•    December 4 – Presentation to the City of Tulsa Transportation
     Advisory Board

•    January 7 and 8, 2013 – 2nd Round of Public Meetings   (feedback on
     Locally Preferred Alternative)


•    February 2013 – Steering Committee Selects Locally Preferred
     Alternative

•    March 2013 – Endorsement of LPA by MTTA Board, INCOG
     Transportation Policy Committee and Tulsa City Council

•    Summer 2013 – Submit application for funding to Federal Transit
     Administration (contingent on local funding commitment)


    12/4/2012                                                              37
Questions & Discussion


        James Wagner, AICP                                Viplav Putta
  Transportation Projects Coordinator    Transportation Planning & Programs Manager
                INCOG                                       INCOG
           (918) 579-9447                               (918) 579-9421
         jwagner@incog.org                             vputta@incog.org


12/4/2012                                                                             38

Mais conteúdo relacionado

Destaque

Peoria AA Steering Committee
Peoria AA Steering CommitteePeoria AA Steering Committee
Peoria AA Steering Committeertspincog
 
Peoria AA Public Meeting #1 - July 2012
Peoria AA Public Meeting #1 - July 2012Peoria AA Public Meeting #1 - July 2012
Peoria AA Public Meeting #1 - July 2012rtspincog
 
City Council Public Works 12/3/2015
City Council Public Works 12/3/2015City Council Public Works 12/3/2015
City Council Public Works 12/3/2015rtspincog
 
BRT Performance in Midwest & Southwest Cities
BRT Performance in Midwest & Southwest CitiesBRT Performance in Midwest & Southwest Cities
BRT Performance in Midwest & Southwest Citiesrtspincog
 
Innovative MPO - Fast Forward Outreach 9-30-2015
Innovative MPO - Fast Forward Outreach 9-30-2015Innovative MPO - Fast Forward Outreach 9-30-2015
Innovative MPO - Fast Forward Outreach 9-30-2015rtspincog
 
Peoria Bus Rapid Transit - Oct. 2013, Tulsa, OK
Peoria Bus Rapid Transit - Oct. 2013, Tulsa, OKPeoria Bus Rapid Transit - Oct. 2013, Tulsa, OK
Peoria Bus Rapid Transit - Oct. 2013, Tulsa, OKrtspincog
 

Destaque (7)

Asm final presentation
Asm   final presentationAsm   final presentation
Asm final presentation
 
Peoria AA Steering Committee
Peoria AA Steering CommitteePeoria AA Steering Committee
Peoria AA Steering Committee
 
Peoria AA Public Meeting #1 - July 2012
Peoria AA Public Meeting #1 - July 2012Peoria AA Public Meeting #1 - July 2012
Peoria AA Public Meeting #1 - July 2012
 
City Council Public Works 12/3/2015
City Council Public Works 12/3/2015City Council Public Works 12/3/2015
City Council Public Works 12/3/2015
 
BRT Performance in Midwest & Southwest Cities
BRT Performance in Midwest & Southwest CitiesBRT Performance in Midwest & Southwest Cities
BRT Performance in Midwest & Southwest Cities
 
Innovative MPO - Fast Forward Outreach 9-30-2015
Innovative MPO - Fast Forward Outreach 9-30-2015Innovative MPO - Fast Forward Outreach 9-30-2015
Innovative MPO - Fast Forward Outreach 9-30-2015
 
Peoria Bus Rapid Transit - Oct. 2013, Tulsa, OK
Peoria Bus Rapid Transit - Oct. 2013, Tulsa, OKPeoria Bus Rapid Transit - Oct. 2013, Tulsa, OK
Peoria Bus Rapid Transit - Oct. 2013, Tulsa, OK
 

Semelhante a Transportation Advisory Board 12/4/2012

Peoria Transit Study Public Meeting #3 Slides
Peoria Transit Study Public Meeting #3 SlidesPeoria Transit Study Public Meeting #3 Slides
Peoria Transit Study Public Meeting #3 Slidesrtspincog
 
Peoria AA Steering Committee June 2012
Peoria AA Steering Committee June 2012Peoria AA Steering Committee June 2012
Peoria AA Steering Committee June 2012rtspincog
 
Public Transit + Active Transportation: A network greater than the sum of its...
Public Transit + Active Transportation: A network greater than the sum of its...Public Transit + Active Transportation: A network greater than the sum of its...
Public Transit + Active Transportation: A network greater than the sum of its...Aaron Antrim
 
2015 03 25 Powerpoint Presentation
2015 03 25 Powerpoint Presentation2015 03 25 Powerpoint Presentation
2015 03 25 Powerpoint PresentationTy Bos
 
Four Mile Run Watershed and Mobility Public Meeting May 22
Four Mile Run Watershed and Mobility Public Meeting May 22Four Mile Run Watershed and Mobility Public Meeting May 22
Four Mile Run Watershed and Mobility Public Meeting May 22Sara Blumenstein
 
Sharp presentation
Sharp presentationSharp presentation
Sharp presentationRPO America
 
Osm errors stom_us_2012
Osm errors stom_us_2012Osm errors stom_us_2012
Osm errors stom_us_2012JohnANovak
 
Grandview District analysis + frameworks
Grandview District analysis + frameworksGrandview District analysis + frameworks
Grandview District analysis + frameworksWigley and Associates
 
Lady Bird Lake Trail Boardwalk Expansion
Lady Bird Lake Trail Boardwalk ExpansionLady Bird Lake Trail Boardwalk Expansion
Lady Bird Lake Trail Boardwalk ExpansionBikeTexas
 
Hardy community meeting 02.12.19
Hardy community meeting   02.12.19Hardy community meeting   02.12.19
Hardy community meeting 02.12.19RamaChilamkurthy
 

Semelhante a Transportation Advisory Board 12/4/2012 (12)

Peoria Transit Study Public Meeting #3 Slides
Peoria Transit Study Public Meeting #3 SlidesPeoria Transit Study Public Meeting #3 Slides
Peoria Transit Study Public Meeting #3 Slides
 
Peoria AA Steering Committee June 2012
Peoria AA Steering Committee June 2012Peoria AA Steering Committee June 2012
Peoria AA Steering Committee June 2012
 
Public Transit + Active Transportation: A network greater than the sum of its...
Public Transit + Active Transportation: A network greater than the sum of its...Public Transit + Active Transportation: A network greater than the sum of its...
Public Transit + Active Transportation: A network greater than the sum of its...
 
2015 03 25 Powerpoint Presentation
2015 03 25 Powerpoint Presentation2015 03 25 Powerpoint Presentation
2015 03 25 Powerpoint Presentation
 
Four Mile Run Watershed and Mobility Public Meeting May 22
Four Mile Run Watershed and Mobility Public Meeting May 22Four Mile Run Watershed and Mobility Public Meeting May 22
Four Mile Run Watershed and Mobility Public Meeting May 22
 
Sharp presentation
Sharp presentationSharp presentation
Sharp presentation
 
Osm errors stom_us_2012
Osm errors stom_us_2012Osm errors stom_us_2012
Osm errors stom_us_2012
 
Grandview District analysis + frameworks
Grandview District analysis + frameworksGrandview District analysis + frameworks
Grandview District analysis + frameworks
 
Lady Bird Lake Trail Boardwalk Expansion
Lady Bird Lake Trail Boardwalk ExpansionLady Bird Lake Trail Boardwalk Expansion
Lady Bird Lake Trail Boardwalk Expansion
 
Complete Streets: Designing Healthy Places in Rhode Island
Complete Streets: Designing Healthy Places in Rhode Island Complete Streets: Designing Healthy Places in Rhode Island
Complete Streets: Designing Healthy Places in Rhode Island
 
July 14, 2021 FTAC Virtual Workshop
July 14, 2021 FTAC Virtual WorkshopJuly 14, 2021 FTAC Virtual Workshop
July 14, 2021 FTAC Virtual Workshop
 
Hardy community meeting 02.12.19
Hardy community meeting   02.12.19Hardy community meeting   02.12.19
Hardy community meeting 02.12.19
 

Transportation Advisory Board 12/4/2012

  • 1. Peoria/Riverside Alternatives Analysis Briefing City of Tulsa Transportation Advisory Board December 4, 2012
  • 3. Tulsa Transit Ridership by Route FY12 Ridership 105 458,559 222 315,269 101 260,717 112 190,378 210 171,187 221 166,885 100 161,348 114 134,342 111 130,885 251 130,593 203 126,842 215 113,795 117 89,823 318 86,605 118 80,434 471 48,808 306 47,542 12/4/2012 3
  • 4. Adopted Regional Transit System Plan (October 2011) Peoria/Riverside Corridor 20.2 Miles Residents: 56,000 (1 in 7) Jobs: 52,000 (1 in 5) 5,700 TOTAL daily trips to/from downtown (13%) 12/4/2012 4
  • 5. Major Activity Centers Downtown Tulsa Tech St. John & Hillcrest Utica Square Blair Property Park Cherry Street Mabee Center/ORU Brookside 12/4/2012 5
  • 6. PlaniTulsa Comprehensive Plan The Big “T” 12/4/2012 6
  • 7. Trip Destinations Destinations for All trips on Route 105 Destinations for Work trips on Route 105 Source: INCOG Ridership Survey, Jan. 2010 12/4/2012 7
  • 8. Ride Check Survey • April 24-26, 2012 (Tuesday – Thursday) • 9 Routes surveyed • Survey included 64% of total ridership, of which 25% was on Route 105 (Peoria) 12/4/2012 8
  • 9. Ride Check Survey • Major stops at Pine, DAS, 41st Street, 61st Street, and 81st Street • 4,000+ benefitting riders • 20% flag stops (5% of riders) Grouping On Board + Boardings N Peoria + S Peoria 1,681 N Peoria + Downtown 2,819 S Peoria + Downtown 3,728 All Segments 4,114 12/4/2012 9
  • 11. Public Involvement Steering Committee Initial Meeting (June) Initial round of public meetings July 16th & 17th Targeted Neighborhood Outreach 12/4/2012 11
  • 12. Public Involvement 985 postcards sent to Businesses 72 Personal Letters to Neighborhood Leaders 12/4/2012 12
  • 13. Public Involvement Big Ideas for Public Comments • We need to ensure service for North Tulsa. • Be conscious of where bus stops are placed. • Better frequencies. • Outreach to North Tulsa churches. 12/4/2012 13
  • 14. Bus Rapid Transit Branded Buses Off-Board Fare Collection Enhanced Boarding Platforms Passenger Information 12/4/2012 15
  • 15. Operating Characteristics for Bus Rapid Transit Service & Amenities Options • Less Time between buses: – 10 minutes in peak periods – 15 minutes in off-peak • 6am to 8pm Service Hours • Low Floor, CNG Fueled Buses • Traffic Signal Priority for Buses • Passenger Shelters and Benches • Next Bus Arrival Signs • Pedestrian and Bicycle Amenities • Branded Stops and Vehicles • Stops Spaced Blocks ½-mile to 1 mile 12/4/2012 16
  • 16. The Spur – Ft. Worth, TX 12/4/2012 17
  • 17. The Spur Line – Ft. Worth, TX 12/4/2012 18
  • 18. The Spur Line – Ft. Worth, TX 12/4/2012 19
  • 19. Shelters & Passenger Information 12/4/2012 20
  • 22. Recommendations Geography • Preferred limits from E. 66th St N. to E. 81st St S. Alignment & Stations • Connection to DAS via 6th Street • Alignment Options: • Peoria Ave vs. Utica Ave. (from E 6th ST to E 21st ST) • Multiple station platform shelter footprints & amenity options 12/4/2012 23
  • 23. Recommendations • Technology & Infrastructure – Pedestrian improvements needed surrounding stations – Traffic signal priority, real-time arrival, automated ticket vending at select locations • Operating Conditions – M-F: 5:30am – 8:30pm; 10 minute peak / 15-min off-peak frequency – Only local service on Saturday & Sunday (no BRT) • Funding – Capital: 50/50 Federal/Local, FTA Very Small Starts (VSS) or TIGER Grants – Operations: Local funding 12/4/2012 24
  • 24. Connecting to the Existing Route System 12/4/2012 25
  • 25. Station Concept Examples •12 ft Concrete platform •Benches and/or leaning rails •Bicycle racks, trash cans •Branded, BRT signage and passenger information 12/4/2012 26
  • 26. Station Concept Examples • 20 ft Concrete platform •Station canopy and structural framing support •LED lighting beneath station canopy •Benches and / or leaning rails, bicycle racks, trash cans •Branded, BRT signage and passenger information •Allowance for public art incorporated into amenities 12/4/2012 27
  • 27. Station Concept Examples •35 ft Concrete platform •Station canopy and structural framing support •LED lighting beneath station canopy •Benches and / or leaning rails, bicycle racks, trash cans •Branded, BRT signage and passenger information •Allowance for public art incorporated into amenities 12/4/2012 28
  • 29. Station Example - Enhanced 12/4/2012 30
  • 30. Station Example - Improved 12/4/2012 31
  • 31. Station Example - Local Local Example 12/4/2012 32
  • 33. Capital & Operating Cost Estimates 12/4/2012 34
  • 34. The Challenge 5% of MTTA Operating Budget ($900k) Very Small Starts Project Proposal At least 3,000 benefiting riders 10 min. headways during peak/15 off peak 12/4/2012 35
  • 35. Capital & Operating Costs Preliminary Capital Cost: $20 – 25M* Potential 50%-80% share from Federal Transit Administration Preliminary Annual Operations costs: $750,000 to $1.5 Million* *Cost estimate subject to change as project progresses into preliminary engineering 12/4/2012 36
  • 36. Next Steps  November 9 – Peoria Alternatives Analysis Steering Committee #2 • December 4 – Presentation to the City of Tulsa Transportation Advisory Board • January 7 and 8, 2013 – 2nd Round of Public Meetings (feedback on Locally Preferred Alternative) • February 2013 – Steering Committee Selects Locally Preferred Alternative • March 2013 – Endorsement of LPA by MTTA Board, INCOG Transportation Policy Committee and Tulsa City Council • Summer 2013 – Submit application for funding to Federal Transit Administration (contingent on local funding commitment) 12/4/2012 37
  • 37. Questions & Discussion James Wagner, AICP Viplav Putta Transportation Projects Coordinator Transportation Planning & Programs Manager INCOG INCOG (918) 579-9447 (918) 579-9421 jwagner@incog.org vputta@incog.org 12/4/2012 38