SlideShare uma empresa Scribd logo
1 de 18
MRV Engenharia (MRVE3)
Sector: Real Estate & Construction
Target Price: R$44.00 / US$23.61 (as of September 19th)
Current Price: R$28,99 / US$15.55 (as of September 19th)
Upside: 51.8% / 35.3%

Initiation of Coverage                                                                                                              September 21, 2007

The Real Low Income Player                                                                                                                                                         BUY
We are initiating coverage of MRV Engenharia shares with a                                         Table 1
December 2008 price target of R$44.00 per share, implying a 52%                                    Market Cap in R$MM                          3,786
upside in R$ terms (35% in US$) and a BUY rating.                                                  Firm Value in R$MM                          3,205
                                                                                                   52-week Hi-Lo in R$                         32.5               26.0
                                                                                                   30D ADTV – R$000                           11.500
         MRV shares currently trade at 9.1x PER09E and 7.2x
    •                                                                                              Share Price:                                28.6
         FV/EBITDA09E vs. respective sector averages of 10.1x and                                  Variation                                   1M                  3M               6M
         7.3x. In our view, MRV should trade at premium to its peers, given                                        Absolute                   -5.8%               N.A.             N.A.
         its superior growth prospects, which are supported by its                                                 Relative                   -14.9%              N.A.             N.A.
         positioning and by the current macroeconomic scenario. Adjusting                          Volatility                                  1M                  3M               6M
         multiples to growth, MRV trades at 0.08x PEG08E and 0.08x                                                 Absolute                   46.7%               N.A.             N.A.
         FV/EBITDA08E-to-growth, while peers trade at 0.22x and 0.15x                                              Relative                   11.1%               N.A.             N.A.
         respectively.
                                                                                                   Table 2 – R$MM                             2006              2007E              2008E
                                                                                                   Net Revenue                                 140                390               942
         An integrated developer focused in affordable housing,
    •                                                                                              Adj. EBITDA                                  22                  82              243
         MRV’s story dates back to 1979 when it started to operate in                              Net Profit                                   17                  29              249
         Belo Horizonte. Since 1995, the company has been going through                            Dividends                                    0.0               0.6               7.2
         an ambitious expansion plan. It is now operating in 35 Brazilian                          FCFF                                        (52)              (316)             (246)
         cities within 8 of the richest states in the country.                                     ROIC (%)                                   13.5%              6.9%              16.8%

                                                                                                   Table 3                                    2006              2007E              2008E
         MRV’s strategy is coherent with its ambition to be perceived
    •                                                                                              PER                                        211.1              125.2             14.4
         as the main player in Brazil’s affordable housing segment.                                FV/EBITDA                                  162.1              146.1             14.4
         The average unit prices of R$100,000 are lower than the                                   FV/FCFF                                     N.R.               N.R.             N.R.
         competition’s. The current R$4.3 billion land bank is distributed                         Dividend Yield                             0.0%               0,02%             0,20%
         through 35 cities in areas where demand for affordable housing is                         FCFE Yield                                 0.0%                N.R.              N.R.
         strong. Units are standardized, which allows for productivity gains                       Net Debt to EBITDA                          2.47              -28.16            -0.35
         and lower construction costs.
                                                                                                   Table 4
                                                                                                   PEG Ratio                                  0.08x
         With the exception of 2007 and 2008 ramp-up, we have
    •                                                                                              EBITDA Multi/Growth                        0.08x
         conservatively assumed that, due to its positioning in the                                PBV**                                      3.13x
         low income segment, the company should be able to grow                                    Net Debt/Equity         N.R.
         slightly above the other companies in our coverage universe.                              Net Deb/ Total Cap      N.R.
         A shorter construction cycle should also accelerate revenue                               *N.R. – Not Representative
                                                                                                   **PBV adjusted for IPO
         recognition vis-à-vis its peers, besides diminishing the PoC
         accounting distortions.

                                                                                                                  Share Price vs Ibovespa Performance
         As for the risk to investment case, most of it lies on the
    •                                                                                               150
         macroeconomic scenario. Any major downturn in the Brazilian
         economy, especially if the interest rates easing process is affected,                      125
         should have more impact on MRV than on other more diversified
         players.                                                                                   100


                                                                                                     75
         Another risk, in the longer run, is competition coming from
    •
         players like Cyrela, Rossi and Gafisa, which have already                                   50
                                                                                                          20/07


                                                                                                                   27/07

                                                                                                                           03/08

                                                                                                                                      10/08


                                                                                                                                               17/08


                                                                                                                                                        24/08

                                                                                                                                                                   31/08

                                                                                                                                                                           07/09


                                                                                                                                                                                    14/09


         disclosed plans to tap the low income segment. Nonetheless,
         while these players prepare to and gain scale in the segment, MRV
         has a realistic chance of growing by taking market share from a                                                           MRVE3                        Ibovespa

         large number of small and local competitors with limited access to
         capital.
                                                                                                                                                       Rafael C. de Pinho
                                                                                                                                                                   55 11 3089-8748
                                                                                                                                                                rpinho@bulltick.com


                                          See appendix A for Important Disclosures
This report has been prepared by Bulltick Brasil Consultoria e Assessoria Empresarial Ltda. which is not an NASD member, it’s not registered under the
US Securities and exchange commission, and it’s not regulated by any US Securities or commodities exchange. Non-US research analysts who have
prepared this report are not registered/ qualified as research analysts with the NASD or any other US securities exchange or regulatory body
Investment Thesis: Three Reasons Why we Like MRV

                              1 – MRV is well positioned to profit from the Brazilian housing boom.

                              Among Brazil’s listed real estate companies, MRV is the only one who can claim full
Positioning: Fully exposed
                              exposure to lower income segments. Some of the major players in the sector recently
to lower income segments.
                              disclosed their strategies to tap lower income segments which will include: (i) shift land
                              banks from now on to more affordable housing projects; (ii) redesign products and
                              brands and (iii) launch a higher percentage of affordable segment projects as a
                              percentage of the launchings pipeline going forward.

                              However, 20% to 25% exposure to the segment in terms of future launchings does not
                              look enough. Investors willing to play the low income segment in Brazil have MRV as an
                              option that presents proven and sound track record and a solid brand, widely recognized
                              as being 100% focused in the affordable housing segment.

                              Below we present the recent evolution of launchings in terms of average price per unit
Recent launchings track
                              launched by some developers. It is important to note MRV is way ahead of competition in
record: consistent with
                              terms of product positioning in the lower income segments.
positioning.


                              Exhibit 1:        Average price/unit launched – in R$ thousands

                                  600

                                  500

                                  400

                                  300

                                  200

                                  100

                                  -
                                         Company       Cyrela       Gafisa        Klabin       Rossi      Tecnisa            MRV   Rodobens
                                                                                  Segall

                                                                                2005       2006    1H07
                              Source: Companies and Bulltick

                              The first requisite to launch low income developments, as for any development, is to have
                              the land bank in the right place. We present below MRV’s land bank as of 2Q07.

                              Exhibit 2:        MRV’s Land Bank and Average Unit Prices
                                                      State    PSV (R$ MM)    %      Potential Units   Avg Price (R$/Unit)
                                                       SP            2,619   60.4%           24,924                105,099
                                                       MG             779    18.0%             9,588                81,271
                                                       RJ             235    5.4%              2,960                79,364
                                                       DF             210    4.8%              1,542               136,267
                                                       ES             179    4.1%              1,912                93,778
                                                       GO             172    4.0%              1,734                99,250
                                                       PR             122    2.8%              1,324                91,993
                                                       SC              17    0.4%               181                 95,647
                                                                    4,334     100%           44,165                98,138
                              Source: MRV


                              It is interesting to note that not only past launchings show MRV consistent positioning in
Land bank’s average unit
                              the segment, but also does the profile of its R$4.3 billion PSV land bank going forward.
price: R$98,138.
                              Besides being diversified in 36 cities within 8 of the richest states in Brazil, unit sales
                              prices are on average R$98,138.

                              The cities where MRV’s land bank is located and the strategy behind their choice are also
MRV’s current competition
                              worth mentioning. MRV targets cities with at least 200,000 inhabitants, where it will
is formed by small players…
                              normally find enough demand for its developments. Besides having demand in place, this
                              kind of city presents an advantage: lack of competition. As the major players are
                                                                                                                                              2
traditionally more active in state capitals, in most of the cases MRV ends up competing in
                              most of the cases against small local players, which lack the capital and structure to be
                              fierce opponents.

                              Exhibit 3:            Geographic Positioning – MRV


                                                                                       GOIÁS


                                                                            Brasília
                                                                                                                        MINAS GERAIS
                                                                            Goiânia
                                                 BRAZIL
                                                                                                                       Belo Horizonte
                                                                                                                       Uberaba
                                                                                                                       Uberlândia
                                                                                                                       Contagem
                                                                                                                       Nova Lima


                                                                                                                                ESPÍRITO
                                                                                                                                 SANTO

                                                                                                                        Serra


                                                                                                                         RIO DE JANEIRO
                                            PARANÁ
                                                                                                                         Rio de Janeiro
                                         Curitiba
                                         Londrina
                                         Maringá


                                                                                                                 SÃO PAULO

                                                                                               São Paulo              Campinas
                                                                    SANTA                      São Bernardo           Sta. Bárbara do Oeste
                                                                                               S.J. Campos            Piracicaba
                                                                   CATARINA
                                                                                               Santo André            Americana
                                                                                               Mauá                   Paulínia
                                                                                               Taubaté                Marília
                                                                Joinville
                                                                                               Cotia                  Bauru
                                                                                               Sorocaba               Araraquara
                                                                                               Mogi das Cruzes        São Carlos
                                                                                               Jundiaí                Ribeirão Preto
                                                                                               S.J. Rio Preto         Franca


                              Source: MRV


                              Last but not least, we shall examine MRV’s product strategy. Building affordable housing
Key to profitability in low
                              is something that demands a change in the way traditional companies look at the
income housing:
standardization.              development process. Instead of tailor-made projects, standardization comes in play as a
                              key to a successful and profitable operation. Exhibit 5 shows our view of different product
                              levels and the corresponding price sensitivity at each level.

                              Exhibit 4:            Real Estate Product Levels


                              Source: Bulltick


                              MRV positioned itself as a leader in the low income segment by understanding clients’
Standardization: 3 basic
                              demand for monthly installments to fit their income. Standardization was the answer to
products replicated
                              decrease unit prices. The company designed 3 basic types of projects that are used
everywhere…
                              depending on the local demand.


                                                                                                                                              3
On top of minimizing design costs other companies face on a per-project basis, the
… resulting in low design
costs and allowing for gains   approval process tends to be faster as the standardized project becomes known of the
of scale.                      authorities. Additionally, raw material purchases can be concentrated on fewer suppliers
                               and executed by the company’s headquarters in a centralized manner, allowing for gains
                               of scale. Exhibit 6 depicts the three basic product types designed by MRV.


                               Exhibit 5:                                MRV’s Product Types
                                                                                                                       Village
                                                               100-220


                                                                                                                                           Two parking spaces;
                                                                                                                                           Two to four bedrooms
                                                                                                                                           with suite.

                                                                                             Spazio
                                   Unit Price (R$ thousands)


                                                               70-140


                                                                                                               One parking space; Two to
                                                                                                               three bedrooms, suite
                                                                                                               option; Balcony.
                                                                          Parque


                                                                                      One parking space; Two
                                                               77


                                                                                      to three bedrooms, no
                                                                                      suite option.


                                                                            40-55             42-70                    70-120


                                                                                     Apartment Area (m2)
                               Source: MRV and Bulltick


                                                                                                                                                                  4
2 – MRV is sticking to the right strategy

                             Besides being uniquely positioned, the company has a solid brand name in a segment
MRV has no reason to
                             where most of the big names either lack one or are still in the making. Additionally, the
change. On the contrary,
competition will have to     capital investment made earlier this year by Autonomy Capital allowed the company to
change.                      accelerate its already fast-paced growth plans and expand its land bank. The latest boost
                             to the company’s growth plans came after the roughly R$1 billion in equity issued.

Growth way before the IPO.   Differently from many real estate companies, MRV has been paving its growth long before
                             its IPO. Not only has the company been growing operationally, but also geographically.
                             MRV’s geographical expansion which started in 1995 and since then reached 35 cities,
                             followed a logical path, using regional offices as operational hubs from where it expanded
                             to surrounding cities. The results of such strategy can be seen on exhibit 7, a 61% and
                             43% CAGR in the PSV of launchings and in contracted sales, respectively, in the 2004-
                             2006 period.

                             Exhibit 6:        Operational Highlights

                                                                           2004      2005      2006     1H07      CAGR '04-'06
                                 Launchings
                                 Launching PSV - MRV Stake - (R$ MM)          130       184       337       433       61%
                                 Average Price per Unit Launched - (R$)    80,477   104,166   112,935    96,910
                                                          2
                                 Launched Usable Area (m )                101,434   133,294   229,331   286,595
                                 Number of developments launched               28        45        67        61
                                 Number of units launched                   1,618     1,769     2,987     4,463       36%
                                                     2
                                 Average Price (R$/m )                      1,312     1,421     1,512     1,723
                                 Sales
                                 Contracted Sales - MRV Stake - (R$ MM)       100       110       206       276       43%
                                 Average Price per Unit Sold - (R$)        66,611    81,038    99,201   103,869
                                                    2
                                 Usable area sold (m )                     88,703    90,043   148,953   181,799
                                 Number of units sold                       1,506     1,361     2,079     2,658       17%
                                                     2
                                 Average Price (R$/m )                      1,148     1,245     1,430     1,627
                             Source: MRV


                             Despite the accelerated expansion observed in recent years, MRV has ambitious growth
“MRV 40,000”: strategic
moves and debottlenecking    plans for the coming years: recently it has disclosed the “MRV 40,000” initiative,
to boost production.         consisting of a plan to enable the company to deliver 40,000 units a year. In order to do
                             that, MRV started by defining production objectives for each team in the company in
                             terms of production. In order to reach those objectives, the company’s processes and
                             production bottlenecks were mapped so that the teams could start working on solving
                             them.

                             Additionally, such an ambitious plan would not be possible without heavy technological
                             support. MRV has ERP software running to manage its different construction sites and is
                             taking steps to make its systems capable of handling the desired volumes.

                             Regarding measures of the plan already taken, the regional offices administrative
                             routines and all the purchasing structures are now centralized as much as possible in Belo
                             Horizonte, leaving the regional offices focus on operational and commercial issues
                             regarding the developments.


                                                                                                                                 5
3 - Macroeconomic scenario: winds are blowing in the right direction

                                The elements that allow for MRV to grow and exploit Brazil’s enormous housing deficit
                                apply to every other company in the sector: the country’s monetary easing process,
                                increased credit availability, economic stability and higher populations’ disposable
                                income. Nonetheless, MRV’s case is much more dependent on these fundamentals due to
                                its average client profile. Our view is that not only these conditions are sustainable, given
                                the current economic scenario, but are improving much faster than previously expected,
                                especially when credit availability is concerned.

                                As mortgages become increasingly affordable vis-à-vis other options such as paying rents
                                and the country’s economic stability is assimilated by the average Brazilian, the idea of
                                contracting mortgages, a long term commitment, is seriously considered.

                                Nonetheless, it was not long ago when as companies had to finance clients given banks
                                limited appetite for mortgages. In order to do that, construction had to be delayed as
                                much as possible so cash flows became smoother and working capital requirements
                                reduced.

                                The solution allowing MRV to meet client’s needs and desires became concrete as banks’
Private banks willingness to
                                willingness to lend money to homebuyers shifted from apathy to a frantic market share
lend money allowed for
                                fight. Banks came in to lend homebuyers money as soon as construction was finished, in
shorter construction cycles.
                                turn enabling the company to curtail the construction cycle, delivering products faster.
                                This way, besides solving marketing issues, the cash flows of a typical development were
                                improved as a project can be developed faster than previously, yielding better returns.

                                Mortgage conditions have improved much faster than previously expected by market
Mortgage conditions are
                                participants. As the recent offer of 90% of loan-to-value mortgages by Caixa Econômica
improving faster than
                                Federal reaches the overall market, in the near future, the biggest barrier to real estate
expected.
                                purchase decision, down payment, should be minimized. The down payment issue is
                                especially important when we put in perspective the fact that the Brazilian population is
                                not prone to savings. As a result, most of the low-income families cannot hold up for the
                                current 20% down payment standard.

                                On top of the favorable macro scenario, demographics in Brazil also show MRV has large
Demographics point to at
                                room to grow in the coming years. The most recent census in Brazil points out for the
least 21 target cities within
                                existence of at least 21 cities with around 200 thousand inhabitants, where the GDP per
MRV’s geographical reach.
                                capita indicates potential for MRV to prospect business. Our analysis included only cities
                                within MRV’s current geographic presence in the Southeast, South and Midwest regions of
                                Brazil.

                                Exhibit 7:         Potential New Cities, GDP per capita vs. inhabitants
                                                     1,800
                                                                                                   P o rt o A le gre

                                                     1,600
                                                                                                                           G ua rulho s
                                                     1,400

                                                     1,200
                                                                                                                                             D uque de C a xia s
                                                     1,000
                                                                                                                      Osasco
                                                         800
                                                                                             C uia bá
                                                                                                        N it e ró i
                                                         600                                                 D ia de m a
                                                                                                                                          C a xia s do S ul
                                                                                                 F lo ria nó po lis
                                                                                                                                                              C a no a s
                                                                                                               S uza no
                                                         400
                                                                   P re s ide nt e P rude nt e

                                                         200
                                                                                                                                                    S ã o J o s é do s
                                                                                             A ra ç a t uba
                                                                                                                             Inda ia t uba               P inha is
                                                         -
                                                               0             5,000          10,000              15,000          20,000          25,000           30,000    35,000

                                                                                                          P e r C a pit a GD P ( R $ )


                                Source: IBGE, Bulltick


                                                                                                                                                                                    6
Exhibit 8:         MRV’s Current Markets, GDP per capita vs. inhabitants
                    3,000
                                                B e lo H o rizo nt e
                                                                                    B ra s í lia


                    2,500


                    2,000
                                           C urit iba


                    1,500
                                                                           C a m pina s
                                                                                          S ã o B e rna rdo do
                                                                                                C a m po
                                                                                                                    Sã o J o s é do s
                    1,000                                                                                              C a m po s
                                                             Ube rlâ ndiaS a nt o A ndré
                                                            M a uá
                                               Lo ndrina                       S o ro c a ba
                                                            P ira c ic a ba
                                       B a uru                                      S e rra
                                                                         J o inv ille
                         500                        M a ringá
                                                                                 T a uba t é       J undia í
                                   F ra nc a                        Ube ra ba
                                                                              C o t ia
                                                  M a rí lia                              A m e ric a na
                         -
                               0   5,000           10,000              15,000            20,000            25,000      30,000           35,000
                                                               P e r C a pit a G D P ( R $ )


Source: IBGE, Bulltick


                                                                                                                                                 7
Valuation

                            We defined MRV shares price target using a DCF-based model and then compared its
We discount MRV’s cash
                            multiples with the peers in our coverage universe. In order to reach our DCF PT we
flows at the highest WACC
assumption among covered    discounted cash flows to the firm (FCFF) at a WACC of 13.26% in R$ terms, the highest
companies.                  for companies in our coverage universe. We also applied a 4% nominal perpetuity growth
                            in R$ terms. Exhibit 11 depicts our discount rates, target capital structure, the resulting
                            WACC and valuation outcome.

                            Our total return target price for Dec. 2008 reaches R$44.00 for MRV shares, implying a
                            potential upside of 51.8% in R$ (or 35.3% in US$) and a BUY rating.

                            Exhibit 9:         Discount and Growth Rates

                                                            US Risk Free Rate                                4.5%
                                                            Brazil Country Risk                              1.75%
                                                            Beta                                              1.30
                                                            Equity Risk Premium                              6.0%
                                                            LT R$ Depreciation                               2.0%
                                                           Ke (R$)                                          16.05%
                                                           Weight - Equity                                  70.00%

                                                            Cost of Debt, in R$, Before Taxes                10.3%
                                                            Effective Tax Rate                               34.0%
                                                           Kd (R$)                                           6.77%
                                                           Weight - Debt                                    30.00%

                                                           WACC (R$)                                        13.26%

                                                           Forecasted Period                              2007 – 2020
                                                           Perpetuity Growth                                4.00%
                            Source: Bulltick


                            It is interesting to note MRV’s cash flows become positive sooner that those of other real
                            estate companies. The difference lies on its lower working capital needs, a direct result of
                            its business model. For more details please refer to the investment case section.

                            Exhibit 10: Cash Flows
                                                                      2005        2006      2007E        2008E    2009E     2010E    2011E    2012E
                            EBITDA                                        25        22             21      243      446       629      760      844
                            Taxes                                         (4)       (4)            (4)     (40)      (73)    (102)    (122)    (136)
                            Change in Net Working Assets                 (20)      (69)          (330)    (444)    (434)     (383)    (222)    (111)
                            CAPEX                                         (0)       (2)            (3)      (5)       (3)      (3)      (3)      (4)
                            FCFF                                           1      (52)          (316)    (246)      (63)     142      412      594
                            Source: Bulltick


                            Main Valuation Assumptions and Sensitivity Analysis

                            Our DCF model main inputs are the potential sales value (PSV) of launchings and the
                            company’s typical sales velocity, client payments and construction schedule, from which
                            we derive cash flows. Except for gross margins, which we conservatively reduce at a 50
                            bps / year pace, we use the other inputs in line with the company’s current business
                            model. It is important to notice that so far the company has delivered results in line or
                            above these expectations.

                            We view MRV as well positioned to have sustainable and above-average launchings
                            growth. The company should deliver explosive 180% and 95% launchings growth in 2007
                            and 2008 respectively. Investors should bear in mind that the land bank to support this
                            growth is secured, as stated in 2Q07 results release. Additionally, we expect MRV to
                            deliver growth at ratios slightly above its peers in the long run. The normalized
                            launchings and growth assumptions in the 2008-2012 period for covered companies are
                            summarized in exhibit 13.


                                                                                                                                                   8
Exhibit 11: Launchings Growth 2008-2012


                                                             250
Growth: conservatively in
line with higher segment
                                                             225
companies under coverage.


                                        Index (2007 = 100)
                                                             200


                                                             175


                                                             150


                                                             125


                                                             100
                                                                          2008          2009               2010              2011               2012

                                                              MRV         Company     Cyrela      Gafisa     Klabin Segall      Rossi      Tecnisa
                               Source: Bulltick


                               The faster pace applied to construction by MRV results in faster revenue recognition when
                               compared to other players, as it can be seen on exhibit 13 below. Additionally, exhibit 12
                               shows our sales velocity and construction costs assumptions for typical MRV’s
                               developments.


                               Exhibit 12: Revenue Recognition Assumptions
                                                                                                   6M        12M        18M         24M
                                                                         Sales Velocity           60%        14%        14%         12%
                                                                         Cost Incurred            17%        42%        42%          0%
                                                                         Recognized Revenues      10%        33%        45%         12%
                               Source: Bulltick


                               Exhibit 13: Revenue Recognition Patterns

                                                               120%
Shorter construction cycle
                                                                                                               100%
translates in faster revenue                                   100%
recognition.
                                                                   80%


                                                                   60%
                                                                                         43%
                                                                   40%


                                                                   20%


                                                                   0%
                                                                   Launching           1st Year              2nd Year                3rd Year

                                                                            Cyrela        Klabin Segall       Rossi             Gafisa
                                                                            Company       Tecnisa             MRV
                               Source: Bulltick


                                                                                                                                                       9
On exhibit 16 we show sensitivity analysis based on the variation of WACC and long-term
growth rates.

Exhibit 14: Sensitivity Analysis

               Mkt. Cap. (R$M)
                     Beta        WACC  g      3.0%    3.5%    4.0%    4.5%    5.0%
                                               7,263   7,493   7,755   8,055   8,404
                     0.82         11.3%
                                               6,282   6,444   6,625   6,830   7,063
                     1.06         12.3%
                                               5,499   5,616   5,746   5,890   6,052
                     1.30         13.3%
                                               4,863   4,949   5,043   5,147   5,263
                     1.54         14.3%
                                               4,335   4,400   4,470   4,547   4,631
                     1.78         15.3%

               Dec. 08 Tgt. Price (R$/Share)
                     Beta         WACC  g     3.0%    3.5%    4.0%    4.5%    5.0%
                                                55.6    57.4    59.4    61.7    64.4
                     0.82          11.3%
                                                48.1    49.3    50.7    52.3    54.1
                     1.06          12.3%
                                                42.1    43.0    44.0    45.1    46.3
                     1.30          13.3%
                                                37.2    37.9    38.6    39.4    40.3
                     1.54          14.3%
                                                33.2    33.7    34.2    34.8    35.5
                     1.78          15.3%

               Upside Potential (%)
                     Beta        WACC  g      3.0%    3.5%     4.0%   4.5%   5.0%
                                               91.8%   97.9%   104.8% 112.8% 122.0%
                    0.82          11.3%
                                               65.9%   70.2%   75.0% 80.4% 86.6%
                    1.06          12.3%
                                               45.3%   48.4%   51.8% 55.6% 59.9%
                    1.30          13.3%
                                               28.4%   30.7%   33.2% 36.0% 39.0%
                    1.54          14.3%
                                               14.5%   16.2%   18.1% 20.1% 22.3%
                    1.78          15.3%

               FV/EBITDA 09 at Target
                    Beta        WACC  g       3.0%    3.5%    4.0%    4.5%    5.0%
                                                16.1    16.6    17.2    17.9    18.7
                    0.82         11.3%
                                                13.9    14.3    14.7    15.1    15.6
                    1.06         12.3%
                                                12.1    12.4    12.7    13.0    13.4
                    1.30         13.3%
                                                10.7    10.9    11.1    11.3    11.6
                    1.54         14.3%
                                                 9.5    9.7      9.8    10.0    10.2
                    1.78         15.3%

               P/E 09 at Target
                     Beta       WACC  g       3.0%    3.5%    4.0%    4.5%    5.0%
                                                17.4    17.9    18.6    19.3    20.1
                    0.82         11.3%
                                                15.0    15.4    15.9    16.4    16.9
                    1.06         12.3%
                                                13.2    13.5    13.8    14.1    14.5
                    1.30         13.3%
                                                11.6    11.9    12.1    12.3    12.6
                    1.54         14.3%
                                                10.4    10.5    10.7    10.9    11.1
                    1.78         15.3%

Source: Bulltick


                                                                                       10
Multiples Analysis

Besides valuing MRV through our DCF model, we also performed multiple comparisons in
order to better understand the potential upside of the case. Our preferred multiple to
follow is PER09E, as we view 2009 as a more normalized year, not only to MRV but also
for its peers, when most of the growth companies are undergoing will be already factored
in.

Based on PER09E we see MRV trading at 9.1x, slightly discounted to the average for the
companies we cover. In our opinion, though, given the company’s superior growth
prospects and positioning, we see room for multiple expansion going forward, as results
start to be delivered.

Exhibit 15: PER09E ratios


                    16.0x                                                                        15.2x


                    12.0x                                                               11.3x
                                                                              11.1x
                                                                     10.1x
                                                           9.1x

                     8.0x
                                                  7.1x
                                       6.5x
                             6.1x


                     4.0x
                             Klabin   Company   Tecnisa     MRV     Average   Rossi     Cyrela   Gafisa


Source: Bulltick


Another multiple worth analyzing is PER adjusted to growth. Looking at the PER08E-to-
growth we separate more stabilized stories, with earlier capitalization in relation to MRV,
from those still in the upswing movement in terms of launchings and sales. Using this
multiple we view MRV discounted to most of its peers as shown on exhibit 18.

Exhibit 16: PEG08E ratios

                   0.60x


                                                                                                  0.48x
                   0.50x


                   0.40x

                                                                                         0.31x
                   0.30x

                                                                               0.22x
                   0.20x                                             0.16x
                                                           0.16x
                                                0.14x

                                      0.08x
                   0.10x
                            0.04x

                   0.00x
                            Klabin     MRV      Tecnisa   Company    Rossi    Average   Gafisa   Cyrela


Source: Bulltick


                                                                                                          11
Risks

                               As a real estate company, in our opinion, the major risk for MRV’s case lies on the
Risks: Brazilian
                               macroeconomic front. Although we classify this as improbable, if the Brazilian economy
macroeconomic scenario…
                               suffers any major downturn in the near future, it may impact interest rates and the
                               country stability, limiting growth for MRV and its peers.

                               Although in the short-term it is still far from being an issue to MRV given its geographic
… long run competition from
                               diversification, positioning and track record, we view the movements of big names like
the big three…
                               Gafisa, Rossi and Cyrela into MRV’s segment as a potential risk in the future. Increased
                               competition could impact margins and hurt the company’s profitability in the long run.

                               As a third risk impacting not only MRV but the whole sector, additional equity offerings
… and the real estate sector
                               expected to happen in the real estate sector could create short-term volatility for the
IPO pipeline.
                               shares as investors rebalance portfolios to participate in upcoming IPOs.


                                                                                                                      12
Brief Company Description

                              MRV story dates back to 1979 when it was founded in Belo Horizonte, Minas Gerais, by
                              Mr. Rubens Menin (current CEO). Over its long history in the real estate sector, MRV has
                              built a solid reputation among competition and especially with its clients.

                              Much before the Brazilian real estate sector boom, back in 1995, the company started
Geographically diversified
                              building the blocks to its current configuration by diversifying its operations
much before the current
Brazilian housing boom.       geographically. Currently, MRV reaches 35 cities in 8 states. The expansion was backed
                              by a structure of regional offices, which help to coordinate efforts on a local basis, given
                              the considerable distance from some cities to the headquarters and the need for local
                              support during real estate developments.

                              Exhibit 17: MRV’s geographical expansion timeline
                                                                                                                         Nova Lima, St Barbara do
                                                                                                                         Oeste, Taubaté, Paulínia,
                                                      2007
                                                                                                                         Serra, Mauá and Cotia

                                                                                                              Goiania
                                                      2006


                                                      2004                                                   Mogi das Cruzes and Santo André


                                                      2003                                             Araraquara


                                                                                                     Brasília, Rio de Janeiro and São Bernardo
                                                      2001

                                                                                                Maringá, Joinville, Marília, Jundiaí, Franca and
                                                      2000
                                                                                                São Paulo

                                                                                     Londrina and Curitiba
                                                      1999


                                                      1998                        São José dos Campos and São Carlos


                                                                               Piracicaba, Campinas, Sorocaba and Bauru
                                                      1997


                                                                       São José, Rio Preto and Ribeirão Preto
                                                      1996


                                                                   Uberaba, Urberlândia and Americana
                                                      1995


                                                              Contagem
                                                      1981


                                                      1979   Belo Horizonte


                              Source: MRV


                              The company is currently 100% focused in developing affordable housing, ranging from
100% focused in affordable
                              R$80,000 to R$200,000. It uses a highly standardized production process, based on 3
housing.
                              types of products: Parque, Spazio and Village. Alongside with its peers, the company
                              presented strong growth over the last couple of years given the improvements in the
                              Brazilian macroeconomic scenario.

                              Recently listed in BOVESPA’s Novo Mercado, MRV made a primary offering to prepare the
Listed in the Novo Mercado.
                              company to take advantage of the favorable winds and to profit from its unique
Primary-only offer prepared
                              positioning in the lower income segments. Exhibit 2 below summarizes the company’s
company to grow.
                              shareholding structure after the IPO conclusion.

                              Exhibit 18: MRV’s shareholders structure

                                 Rubens Menin       Autonomy Capital              Unno                     Maio                 MA Cabaleiro
                                                                                                                                                     Free Float
                                Teixeira de Souza       Two Sarl              Participações           Participações             Participações

                                        44,2%ON              11,6%ON                  5,3%ON                      2,5%ON                   2,5%ON         33,9%ON


                                                                                               MRV

                              Source: MRV


                                                                                                                                                                  13
Financial Statements

    Income Statement (R$ MM)       2005      2006     2007E    2008E    2009E     2010E     2011E     2012E
    Launchings                       184     337       950     1,850    2,405     2,766     3,042     3,194
     - Real Estate Sales             110      206       698     1,447    2,104     2,568     2,896     3,107

    Gross Revenues                  111      160       415      978     1,644     2,277     2,718     3,024
    Net Revenues                     95      140       390      942     1,584     2,194     2,619     2,913
     - COGS                          (58)     (91)     (236)    (557)     (953)   (1,350)   (1,624)   (1,821)
    Gross Profit                     37       50       154      385       631       844       995     1,092
     - Sales Expeditures               (6)    (11)      (36)     (83)     (121)     (148)     (167)     (179)
     - G&A Expenditures                (7)    (24)      (52)     (60)      (65)      (68)      (70)      (71)
     - Other Operational                0        9      (36)      26        39        51        59        62
    EBIT                             29       24         30     267       484       678       816       904
    Financial Results                  (1)      (3)       27      26         7         7         7         7
    Non-Operational Results          -           0         0     -         -         -         -         -
    EBT                              28       20         57     293       491       685       823       911
    Income Tax                         (4)      (3)     (28)     (44)      (74)     (103)     (124)     (137)
    Minority Interest                         -         -        -         -         -         -         -
    Net income                       24       17         29     249       417       583       700       775

    Depreciation                     0.1      0.2       0.6      1.0      1.5        1.7       1.9       2.1
    EBITDA                           25       22        21      243      446        629       760       844
    Adjustments                      -        -          61      -        -          -         -         -
    Adjusted EBITDA                  25       22        82      243      446        629       760       844

    Gross Margin                   39.3%     35.3%    39.5%    40.9%    39.8%     38.5%     38.0%     37.5%
    Adjusted EBITDA Margin         26.5%     16.0%    21.0%    25.8%    28.2%     28.7%     29.0%     29.0%
    Adjusted Net Margin            24.8%     12.1%    23.1%    26.5%    26.4%     26.6%     26.7%     26.6%
    Free Cash Flow                 2005      2006     2007E    2008E    2009E     2010E     2011E     2012E
    EBITDA                            25        22       21      243      446       629       760       844
    Taxes                             (4)       (4)      (4)     (40)      (73)    (102)     (122)     (136)
    Change in Net Working Assets     (20)      (69)    (330)    (444)    (434)     (383)     (222)     (111)
    CAPEX                             (0)       (2)      (3)      (5)       (3)      (3)       (3)       (4)
    FCFF                               1      (52)    (316)    (246)      (63)     142       412       594

    Balance Sheet                  2005      2006     2007E    2008E    2009E     2010E     2011E     2012E

    Assets
    Cash and Equivalents              8        9        631      135       135       135       135       135
    Accounts Receivable              78      129        409      888     1,140     1,414     1,551     1,608
    Inventories                      69      235        455      687     1,047     1,282     1,449     1,557
    Other                             3        7        261      594       556       681     1,034     1,536
    Total Assets                    158      380      1,755    2,305    2,878     3,512     4,169     4,836
    Liabilities
    Short Term Debt                    2      48         37       37        37        37        37        37
    Clients Advance Payments          13      28         28       19         9        12       -         -
    Long Term Debt                   -        17         14       14        14        14        14        14
    Other                             76     197        426      798     1,068     1,262     1,406     1,492
    Equity                           83       91      1,250    1,437    1,750     2,187     2,712     3,293
    Total Liabilities               158      380      1,755    2,305    2,878     3,512     4,169     4,836

Source: MRV and Bulltick


                                                                                                                14
Real Estate Stock Guide
                                                                                            Klabin                                   Average /
                                                         Com pany    Cyre la    Gafis a               Ros si     Tecnis a   M RV
                                                                                            Se gall                                    Total

                   Ticker                                  CPNY3      CYRE3       GFSA3      KSSA3      RSID3      TCSA3    MRVE3
                   Rating                                NEUTRAL        BUY         BUY       BUY        BUY        BUY      BUY
                   Current Price in R$                      33.74      21.72       28.25     17.10      46.39      10.70    28.99
                   Target Price in R$                       41.00      26.00       33.00     30.00      59.02      18.00    44.00
                   Potential Upisde in R$ terms             21.5%      19.7%       16.8%     75.4%      27.2%      68.2%    51.8%
                   Potential Upisde in US$ terms             8.3%       6.7%        4.1%     56.4%      13.4%      50.0%    35.3%
                   Market Cap in R$MM                       1,215      7,725       3,644       985      3,658      1,556    3,786       22,568
                   Firm Value in R$MM                       1,342      7,766       3,519       880      3,633      1,387    3,205       21,733

                   Operational Data
                   3-year CAGR
                         Launchings                         65.5%      16.5%       30.5%     24.3%      38.5%      66.8%    92.5%        33.1%
                         Net Revenue                        51.1%      45.0%       32.5%     88.4%      58.7%      82.8%    124.3%       56.6%
                         EBITDA                             59.0%      69.8%       68.1%     90.5%      99.2%      97.7%    170.7%       83.9%
                         Net Prof it                        60.2%      53.4%       73.3%    248.8%      95.9%      83.3%    190.6%       80.3%

                   EBITDA Margin
                         2006                               20.4%      18.4%       10.3%     27.4%      12.4%      23.1%    16.0%        16.5%
                         2007E                              21.7%      23.1%       10.8%     26.1%      20.0%      10.8%     5.3%        17.9%
                         2008E                              23.4%      26.2%       18.6%     27.1%      22.4%      26.9%    25.8%        24.0%
                         2009E                              23.8%      29.6%       21.0%     28.3%      24.5%      29.2%    28.2%        26.8%

                   Net Margin
                         2006                               15.8%      17.8%        6.9%      2.7%      10.6%      17.6%    12.1%        13.1%
                         2007E                              15.7%      25.0%        6.1%     18.8%      20.9%      10.3%     7.3%        16.8%
                         2008E                              17.9%      19.0%       13.3%     16.0%      18.6%      19.0%    26.5%        18.6%
                         2009E                              18.8%      21.1%       15.5%     17.5%      20.0%      17.8%    26.4%        20.0%


                   Capital Structure / Working Capital
                   Net Debt / Equity                        0.37x       0.02x        N.R.      N.R.       N.R.       N.R.    0.02x         N.R.
                   Net Debt / (Net Debt+Equity)             0.27x       0.02x        N.R.      N.R.       N.R.       N.R.    0.02x         N.R.
                   Net Debt / EBITDA07E                     1.26x       0.11x        N.R.      N.R.       N.R.       N.R.    1.17x         N.R.
                   Change in Net Working Capital
                         2006                                 88         735        397        408         90        175       69        1,962
                         2007E                               501       1,143        882        511       319         193      330        3,879
                         2008E                               531         276        439        817       269         496      444        3,271
                         2009E                               771       1,794        121        529       398         723      434        4,770

                   Current Liquidity                         3.0x        4.1x        4.2x      4.1x       4.4x       7.8x     2.3x         4.0x
                   Quick Ratio                               2.0x        2.2x        2.7x      1.6x       1.9x       3.9x     0.7x         2.1x

                   Valuation
                   FV/EBITDA
                         2007E                              13.3x       20.9x      34.8x      11.7x     26.5x       34.6x   155.6x        25.7x
                         2008E                               8.1x       18.6x      15.5x       5.7x     13.1x        7.3x    13.2x        13.0x
                         2009E                               5.7x        8.1x      10.8x       3.4x       9.0x       3.8x     7.2x         7.3x

                   2008 Multiple-to-Grow th
                                                            0.14x       0.27x      0.23x      0.06x     0.13x       0.08x    0.08x        0.15x
                         (3-year EBITDA CAGR)

                   PER
                         2007E                              16.7x       19.2x      64.2x      18.1x     25.5x       40.6x   132.0x        28.3x
                         2008E                               9.6x       25.4x      22.5x      10.9x     15.8x       11.6x    15.2x        17.4x
                         2009E                               6.5x       11.3x      15.2x       6.1x     11.1x        7.1x     9.1x        10.1x

                   2008 Multiple-to-Grow th
                                                            0.16x       0.48x      0.31x      0.04x     0.16x       0.14x    0.08x        0.22x
                        (3-year EPS CAGR)

                   FV/FCFF
                         2007E                                N.R.       N.R.        N.R.      N.R.       N.R.       N.R.     N.R.         N.R.
                         2008E                                N.R.       N.R.        N.R       N.R.       N.R.       N.R.     N.R.         N.R.
                         2009E                                N.R.       N.R.      22.6x       N.R.       N.R.       N.R.     N.R.         N.R.

                   FV/PSV
                         2007E                               1.4x        1.9x        2.1x      0.8x       2.1x       1.4x     3.4x         1.9x
                         2008E                               0.9x        1.5x        1.7x      0.7x       1.8x       1.2x     1.7x         1.4x
                         2009E                               0.8x        1.4x        1.6x      0.6x       1.5x       1.1x     1.3x         1.3x

                   PBR                                       3.7x        3.9x        2.5x      2.3x       3.2x       2.1x     3.1x         3.1x
Source: Bulltick


                                                                                                                                                  15
Macroeconomic Assumptions

                                         2007     2008     2009     2010     2011     2012
             Inflation                   4,2%     4,0%     4,0%     4,0%     4,0%     4,0%

             Selic Rate (Year End)      11,25%   10,50%   10,00%   10,00%   10,00%   10,00%
             Selic Rate (Average)       12,50%   11,50%   10,50%   10,00%   10,00%   10,00%

             Exchange Rate (Year End)     2,05     2,09     2,13     2,18     2,22     2,26
             Exchange Rate (Average)      2,09     2,07     2,11     2,15     2,20     2,24

             GDP Growth                  3,5%     4,0%     4,0%     4,0%     4,0%     4,0%

             TJLP                        6,3%     6,0%     6,0%     6,0%     6,0%     6,0%
             Libor                       6,0%     6,0%     6,0%     6,0%     6,0%     6,0%

Source: Bulltick


                                                                                              16
APPENDIX A
IMPORTANT DISCLOSURES


Bulltick Brasil Consultoria e Assessoria Empresarial Ltda. is an affiliate of Bulltick LLC (The Firm). Bulltick LLC may do
business with the companies covered in this report, as a result, investors should be aware that the Firm may have a
conflict of interest that could affect the objectivity of this report. Investors should consider this report only as a single
factor in making their investment decision.


A. CONFLICTS OF INTEREST

From the companies covered in this report, Bulltick Brasil Consultoria e Assessoria Empresarial Ltda, or its affiliates,
currently has, or has had within the past 12 months, Tecnisa and MRV as client and/or received compensation for products
and services provided to this company.

From the companies covered in this report, Bulltick Brasil Consultoria e Assessoria Empresarial Ltda, or its affiliates,
managed or co-managed a public offering of securities for Tecnisa and MRV in the past 12 months, received
compensation for investment banking services from Tecnisa and MRV in the past 12 months.

Neither Bulltick Brasil Consultoria e Assessoria Empresarial Ltda nor any of its affiliates own equity securities of any of the
subject companies.

Analyst compensation is determined by Bulltick Brasil Consultoria e Assessoria Empresarial Ltda management and is not
linked to specific transactions or recommendations.


B. ANALYST CERTIFICATION

I, Rafael Pinho, author of this report, hereby certify that all of the views expressed in this report accurately reflect my
personal views about any and all of the subject issuer(s) or securities, no part of my compensation was, is , or will be
directly or indirectly related to the specific recommendation(s) or view(s) in this report. I have not received any
compensation from any of the subject companies in the past 12 months. I also certify that neither I nor any member of
my household serves as a director, officer, or advisory board member of any of the subject companies in this report.


C. INVESTMENT RATING

Investment ratings are determined by the ranges described below:
BUY: Total return of securities expected to be above 18% (in dollar terms) in the following 12 months
NEUTRAL: Total return of securities expected to be below 18% (in dollar terms) and above 8% (in dollar terms) in the
following 12 months.
SELL: Total return of securities expected to be below 8% (in dollar terms) in the following 12 months.

Price Target: The valuation method used to determine the price targets in this report were based on the discounted
cash flow methodology.


D. RISK RATINGS

Risks for the achievement of the target prices defined in this report include major change in our base case macro-
economic scenario, increase in interest rates and in the Brazil risk, reduction in the expectations for demand for real
estate in Brazil and impact on already listed stocks of new IPOs in Brazil´s real estate sector.

Based on last 6 months volatility of subject companies, and comparing them to the volatility of the Bovespa Index
(Ibovespa) in the same period, we define each subject company´s relative volatility in the following way: Company
High, Cyrela High, Gafisa High, Klabin Segall High, MRV High, Rossi Residencial High and Tecnisa High

                                                                                                                            17
OTHER DISCLOSURES

Bulltick Brasil Consultoria e Assessoria Empresarial Ltda and its subsidiaries, affiliates, shareholders, directors, officers,
employees, and licensors (“The Bulltick Parties”) will not be liable (individually, jointly, or severally) to you or any other
person as a result of your access, reception or use of the information contained in this document for indirect,
consequential, special, incidental, punitive, or exemplary damages, including, without limitation, lost profits, lost savings
and lost revenues (collectively, the “Excluded Damages”), whether or not characterized in negligence, tort, contract, or
other theory of liability.

The information contained in this document has been obtained from sources believed to be reliable, although its
accuracy and completeness cannot be guaranteed. All opinions, projections, and estimates constitute the judgment of
the author as of the date of the report and these, plus any other information contained in the report, are subject to
change without notice. Prices and availability of financial instruments also are subject to change without notice.

Bulltick Brasil Consultoria e Assessoria Empresarial Ltda and its affiliated companies have not taken any steps to insure
that the securities referred to in this report are suitable for any particular investor. The Report is for informational
purposes only and is not intended as an offer or solicitation for the purchase or sale of a security. Securities mentioned
in the report are subject to investment risks, including the possible loss of the principal amount invested. Any decision
to purchase securities mentioned in the Report must take into account existing public information on such a security or
any registered prospectus.

The financial instruments mentioned in this document may not be eligible for sale in some countries. The Report is not
to be construed as providing investment services in any jurisdiction where the provision of such services would be
illegal.

Bulltick Brasil Consultoria e Assessoria Empresarial Ltda, its affiliated companies, and/or its officers, directors, or
shareholders, may from time to time have long or short positions in the financial instruments of the companies
mentioned in this document, engage in securities transactions in a manner inconsistent with this report, buy or sell from
customers on a principal basis, or serve in an advisory capacity.

Investing in non-US securities, including ADRs, may entail certain risks. The securities of non-US issuers may not be
registered with, and may not be subject to the reporting requirements of the US Securities and Exchange Commission.
There may be limited information available on foreign securities. Foreign companies are generally not subject to
uniform audit and reporting standards, practices and requirements comparable to those in the US Securities of some
foreign companies may be less liquid and their prices more volatile than securities of comparable US companies. In
addition, exchange rate movements may have an adverse effect on the value of an investment in a foreign stock and its
corresponding dividend payment for US investors.

The information contained in the report is privileged and confidential and intended solely for the recipients who have
been specifically authorized to receive it and it may not be further distributed. Bulltick Brasil Consultoria e Assessoria
Empresarial Ltda and its affiliates accept no liability whatsoever for the actions of third parties. Should you receive this
message by mistake you are hereby notified that any disclosure reproduction, distribution, or use of this message is
strictly prohibited.

The Report may provide the addresses of, or contain hyperlinks to, websites. Except to the extent to which the Report
refers to the website material of the Bulltick Brasil Consultoria e Assessoria Empresarial Ltda or any of its affiliates, the
Firm has not reviewed the linked site. Equally, except to the extent to which the Report refers to website material of
Bulltick Brasil Consultoria e Assessoria Empresarial Ltda or any of its affiliates, the Firm takes no responsibility for, and
makes no representation or warranties whatsoever as to, the data and information contained therein. Such address or
hyperlink (including addresses or hyperlinks to website material of Bulltick Brasil Consultoria e Assessoria Empresarial
Ltda or any of its affiliates) is provided solely for your convenience and information and the content of the linked site
does not in any way form part of this document. Accessing such website or following such link through the Report or
the website of Bulltick Brasil Consultoria e Assessoria Empresarial Ltda or any of its affiliates shall be at your own risk
and Bulltick Brasil Consultoria e Assessoria Empresarial Ltda or any of its affiliates shall have no liability arising out of,
or in connection with, and such referenced website.


                                                                                                                             18

Mais conteúdo relacionado

Mais procurados

monsanto 09-16-08b
monsanto 09-16-08bmonsanto 09-16-08b
monsanto 09-16-08b
finance28
 
PVR-Management Meet Note
PVR-Management Meet NotePVR-Management Meet Note
PVR-Management Meet Note
Angel Broking
 
Colliers International: Retail Highlights Fall 2010
Colliers International: Retail Highlights Fall 2010Colliers International: Retail Highlights Fall 2010
Colliers International: Retail Highlights Fall 2010
Coy Davidson
 
Navbharat Ventures Limited Investor Presentation
Navbharat Ventures Limited Investor PresentationNavbharat Ventures Limited Investor Presentation
Navbharat Ventures Limited Investor Presentation
AICL Communications
 
Cpfl energia ndrs citi_impres
Cpfl energia ndrs citi_impresCpfl energia ndrs citi_impres
Cpfl energia ndrs citi_impres
CPFL RI
 
Company profile
Company profileCompany profile
Company profile
Ishi1981
 
el paso 11_20_Hopper_BofACreditConferenceFINALv2(Web)
el paso  11_20_Hopper_BofACreditConferenceFINALv2(Web)el paso  11_20_Hopper_BofACreditConferenceFINALv2(Web)
el paso 11_20_Hopper_BofACreditConferenceFINALv2(Web)
finance49
 
Pantaloon Retail Result Update
Pantaloon Retail Result UpdatePantaloon Retail Result Update
Pantaloon Retail Result Update
Angel Broking
 
C&W - MONTREAL OFFICE MARKETBEAT - Q4 2012
C&W - MONTREAL  OFFICE MARKETBEAT - Q4 2012 C&W - MONTREAL  OFFICE MARKETBEAT - Q4 2012
C&W - MONTREAL OFFICE MARKETBEAT - Q4 2012
Guy Masse
 
Retail US Highlights Spring 2011
Retail US Highlights Spring 2011Retail US Highlights Spring 2011
Retail US Highlights Spring 2011
Coy Davidson
 
Total 2012 results presentation
Total 2012 results presentationTotal 2012 results presentation
Total 2012 results presentation
TradeWindsnews
 
4 Q07 And Fy07 Earnings Presentation
4 Q07 And Fy07 Earnings Presentation4 Q07 And Fy07 Earnings Presentation
4 Q07 And Fy07 Earnings Presentation
BRMALLS
 
2Q09 Earnings Presentation
2Q09 Earnings Presentation2Q09 Earnings Presentation
2Q09 Earnings Presentation
Gafisa RI !
 

Mais procurados (18)

monsanto 09-16-08b
monsanto 09-16-08bmonsanto 09-16-08b
monsanto 09-16-08b
 
Monsanto Q4 2008 Financial Results
Monsanto Q4 2008 Financial ResultsMonsanto Q4 2008 Financial Results
Monsanto Q4 2008 Financial Results
 
PVR-Management Meet Note
PVR-Management Meet NotePVR-Management Meet Note
PVR-Management Meet Note
 
ApresentaçãO Resultados Eng 4 T09 Final
ApresentaçãO Resultados Eng 4 T09 FinalApresentaçãO Resultados Eng 4 T09 Final
ApresentaçãO Resultados Eng 4 T09 Final
 
Colliers International: Retail Highlights Fall 2010
Colliers International: Retail Highlights Fall 2010Colliers International: Retail Highlights Fall 2010
Colliers International: Retail Highlights Fall 2010
 
Navbharat Ventures Limited Investor Presentation
Navbharat Ventures Limited Investor PresentationNavbharat Ventures Limited Investor Presentation
Navbharat Ventures Limited Investor Presentation
 
Las Vegas Americas Market Beat Industrial Q42011
Las Vegas Americas Market Beat Industrial Q42011Las Vegas Americas Market Beat Industrial Q42011
Las Vegas Americas Market Beat Industrial Q42011
 
Cpfl energia ndrs citi_impres
Cpfl energia ndrs citi_impresCpfl energia ndrs citi_impres
Cpfl energia ndrs citi_impres
 
Company profile
Company profileCompany profile
Company profile
 
el paso 11_20_Hopper_BofACreditConferenceFINALv2(Web)
el paso  11_20_Hopper_BofACreditConferenceFINALv2(Web)el paso  11_20_Hopper_BofACreditConferenceFINALv2(Web)
el paso 11_20_Hopper_BofACreditConferenceFINALv2(Web)
 
Deutsche EuroShop Interim Report H1 2009
Deutsche EuroShop Interim Report H1 2009Deutsche EuroShop Interim Report H1 2009
Deutsche EuroShop Interim Report H1 2009
 
Pantaloon Retail Result Update
Pantaloon Retail Result UpdatePantaloon Retail Result Update
Pantaloon Retail Result Update
 
C&W - MONTREAL OFFICE MARKETBEAT - Q4 2012
C&W - MONTREAL  OFFICE MARKETBEAT - Q4 2012 C&W - MONTREAL  OFFICE MARKETBEAT - Q4 2012
C&W - MONTREAL OFFICE MARKETBEAT - Q4 2012
 
Retail US Highlights Spring 2011
Retail US Highlights Spring 2011Retail US Highlights Spring 2011
Retail US Highlights Spring 2011
 
Total 2012 results presentation
Total 2012 results presentationTotal 2012 results presentation
Total 2012 results presentation
 
4 Q07 And Fy07 Earnings Presentation
4 Q07 And Fy07 Earnings Presentation4 Q07 And Fy07 Earnings Presentation
4 Q07 And Fy07 Earnings Presentation
 
MPL
MPLMPL
MPL
 
2Q09 Earnings Presentation
2Q09 Earnings Presentation2Q09 Earnings Presentation
2Q09 Earnings Presentation
 

Destaque

Destaque (14)

Road show Europe April 2007
Road show Europe April 2007Road show Europe April 2007
Road show Europe April 2007
 
Engaging Students Through Modern Means of Communication: Social Media for Soc...
Engaging Students Through Modern Means of Communication: Social Media for Soc...Engaging Students Through Modern Means of Communication: Social Media for Soc...
Engaging Students Through Modern Means of Communication: Social Media for Soc...
 
USA LATAM Road Show
USA LATAM Road ShowUSA LATAM Road Show
USA LATAM Road Show
 
Bringing Valuations Down To Earth
Bringing Valuations Down To EarthBringing Valuations Down To Earth
Bringing Valuations Down To Earth
 
Working Capital Management is King
Working Capital Management is KingWorking Capital Management is King
Working Capital Management is King
 
Hazem's story
Hazem's storyHazem's story
Hazem's story
 
Mexico Road Show
Mexico Road ShowMexico Road Show
Mexico Road Show
 
Boom Is Yet To Come
Boom Is Yet To ComeBoom Is Yet To Come
Boom Is Yet To Come
 
Plamen’s story
Plamen’s storyPlamen’s story
Plamen’s story
 
Gamification and BYOx in academic libraries: low end, practical approach
Gamification and BYOx in academic libraries: low end, practical approachGamification and BYOx in academic libraries: low end, practical approach
Gamification and BYOx in academic libraries: low end, practical approach
 
LMS (D2L) and Social Media (SM): friends or foes? Surveys open August 24, 1PM...
LMS (D2L) and Social Media (SM): friends or foes? Surveys open August 24, 1PM...LMS (D2L) and Social Media (SM): friends or foes? Surveys open August 24, 1PM...
LMS (D2L) and Social Media (SM): friends or foes? Surveys open August 24, 1PM...
 
Faculty migration from text-based to media-rich content: crowdsourcing the me...
Faculty migration from text-based to media-rich content: crowdsourcing the me...Faculty migration from text-based to media-rich content: crowdsourcing the me...
Faculty migration from text-based to media-rich content: crowdsourcing the me...
 
Gaming and gamification in academic and library settings
Gaming and gamification in academic and library settingsGaming and gamification in academic and library settings
Gaming and gamification in academic and library settings
 
M&M Bpr Final
M&M Bpr FinalM&M Bpr Final
M&M Bpr Final
 

Semelhante a MRV Initiation

Relat%c3%b3rio%20 final%20fgv%20sp
Relat%c3%b3rio%20 final%20fgv%20spRelat%c3%b3rio%20 final%20fgv%20sp
Relat%c3%b3rio%20 final%20fgv%20sp
arnaldoromera
 
Note Goldman Sachs sur Maroc Telecom Février 2013
Note Goldman Sachs sur Maroc Telecom Février 2013Note Goldman Sachs sur Maroc Telecom Février 2013
Note Goldman Sachs sur Maroc Telecom Février 2013
www.bourse-maroc.org
 
Bayer India- Result Update
Bayer India- Result UpdateBayer India- Result Update
Bayer India- Result Update
Angel Broking
 
NPK Investment Report - 9.23.10
NPK Investment Report - 9.23.10NPK Investment Report - 9.23.10
NPK Investment Report - 9.23.10
KevinSami
 
Petronet lng ru4 qfy2010-290410
Petronet lng ru4 qfy2010-290410Petronet lng ru4 qfy2010-290410
Petronet lng ru4 qfy2010-290410
Angel Broking
 
Hdil ru4 qfy2010-28052010
Hdil ru4 qfy2010-28052010Hdil ru4 qfy2010-28052010
Hdil ru4 qfy2010-28052010
Angel Broking
 
Areva t&d ru1 qcy2010-260410
Areva t&d ru1 qcy2010-260410Areva t&d ru1 qcy2010-260410
Areva t&d ru1 qcy2010-260410
Angel Broking
 
Elecon engineering ic- 14-05-10
Elecon engineering   ic- 14-05-10Elecon engineering   ic- 14-05-10
Elecon engineering ic- 14-05-10
Angel Broking
 
Elecon engineering ic- 14-05-10
Elecon engineering   ic- 14-05-10Elecon engineering   ic- 14-05-10
Elecon engineering ic- 14-05-10
Angel Broking
 
northrop grumman Q1 08 Earnings Presentation
northrop grumman	Q1 08 Earnings Presentationnorthrop grumman	Q1 08 Earnings Presentation
northrop grumman Q1 08 Earnings Presentation
finance8
 
northrop grumman Slide Presentation 2008 1st
northrop grumman Slide Presentation 2008 1stnorthrop grumman Slide Presentation 2008 1st
northrop grumman Slide Presentation 2008 1st
finance8
 
Crompton greaves ru4 qfy2010-180510
Crompton greaves ru4 qfy2010-180510Crompton greaves ru4 qfy2010-180510
Crompton greaves ru4 qfy2010-180510
Angel Broking
 
Crompton greaves ru4 qfy2010-180510
Crompton greaves ru4 qfy2010-180510Crompton greaves ru4 qfy2010-180510
Crompton greaves ru4 qfy2010-180510
Angel Broking
 
HUL ru4 qfy2010-250510
HUL ru4 qfy2010-250510HUL ru4 qfy2010-250510
HUL ru4 qfy2010-250510
Angel Broking
 
Hul ru4 qfy2010-250510
Hul ru4 qfy2010-250510Hul ru4 qfy2010-250510
Hul ru4 qfy2010-250510
Angel Broking
 

Semelhante a MRV Initiation (20)

Relat%c3%b3rio%20 final%20fgv%20sp
Relat%c3%b3rio%20 final%20fgv%20spRelat%c3%b3rio%20 final%20fgv%20sp
Relat%c3%b3rio%20 final%20fgv%20sp
 
Note Goldman Sachs sur Maroc Telecom Février 2013
Note Goldman Sachs sur Maroc Telecom Février 2013Note Goldman Sachs sur Maroc Telecom Février 2013
Note Goldman Sachs sur Maroc Telecom Février 2013
 
Bayer India- Result Update
Bayer India- Result UpdateBayer India- Result Update
Bayer India- Result Update
 
NPK Investment Report - 9.23.10
NPK Investment Report - 9.23.10NPK Investment Report - 9.23.10
NPK Investment Report - 9.23.10
 
Petronet lng ru4 qfy2010-290410
Petronet lng ru4 qfy2010-290410Petronet lng ru4 qfy2010-290410
Petronet lng ru4 qfy2010-290410
 
Marico
Marico Marico
Marico
 
BHEL -Result Update
BHEL -Result UpdateBHEL -Result Update
BHEL -Result Update
 
Hdil ru4 qfy2010-28052010
Hdil ru4 qfy2010-28052010Hdil ru4 qfy2010-28052010
Hdil ru4 qfy2010-28052010
 
JK Lakshmi
JK LakshmiJK Lakshmi
JK Lakshmi
 
Yes Bank
Yes BankYes Bank
Yes Bank
 
Alembic
Alembic Alembic
Alembic
 
Areva t&d ru1 qcy2010-260410
Areva t&d ru1 qcy2010-260410Areva t&d ru1 qcy2010-260410
Areva t&d ru1 qcy2010-260410
 
Elecon engineering ic- 14-05-10
Elecon engineering   ic- 14-05-10Elecon engineering   ic- 14-05-10
Elecon engineering ic- 14-05-10
 
Elecon engineering ic- 14-05-10
Elecon engineering   ic- 14-05-10Elecon engineering   ic- 14-05-10
Elecon engineering ic- 14-05-10
 
northrop grumman Q1 08 Earnings Presentation
northrop grumman	Q1 08 Earnings Presentationnorthrop grumman	Q1 08 Earnings Presentation
northrop grumman Q1 08 Earnings Presentation
 
northrop grumman Slide Presentation 2008 1st
northrop grumman Slide Presentation 2008 1stnorthrop grumman Slide Presentation 2008 1st
northrop grumman Slide Presentation 2008 1st
 
Crompton greaves ru4 qfy2010-180510
Crompton greaves ru4 qfy2010-180510Crompton greaves ru4 qfy2010-180510
Crompton greaves ru4 qfy2010-180510
 
Crompton greaves ru4 qfy2010-180510
Crompton greaves ru4 qfy2010-180510Crompton greaves ru4 qfy2010-180510
Crompton greaves ru4 qfy2010-180510
 
HUL ru4 qfy2010-250510
HUL ru4 qfy2010-250510HUL ru4 qfy2010-250510
HUL ru4 qfy2010-250510
 
Hul ru4 qfy2010-250510
Hul ru4 qfy2010-250510Hul ru4 qfy2010-250510
Hul ru4 qfy2010-250510
 

Último

FULL ENJOY Call Girls In Mahipalpur Delhi Contact Us 8377877756
FULL ENJOY Call Girls In Mahipalpur Delhi Contact Us 8377877756FULL ENJOY Call Girls In Mahipalpur Delhi Contact Us 8377877756
FULL ENJOY Call Girls In Mahipalpur Delhi Contact Us 8377877756
dollysharma2066
 
Quick Doctor In Kuwait +2773`7758`557 Kuwait Doha Qatar Dubai Abu Dhabi Sharj...
Quick Doctor In Kuwait +2773`7758`557 Kuwait Doha Qatar Dubai Abu Dhabi Sharj...Quick Doctor In Kuwait +2773`7758`557 Kuwait Doha Qatar Dubai Abu Dhabi Sharj...
Quick Doctor In Kuwait +2773`7758`557 Kuwait Doha Qatar Dubai Abu Dhabi Sharj...
daisycvs
 
FULL ENJOY Call Girls In Majnu Ka Tilla, Delhi Contact Us 8377877756
FULL ENJOY Call Girls In Majnu Ka Tilla, Delhi Contact Us 8377877756FULL ENJOY Call Girls In Majnu Ka Tilla, Delhi Contact Us 8377877756
FULL ENJOY Call Girls In Majnu Ka Tilla, Delhi Contact Us 8377877756
dollysharma2066
 
Call Girls in Delhi, Escort Service Available 24x7 in Delhi 959961-/-3876
Call Girls in Delhi, Escort Service Available 24x7 in Delhi 959961-/-3876Call Girls in Delhi, Escort Service Available 24x7 in Delhi 959961-/-3876
Call Girls in Delhi, Escort Service Available 24x7 in Delhi 959961-/-3876
dlhescort
 
Russian Call Girls In Gurgaon ❤️8448577510 ⊹Best Escorts Service In 24/7 Delh...
Russian Call Girls In Gurgaon ❤️8448577510 ⊹Best Escorts Service In 24/7 Delh...Russian Call Girls In Gurgaon ❤️8448577510 ⊹Best Escorts Service In 24/7 Delh...
Russian Call Girls In Gurgaon ❤️8448577510 ⊹Best Escorts Service In 24/7 Delh...
lizamodels9
 

Último (20)

FULL ENJOY Call Girls In Mahipalpur Delhi Contact Us 8377877756
FULL ENJOY Call Girls In Mahipalpur Delhi Contact Us 8377877756FULL ENJOY Call Girls In Mahipalpur Delhi Contact Us 8377877756
FULL ENJOY Call Girls In Mahipalpur Delhi Contact Us 8377877756
 
Business Model Canvas (BMC)- A new venture concept
Business Model Canvas (BMC)-  A new venture conceptBusiness Model Canvas (BMC)-  A new venture concept
Business Model Canvas (BMC)- A new venture concept
 
Mondelez State of Snacking and Future Trends 2023
Mondelez State of Snacking and Future Trends 2023Mondelez State of Snacking and Future Trends 2023
Mondelez State of Snacking and Future Trends 2023
 
Quick Doctor In Kuwait +2773`7758`557 Kuwait Doha Qatar Dubai Abu Dhabi Sharj...
Quick Doctor In Kuwait +2773`7758`557 Kuwait Doha Qatar Dubai Abu Dhabi Sharj...Quick Doctor In Kuwait +2773`7758`557 Kuwait Doha Qatar Dubai Abu Dhabi Sharj...
Quick Doctor In Kuwait +2773`7758`557 Kuwait Doha Qatar Dubai Abu Dhabi Sharj...
 
FULL ENJOY Call Girls In Majnu Ka Tilla, Delhi Contact Us 8377877756
FULL ENJOY Call Girls In Majnu Ka Tilla, Delhi Contact Us 8377877756FULL ENJOY Call Girls In Majnu Ka Tilla, Delhi Contact Us 8377877756
FULL ENJOY Call Girls In Majnu Ka Tilla, Delhi Contact Us 8377877756
 
RSA Conference Exhibitor List 2024 - Exhibitors Data
RSA Conference Exhibitor List 2024 - Exhibitors DataRSA Conference Exhibitor List 2024 - Exhibitors Data
RSA Conference Exhibitor List 2024 - Exhibitors Data
 
Dr. Admir Softic_ presentation_Green Club_ENG.pdf
Dr. Admir Softic_ presentation_Green Club_ENG.pdfDr. Admir Softic_ presentation_Green Club_ENG.pdf
Dr. Admir Softic_ presentation_Green Club_ENG.pdf
 
Value Proposition canvas- Customer needs and pains
Value Proposition canvas- Customer needs and painsValue Proposition canvas- Customer needs and pains
Value Proposition canvas- Customer needs and pains
 
Phases of Negotiation .pptx
 Phases of Negotiation .pptx Phases of Negotiation .pptx
Phases of Negotiation .pptx
 
Katrina Personal Brand Project and portfolio 1
Katrina Personal Brand Project and portfolio 1Katrina Personal Brand Project and portfolio 1
Katrina Personal Brand Project and portfolio 1
 
Forklift Operations: Safety through Cartoons
Forklift Operations: Safety through CartoonsForklift Operations: Safety through Cartoons
Forklift Operations: Safety through Cartoons
 
Call Girls in Delhi, Escort Service Available 24x7 in Delhi 959961-/-3876
Call Girls in Delhi, Escort Service Available 24x7 in Delhi 959961-/-3876Call Girls in Delhi, Escort Service Available 24x7 in Delhi 959961-/-3876
Call Girls in Delhi, Escort Service Available 24x7 in Delhi 959961-/-3876
 
Monthly Social Media Update April 2024 pptx.pptx
Monthly Social Media Update April 2024 pptx.pptxMonthly Social Media Update April 2024 pptx.pptx
Monthly Social Media Update April 2024 pptx.pptx
 
Organizational Transformation Lead with Culture
Organizational Transformation Lead with CultureOrganizational Transformation Lead with Culture
Organizational Transformation Lead with Culture
 
It will be International Nurses' Day on 12 May
It will be International Nurses' Day on 12 MayIt will be International Nurses' Day on 12 May
It will be International Nurses' Day on 12 May
 
John Halpern sued for sexual assault.pdf
John Halpern sued for sexual assault.pdfJohn Halpern sued for sexual assault.pdf
John Halpern sued for sexual assault.pdf
 
A DAY IN THE LIFE OF A SALESMAN / WOMAN
A DAY IN THE LIFE OF A  SALESMAN / WOMANA DAY IN THE LIFE OF A  SALESMAN / WOMAN
A DAY IN THE LIFE OF A SALESMAN / WOMAN
 
B.COM Unit – 4 ( CORPORATE SOCIAL RESPONSIBILITY ( CSR ).pptx
B.COM Unit – 4 ( CORPORATE SOCIAL RESPONSIBILITY ( CSR ).pptxB.COM Unit – 4 ( CORPORATE SOCIAL RESPONSIBILITY ( CSR ).pptx
B.COM Unit – 4 ( CORPORATE SOCIAL RESPONSIBILITY ( CSR ).pptx
 
Call Girls Pune Just Call 9907093804 Top Class Call Girl Service Available
Call Girls Pune Just Call 9907093804 Top Class Call Girl Service AvailableCall Girls Pune Just Call 9907093804 Top Class Call Girl Service Available
Call Girls Pune Just Call 9907093804 Top Class Call Girl Service Available
 
Russian Call Girls In Gurgaon ❤️8448577510 ⊹Best Escorts Service In 24/7 Delh...
Russian Call Girls In Gurgaon ❤️8448577510 ⊹Best Escorts Service In 24/7 Delh...Russian Call Girls In Gurgaon ❤️8448577510 ⊹Best Escorts Service In 24/7 Delh...
Russian Call Girls In Gurgaon ❤️8448577510 ⊹Best Escorts Service In 24/7 Delh...
 

MRV Initiation

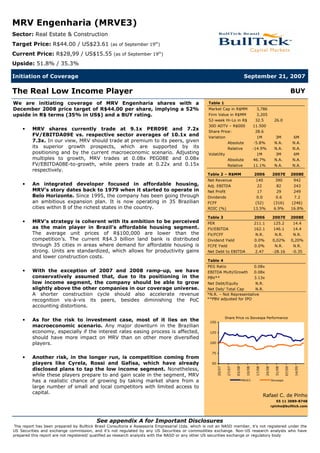
  • 1. MRV Engenharia (MRVE3) Sector: Real Estate & Construction Target Price: R$44.00 / US$23.61 (as of September 19th) Current Price: R$28,99 / US$15.55 (as of September 19th) Upside: 51.8% / 35.3% Initiation of Coverage September 21, 2007 The Real Low Income Player BUY We are initiating coverage of MRV Engenharia shares with a Table 1 December 2008 price target of R$44.00 per share, implying a 52% Market Cap in R$MM 3,786 upside in R$ terms (35% in US$) and a BUY rating. Firm Value in R$MM 3,205 52-week Hi-Lo in R$ 32.5 26.0 30D ADTV – R$000 11.500 MRV shares currently trade at 9.1x PER09E and 7.2x • Share Price: 28.6 FV/EBITDA09E vs. respective sector averages of 10.1x and Variation 1M 3M 6M 7.3x. In our view, MRV should trade at premium to its peers, given Absolute -5.8% N.A. N.A. its superior growth prospects, which are supported by its Relative -14.9% N.A. N.A. positioning and by the current macroeconomic scenario. Adjusting Volatility 1M 3M 6M multiples to growth, MRV trades at 0.08x PEG08E and 0.08x Absolute 46.7% N.A. N.A. FV/EBITDA08E-to-growth, while peers trade at 0.22x and 0.15x Relative 11.1% N.A. N.A. respectively. Table 2 – R$MM 2006 2007E 2008E Net Revenue 140 390 942 An integrated developer focused in affordable housing, • Adj. EBITDA 22 82 243 MRV’s story dates back to 1979 when it started to operate in Net Profit 17 29 249 Belo Horizonte. Since 1995, the company has been going through Dividends 0.0 0.6 7.2 an ambitious expansion plan. It is now operating in 35 Brazilian FCFF (52) (316) (246) cities within 8 of the richest states in the country. ROIC (%) 13.5% 6.9% 16.8% Table 3 2006 2007E 2008E MRV’s strategy is coherent with its ambition to be perceived • PER 211.1 125.2 14.4 as the main player in Brazil’s affordable housing segment. FV/EBITDA 162.1 146.1 14.4 The average unit prices of R$100,000 are lower than the FV/FCFF N.R. N.R. N.R. competition’s. The current R$4.3 billion land bank is distributed Dividend Yield 0.0% 0,02% 0,20% through 35 cities in areas where demand for affordable housing is FCFE Yield 0.0% N.R. N.R. strong. Units are standardized, which allows for productivity gains Net Debt to EBITDA 2.47 -28.16 -0.35 and lower construction costs. Table 4 PEG Ratio 0.08x With the exception of 2007 and 2008 ramp-up, we have • EBITDA Multi/Growth 0.08x conservatively assumed that, due to its positioning in the PBV** 3.13x low income segment, the company should be able to grow Net Debt/Equity N.R. slightly above the other companies in our coverage universe. Net Deb/ Total Cap N.R. A shorter construction cycle should also accelerate revenue *N.R. – Not Representative **PBV adjusted for IPO recognition vis-à-vis its peers, besides diminishing the PoC accounting distortions. Share Price vs Ibovespa Performance As for the risk to investment case, most of it lies on the • 150 macroeconomic scenario. Any major downturn in the Brazilian economy, especially if the interest rates easing process is affected, 125 should have more impact on MRV than on other more diversified players. 100 75 Another risk, in the longer run, is competition coming from • players like Cyrela, Rossi and Gafisa, which have already 50 20/07 27/07 03/08 10/08 17/08 24/08 31/08 07/09 14/09 disclosed plans to tap the low income segment. Nonetheless, while these players prepare to and gain scale in the segment, MRV has a realistic chance of growing by taking market share from a MRVE3 Ibovespa large number of small and local competitors with limited access to capital. Rafael C. de Pinho 55 11 3089-8748 rpinho@bulltick.com See appendix A for Important Disclosures This report has been prepared by Bulltick Brasil Consultoria e Assessoria Empresarial Ltda. which is not an NASD member, it’s not registered under the US Securities and exchange commission, and it’s not regulated by any US Securities or commodities exchange. Non-US research analysts who have prepared this report are not registered/ qualified as research analysts with the NASD or any other US securities exchange or regulatory body
  • 2. Investment Thesis: Three Reasons Why we Like MRV 1 – MRV is well positioned to profit from the Brazilian housing boom. Among Brazil’s listed real estate companies, MRV is the only one who can claim full Positioning: Fully exposed exposure to lower income segments. Some of the major players in the sector recently to lower income segments. disclosed their strategies to tap lower income segments which will include: (i) shift land banks from now on to more affordable housing projects; (ii) redesign products and brands and (iii) launch a higher percentage of affordable segment projects as a percentage of the launchings pipeline going forward. However, 20% to 25% exposure to the segment in terms of future launchings does not look enough. Investors willing to play the low income segment in Brazil have MRV as an option that presents proven and sound track record and a solid brand, widely recognized as being 100% focused in the affordable housing segment. Below we present the recent evolution of launchings in terms of average price per unit Recent launchings track launched by some developers. It is important to note MRV is way ahead of competition in record: consistent with terms of product positioning in the lower income segments. positioning. Exhibit 1: Average price/unit launched – in R$ thousands 600 500 400 300 200 100 - Company Cyrela Gafisa Klabin Rossi Tecnisa MRV Rodobens Segall 2005 2006 1H07 Source: Companies and Bulltick The first requisite to launch low income developments, as for any development, is to have the land bank in the right place. We present below MRV’s land bank as of 2Q07. Exhibit 2: MRV’s Land Bank and Average Unit Prices State PSV (R$ MM) % Potential Units Avg Price (R$/Unit) SP 2,619 60.4% 24,924 105,099 MG 779 18.0% 9,588 81,271 RJ 235 5.4% 2,960 79,364 DF 210 4.8% 1,542 136,267 ES 179 4.1% 1,912 93,778 GO 172 4.0% 1,734 99,250 PR 122 2.8% 1,324 91,993 SC 17 0.4% 181 95,647 4,334 100% 44,165 98,138 Source: MRV It is interesting to note that not only past launchings show MRV consistent positioning in Land bank’s average unit the segment, but also does the profile of its R$4.3 billion PSV land bank going forward. price: R$98,138. Besides being diversified in 36 cities within 8 of the richest states in Brazil, unit sales prices are on average R$98,138. The cities where MRV’s land bank is located and the strategy behind their choice are also MRV’s current competition worth mentioning. MRV targets cities with at least 200,000 inhabitants, where it will is formed by small players… normally find enough demand for its developments. Besides having demand in place, this kind of city presents an advantage: lack of competition. As the major players are 2
  • 3. traditionally more active in state capitals, in most of the cases MRV ends up competing in most of the cases against small local players, which lack the capital and structure to be fierce opponents. Exhibit 3: Geographic Positioning – MRV GOIÁS Brasília MINAS GERAIS Goiânia BRAZIL Belo Horizonte Uberaba Uberlândia Contagem Nova Lima ESPÍRITO SANTO Serra RIO DE JANEIRO PARANÁ Rio de Janeiro Curitiba Londrina Maringá SÃO PAULO São Paulo Campinas SANTA São Bernardo Sta. Bárbara do Oeste S.J. Campos Piracicaba CATARINA Santo André Americana Mauá Paulínia Taubaté Marília Joinville Cotia Bauru Sorocaba Araraquara Mogi das Cruzes São Carlos Jundiaí Ribeirão Preto S.J. Rio Preto Franca Source: MRV Last but not least, we shall examine MRV’s product strategy. Building affordable housing Key to profitability in low is something that demands a change in the way traditional companies look at the income housing: standardization. development process. Instead of tailor-made projects, standardization comes in play as a key to a successful and profitable operation. Exhibit 5 shows our view of different product levels and the corresponding price sensitivity at each level. Exhibit 4: Real Estate Product Levels Source: Bulltick MRV positioned itself as a leader in the low income segment by understanding clients’ Standardization: 3 basic demand for monthly installments to fit their income. Standardization was the answer to products replicated decrease unit prices. The company designed 3 basic types of projects that are used everywhere… depending on the local demand. 3
  • 4. On top of minimizing design costs other companies face on a per-project basis, the … resulting in low design costs and allowing for gains approval process tends to be faster as the standardized project becomes known of the of scale. authorities. Additionally, raw material purchases can be concentrated on fewer suppliers and executed by the company’s headquarters in a centralized manner, allowing for gains of scale. Exhibit 6 depicts the three basic product types designed by MRV. Exhibit 5: MRV’s Product Types Village 100-220 Two parking spaces; Two to four bedrooms with suite. Spazio Unit Price (R$ thousands) 70-140 One parking space; Two to three bedrooms, suite option; Balcony. Parque One parking space; Two 77 to three bedrooms, no suite option. 40-55 42-70 70-120 Apartment Area (m2) Source: MRV and Bulltick 4
  • 5. 2 – MRV is sticking to the right strategy Besides being uniquely positioned, the company has a solid brand name in a segment MRV has no reason to where most of the big names either lack one or are still in the making. Additionally, the change. On the contrary, competition will have to capital investment made earlier this year by Autonomy Capital allowed the company to change. accelerate its already fast-paced growth plans and expand its land bank. The latest boost to the company’s growth plans came after the roughly R$1 billion in equity issued. Growth way before the IPO. Differently from many real estate companies, MRV has been paving its growth long before its IPO. Not only has the company been growing operationally, but also geographically. MRV’s geographical expansion which started in 1995 and since then reached 35 cities, followed a logical path, using regional offices as operational hubs from where it expanded to surrounding cities. The results of such strategy can be seen on exhibit 7, a 61% and 43% CAGR in the PSV of launchings and in contracted sales, respectively, in the 2004- 2006 period. Exhibit 6: Operational Highlights 2004 2005 2006 1H07 CAGR '04-'06 Launchings Launching PSV - MRV Stake - (R$ MM) 130 184 337 433 61% Average Price per Unit Launched - (R$) 80,477 104,166 112,935 96,910 2 Launched Usable Area (m ) 101,434 133,294 229,331 286,595 Number of developments launched 28 45 67 61 Number of units launched 1,618 1,769 2,987 4,463 36% 2 Average Price (R$/m ) 1,312 1,421 1,512 1,723 Sales Contracted Sales - MRV Stake - (R$ MM) 100 110 206 276 43% Average Price per Unit Sold - (R$) 66,611 81,038 99,201 103,869 2 Usable area sold (m ) 88,703 90,043 148,953 181,799 Number of units sold 1,506 1,361 2,079 2,658 17% 2 Average Price (R$/m ) 1,148 1,245 1,430 1,627 Source: MRV Despite the accelerated expansion observed in recent years, MRV has ambitious growth “MRV 40,000”: strategic moves and debottlenecking plans for the coming years: recently it has disclosed the “MRV 40,000” initiative, to boost production. consisting of a plan to enable the company to deliver 40,000 units a year. In order to do that, MRV started by defining production objectives for each team in the company in terms of production. In order to reach those objectives, the company’s processes and production bottlenecks were mapped so that the teams could start working on solving them. Additionally, such an ambitious plan would not be possible without heavy technological support. MRV has ERP software running to manage its different construction sites and is taking steps to make its systems capable of handling the desired volumes. Regarding measures of the plan already taken, the regional offices administrative routines and all the purchasing structures are now centralized as much as possible in Belo Horizonte, leaving the regional offices focus on operational and commercial issues regarding the developments. 5
  • 6. 3 - Macroeconomic scenario: winds are blowing in the right direction The elements that allow for MRV to grow and exploit Brazil’s enormous housing deficit apply to every other company in the sector: the country’s monetary easing process, increased credit availability, economic stability and higher populations’ disposable income. Nonetheless, MRV’s case is much more dependent on these fundamentals due to its average client profile. Our view is that not only these conditions are sustainable, given the current economic scenario, but are improving much faster than previously expected, especially when credit availability is concerned. As mortgages become increasingly affordable vis-à-vis other options such as paying rents and the country’s economic stability is assimilated by the average Brazilian, the idea of contracting mortgages, a long term commitment, is seriously considered. Nonetheless, it was not long ago when as companies had to finance clients given banks limited appetite for mortgages. In order to do that, construction had to be delayed as much as possible so cash flows became smoother and working capital requirements reduced. The solution allowing MRV to meet client’s needs and desires became concrete as banks’ Private banks willingness to willingness to lend money to homebuyers shifted from apathy to a frantic market share lend money allowed for fight. Banks came in to lend homebuyers money as soon as construction was finished, in shorter construction cycles. turn enabling the company to curtail the construction cycle, delivering products faster. This way, besides solving marketing issues, the cash flows of a typical development were improved as a project can be developed faster than previously, yielding better returns. Mortgage conditions have improved much faster than previously expected by market Mortgage conditions are participants. As the recent offer of 90% of loan-to-value mortgages by Caixa Econômica improving faster than Federal reaches the overall market, in the near future, the biggest barrier to real estate expected. purchase decision, down payment, should be minimized. The down payment issue is especially important when we put in perspective the fact that the Brazilian population is not prone to savings. As a result, most of the low-income families cannot hold up for the current 20% down payment standard. On top of the favorable macro scenario, demographics in Brazil also show MRV has large Demographics point to at room to grow in the coming years. The most recent census in Brazil points out for the least 21 target cities within existence of at least 21 cities with around 200 thousand inhabitants, where the GDP per MRV’s geographical reach. capita indicates potential for MRV to prospect business. Our analysis included only cities within MRV’s current geographic presence in the Southeast, South and Midwest regions of Brazil. Exhibit 7: Potential New Cities, GDP per capita vs. inhabitants 1,800 P o rt o A le gre 1,600 G ua rulho s 1,400 1,200 D uque de C a xia s 1,000 Osasco 800 C uia bá N it e ró i 600 D ia de m a C a xia s do S ul F lo ria nó po lis C a no a s S uza no 400 P re s ide nt e P rude nt e 200 S ã o J o s é do s A ra ç a t uba Inda ia t uba P inha is - 0 5,000 10,000 15,000 20,000 25,000 30,000 35,000 P e r C a pit a GD P ( R $ ) Source: IBGE, Bulltick 6
  • 7. Exhibit 8: MRV’s Current Markets, GDP per capita vs. inhabitants 3,000 B e lo H o rizo nt e B ra s í lia 2,500 2,000 C urit iba 1,500 C a m pina s S ã o B e rna rdo do C a m po Sã o J o s é do s 1,000 C a m po s Ube rlâ ndiaS a nt o A ndré M a uá Lo ndrina S o ro c a ba P ira c ic a ba B a uru S e rra J o inv ille 500 M a ringá T a uba t é J undia í F ra nc a Ube ra ba C o t ia M a rí lia A m e ric a na - 0 5,000 10,000 15,000 20,000 25,000 30,000 35,000 P e r C a pit a G D P ( R $ ) Source: IBGE, Bulltick 7
  • 8. Valuation We defined MRV shares price target using a DCF-based model and then compared its We discount MRV’s cash multiples with the peers in our coverage universe. In order to reach our DCF PT we flows at the highest WACC assumption among covered discounted cash flows to the firm (FCFF) at a WACC of 13.26% in R$ terms, the highest companies. for companies in our coverage universe. We also applied a 4% nominal perpetuity growth in R$ terms. Exhibit 11 depicts our discount rates, target capital structure, the resulting WACC and valuation outcome. Our total return target price for Dec. 2008 reaches R$44.00 for MRV shares, implying a potential upside of 51.8% in R$ (or 35.3% in US$) and a BUY rating. Exhibit 9: Discount and Growth Rates US Risk Free Rate 4.5% Brazil Country Risk 1.75% Beta 1.30 Equity Risk Premium 6.0% LT R$ Depreciation 2.0% Ke (R$) 16.05% Weight - Equity 70.00% Cost of Debt, in R$, Before Taxes 10.3% Effective Tax Rate 34.0% Kd (R$) 6.77% Weight - Debt 30.00% WACC (R$) 13.26% Forecasted Period 2007 – 2020 Perpetuity Growth 4.00% Source: Bulltick It is interesting to note MRV’s cash flows become positive sooner that those of other real estate companies. The difference lies on its lower working capital needs, a direct result of its business model. For more details please refer to the investment case section. Exhibit 10: Cash Flows 2005 2006 2007E 2008E 2009E 2010E 2011E 2012E EBITDA 25 22 21 243 446 629 760 844 Taxes (4) (4) (4) (40) (73) (102) (122) (136) Change in Net Working Assets (20) (69) (330) (444) (434) (383) (222) (111) CAPEX (0) (2) (3) (5) (3) (3) (3) (4) FCFF 1 (52) (316) (246) (63) 142 412 594 Source: Bulltick Main Valuation Assumptions and Sensitivity Analysis Our DCF model main inputs are the potential sales value (PSV) of launchings and the company’s typical sales velocity, client payments and construction schedule, from which we derive cash flows. Except for gross margins, which we conservatively reduce at a 50 bps / year pace, we use the other inputs in line with the company’s current business model. It is important to notice that so far the company has delivered results in line or above these expectations. We view MRV as well positioned to have sustainable and above-average launchings growth. The company should deliver explosive 180% and 95% launchings growth in 2007 and 2008 respectively. Investors should bear in mind that the land bank to support this growth is secured, as stated in 2Q07 results release. Additionally, we expect MRV to deliver growth at ratios slightly above its peers in the long run. The normalized launchings and growth assumptions in the 2008-2012 period for covered companies are summarized in exhibit 13. 8
  • 9. Exhibit 11: Launchings Growth 2008-2012 250 Growth: conservatively in line with higher segment 225 companies under coverage. Index (2007 = 100) 200 175 150 125 100 2008 2009 2010 2011 2012 MRV Company Cyrela Gafisa Klabin Segall Rossi Tecnisa Source: Bulltick The faster pace applied to construction by MRV results in faster revenue recognition when compared to other players, as it can be seen on exhibit 13 below. Additionally, exhibit 12 shows our sales velocity and construction costs assumptions for typical MRV’s developments. Exhibit 12: Revenue Recognition Assumptions 6M 12M 18M 24M Sales Velocity 60% 14% 14% 12% Cost Incurred 17% 42% 42% 0% Recognized Revenues 10% 33% 45% 12% Source: Bulltick Exhibit 13: Revenue Recognition Patterns 120% Shorter construction cycle 100% translates in faster revenue 100% recognition. 80% 60% 43% 40% 20% 0% Launching 1st Year 2nd Year 3rd Year Cyrela Klabin Segall Rossi Gafisa Company Tecnisa MRV Source: Bulltick 9
  • 10. On exhibit 16 we show sensitivity analysis based on the variation of WACC and long-term growth rates. Exhibit 14: Sensitivity Analysis Mkt. Cap. (R$M) Beta WACC g 3.0% 3.5% 4.0% 4.5% 5.0% 7,263 7,493 7,755 8,055 8,404 0.82 11.3% 6,282 6,444 6,625 6,830 7,063 1.06 12.3% 5,499 5,616 5,746 5,890 6,052 1.30 13.3% 4,863 4,949 5,043 5,147 5,263 1.54 14.3% 4,335 4,400 4,470 4,547 4,631 1.78 15.3% Dec. 08 Tgt. Price (R$/Share) Beta WACC g 3.0% 3.5% 4.0% 4.5% 5.0% 55.6 57.4 59.4 61.7 64.4 0.82 11.3% 48.1 49.3 50.7 52.3 54.1 1.06 12.3% 42.1 43.0 44.0 45.1 46.3 1.30 13.3% 37.2 37.9 38.6 39.4 40.3 1.54 14.3% 33.2 33.7 34.2 34.8 35.5 1.78 15.3% Upside Potential (%) Beta WACC g 3.0% 3.5% 4.0% 4.5% 5.0% 91.8% 97.9% 104.8% 112.8% 122.0% 0.82 11.3% 65.9% 70.2% 75.0% 80.4% 86.6% 1.06 12.3% 45.3% 48.4% 51.8% 55.6% 59.9% 1.30 13.3% 28.4% 30.7% 33.2% 36.0% 39.0% 1.54 14.3% 14.5% 16.2% 18.1% 20.1% 22.3% 1.78 15.3% FV/EBITDA 09 at Target Beta WACC g 3.0% 3.5% 4.0% 4.5% 5.0% 16.1 16.6 17.2 17.9 18.7 0.82 11.3% 13.9 14.3 14.7 15.1 15.6 1.06 12.3% 12.1 12.4 12.7 13.0 13.4 1.30 13.3% 10.7 10.9 11.1 11.3 11.6 1.54 14.3% 9.5 9.7 9.8 10.0 10.2 1.78 15.3% P/E 09 at Target Beta WACC g 3.0% 3.5% 4.0% 4.5% 5.0% 17.4 17.9 18.6 19.3 20.1 0.82 11.3% 15.0 15.4 15.9 16.4 16.9 1.06 12.3% 13.2 13.5 13.8 14.1 14.5 1.30 13.3% 11.6 11.9 12.1 12.3 12.6 1.54 14.3% 10.4 10.5 10.7 10.9 11.1 1.78 15.3% Source: Bulltick 10
  • 11. Multiples Analysis Besides valuing MRV through our DCF model, we also performed multiple comparisons in order to better understand the potential upside of the case. Our preferred multiple to follow is PER09E, as we view 2009 as a more normalized year, not only to MRV but also for its peers, when most of the growth companies are undergoing will be already factored in. Based on PER09E we see MRV trading at 9.1x, slightly discounted to the average for the companies we cover. In our opinion, though, given the company’s superior growth prospects and positioning, we see room for multiple expansion going forward, as results start to be delivered. Exhibit 15: PER09E ratios 16.0x 15.2x 12.0x 11.3x 11.1x 10.1x 9.1x 8.0x 7.1x 6.5x 6.1x 4.0x Klabin Company Tecnisa MRV Average Rossi Cyrela Gafisa Source: Bulltick Another multiple worth analyzing is PER adjusted to growth. Looking at the PER08E-to- growth we separate more stabilized stories, with earlier capitalization in relation to MRV, from those still in the upswing movement in terms of launchings and sales. Using this multiple we view MRV discounted to most of its peers as shown on exhibit 18. Exhibit 16: PEG08E ratios 0.60x 0.48x 0.50x 0.40x 0.31x 0.30x 0.22x 0.20x 0.16x 0.16x 0.14x 0.08x 0.10x 0.04x 0.00x Klabin MRV Tecnisa Company Rossi Average Gafisa Cyrela Source: Bulltick 11
  • 12. Risks As a real estate company, in our opinion, the major risk for MRV’s case lies on the Risks: Brazilian macroeconomic front. Although we classify this as improbable, if the Brazilian economy macroeconomic scenario… suffers any major downturn in the near future, it may impact interest rates and the country stability, limiting growth for MRV and its peers. Although in the short-term it is still far from being an issue to MRV given its geographic … long run competition from diversification, positioning and track record, we view the movements of big names like the big three… Gafisa, Rossi and Cyrela into MRV’s segment as a potential risk in the future. Increased competition could impact margins and hurt the company’s profitability in the long run. As a third risk impacting not only MRV but the whole sector, additional equity offerings … and the real estate sector expected to happen in the real estate sector could create short-term volatility for the IPO pipeline. shares as investors rebalance portfolios to participate in upcoming IPOs. 12
  • 13. Brief Company Description MRV story dates back to 1979 when it was founded in Belo Horizonte, Minas Gerais, by Mr. Rubens Menin (current CEO). Over its long history in the real estate sector, MRV has built a solid reputation among competition and especially with its clients. Much before the Brazilian real estate sector boom, back in 1995, the company started Geographically diversified building the blocks to its current configuration by diversifying its operations much before the current Brazilian housing boom. geographically. Currently, MRV reaches 35 cities in 8 states. The expansion was backed by a structure of regional offices, which help to coordinate efforts on a local basis, given the considerable distance from some cities to the headquarters and the need for local support during real estate developments. Exhibit 17: MRV’s geographical expansion timeline Nova Lima, St Barbara do Oeste, Taubaté, Paulínia, 2007 Serra, Mauá and Cotia Goiania 2006 2004 Mogi das Cruzes and Santo André 2003 Araraquara Brasília, Rio de Janeiro and São Bernardo 2001 Maringá, Joinville, Marília, Jundiaí, Franca and 2000 São Paulo Londrina and Curitiba 1999 1998 São José dos Campos and São Carlos Piracicaba, Campinas, Sorocaba and Bauru 1997 São José, Rio Preto and Ribeirão Preto 1996 Uberaba, Urberlândia and Americana 1995 Contagem 1981 1979 Belo Horizonte Source: MRV The company is currently 100% focused in developing affordable housing, ranging from 100% focused in affordable R$80,000 to R$200,000. It uses a highly standardized production process, based on 3 housing. types of products: Parque, Spazio and Village. Alongside with its peers, the company presented strong growth over the last couple of years given the improvements in the Brazilian macroeconomic scenario. Recently listed in BOVESPA’s Novo Mercado, MRV made a primary offering to prepare the Listed in the Novo Mercado. company to take advantage of the favorable winds and to profit from its unique Primary-only offer prepared positioning in the lower income segments. Exhibit 2 below summarizes the company’s company to grow. shareholding structure after the IPO conclusion. Exhibit 18: MRV’s shareholders structure Rubens Menin Autonomy Capital Unno Maio MA Cabaleiro Free Float Teixeira de Souza Two Sarl Participações Participações Participações 44,2%ON 11,6%ON 5,3%ON 2,5%ON 2,5%ON 33,9%ON MRV Source: MRV 13
  • 14. Financial Statements Income Statement (R$ MM) 2005 2006 2007E 2008E 2009E 2010E 2011E 2012E Launchings 184 337 950 1,850 2,405 2,766 3,042 3,194 - Real Estate Sales 110 206 698 1,447 2,104 2,568 2,896 3,107 Gross Revenues 111 160 415 978 1,644 2,277 2,718 3,024 Net Revenues 95 140 390 942 1,584 2,194 2,619 2,913 - COGS (58) (91) (236) (557) (953) (1,350) (1,624) (1,821) Gross Profit 37 50 154 385 631 844 995 1,092 - Sales Expeditures (6) (11) (36) (83) (121) (148) (167) (179) - G&A Expenditures (7) (24) (52) (60) (65) (68) (70) (71) - Other Operational 0 9 (36) 26 39 51 59 62 EBIT 29 24 30 267 484 678 816 904 Financial Results (1) (3) 27 26 7 7 7 7 Non-Operational Results - 0 0 - - - - - EBT 28 20 57 293 491 685 823 911 Income Tax (4) (3) (28) (44) (74) (103) (124) (137) Minority Interest - - - - - - - Net income 24 17 29 249 417 583 700 775 Depreciation 0.1 0.2 0.6 1.0 1.5 1.7 1.9 2.1 EBITDA 25 22 21 243 446 629 760 844 Adjustments - - 61 - - - - - Adjusted EBITDA 25 22 82 243 446 629 760 844 Gross Margin 39.3% 35.3% 39.5% 40.9% 39.8% 38.5% 38.0% 37.5% Adjusted EBITDA Margin 26.5% 16.0% 21.0% 25.8% 28.2% 28.7% 29.0% 29.0% Adjusted Net Margin 24.8% 12.1% 23.1% 26.5% 26.4% 26.6% 26.7% 26.6% Free Cash Flow 2005 2006 2007E 2008E 2009E 2010E 2011E 2012E EBITDA 25 22 21 243 446 629 760 844 Taxes (4) (4) (4) (40) (73) (102) (122) (136) Change in Net Working Assets (20) (69) (330) (444) (434) (383) (222) (111) CAPEX (0) (2) (3) (5) (3) (3) (3) (4) FCFF 1 (52) (316) (246) (63) 142 412 594 Balance Sheet 2005 2006 2007E 2008E 2009E 2010E 2011E 2012E Assets Cash and Equivalents 8 9 631 135 135 135 135 135 Accounts Receivable 78 129 409 888 1,140 1,414 1,551 1,608 Inventories 69 235 455 687 1,047 1,282 1,449 1,557 Other 3 7 261 594 556 681 1,034 1,536 Total Assets 158 380 1,755 2,305 2,878 3,512 4,169 4,836 Liabilities Short Term Debt 2 48 37 37 37 37 37 37 Clients Advance Payments 13 28 28 19 9 12 - - Long Term Debt - 17 14 14 14 14 14 14 Other 76 197 426 798 1,068 1,262 1,406 1,492 Equity 83 91 1,250 1,437 1,750 2,187 2,712 3,293 Total Liabilities 158 380 1,755 2,305 2,878 3,512 4,169 4,836 Source: MRV and Bulltick 14
  • 15. Real Estate Stock Guide Klabin Average / Com pany Cyre la Gafis a Ros si Tecnis a M RV Se gall Total Ticker CPNY3 CYRE3 GFSA3 KSSA3 RSID3 TCSA3 MRVE3 Rating NEUTRAL BUY BUY BUY BUY BUY BUY Current Price in R$ 33.74 21.72 28.25 17.10 46.39 10.70 28.99 Target Price in R$ 41.00 26.00 33.00 30.00 59.02 18.00 44.00 Potential Upisde in R$ terms 21.5% 19.7% 16.8% 75.4% 27.2% 68.2% 51.8% Potential Upisde in US$ terms 8.3% 6.7% 4.1% 56.4% 13.4% 50.0% 35.3% Market Cap in R$MM 1,215 7,725 3,644 985 3,658 1,556 3,786 22,568 Firm Value in R$MM 1,342 7,766 3,519 880 3,633 1,387 3,205 21,733 Operational Data 3-year CAGR Launchings 65.5% 16.5% 30.5% 24.3% 38.5% 66.8% 92.5% 33.1% Net Revenue 51.1% 45.0% 32.5% 88.4% 58.7% 82.8% 124.3% 56.6% EBITDA 59.0% 69.8% 68.1% 90.5% 99.2% 97.7% 170.7% 83.9% Net Prof it 60.2% 53.4% 73.3% 248.8% 95.9% 83.3% 190.6% 80.3% EBITDA Margin 2006 20.4% 18.4% 10.3% 27.4% 12.4% 23.1% 16.0% 16.5% 2007E 21.7% 23.1% 10.8% 26.1% 20.0% 10.8% 5.3% 17.9% 2008E 23.4% 26.2% 18.6% 27.1% 22.4% 26.9% 25.8% 24.0% 2009E 23.8% 29.6% 21.0% 28.3% 24.5% 29.2% 28.2% 26.8% Net Margin 2006 15.8% 17.8% 6.9% 2.7% 10.6% 17.6% 12.1% 13.1% 2007E 15.7% 25.0% 6.1% 18.8% 20.9% 10.3% 7.3% 16.8% 2008E 17.9% 19.0% 13.3% 16.0% 18.6% 19.0% 26.5% 18.6% 2009E 18.8% 21.1% 15.5% 17.5% 20.0% 17.8% 26.4% 20.0% Capital Structure / Working Capital Net Debt / Equity 0.37x 0.02x N.R. N.R. N.R. N.R. 0.02x N.R. Net Debt / (Net Debt+Equity) 0.27x 0.02x N.R. N.R. N.R. N.R. 0.02x N.R. Net Debt / EBITDA07E 1.26x 0.11x N.R. N.R. N.R. N.R. 1.17x N.R. Change in Net Working Capital 2006 88 735 397 408 90 175 69 1,962 2007E 501 1,143 882 511 319 193 330 3,879 2008E 531 276 439 817 269 496 444 3,271 2009E 771 1,794 121 529 398 723 434 4,770 Current Liquidity 3.0x 4.1x 4.2x 4.1x 4.4x 7.8x 2.3x 4.0x Quick Ratio 2.0x 2.2x 2.7x 1.6x 1.9x 3.9x 0.7x 2.1x Valuation FV/EBITDA 2007E 13.3x 20.9x 34.8x 11.7x 26.5x 34.6x 155.6x 25.7x 2008E 8.1x 18.6x 15.5x 5.7x 13.1x 7.3x 13.2x 13.0x 2009E 5.7x 8.1x 10.8x 3.4x 9.0x 3.8x 7.2x 7.3x 2008 Multiple-to-Grow th 0.14x 0.27x 0.23x 0.06x 0.13x 0.08x 0.08x 0.15x (3-year EBITDA CAGR) PER 2007E 16.7x 19.2x 64.2x 18.1x 25.5x 40.6x 132.0x 28.3x 2008E 9.6x 25.4x 22.5x 10.9x 15.8x 11.6x 15.2x 17.4x 2009E 6.5x 11.3x 15.2x 6.1x 11.1x 7.1x 9.1x 10.1x 2008 Multiple-to-Grow th 0.16x 0.48x 0.31x 0.04x 0.16x 0.14x 0.08x 0.22x (3-year EPS CAGR) FV/FCFF 2007E N.R. N.R. N.R. N.R. N.R. N.R. N.R. N.R. 2008E N.R. N.R. N.R N.R. N.R. N.R. N.R. N.R. 2009E N.R. N.R. 22.6x N.R. N.R. N.R. N.R. N.R. FV/PSV 2007E 1.4x 1.9x 2.1x 0.8x 2.1x 1.4x 3.4x 1.9x 2008E 0.9x 1.5x 1.7x 0.7x 1.8x 1.2x 1.7x 1.4x 2009E 0.8x 1.4x 1.6x 0.6x 1.5x 1.1x 1.3x 1.3x PBR 3.7x 3.9x 2.5x 2.3x 3.2x 2.1x 3.1x 3.1x Source: Bulltick 15
  • 16. Macroeconomic Assumptions 2007 2008 2009 2010 2011 2012 Inflation 4,2% 4,0% 4,0% 4,0% 4,0% 4,0% Selic Rate (Year End) 11,25% 10,50% 10,00% 10,00% 10,00% 10,00% Selic Rate (Average) 12,50% 11,50% 10,50% 10,00% 10,00% 10,00% Exchange Rate (Year End) 2,05 2,09 2,13 2,18 2,22 2,26 Exchange Rate (Average) 2,09 2,07 2,11 2,15 2,20 2,24 GDP Growth 3,5% 4,0% 4,0% 4,0% 4,0% 4,0% TJLP 6,3% 6,0% 6,0% 6,0% 6,0% 6,0% Libor 6,0% 6,0% 6,0% 6,0% 6,0% 6,0% Source: Bulltick 16
  • 17. APPENDIX A IMPORTANT DISCLOSURES Bulltick Brasil Consultoria e Assessoria Empresarial Ltda. is an affiliate of Bulltick LLC (The Firm). Bulltick LLC may do business with the companies covered in this report, as a result, investors should be aware that the Firm may have a conflict of interest that could affect the objectivity of this report. Investors should consider this report only as a single factor in making their investment decision. A. CONFLICTS OF INTEREST From the companies covered in this report, Bulltick Brasil Consultoria e Assessoria Empresarial Ltda, or its affiliates, currently has, or has had within the past 12 months, Tecnisa and MRV as client and/or received compensation for products and services provided to this company. From the companies covered in this report, Bulltick Brasil Consultoria e Assessoria Empresarial Ltda, or its affiliates, managed or co-managed a public offering of securities for Tecnisa and MRV in the past 12 months, received compensation for investment banking services from Tecnisa and MRV in the past 12 months. Neither Bulltick Brasil Consultoria e Assessoria Empresarial Ltda nor any of its affiliates own equity securities of any of the subject companies. Analyst compensation is determined by Bulltick Brasil Consultoria e Assessoria Empresarial Ltda management and is not linked to specific transactions or recommendations. B. ANALYST CERTIFICATION I, Rafael Pinho, author of this report, hereby certify that all of the views expressed in this report accurately reflect my personal views about any and all of the subject issuer(s) or securities, no part of my compensation was, is , or will be directly or indirectly related to the specific recommendation(s) or view(s) in this report. I have not received any compensation from any of the subject companies in the past 12 months. I also certify that neither I nor any member of my household serves as a director, officer, or advisory board member of any of the subject companies in this report. C. INVESTMENT RATING Investment ratings are determined by the ranges described below: BUY: Total return of securities expected to be above 18% (in dollar terms) in the following 12 months NEUTRAL: Total return of securities expected to be below 18% (in dollar terms) and above 8% (in dollar terms) in the following 12 months. SELL: Total return of securities expected to be below 8% (in dollar terms) in the following 12 months. Price Target: The valuation method used to determine the price targets in this report were based on the discounted cash flow methodology. D. RISK RATINGS Risks for the achievement of the target prices defined in this report include major change in our base case macro- economic scenario, increase in interest rates and in the Brazil risk, reduction in the expectations for demand for real estate in Brazil and impact on already listed stocks of new IPOs in Brazil´s real estate sector. Based on last 6 months volatility of subject companies, and comparing them to the volatility of the Bovespa Index (Ibovespa) in the same period, we define each subject company´s relative volatility in the following way: Company High, Cyrela High, Gafisa High, Klabin Segall High, MRV High, Rossi Residencial High and Tecnisa High 17
  • 18. OTHER DISCLOSURES Bulltick Brasil Consultoria e Assessoria Empresarial Ltda and its subsidiaries, affiliates, shareholders, directors, officers, employees, and licensors (“The Bulltick Parties”) will not be liable (individually, jointly, or severally) to you or any other person as a result of your access, reception or use of the information contained in this document for indirect, consequential, special, incidental, punitive, or exemplary damages, including, without limitation, lost profits, lost savings and lost revenues (collectively, the “Excluded Damages”), whether or not characterized in negligence, tort, contract, or other theory of liability. The information contained in this document has been obtained from sources believed to be reliable, although its accuracy and completeness cannot be guaranteed. All opinions, projections, and estimates constitute the judgment of the author as of the date of the report and these, plus any other information contained in the report, are subject to change without notice. Prices and availability of financial instruments also are subject to change without notice. Bulltick Brasil Consultoria e Assessoria Empresarial Ltda and its affiliated companies have not taken any steps to insure that the securities referred to in this report are suitable for any particular investor. The Report is for informational purposes only and is not intended as an offer or solicitation for the purchase or sale of a security. Securities mentioned in the report are subject to investment risks, including the possible loss of the principal amount invested. Any decision to purchase securities mentioned in the Report must take into account existing public information on such a security or any registered prospectus. The financial instruments mentioned in this document may not be eligible for sale in some countries. The Report is not to be construed as providing investment services in any jurisdiction where the provision of such services would be illegal. Bulltick Brasil Consultoria e Assessoria Empresarial Ltda, its affiliated companies, and/or its officers, directors, or shareholders, may from time to time have long or short positions in the financial instruments of the companies mentioned in this document, engage in securities transactions in a manner inconsistent with this report, buy or sell from customers on a principal basis, or serve in an advisory capacity. Investing in non-US securities, including ADRs, may entail certain risks. The securities of non-US issuers may not be registered with, and may not be subject to the reporting requirements of the US Securities and Exchange Commission. There may be limited information available on foreign securities. Foreign companies are generally not subject to uniform audit and reporting standards, practices and requirements comparable to those in the US Securities of some foreign companies may be less liquid and their prices more volatile than securities of comparable US companies. In addition, exchange rate movements may have an adverse effect on the value of an investment in a foreign stock and its corresponding dividend payment for US investors. The information contained in the report is privileged and confidential and intended solely for the recipients who have been specifically authorized to receive it and it may not be further distributed. Bulltick Brasil Consultoria e Assessoria Empresarial Ltda and its affiliates accept no liability whatsoever for the actions of third parties. Should you receive this message by mistake you are hereby notified that any disclosure reproduction, distribution, or use of this message is strictly prohibited. The Report may provide the addresses of, or contain hyperlinks to, websites. Except to the extent to which the Report refers to the website material of the Bulltick Brasil Consultoria e Assessoria Empresarial Ltda or any of its affiliates, the Firm has not reviewed the linked site. Equally, except to the extent to which the Report refers to website material of Bulltick Brasil Consultoria e Assessoria Empresarial Ltda or any of its affiliates, the Firm takes no responsibility for, and makes no representation or warranties whatsoever as to, the data and information contained therein. Such address or hyperlink (including addresses or hyperlinks to website material of Bulltick Brasil Consultoria e Assessoria Empresarial Ltda or any of its affiliates) is provided solely for your convenience and information and the content of the linked site does not in any way form part of this document. Accessing such website or following such link through the Report or the website of Bulltick Brasil Consultoria e Assessoria Empresarial Ltda or any of its affiliates shall be at your own risk and Bulltick Brasil Consultoria e Assessoria Empresarial Ltda or any of its affiliates shall have no liability arising out of, or in connection with, and such referenced website. 18