SlideShare uma empresa Scribd logo
1 de 10
Baixar para ler offline
Coarse-Grained Model for Simulation of RNA Three-Dimensional Structures
Zhen Xia,†
David Paul Gardner,‡,§
Robin R. Gutell,‡,§
and Pengyu Ren*,†,§
Department of Biomedical Engineering, Section of IntegratiVe Biology and Center for Computational Biology
and Bioinformatics, and Institute for Cellular and Molecular Biology, The UniVersity of Texas at Austin,
Texas 78712, United States
ReceiVed: May 28, 2010; ReVised Manuscript ReceiVed: August 31, 2010
The accurate prediction of an RNA’s three-dimensional structure from its “primary structure” will have a
tremendous influence on the experimental design and its interpretation and ultimately our understanding of
the many functions of RNA. This paper presents a general coarse-grained (CG) potential for modeling RNA
3-D structures. Each nucleotide is represented by five pseudo atoms, two for the backbone (one for the phosphate
and another for the sugar) and three for the base to represent base-stacking interactions. The CG potential has
been parametrized from statistical analysis of 688 RNA experimental structures. Molecular dynamic simulations
of 15 RNA molecules with the length of 12-27 nucleotides have been performed using the CG potential,
with performance comparable to that from all-atom simulations. For ∼75% of systems tested, simulated
annealing led to native-like structures at least once out of multiple repeated runs. Furthermore, with weak
distance restraints based on the knowledge of three to five canonical Watson-Crick pairs, all 15 RNAs tested
are successfully folded to within 6.5 Å of native structures using the CG potential and simulated annealing.
The results reveal that with a limited secondary structure model the current CG potential can reliably predict
the 3-D structures for small RNA molecules. We also explored an all-atom force field to construct atomic
structures from the CG simulations.
Introduction
The importance of RNA has been appreciated since the central
dogma was proposed in 1958.1,2
Three RNA molecules, mRNA
(mRNA), tRNA (tRNA), and rRNA (rRNA), are associated with
the cell’s transcription of its DNA into RNA and then translated
into proteins.3
While experiments as early as 1971 suggested
that RNA is involved in catalysis during protein synthesis,4-6
experiments starting in 1982 confirmed that RNA is directly
involved in catalysis, in many different RNA systems with
difference chemical reactions.4,7-15
These RNAs form complex
three-dimensional structures.16-33
Within the past few years, a large increase in the number of
RNAs that form higher structure, associated with numerous
functions in the cell, is the foundation for a major paradigm
shift in the molecular biology of the cell; RNAs that do not
code for proteins are directly associated with the regulation and
overall function of the cell,34-44
including different cancers.45-47
Since more than 90% of the human genome is transcribed into
RNAs that do not code for proteins,48,49
and the function of an
increasing amount of this RNA is now being determined, the
prediction of an RNA higher-order structure and its dynamics
will provide great insight into the RNA’s contribution to the
structure and function of a cell. Toward that end, computational
approaches such as molecular modeling have made significant
contributions to the understanding of three-dimensional struc-
tures and chemical principles of RNA.50-60
The most successful
approaches for protein structure prediction so far have been
based on comparative analysis or reduced models derived from
known structures.61-63
In recent years, increased effort has been devoted to RNA
structure prediction as more and more RNA structures have been
determined experimentally. A range of models have been
developed for nucleic acids, from fully atomistic models to
reduced representations.64-67
For example, a knowledge-based
atomic energy function has been introduced to predict RNA
tertiary structures in the FARNA package.68
Nucleotide cyclic
motifs are used in MC-Fold and MC-Sym models to build RNA
structure from sequence data.69
These two models seem suc-
cessful in predicting the tertiary structure of small RNA
molecules. In addition, physics-based atomic force fields such
as AMBER70-73
and CHARMM74-76
describe the dynamic
atomic interaction following traditional molecular mechanics,
with parameters derived by fitting to ab initio quantum mechan-
ics calculations and experimental data. It is now feasible with
supercomputers to simulate dynamic biological systems as large
as an entire virus in atomic detail.77
However, typical applica-
tions of the atomistic force fields are usually limited to small
oligomers of nucleic acids or routine simulation times on the
order of a few nanoseconds.78
On the other hand, coarse-grained
(CG) methods reduce the number of particles and eliminate high-
frequency motions in the system. A CG model enlarges the time
step in molecular dynamics simulations while also enhancing
intrinsically faster dynamics.79-81
Several CG approaches, either
knowledge or physics based, have been utilized to study the
structures of nucleic acids.68,69,78,82-106
There has been a history of modeling DNA at meso-
scale.65,78,82-84,86-89,92-97,99,105
Recently, studies such as Knotts
IV and co-workers successfully predicted several important
DNA behaviors, like salt-dependent melting, bubble formation,
and rehybridization, with a CG model that uses three interaction
sites for phosphate, sugar, and base, respectively.78
For RNA,
* Corresponding author. Tel.: (512) 232-1832. Fax: (512)-471-0616.
E-mail: pren@mail.utexas.edu.
†
Department of Biomedical Engineering.
‡
Section of Integrative Biology and Center for Computational Biology
and Bioinformatics.
§
Institute for Cellular and Molecular Biology.
J. Phys. Chem. B 2010, 114, 13497–13506 13497
10.1021/jp104926t  2010 American Chemical Society
Published on Web 09/30/2010
Malhotra et al. first introduced a reduced potential to refine the
3-D structure of low-resolution rRNAs.52,59
Zhang et al.
combined a highly reduced coarse-grained model and a Monte
Carlo method to simulate the distribution of viral RNA inside
the capsid of cowpea chlorotic mottle virus.100
In these works,
each nucleotide was modeled as one bead to reduce the
complexity of large RNAs. Cao et al. developed a reduced chain
representation model to predict RNA folding thermodynamics
based on a statistical mechanical theory.101
The RNA molecules
were represented by their backbone, and two beads (phosphate
and sugar) were used for each nucleotide. Later, Jonikas et al.
integrated a coarse-grained model with knowledge-based po-
tentials to generate plausible three-dimensional structures.107
Despite the development, automated programs for predicting
RNA 3-D structures and their dynamic properties are required
to increase their accuracy and robustness.108
In addition, the
coarse-grained RNA potentials are mostly aimed at structural
refinement rather than predicting dynamics properties.
Aside from the energy or scoring function, the configuration
searching and sampling methods are also important components
of the structure prediction algorithms. The MC-Fold/MC-Sym
and FARNA programs begin by generating structures from small
RNA fragments with a few residues. Then, Las Vegas or Monte
Carlo sampling is performed to generate a sampling of possible
tertiary structures of the entire RNA.68,69
NAST utilizes MD
simulations, combined with secondary structure information, to
generate 3-D structure candidates for the RNA molecules.107
A
coarse-grained (C3′-based one-bead CG model) energy function
derived from the structural statistics is applied in the MD
simulation. The ranking of structural clusters can be based on
the NAST energy function or experimental data (solvent
accessibility data from the hydroxyl radical foot printing).
Herein we present an “intermediate” coarse-grained potential
for modeling RNA 3-D structure using molecular dynamics.
Previous CG RNA models typically used one52,100,107
or two101
particles for each nucleotide. To optimize the efficiency and
accuracy, we developed a model that represents each nucleotide
with five pseudo atoms: two of these represent the backbonesone
for the sugar and the other for the phosphateswhile three pseudo
atoms represent the stacking and base pairing for each base.
The analytical potential energy functional forms, parametrization
with 3-D structural statistics obtained from experimental
structures and initial validation using molecular dynamics
simulations of selected RNAs, are discussed.
Experimental Methods
Data Collection and Preparation. The CG potential was
parametrized using statistics collected from available three-
dimensional structures of RNA molecules (including both X-ray
diffraction structures and nuclear magnetic resonance structures).
The RNA structure files were downloaded from The Protein
Data Bank (http://www.pdb.org/), Nucleic Acid Database (http://
ndbserver.rutgers.edu/index.html), RNA Comparative Analysis
Database (rCAD, http://rcat.codeplex.com/, manuscript submit-
ted), and the Comparative RNA Web (CRW) site109
(http://
www.rna.ccbb.utexas.edu/). Only 668 structure files that con-
tained more than five base pairs and have the resolution records
were analyzed for the statistical calculation. All of the coordi-
nates obtained from nuclear magnetic resonance (NMR) struc-
tural files were included in the statistical calculations.
Coarse-Grained RNA Interaction Potential. In our CG
model, each nucleotide is reduced to five pseudo atoms in RNA
(Figure 1). Two of the five pseudo atoms represent phosphate
and sugar, respectively, which is the minimum requirement to
capture the backbone tertiary structures of RNA.110
Each base
(A, G, C, and T) is represented by three pseudo atoms, connected
by three virtual bonds into a triangle. Compared to earlier models
with one particle for each base or each residue,78,107
the use of
three pseudo atoms for each base provides us with better ability
to capture the stacking and pairing of bases. As the different bases
share some common pseudo atoms, nine unique types of pseudo
atoms are needed to represent the four canonical RNA component
bases in total (Figure 1). The improvement in computational
efficiency arises from the reduction of number of particles and
larger particle mass that enables a greater integration time step in
molecular dynamics. The topological and physical properties of
the pseudo atoms are listed in Table 1.
The corresponding CG potential energy is calculated by
where Ebonded and Enonbonded are pairwise bonded and nonbonded
energy terms, each representing the sum of contributions of all
pairs in the system. The bonded term is further decomposed
into
where Ebond, Eangle, and Edihedral are the bond stretching, angle-
bending, and dihedral energies, respectively.
In classical molecular mechanics, the nonbonded interaction
consists of the van der Waals (VDW) and electrostatic contribu-
tions. Since our CG model is derived from the 3-D structural
statistics of experimental structures, an effective potential is used
to represent the potential of mean force of all the nonbonded
interactions, including the excluded volume repulsive, the
attractive force, and the electrostatic force between nonbonded
particles, as well as the solvation forces due to the environment.
A Buckingham potential is utilized to describe the effective
potential (see eq 9).
For each term, the parametrization was performed based on the
Boltzmann inversion of the corresponding atomistic distribution
functions obtained from the experimental structures. The Boltz-
mann inversion method performs a potential inversion from a
set of known distributions of structural parameters to extract
effective CG potentials. In our RNA CG system, the potentials
calculated from the Boltzmann inversion method111,112
need to
reproduce the distribution of structural parameters including 14
different bonds, 25 types of angles, 28 dihedral angles, and 19
intermolecular radial distribution functions extracted from
statistical results of all available atomistic RNA structures
(please see Tables 2-5 for more details). All the parameter-
fitting works were performed with the software of Matlab Curve
Fitting Tool.
Bond Stretching. The distribution of bond lengths can be
represented by the Gaussian function, which is calculated by
where b, b0, and σ are the parameters obtained through fitting;
kB is the Boltzmann factor; and T is absolute temperature. Taking
Etotal ) Ebonded + Enonbonded (1)
Ebonded ) Ebond + Eangle + Edihedral (2)
Enonbonded ) Eeffective potential (3)
P(l) )
1
√2πσ
e-(b - b0)2/2σ2
) e-Estretch/kBT
(4)
13498 J. Phys. Chem. B, Vol. 114, No. 42, 2010 Xia et al.
the logarithm of both sides of eq 4 and dropping the constant
term, after performing Boltzmann inversion, we have
where the temperature, T, is set to be 298 K.
Angle Bending. The distributions of bond angles can be
weighted by a factor sin(θ) and renormalized by a factor Zn.
The normalized distribution is expressed as
where θ is the angle between neighboring bonds, while P(θ)
and p(θ) are normalized and un-normalized distribution func-
tions of θ. The distributions of bond angles between CG bonds
were also fitted with the Gaussian function, and then the
Boltzmann inversion was used to calculate Eangle.
Dihedral Rotation. As in atomic force fields, the tensional
energy takes the formula of
Figure 1. (a) Schematic representation of the CG model for RNA. Phosphate and sugar are represented as one CG particle. The bases A, G, C,
and U are represented as three CG particles for each. (b) The components of each CG base. The base is divided by the red dashed line. (c)
Schematic representation of all-atom RNA backbone.
TABLE 1: Properties of Nine CG Particles
number CG particle name mass (amu) bond connections
1 P 94.970 2
2 S 97.054 3
3 CG 53.022 3
4 N6 42.030 2
5 N2 54.030 2
6 O6 43.014 2
7 O2 42.006 2
8 CU 26.016 3
9 CA 39.015 2
Ebond )
kBT
2σ2
(b - b0)2
) Kbond(b - b0)2
(5)
P(θ) ) Znp(θ)/sin(θ) ) e-Ebend/kBT
(6)
TABLE 2: Bond Stretching Interaction Parameters for the
CG Model of RNA Fitted by the Gaussian Function and
Obtained From Statistical Structures
bond b0 Kbond
1-2 3.85 11.12
2-3 3.74 9.79
2-8 3.61 10.89
3-4 4.29 57.70
3-5 5.66 51.66
3-6 4.28 44.60
3-9 4.33 109.19
4-7 4.55 44.00
4-8 3.59 124.29
4-9 3.53 93.79
5-6 4.57 37.14
6-7 4.53 57.10
6-8 3.55 89.85
7-8 3.52 82.87
Eangle )
kBT
2σ2
(θ - θ0)2
) Ka(θ - θ0)2
(7)
CG Model for Simulation of RNA 3-D Structures J. Phys. Chem. B, Vol. 114, No. 42, 2010 13499
where φ is the dihedral angle and Kn and δn (n ) 1, 2, 3) are
force constants and phase angles. The Edihedral was also obtained
from performing Boltzmann inversion.
Nonbonded Interactions. A Buckingham potential,113
con-
sisting of a 6 term and an exponential term, is used to represent
the potential of mean force between a pair of nonbonded atoms,
i and j
where εij is the depth of the potential well; σij is the radius; and
rij is the distance between a pair of atoms. Note that the above
equation is used to describe the potential of mean force even
though the symbol “E” and the formula are commonly used to
represent potential energy. The constants we used here are the
same as the MM3 force field.85,114-116
We use the pair-specific
ε and σ parameters instead of the combing rule for unlike atom
pair i and j. The Lennard-Jones (LJ) 6-12 potential and
Buckingham potential fitted to the nonbonded interactions at
the onset were generated. The Buckingham function is “softer”
than the LJ 6-12 function in the repulsive region because the
exponential term is more suitable to represent the nonbonded
potentials in our CG model. However, as shown in Figure S3
(Supporting Information), even the Buckingham potential is not
“soft” enough. In addition, some of the interactions (e.g.,
N2-N2) clearly show a second or more local minima which
are ignored by the Buckingham potential. The complicated
shape of the nonbonded potentials can be captured much more
accurately by using the spline interpolation functions as in
the previous statistical potentials for proteins.117
However, in
the current study, we would like to explore the capability
of the simple Buckingham potential that is implemented in
almost all popular molecular modeling packages. In nonbonded
potential fitting, we have chosen to primarily reproduce the
global energy minima by using a weighted least-squares fit.
The data points in the minimum energy area (0.5 Å within the
TABLE 3: Bond Angle Interaction Parameters for the CG
Model of RNA Fitted by the Gaussian Function and
Obtained from Statistical Structures
angle θ0 Ka
1-2-1 102.78 1.356
1-2-3 101.75 5.271
1-2-3′ a
75.89 1.864
1-2-8 100.79 9.115
1-2-8′ 74.40 2.386
2-1-2 106.18 2.040
2-3-4 154.72 7.130
2-3-5 104.12 12.734
2-3-6 153.94 8.162
2-3-9 108.78 10.611
2-8-4 163.79 6.794
2-8-6 163.79 6.794
2-8-7 88.99 15.930
3-4-9 66.45 35.882
3-5-6 79.38 16.156
3-6-5 48.06 21.701
4-3-9 48.33 49.428
4-7-8 49.44 24.490
4-8-7 79.78 29.398
4-9-3 65.22 17.290
5-3-6 52.57 50.065
6-7-8 50.54 38.613
6-8-7 79.46 31.109
7-4-8 50.84 29.033
7-6-8 49.98 30.600
a
The prime in the table indicates the atom comes from its
neighbor residue.
TABLE 4: Optimized CG Parameters for Nonbonded
Interaction Described by Equation 9, Including Similar and
Unlike Pairs of CG Atoms
CG atoms σ (initial) ε (initial)a
σ (final) ε (final)b
P-P 11 0.287 11.2778 0.1503
S-S 11.7 0.3827 12.1544 0.4162
C-C 4.4 0.8851 4.1836 0.9276
N6-N6 3.1 1.3875 3.4604 1.4312
N2-N2 4.8 1.1004 4.7928 1.1603
O6-O6 3.1 1.4354 3.7784 1.4635
O2-O2 4.9 1.0526 4.8614 1.0846
C-N6 5.1 0.6698 5.2158 0.3818
O6-O2 5.2 1.0526 5.4321 1.2972
N2-O2 2.8 1.9138 2.7974 2.0524
C-O6 5.2 0.8373 5.26 0.6972
C-O2 3.5 0.909 3.6176 0.8886
N6-O6 2.85 1.866 3.0427 1.8562
C-N2 4.25 0.8373 4.3342 0.8527
N6-O2 5.3 0.7416 5.6477 0.7942
N6-N2 5.3 1.232 5.3832 1.0547
O6-N2 5.4 0.7416 5.5622 0.5273
P-S 9.4 0.5263 9.4287 0.054
S-C 5.6 0.5502 5.615 0.5856
a
Columns σ (initial) and ε (initial) are the nonbonded parameters
obtained from statistical potential of mean force. b
Columns σ (final)
and ε (final) are the nonbonded parameters obtained after the
optimization.
Edihedral(φ) ) ∑
n)1
3
Kn[1 + cos(nφ - δn)] (8)
TABLE 5: Optimized CG Parameters for the Dihedral
Interaction Term Described by Equation 8
torsion V1 δ1 V2 δ2 V3 δ3
1′-2-3-4a
3.354 120 -0.606 180 -0.068 120
1′-2-3-9 3.801 120 0.383 180 -0.287 120
1-2-1′-2′ 1.358 0 0.944 180 0.574 0
1-2-3-4 2.964 15 -0.099 180 -0.247 15
1′-2-3-5 3.603 120 1.167 180 -0.325 120
1-2-3-5 3.768 0 0.52 180 0.581 0
1′-2-3-6 3.409 120 -0.265 180 -0.226 120
1-2-3-6 3.077 30 0.306 180 0.246 30
1-2-3-9 3.299 15 0.634 180 -0.204 15
1′-2-8-4 3.461 120 -0.617 180 0.294 120
1-2-8-4 3.321 30 1.121 180 -0.156 30
1′-2-8-6 2.737 120 -0.666 180 0.148 120
1-2-8-6 2.51 30 0.518 180 -0.17 30
1′-2-8-7 3.304 120 1.349 180 -0.342 120
1-2-8-7 3.844 0 0.567 180 0.534 0
2-1-2′-1′ -1.626 135 -0.113 180 -0.246 135
2′-1′-2-3 -1.661 60 0.455 180 0.311 60
2′-1-2-3 1.387 120 0.898 180 -0.516 120
2′-1′-2-8 -1.531 45 0.489 180 0.686 45
2′-1-2-8 1.38 135 0.908 180 -0.691 135
2-3-4-9 7.114 150 -2.4 180 0.516 150
2-3-5-6 -3.328 120 0.95 180 0.101 120
2-3-6-5 5.639 150 -2.063 180 -0.009 150
2-3-9-4 2.959 15 -1.022 180 0.666 15
2-8-4-7 5.024 165 -1.509 180 -1.807 165
2-8-6-7 4.756 165 -1.037 180 -1.455 165
2-8-7-4 -4.072 150 0.544 180 -0.144 150
2-8-7-6 3.51 0 0.425 180 0.457 0
a
The prime in the table indicates the atom comes from its
neighbor residue.
Enonbonded ) εij[-2.25(σij/rij)6
+ 1.84 × 10⁵
e-12.00(rij/σij)
]
(9)
13500 J. Phys. Chem. B, Vol. 114, No. 42, 2010 Xia et al.
potential minimum) were assigned a weight of two and the
others one. The final fitting results are shown in Figure S3 in
the Supporting Information. As discussed in the Results and
Discussion section, a nonlinear optimization was later performed
on the nonbonded parameters, after all bonded and nonbonded
parameters in the CG model were obtained, by minimizing the
root-mean-square deviation (rmsd) between the energy-mini-
mized and the experimental structures of selected RNAs. The
experimental structures were analyzed to generate the radial
distribution functions (RDF) or g(r) for selected pairs of coarse-
grained particles (Table 4). The set of 1-2 (directly bonded),
1-3 (separated by two bonds), and 1-4 (separated by three
bonds) pairs was not included in RDF calculations. Then the
potential of mean force, which corresponds to the Boltzmann
inversion of the g(r), is determined from the RDF
By combining eqs 9 and 10, we determine the initial values of
ε and σ for each pair. We have also combined certain pairs
(the same parameters were used) based on the similarity of the
RDF obtained.
Simulation Details. Fifteen different RNA molecules were
selected for molecular dynamics simulations using the developed
CG potential. For comparison, all-atom simulations were
performed on the same set of RNAs using the amber99sb force
field with explicit and implicit solvent in AMBER10.70,72,118
For
the explicit solvent simulations, the TIP3P water model was
used.119,120
The Particle Mesh Ewald (PME) method121,122
was
applied to treat the long-range electrostatic interactions, and a
12 Å cutoff was employed for the van der Waals interactions.
After the RNA was solved in the water box, 150 mM/L Na+
ions were added to the box, and then the Cl-
ions were added
to neutralize the whole system. All the RNA systems were
equilibrated with a 5000-step energy minimization to remove
the bad contacts. Then, the minimized configurations were used
as the starting point for a 1 ns NPT molecular dynamics
equilibration at 1 atm and 298 K. For the implicit solvent
simulations, the Generalized-Born/Surface Area (GB/SA) model
was used.123-128
The salt concentration was also 150 mM/L in
implicit solvent systems. The time step for all production runs
was 1 fs. The CG model molecular dynamics simulations were
performed via the modified Beeman algorithm with the TINKER
software package.129
Different time steps (1 to 10 fs) were tested
in the CG MD simulations. The normal simulation time for all
systems was 10-100 ns. Simulated annealing MD simulations
were performed to fold 15 RNA molecules. In the simulated
annealing, after the energy minimization and 2000 steps of
equilibrium, the systems were heated to 1000 K within the first
2000 steps and then gradually cooled down to room temperature
(298 K) over 100 ns with a linear schedule. For each RNA
molecule, we performed five independent simulated annealing
simulations starting with random seeds. Finally, we performed
another three independent 100 ns simulated annealings under
restraints set by the known secondary structure (Watson-Crick
base pairs only). A flat-welled harmonic potential (also known
as the Nuclear Overhauser Effect potential) was used to restrain
the distance between the pseudo atoms CG and AU (Figure 1)
in the canonical Watson-Crick base pairs with lower and upper
bounds of 8.0 and 10.0 Å, respectively. The force constant for
the harmonic potential is zero when the distance falls within
the bounds and 0.5 kcal/Å2
beyond the bounds.
Results and Discussion
Determination of the RNA Coarse-Grained Model Pa-
rameters. The probability distribution of all virtual bonds,
angles, and torsions (shown in the Supporting Information) was
used to fit the valence parameters using eqs 4-8. The fitted
parameters for virtual bonds, angles, and torsions are given in
Table 2, Table 3, and Table 5, respectively. The force constants
of bonds and angles for pseudo atoms are smaller than those of
atomic bonds and angles, meaning a larger time step could be
used during the MD simulations in the CG model. As expected,
the larger force constants of bonds and angles within the base
make the bases fairly stiff (Table 2 and Table 3). However,
they are still smaller than those of atomic constants by a factor
of 3-10.
The nonbonded parameters in eq 9 were obtained by mapping
the radial distribution functions (RDFs) of all the pseudo atoms
in existing RNA structures
where nij(r) is the number of pairs in the given shell from r to
r + dr; Ni is the total number of particle I in the system; and d
is the mean bulk density of particle j. The reference state here
is the expected number of contacts when two pseudo atoms i
and j are at long distance, which is approximated as the average
density of pseudo atoms j.130
Therefore, the g(r) could be
normalized to 1 at long distance. The results from g(r) are
plugged into eq 10 to get the potential of mean force, which is
approximated to be the effective potential function of r. The
effective potential functions are shown in the Supporting
Information. The best fitting results for each type of CG atom
are summarized in Table 4.
Optimization of the Nonbonded Parameters. The RNA
structural statistics we utilized to derive the nonbonded and
bonded parameters effectively include contributions from all
energy terms, although to different extents. For example, the
actual conformational distribution is affected by both the torsion
and nonbonded energy terms in the CG potential. To remove
the “redundancy”, we directly compared the structures given
by the coarse-grained potential with the experimental structures
and adjusted the parameters. Since the RNA structure is most
sensitive to the nonbonded interaction, we refined the nonbonded
parameters using seven RNA molecules with diverse secondary
and tertiary structures. The nonbonded parameters were refined
by minimizing the difference between the energy-minimized
CG structures and their corresponding experimental structures.
First, energy minimization was performed on each of the seven
RNA molecules, and the structural rmsd from the experimental
structure was calculated based on all pseudo atoms. The average
of the rmsd over the seven molecules is used as the target
function in the optimization of the nonbonded parameters. An
optimally conditioned variable metric nonlinear optimization
algorithm in TINKER was utilized.129,131-133
The first derivative
of the average rmsd with respect to each nonbonded parameter
was calculated numerically. In total, 38 nonbonded parameters
were optimized (Table 4). The average rmsd between the
experimental and energy-minimized structures dropped from
3.35 to 1.75 Å by using the optimized nonbonded parameters.
Validation of the Coarse-Grained Model. We have vali-
dated the CG potential in two sets of simulations. First,
molecular dynamics simulations of the native RNA structures
were performed at room temperature to examine the rmsd
Enonbonded(r) ) -kBT ln g(r) (10)
gij(r) )
1
Nidj
nij(r)
4πr2
δr
(11)
CG Model for Simulation of RNA 3-D Structures J. Phys. Chem. B, Vol. 114, No. 42, 2010 13501
fluctuation. Second, simulated annealing molecular dynamics
simulations were applied to fold the RNA structures, with and
without restraints set by the secondary structure information.
Fifteen RNA molecules with high quality experimental structures
were chosen for the model validation (Table 6). These RNAs
represent common RNA structural motifs, such as a helix with
and without noncanonical base pairs, hairpins, internal loops,
bulges, and pseudoknots.
The results of the regular room-temperature MD simulations
are given in Table 6. The rmsd’s for both the coarse-grained
and all-atom model were calculated as an average over the MD
trajectories using the same atom set of five pseudo atoms for
better comparison. One base pair at each of the terminals is
ignored in all the rmsd calculations unless specified otherwise.
The 15 RNA molecules investigated had an overall average rmsd
with the CG model (3.36 Å). This is similar to the all-atom
implicit solvent model (3.30 Å). The all-atom MD simulation
with explicit solvent was even closer to the experimental
structure, with an average rmsd of 2.21 Å. The rmsd for the
CG model (1.66 Å) performed slightly better than the all-atom
explicit solvent simulation (2.21 Å) for an A-form helix with
canonical Watson-Crick base pairs only. Figure 2a shows the
superposition of the native structure (1QCU) and the last frame
of 10 ns CG MD simulation. The backbone is well preserved
by the CG MD in 1QCU, as well as the base pair and base
stacking interactions. As expected, somewhat larger rmsd’s have
been observed at the 5′ and 3′ terminals of the double helix in
both CG and all-atom MD simulations of 1QCU, consistent with
the assumption that the lack of base stacking interactions and
neighboring base-pair connections would decrease the stabilities
of the helix terminals.
The frameshifting RNA pesudoknot from beet western yellow
virus (PDB ID: 1L2X) is a single chain with coaxial helices
connected with two loops.134
The superposition of the native
X-ray structure and the last frame of 10 ns MD CG simulation
are shown in Figure 2b. The backbone is well represented in
the CG model. The average rmsd of the CG model (2.84 Å) is
quite similar to those given by the all-atom simulations using
implicit (2.89 Å) and explicit solvent (2.73 Å). Both the all-
atom model and the CG model showed a larger fluctuation for
noncanonical Watson-Crick base pairs in 1L2X during the MD
simulations. The observed unpaired bases which belong to the
loops moved back and forth along the direction perpendicular
to the backbone, which may play an important role in forming
tertiary contacts.
Among the 15 test RNAs, the largest rmsd (4.75 Å) was
observed for 1LNT.135
1LNT is a 24-nt double-strand helix with
a 5×5 nt interior loop. The superposition of the native X-ray
structure and the final snapshot of MD simulation (Figure 2c)
show that the large rmsd is mostly due to the base atoms and
two terminals. The bases within the interior loop are much more
flexible and disordered than base forming Watson-Crick base
pairs. It is not surprising that the current CG model has difficulty
in capturing them, given that RNA structures in the parametriza-
tion set are dominated by canonical Watson-Crick base pairs.
How well the MD simulations preserve the native structure
is only a minimal check of the coarse-grained potential. It is
more interesting and challenging to see if the CG potential can
be used to “predict” RNA folds. The “folding” of RNA
molecules by the CG model was examined by 100 ns simulated
annealing molecular dynamics. In this process, the RNA
molecule was denatured by being quickly heated to a temper-
ature of 1000 K. With the system temperature gradually (over
100 ns) cooled back down to 298 K, the RNA molecules were
expected to fold back to their native or native-like conforma-
tions. We have performed five independent simulated annealing
runs for each of the 15 RNAs. The final conformations were
checked by comparing the structure of the last snapshot of
trajectory to its native structure. The minimum and average
rmsd’s among the five repeats are given in Table 7. The results
indicated that ∼75% of RNAs fold back to their native-like
structures (final all-pseudoatom rmsd < 6.5 Å) at least once
among the five repeats. Examples of the simulation snapshots
and the final annealed structures of 1ZIH (rmsd ) 3.8 Å) and
353D (rmsd ) 6.3 Å) could be found at Figure 3b and Figure
3d, respectively. Due to the limited sampling capability of the
simulated annealing method, the RNA molecule is very likely
to be trapped into a local minimum. For instance, all five
simulated annealing repeats of the 1L2X (contains a pseudoknot)
failed to fold back to its right coaxial structures and were stuck
in different local minima. Another possible reason is a lack of
chemical details in our energy potential function. The stability
of some RNA tertiary motifs such as pseudoknots is highly
dependent on the solvation environment and metal ion concen-
tration, especially the magnesium hydration effect.136
Here we discuss in detail three RNAs that were successfully
folded by the simulated annealing MD simulations, a hairpin,
1ZIH,137,138
and two helices: 353D139
and 1DQF.140
1ZIH is a
12-ntsinglestrandRANhairpincappedbyaGCAAtetraloop.138,141
The GCAA tetraloop belongs to the GNRA tetraloop family
(N is A, C, G, or U; R is A or G)142
which is a basic building
block of RNA structure that often provide sites for tertiary
contacts or protein binding.50,142-145
At the beginning of an-
nealing, the RNA was completely denatured due to the heating,
showing a rmsd of about 10 Å (Figure 3a and 3b). The structure
became stable after 70 ns, and the rmsd’s dropped to ∼3.8 Å
when the temperature slowly decreased to 400 K (Figure 3b).
Similar behavior was observed in the annealing of two A-form
helices, 353D (Figure 3d) and 1DQF. 353D contains two U-G
Wobbles, and 1DQF contains a bulge residue. Both rmsd’s
converged to ∼4.5 Å at the end of the annealing (Figure 3a).
Overall, the successes demonstrate that the CG potential is very
promising for ab initio prediction of small RNA tertiary structure
from sequence alone.
TABLE 6: Comparison of All-Atom Average rmsd’s from
the Native Crystal Structures for Both the CG Model and
the Full-Atom Modelsa
rmsd (Å)
PDB ID CG model
full-atom implicit water
model (amber99sb ff)
full-atom explicit water
model (amber99sb ff)
157D 3.644 5.609 2.260
1DQF 2.478 3.274 1.935
1I9X 3.236 3.956 1.780
2JXQ 2.536 2.940 1.800
2K7E 3.675 4.560 3.560
353D 3.483 2.802 3.583
472D 3.137 2.467 1.500
1F5G 4.425 2.950 1.800
1KD3 4.570 3.740 2.560
1L2X 2.840 2.890 2.730
1LNT 4.751 2.610 1.880
1QCU 1.669 2.560 2.210
1ZIH 3.532 3.180 2.010
2AO5 3.326 2.090 1.350
1AL5 3.080 3.770 2.210
average 3.359 3.293 2.211
a
All rmsd’s were obtained from all CG atoms (full-atom
calculation using the same atom set as the CG model).
13502 J. Phys. Chem. B, Vol. 114, No. 42, 2010 Xia et al.
We have examined the possibility of further refining the CG
structures from the simulated annealing by mapping the
structures to the corresponding all-atom models and performing
all-atom MD simulations. The last frames from the 100 ns
simulated annealing simulation of 1ZIH and 353D with rmsd’s
around 5 Å were taken to generate the initial coordinates for
the subsequent all-atom simulations using AMBER10. The all-
atom structures were reconstructed from the CG structures via
the following steps (please refer to Figure 1c for the atomic
labels). (1) The planar all-atom bases were placed based on the
three pseudo particles in the CG bases (Figure 1). The C1′ atom,
which lies in the base plane, was constructed by extending from
the N atom in the bases. Equilibrium bond and angle values
from the amber99sb force field were used in constructing the
atomic coordinates relative to each other. (2) The CG backbone
particles P and S were turned into P and C4′ in the all-atom
model. The backbones O5′ and C5′ were placed along the vector
connecting P and C4′ with the P-O5′ and O5′-C5′ bond
lengths to set to be one-third of the P-C4′ distance. Similarly,
O3′ and C3′ were placed between C4′ and P in the opposite
direction. The other two O atoms connecting to P were placed
in the plane orthogonal to O3′-P-O4′. (3) The O4′ in the sugar
ring was placed such that it lied in the plane of C3′-C4′-
O4′-C1′. Using the C4′-O4′-C1′ as the anchor, the sugar ring
(including directly bonded peripheral atoms) in a flat conforma-
tion was then constructed. Note that in this new structure C5′
and C3′ were moved out of the C4′-P vector. (4) The all-atom
structure was then relaxed via AMBER energy minimization,
while the five atoms directly transferred from the CG model
(three base atoms, P, and C4′) were constrained to the CG
coordinates. The resulting all-atom structures were subjected
to a 20 000-step energy minimization without constraints
followed by a 20 ns MD simulation with the amber99sb force
field and GB/SA implicit solvation model. For hairpin 1ZIH,
the overall rmsd’s dropped slightly from ∼5.5 to 5 Å. However,
the backbone structure of 1ZIH was significantly improved
as the rmsd was reduced from 5.4 to 3.65 Å. The detailed base
orientations in the GCAA loop could be seen in Figure 3c, which
shows the superposition of the final conformation and native
structure of the tetraloop. The GCA bases were stacked on top
of each other instead of the CAA base stacking in native
structure with ∼60° rotation. The rotation or flipping of the
GNRA bases, similar to the U-turn motif,16,33,146
was observed
in early studies by NMR analysis and other all-atom molecular
dynamic simulations.138,147
The flipping of some of the bases
toward the solvent in a tetraloop allows those bases to interact
with other RNAs and proteins. For 353D, both all-atom rmsd’s
and backbone rmsd’s remained mostly unchanged after the all-
atom refinement. One possible reason is that the final structure
of CG simulated annealing may be trapped in a local minimum,
and the 20 ns all-atom simulation was not able to allow the
helix to relax and rearrange into the native structure. The results
indicate that the multistage approach is useful for construction
and refinement of all-atom structures after the CG simulation
provides the prediction of near-native structures.
We also tested the ability of the CG potential to predict 3-D
structure when limited restraints are introduced based on the
secondary structure information (canonical base pairing) during
the simulated annealing simulations. We added restraint by
randomly picked 3-5 canonical Watson-Crick base pairs in
each RNA molecule (Table 7). With these limited restraints,
the CG model was able to predict all the 3-D structures for
each tested RNA in all three independent repeats, with rmsd’s
in the range of 2.8-6.5 Å (Table 7). The results are very
encouraging as they demonstrate that limited knowledge of
canonical base pairing from secondary structure prediction can
greatly facilitate the 3-D structure prediction using a CG
potential.
Figure 2. Superposition of the final snapshot from 10 ns CG simulations (colored green) and native structure (colored blue). The backbones are
represented as thick sticks, and the bases are shown as lines. (a) Superposition of RNA with 12 canonical Watson-Crick base pairs (PDB ID:
1QCU). (b) Superposition of the frameshifting RNA pesudoknot from beet western yellow virus (PDB ID: 1L2X), a single chain with coaxial
helices connected by two loops. (c) Superposition of 24-nt dsRNA with a 5×5 nt internal loop (PDB ID: 1LNT).
TABLE 7: Comparison of All-Atom RMSDs between the
Final Structures of 100 ns Simulated-Annealing Simulations
to Their Native Structures
rmsd (Å) without
restraints
rmsd (Å) with
restraints
PDB ID MIN/AVGa
MIN/AVG
number of
restrained pairs
157D 6.6/7.2 5.2/5.5 5
1AL5 6.4/8.4 5.2/5.8 5
1DQF 4.2/5.7 4.8/5.3 4
1F5G 5.2/7.0 5.8/5.9 5
1I9X 6.8/8.4 3.0/4.7 5
1KD3 8.0/9.1 5.3/5.6 5
1L2X 9.7/10.4 5.0/5.2 5
1LNT 6.5/7.7 5.0/5.6 5
1QCU 6.0/8.8 4.0/4.4 5
1ZIH 3.8/4.7 3.6/5.0 3
2AO5 5.1/6.5 2.8/4.6 5
2JXQ 4.1/6.4 3.0/4.8 5
2K7E 5.9/7.8 5.0/5.1 5
353D 4.8/6.0 4.0/5.5 5
472D 4.6/6.9 4.7/5.5 3
a
The minimum and average rmsd value among all repeats (the
restrained pairs shown in the last column on average correspond to
∼40% of each RNA).
CG Model for Simulation of RNA 3-D Structures J. Phys. Chem. B, Vol. 114, No. 42, 2010 13503
Computational Efficiency of the Coarse-Grained Model.
The computational efficiency of the CG model is greatly
improved when compared to the all-atom model. A nearly 2
orders of magnitude improvement in MD simulation speed was
found with the same time step of 1 fs. This improvement is
mainly due to the reduction in the number of bond, angle, and
torsion calculations. Furthermore, because of the absence of
high-frequency motions such as bond stretching in the all-atom
model, a time step up to 10 fs can be applied to the MD
simulation without a noticeable effect on energy and structural
stability. In addition, in explicit all-atom simulations using a
physical force field, not only is the number of atoms further
increased due to the presence of the solvent but also the
equilibration of water and counterions distribution is time-
consuming. Therefore, the CG model can achieve an improve-
ment of about 3 orders of magnitude in the simulation speed,
which may enable us to study a large system or extend the
simulation time from tens of nanoseconds to the scale of
microseconds.
Conclusions
In summary, we developed and applied a new statistical coarse-
grained potential to model RNA structures with molecular dynam-
ics. In the coarse-grained potential, each nucleotide is represented
by five pseudo atoms including three in the base ring. The bond,
angle, torsion, and nonbonded parameters in the CG potential were
derived based on the structural statistics sampled from experimental
structures of over 600 RNA in PDB. The Boltzmann inversion
was used to obtain the initial parameters for the CG potential.
Subsequently the nonbonded parameters were optimized analyti-
cally by comparing the CG minimum-energy structures with the
experimental structures. The optimization was performed system-
atically using the optimally conditioned variable metric nonlinear
optimization algorithm in TINKER.129,131-133
The resulting potential was validated in molecular dynamics
simulations of 15 RNAs, including helices, teraloops, stem loops,
bulges, and pseudoknots. Room-temperature MD simulations
starting from the native structures produced very reasonable rmsd
(3.36 Å on average), indicating the CG potential is able to maintain
Figure 3. (a) Comparison of all-atom rmsd’s for the structures 1ZIH, 353D, and 1DQF during the 100 ns simulated annealing simulations. The
simulation temperature was increased to 1000 K within the beginning 2000 steps and then cooled down to room temperature, 298 K. The rmsd’s
were calculated using all of the CG atoms. The figures show how the RNA molecules fold toward their native structures. (b) Snapshots taken from
simulated annealing of 1ZIH. (c) The superposition of the final conformation (colored green) and native structure (colored blue) of the GCCA
tetraloop after 20 ns full-atom MD refinement. The backbone is represented as a ribbon, and the base-stacking unit in a tetraloop is shown as sticks.
(d) Snapshots taken from simulated annealing simulation of 353D.
13504 J. Phys. Chem. B, Vol. 114, No. 42, 2010 Xia et al.
the native structure, or the native structures are minima on the CG
potential energy surface. The coarse-grained potential was then
applied to “predict” the 3-D structures of the 15 RNAs using
multiple independent simulated annealing dynamics simulations.
For most of the RNAs, at least one out of the five simulated
annealing runs, the structure folded into a near native state (rmsd
< 6.5 Å). We also noted that the CG potential was able to predict
the base stacking behavior in a tetraloop. Furthermore, we also
introduced limited distance restraints based on the knowledge of
canonical base pairing in the secondary structure. The reliability
of the structure prediction using CG potential was drastically
improved, and all RNAs were folded into structures with rmsd’s
less than 6.5 Å. We also investigated the possibility of using an
amber all-atom force field to map and refine the CG model into
all-atom structures.
Overall, the performance of this simple CG potential is very
promising. With limited knowledge of base-pairing from
secondary structure prediction, the CG approach can reliably
predict the 3-D structure for small RNA molecules of various
topologies. The analytical functional form of the CG potential
is compatible with existing molecular modeling packages such
as NAMD148
and GROMACS,149
so that it can be easily adapted
and take advantage of sophisticated simulation algorithms such
as the replica exchange molecular dynamic method150
that is
much more effective than simulated annealing for conforma-
tional sampling. Further improvement of the accuracy of the
CG potential can be achieved by incorporating more experi-
mental structure and refinement of the parameters. To capture
the nonbonded interaction more precisely, spline interpolation
functions can be utilized instead of the current simple analytical
function,117
In the future, extra types of pseudo atoms will be
incorporated to represent the modified bases, especially by
methylation, such as inosine (derived from adenine) or pseudou-
ridine (derived from uracil) in tRNA.
Acknowledgment. This research is supported by a grant from
the Robert A. Welch Foundation to P.R. (F-1691), and R.G.
acknowledges support by the Robert A. Welch Foundation
(F-1427) and Microsoft Research. Z.X. is grateful to Yue Shi
and Dr. Chunli Yan for their help with the AMBER simulations.
The authors also acknowledge TeraGrid for providing the
computing resources via grant TG-MCB100057.
Note Added after ASAP Publication. This paper was
published on the Web on September 30, 2010. An update was made
to the Acknowledgment and the corrected version was reposted
on October 4, 2010.
Supporting Information Available: The probability distri-
butions of all virtual bonds, angles, and torsions for parametri-
zation are shown in Figures S1, S2, and S4, respectively. The
potential of mean force for each coarse-grained pair could be
seen in Figure S3. The rmsd’s during 20 ns all-atom simulation
refinement are show in Figure S5. This material is available
free of charge via the Internet at http://pubs.acs.org.
References and Notes
(1) Crick, F. Symp. Soc. Exp. Biol. 1958, XII, 138.
(2) Crick, F. Nature 1970, 227, 561.
(3) James, D. W.; Tania, A. B.; Stephen, P. B.; Alexander, G.;
Michael, L.; Richard, L.; CSHLP, I. Molecular Biology of the Gene, 6th
ed.; Benjamin Cummings: San Francisco, CA, 2007.
(4) Stark, B. C.; Kole, R.; Bowman, E. J.; Altman, S. Proc. Natl.
Acad. Sci. U.S.A. 1978, 75, 3717.
(5) Noller, H. F.; Chaires, J. B. Proc. Natl. Acad. Sci. U.S.A. 1972,
69, 3115.
(6) Noller, H. F.; Chang, C.; Thomas, G.; Aldridge, J. J. Mol. Biol.
1971, 61, 669.
(7) Kruger, K.; Grabowski, P. J.; Zaug, A. J.; Sands, J.; Gottschling,
D. E.; Cech, T. R. Cell 1982, 31, 147.
(8) Guerrier-Takada, C.; Gardiner, K.; Marsh, T.; Pace, N.; Altman,
S. Cell 1983, 35, 849.
(9) Nahvi, A.; Sudarsan, N.; Ebert, M. S.; Zou, X.; Brown, K. L.;
Breaker, R. R. Chem. Biol. 2002, 9, 1043.
(10) Winkler, W.; Nahvi, A.; Breaker, R. R. Nature 2002, 419, 952.
(11) Winkler, W. C.; Cohen-Chalamish, S.; Breaker, R. R. Proc. Natl.
Acad. Sci. U.S.A. 2002, 99, 15908.
(12) Rodionov, D. A.; Vitreschak, A. G.; Mironov, A. A.; Gelfand,
M. S. Nucleic Acids Res. 2003, 31, 6748.
(13) Vitreschak, A. G.; Rodionov, D. A.; Mironov, A. A.; Gelfand,
M. S. Trends Genet. 2004, 20, 44.
(14) Doudna, J. A.; Szostak, J. W. Nature 1989, 339, 519.
(15) Noller, H. F.; Hoffarth, V.; Zimniak, L. Science 1992, 256, 1416.
(16) Hingerty, B.; Brown, R. S.; Jack, A. J. Mol. Biol. 1978, 124, 523.
(17) Ban, N.; Nissen, P.; Hansen, J.; Moore, P. B.; Steitz, T. A. Science
2000, 289, 905.
(18) Wimberly, B. T.; Brodersen, D. E.; Clemons, W. M., Jr.; Morgan-
Warren, R. J.; Carter, A. P.; Vonrhein, C.; Hartsch, T.; Ramakrishnan, V.
Nature 2000, 407, 327.
(19) Brodersen, D. E.; Clemons, W. M., Jr.; Carter, A. P.; Wimberly,
B. T.; Ramakrishnan, V. J. Mol. Biol. 2002, 316, 725.
(20) Kazantsev, A. V.; Krivenko, A. A.; Harrington, D. J.; Holbrook,
S. R.; Adams, P. D.; Pace, N. R. Proc. Natl. Acad. Sci. U.S.A. 2005, 102,
13392.
(21) Torres-Larios, A.; Swinger, K. K.; Krasilnikov, A. S.; Pan, T.;
Mondragon, A. Nature 2005, 437, 584.
(22) Serganov, A.; Huang, L.; Patel, D. J. Nature 2009, 458, 233.
(23) Cate, J. H.; Gooding, A. R.; Podell, E.; Zhou, K.; Golden, B. L.;
Kundrot, C. E.; Cech, T. R.; Doudna, J. A. Science 1996, 273, 1678.
(24) Vidovic, I.; Nottrott, S.; Hartmuth, K.; Luhrmann, R.; Ficner, R.
Mol. Cell. 2000, 6, 1331.
(25) Serganov, A.; Yuan, Y. R.; Pikovskaya, O.; Polonskaia, A.;
Malinina, L.; Phan, A. T.; Hobartner, C.; Micura, R.; Breaker, R. R.; Patel,
D. J. Chem. Biol. 2004, 11, 1729.
(26) Bessho, Y.; Shibata, R.; Sekine, S.; Murayama, K.; Higashijima,
K.; Hori-Takemoto, C.; Shirouzu, M.; Kuramitsu, S.; Yokoyama, S. Proc.
Natl. Acad. Sci. U.S.A. 2007, 104, 8293.
(27) Klein, D. J.; Ferre-D’Amare, A. R. Science 2006, 313, 1752.
(28) Serganov, A.; Huang, L.; Patel, D. J. Nature 2008, 455, 1263.
(29) Dann, C. E., III; Wakeman, C. A.; Sieling, C. L.; Baker, S. C.;
Irnov, I.; Winkler, W. C. Cell 2007, 130, 878.
(30) Thore, S.; Leibundgut, M.; Ban, N. Science 2006, 312, 1208.
(31) Montange, R. K.; Batey, R. T. Nature 2006, 441, 1172.
(32) Hainzl, T.; Huang, S.; Sauer-Eriksson, A. E. Nature 2002, 417, 767.
(33) Kim, S. H.; Suddath, F. L.; Quigley, G. J.; McPherson, A.; Sussman,
J. L.; Wang, A. H.; Seeman, N. C.; Rich, A. Science 1974, 185, 435.
(34) Costa, F. F. Bioessays 2007, 32, 599.
(35) Spizzo, R.; Nicoloso, M. S.; Croce, C. M.; Calin, G. A. Cell 2009,
137, 586.
(36) Frohlich, K. S.; Vogel, J. Curr. Opin. Microbiol. 2009, 12, 674.
(37) Georg, J.; Voss, B.; Scholz, I.; Mitschke, J.; Wilde, A.; Hess, W. R.
Mol. Syst. Biol. 2009, 5, 305.
(38) Khraiwesh, B.; Arif, M. A.; Seumel, G. I.; Ossowski, S.; Weigel,
D.; Reski, R.; Frank, W. Cell 2010, 140, 111.
(39) Hale, C. R.; Zhao, P.; Olson, S.; Duff, M. O.; Graveley, B. R.;
Wells, L.; Terns, R. M.; P., T. M. Cell 2009, 139, 945.
(40) Marraffini, L. A.; Sontheimer, E. J. Nat. ReV. Genet. 2010, 11,
181.
(41) Hamilton, A. J.; Baulcombe, D. C. Science 1999, 286, 950.
(42) Lecellier, C. H.; Dunoyer, P.; Arar, K.; Lehmann-Che, J.; Eyquem,
S.; Himber, C.; Saib, A.; Voinnet, O. Science 2005, 308, 557.
(43) Buchon, N.; Vaury, C. Heredity 2006, 96, 195.
(44) Mattick, J. S.; Taft, R. J.; Faulkner, G. J. Trends Genet. 2010,
26, 21.
(45) Gupta, R. A.; Shah, N.; Wang, K. C.; Kim, J.; Horlings, H. M.;
Wong, D. J.; Tsai, M.-C.; Hung, T.; Argani, P.; Rinn, J. L.; Wang, Y.;
Brzoska, P.; Kong, B.; Li, R.; West, R. B.; van de Vijver, M. J.; Sukumar,
S.; Chang, H. Y. Nature 2010, 464, 1071.
(46) Croce, C. M. Nat. ReV. Genet. 2009, 10, 704.
(47) Sassen, S.; Miska, E. A.; Caldas, C. Virchows Arch. 2008,
452, 1.
(48) Hahn, M. W.; Wray, G. A. EVol. DeV. 2002, 4, 73.
(49) Taft, R. J.; Pheasant, M.; Mattick, J. S. Bioessays 2007, 29, 288.
(50) Michel, F.; Westhof, E. J. Mol. Biol. 1990, 216, 585.
(51) Levitt, M. Nature 1969, 224, 759.
(52) Malhotra, A.; Tan, R. K.; Harvey, S. C. Biophys. J. 1994, 66,
1777.
(53) Fink, D. L.; Chen, R. O.; Noller, H. F.; Altman, R. B. RNA 1996,
2, 851.
CG Model for Simulation of RNA 3-D Structures J. Phys. Chem. B, Vol. 114, No. 42, 2010 13505
(54) Lehnert, V.; Jaeger, L.; Michel, F.; Westhof, E. Chem. Biol. 1996,
3, 993.
(55) Wang, R.; Alexander, R. W.; VanLoock, M.; Vladimirov, S.; Bukhti-
yarov, Y.; Harvey, S. C.; Cooperman, B. S. J. Mol. Biol. 1999, 286, 521.
(56) Sommer, I.; Brimacombe, R. J. Comput. Chem. 2001, 22, 407.
(57) Stagg, S. M.; Mears, J. A.; Harvey, S. C. J. Mol. Biol. 2003, 328, 49.
(58) Shapiro, B. A.; Yingling, Y. G.; Kasprzak, W.; Bindewald, E.
Curr. Opin. Struct. Biol. 2007, 17, 157.
(59) Malhotra, A.; Harvey, S. C. J. Mol. Biol. 1994, 240, 308.
(60) Devkota, B.; Petrov, A. S.; Lemieux, S.; Boz, M. B.; Tang, L.;
Schneemann, A.; Johnson, J. E.; Harvey, S. C. Biopolymers 2009, 91, 530.
(61) Meller, J.; Elber, R. Comput. Methods Protein Folding 2002, 120, 77.
(62) Kryshtafovych, A.; Venclovas, C.; Fidelis, K.; Moult, J. Proteins:
Struct., Funct., Bioinf. 2005, 61, 225.
(63) Moult, J. Curr. Opin. Struct. Biol. 2005, 15, 285.
(64) Zwieb, C.; Muller, F. Nucleic Acids Symp. Ser. 1997, 36, 69.
(65) Orozco, M.; Perez, A.; Noy, A.; Luque, F. J. Chem. Soc. ReV.
2003, 32, 350.
(66) Jossinet, F.; Westhof, E. Bioinformatics 2005, 21, 3320.
(67) Wu, J. C.; Gardner, D. P.; Ozer, S.; Gutell, R. R.; Ren, P. J. Mol.
Biol. 2009, 391, 769.
(68) Das, R.; Baker, D. Proc. Natl. Acad. Sci. U.S.A. 2007, 104, 14664.
(69) Parisien, M.; Major, F. Nature 2008, 452, 51.
(70) Pearlman, D. A.; Case, D. A.; Caldwell, J. W.; Ross, W. S.;
Cheatham, T. E.; Debolt, S.; Ferguson, D.; Seibel, G.; Kollman, P. Comput.
Phys. Commun. 1995, 91, 1.
(71) Cheatham, T. E., III; Cieplak, P.; Kollman, P. A. J. Biomol. Struct.
Dyn. 1999, 16, 845.
(72) Case, D. A.; Cheatham, T. E., III; Darden, T.; Gohlke, H.; Luo,
R.; Merz, K. M., Jr.; Onufriev, A.; Simmerling, C.; Wang, B.; Woods, R. J.
J. Comput. Chem. 2005, 26, 1668.
(73) Perez, A.; Marchan, I.; Svozil, D.; Sponer, J.; Cheatham, T. E.,
III; Laughton, C. A.; Orozco, M. Biophys. J. 2007, 92, 3817.
(74) Brooks, B. R.; Bruccoeri, R. E.; Olafson, B. D.; States, D. J.;
Swaminathan, S.; Karplus, M. J. Comput. Chem. 1983, 4, 187.
(75) MacKerell, A. D., Jr.; Banavali, N.; Foloppe, N. Biopolymers 2000,
56, 257.
(76) Brooks, B. R.; Brooks, C. L., III; Mackerell, A. D., Jr.; Nilsson,
L.; Petrella, R. J.; Roux, B.; Won, Y.; Archontis, G.; Bartels, C.; Boresch,
S.; Caflisch, A.; Caves, L.; Cui, Q.; Dinner, A. R.; Feig, M.; Fischer, S.;
Gao, J.; Hodoscek, M.; Im, W.; Kuczera, K.; Lazaridis, T.; Ma, J.;
Ovchinnikov, V.; Paci, E.; Pastor, R. W.; Post, C. B.; Pu, J. Z.; Schaefer,
M.; Tidor, B.; Venable, R. M.; Woodcock, H. L.; Wu, X.; Yang, W.; York,
D. M.; Karplus, M. J. Comput. Chem. 2009, 30, 1545.
(77) Freddolino, P. L.; Arkhipov, A. S.; Larson, S. B.; McPherson,
A.; Schulten, K. Structure 2006, 14, 437.
(78) Knotts, T. A.; Rathore, N.; Schwartz, D. C.; de Pablo, J. J. J. Chem.
Phys. 2007, 126, 084901.
(79) Golubkov, P. A.; Ren, P. Y. J. Chem. Phys. 2006, 125.
(80) Scheraga, H. A.; Khalili, M.; Liwo, A. Annu. ReV. Phys. Chem.
2007, 58, 57.
(81) Golubkov, P. A.; Wu, J. C.; Ren, P. Y. Phys. Chem. Chem. Phys.
2008, 10, 2050.
(82) Maroun, R. C.; Olson, W. K. Biopolymers 1988, 27, 585.
(83) Maroun, R. C.; Olson, W. K. Biopolymers 1988, 27, 561.
(84) Hao, M. H.; Olson, W. K. Biopolymers 1989, 28, 873.
(85) Allinger, N. L.; Yuh, Y. H.; Lii, J.-H. J. Am. Chem. Soc. 1989,
111, 8851.
(86) Tan, R. K.; Harvey, S. C. J. Mol. Biol. 1989, 205, 573.
(87) Sprous, D.; Harvey, S. C. Biophys. J. 1996, 70, 1893.
(88) Sprous, D.; Tan, R. K.; Harvey, S. C. Biopolymers 1996, 39, 243.
(89) Tan, R. K.; Sprous, D.; Harvey, S. C. Biopolymers 1996, 39, 259.
(90) Massire, C.; Westhof, E. J. Mol. Graphics Modell. 1998, 16, 197.
(91) Tanaka, I.; Nakagawa, A.; Hosaka, H.; Wakatsuki, S.; Mueller,
F.; Brimacombe, R. RNA 1998, 4, 542.
(92) Olson, W. K.; Zhurkin, V. B. Curr. Opin. Struct. Biol. 2000, 10,
286.
(93) Matsumoto, A.; Olson, W. K. Biophys. J. 2002, 83, 22.
(94) Coleman, B. D.; Olson, W. K.; Swigon, D. J. Chem. Phys. 2003,
118, 7127.
(95) Mergell, B.; Ejtehadi, M. R.; Everaers, R. Phys. ReV. E 2003, 68,
021911.
(96) Flammini, A.; Maritan, A.; Stasiak, A. Biophys. J. 2004, 87, 2968.
(97) LaMarque, J. C.; Le, T. V.; Harvey, S. C. Biopolymers 2004, 73,
348.
(98) Nielsen, S. O.; Lopez, C. F.; Srinivas, G.; Klein, M. L. J. Phys.:
Condens. Matter 2004, 16, R481.
(99) Peyrard, M. Nonlinearity 2004, 17, R1.
(100) Zhang, D. Q.; Konecny, R.; Baker, N. A.; McCammon, J. A.
Biopolymers 2004, 75, 325.
(101) Cao, S.; Chen, S. J. RNA 2005, 11, 1884.
(102) Tepper, H. L.; Voth, G. A. J. Chem. Phys. 2005, 122, 124906.
(103) Li, X. J.; Kou, D. Z.; Rao, S. L.; Liang, H. J. J. Chem. Phys.
2006, 124.
(104) Tan, R. K. Z.; Petrov, A. S.; Harvey, S. C. J. Chem. Theory
Comput. 2006, 2, 529.
(105) Vologodskii, A. Biophys. J. 2006, 90, 1594.
(106) Ding, F.; Sharma, S.; Chalasani, P.; Demidov, V. V.; Broude,
N. E.; Dokholyan, N. V. RNA 2008, 14, 1164.
(107) Jonikas, M. A.; Radmer, R. J.; Laederach, A.; Das, R.; Pearlman,
S.; Herschlag, D.; Altman, R. B. RNA 2009, 15, 189.
(108) Ledford, H. Nature 2010, 465, 16.
(109) Cannone, J. J.; Subramanian, S.; Schnare, M. N.; Collett, J. R.;
D’Souza, L. M.; Du, Y.; Feng, B.; Lin, N.; Madabusi, L. V.; Muller, K. M.;
Pande, N.; Shang, Z.; Yu, N.; Gutell, R. R. BMC Bioinf. 2002, 3, 2.
(110) Duarte, C. M.; Pyle, A. M. J. Mol. Biol. 1998, 284, 1465.
(111) Tschop, W.; Kremer, K.; Batoulis, J.; Burger, T.; Hahn, O. Acta
Polym. 1998, 49, 61.
(112) Muller-Plathe, F. ChemPhysChem 2002, 3, 754.
(113) Buckingham, R. A. Proc. R. Soc. London, Ser. A 1938, 168, 264.
(114) Allinger, N. L.; Yuh, Y. H.; Lii, J. H. J. Am. Chem. Soc. 1989,
111, 8551.
(115) Lii, J. H.; Allinger, N. L. J. Am. Chem. Soc. 1989, 111, 8566.
(116) Lii, J. H.; Allinger, N. L. J. Am. Chem. Soc. 1989, 111, 8576.
(117) Summa, C. M.; Levitt, M. Proc. Natl. Acad. Sci. U.S.A. 2007,
104, 3177.
(118) Case, D. A.; Darden, T. A.; Cheatham, T. E.; Simmerling, C. L.;
Wang, J.; Duke, R. E.; Luo, R.; Crowley, M.; Walker, R. C.; Zhang, W.;
Merz, K. M.; Wang, B.; Hayik, S.; Roitberg, A.; Seabra, G.; Kolossva´ry,
I.; Wong, K. F.; Paesani, F.; Vanicek, J.; Wu, X.; Brozell, S. R.;
Steinbrecher, T.; Gohlke, H.; Yang, L.; Tan, C.; Mongan, J.; Hornak, V.;
Cui, G.; Mathews, D. H.; Seetin, M. G.; Sagui, C.; Babin, V.; Kollman,
P. A. AMBER 10; University of California, San Francisco, 2008.
(119) Jorgensen, W. L.; Chandrasekhar, J.; Madura, J.; Impey, R. W.;
Klein, M. L. J. Chem. Phys. 1983, 79, 926.
(120) Neria, E.; Karplus, M. J. Chem. Phys. 1996, 105, 10812.
(121) Deserno, M.; Holm, C. J. Chem. Phys. 1998, 109, 7678.
(122) Deserno, M.; Holm, C. J. Chem. Phys. 1998, 109, 7694.
(123) Still, W. C.; Tempczyk, A.; Hawley, R. C.; Hendrickson, T. J. Am.
Chem. Soc. 1990, 112, 6127.
(124) Schaefer, M.; Karplus, M. J. Phys. Chem. 1996, 100, 1578.
(125) Scarsi, M.; Apostolakis, J.; Caflisch, A. J. Phys. Chem. A 1997,
101, 8098.
(126) Dominy, B. N.; Brooks, C. L. J. Phys. Chem. B 1999, 103, 3765.
(127) Bashford, D.; Case, D. A. Annu. ReV. Phys. Chem. 2000, 51, 129.
(128) Feig, M.; Im, W.; Brooks, C. L. J. Chem. Phys. 2004, 120, 903.
(129) Ponder, J. W. TINKER - Software Tools for Molecular Design;
Washington University Medical School, 2010.
(130) Skolnick, J.; Jaroszewski, L.; Kolinski, A.; Godzik, A. Protein
Sci. 1997, 6, 676.
(131) Shanno, D. F.; Phua, K.-H. Math. Program. 1977, 25, 507.
(132) Davidon, W. C. Math. Program. 1975, 9, 1.
(133) Shanno, D. F.; Phua, K. H. J. Optim. Theory Appl. 1978, 25, 507.
(134) Egli, M.; Minasov, G.; Su, L.; Rich, A. Proc. Natl. Acad. Sci.
U.S.A. 2002, 99, 4302.
(135) Deng, J.; Xiong, Y.; Pan, B.; Sundaralingam, M. Acta. Crystallogr.,
Sect. D: Biol. Crystallogr. 2003, 59, 1004.
(136) Draper, D. E. Biophys. J. 2008, 95, 5489.
(137) Heus, H. A.; Pardi, A. Science 1991, 253, 191.
(138) Jucker, F. M.; Heus, H. A.; Yip, P. F.; Moors, E. H. M.; Pardi,
A. J. Mol. Biol. 1996, 264, 968.
(139) Betzel, C.; Lorenz, S.; Furste, J. P.; Bald, R.; Zhang, M.; Schneider,
T. R.; Wilson, K. S.; Erdmann, V. A. Febs. Lett. 1994, 351, 159.
(140) Xiong, Y.; Sundaralingam, M. RNA 2000, 6, 1316.
(141) Correll, C. C.; Swinger, K. RNA 2003, 9, 355.
(142) Woese, C. R.; Winker, S.; Gutell, R. R. Proc. Natl. Acad. Sci.
U.S.A. 1990, 87, 8467.
(143) Doherty, E. A.; Batey, R. T.; Masquida, B.; Doudna, J. A. Nat.
Struct. Biol. 2001, 8, 339.
(144) Nissen, P.; Ippolito, J. A.; Ban, N.; Moore, P. B.; Steitz, T. A.
Proc. Natl. Acad. Sci. U.S.A. 2001, 98, 4899.
(145) Cate, J. H.; Gooding, A. R.; Podell, E.; Zhou, K.; Golden, B. L.;
Szewczak, A. A.; Kundrot, C. E.; Cech, T. R.; Doudna, J. A. Science 1996,
273, 1696.
(146) Jucker, F. M.; Pardi, A. RNA 1995, 1, 219.
(147) Sorin, E. J.; Engelhardt, M. A.; Herschlag, D.; Pande, V. S. J.
Mol. Biol. 2002, 317, 493.
(148) Phillips, J. C.; Braun, R.; Wang, W.; Gumbart, J.; Tajkhorshid,
E.; Villa, E.; Chipot, C.; Skeel, R. D.; Kale, L.; Schulten, K. J. Comput.
Chem. 2005, 26, 1781.
(149) van der Spoel, D.; Lindahl, E.; Hess, B.; van Buuren, A. R.; Apol,
E.; Meulenhoff, P. J.; Tieleman, D. P.; Sijbers, A. L.T. M.; Feenstra, K. A.;
Drunen, R. v.; Berendsen, C. H. J. www.gromacs.org, (accessed Dec 2005).
(150) Sugita, Y.; Okamoto, Y. Chem. Phys. Lett. 1999, 314, 141.
JP104926T
13506 J. Phys. Chem. B, Vol. 114, No. 42, 2010 Xia et al.

Mais conteúdo relacionado

Destaque

Gutell 093.jphy.2005.41.0380
Gutell 093.jphy.2005.41.0380Gutell 093.jphy.2005.41.0380
Gutell 093.jphy.2005.41.0380
Robin Gutell
 
Gutell 091.imb.2004.13.495
Gutell 091.imb.2004.13.495Gutell 091.imb.2004.13.495
Gutell 091.imb.2004.13.495
Robin Gutell
 
Gutell 088.mpe.2003.29.0258
Gutell 088.mpe.2003.29.0258Gutell 088.mpe.2003.29.0258
Gutell 088.mpe.2003.29.0258
Robin Gutell
 
BMC_Systems_Biology_2013_Udyavar
BMC_Systems_Biology_2013_UdyavarBMC_Systems_Biology_2013_Udyavar
BMC_Systems_Biology_2013_Udyavar
Akshata Udyavar PhD
 
Gutell 086.bmc.evol.biol.2003.03.07
Gutell 086.bmc.evol.biol.2003.03.07Gutell 086.bmc.evol.biol.2003.03.07
Gutell 086.bmc.evol.biol.2003.03.07
Robin Gutell
 

Destaque (9)

Gutell 093.jphy.2005.41.0380
Gutell 093.jphy.2005.41.0380Gutell 093.jphy.2005.41.0380
Gutell 093.jphy.2005.41.0380
 
Gutell 111.bmc.genomics.2010.11.485
Gutell 111.bmc.genomics.2010.11.485Gutell 111.bmc.genomics.2010.11.485
Gutell 111.bmc.genomics.2010.11.485
 
Gutell 091.imb.2004.13.495
Gutell 091.imb.2004.13.495Gutell 091.imb.2004.13.495
Gutell 091.imb.2004.13.495
 
Gutell 116.rpass.bibm11.pp618-622.2011
Gutell 116.rpass.bibm11.pp618-622.2011Gutell 116.rpass.bibm11.pp618-622.2011
Gutell 116.rpass.bibm11.pp618-622.2011
 
Gutell 088.mpe.2003.29.0258
Gutell 088.mpe.2003.29.0258Gutell 088.mpe.2003.29.0258
Gutell 088.mpe.2003.29.0258
 
Gutell 117.rcad_e_science_stockholm_pp15-22
Gutell 117.rcad_e_science_stockholm_pp15-22Gutell 117.rcad_e_science_stockholm_pp15-22
Gutell 117.rcad_e_science_stockholm_pp15-22
 
BMC_Systems_Biology_2013_Udyavar
BMC_Systems_Biology_2013_UdyavarBMC_Systems_Biology_2013_Udyavar
BMC_Systems_Biology_2013_Udyavar
 
Gutell 086.bmc.evol.biol.2003.03.07
Gutell 086.bmc.evol.biol.2003.03.07Gutell 086.bmc.evol.biol.2003.03.07
Gutell 086.bmc.evol.biol.2003.03.07
 
Gutell 107.ssdbm.2009.200
Gutell 107.ssdbm.2009.200Gutell 107.ssdbm.2009.200
Gutell 107.ssdbm.2009.200
 

Semelhante a Gutell 112.j.phys.chem.b.2010.114.13497

Gutell 090.bmc.bioinformatics.2004.5.105
Gutell 090.bmc.bioinformatics.2004.5.105Gutell 090.bmc.bioinformatics.2004.5.105
Gutell 090.bmc.bioinformatics.2004.5.105
Robin Gutell
 
Computational Analysis with ICM
Computational Analysis with ICMComputational Analysis with ICM
Computational Analysis with ICM
Vernon D Dutch Jr
 
Main_Ms_JBNMR_Final_version
Main_Ms_JBNMR_Final_versionMain_Ms_JBNMR_Final_version
Main_Ms_JBNMR_Final_version
Abhilash Kannan
 
CBE_Symposium_Poster_Aparajita - sjp
CBE_Symposium_Poster_Aparajita - sjpCBE_Symposium_Poster_Aparajita - sjp
CBE_Symposium_Poster_Aparajita - sjp
Aparajita Dasgupta
 
Comparative Protein Structure Modeling and itsApplications
Comparative Protein Structure Modeling and itsApplicationsComparative Protein Structure Modeling and itsApplications
Comparative Protein Structure Modeling and itsApplications
LynellBull52
 
Gutell 059.fold.design.01.0419
Gutell 059.fold.design.01.0419Gutell 059.fold.design.01.0419
Gutell 059.fold.design.01.0419
Robin Gutell
 

Semelhante a Gutell 112.j.phys.chem.b.2010.114.13497 (20)

Gutell 108.jmb.2009.391.769
Gutell 108.jmb.2009.391.769Gutell 108.jmb.2009.391.769
Gutell 108.jmb.2009.391.769
 
Gutell 090.bmc.bioinformatics.2004.5.105
Gutell 090.bmc.bioinformatics.2004.5.105Gutell 090.bmc.bioinformatics.2004.5.105
Gutell 090.bmc.bioinformatics.2004.5.105
 
Computational Analysis with ICM
Computational Analysis with ICMComputational Analysis with ICM
Computational Analysis with ICM
 
Deep Learning Meets Biology: How Does a Protein Helix Know Where to Start and...
Deep Learning Meets Biology: How Does a Protein Helix Know Where to Start and...Deep Learning Meets Biology: How Does a Protein Helix Know Where to Start and...
Deep Learning Meets Biology: How Does a Protein Helix Know Where to Start and...
 
Gutell 114.jmb.2011.413.0473
Gutell 114.jmb.2011.413.0473Gutell 114.jmb.2011.413.0473
Gutell 114.jmb.2011.413.0473
 
Computational studies of proteins and nucleic acid (Dissertation)
Computational studies of proteins and nucleic acid (Dissertation)Computational studies of proteins and nucleic acid (Dissertation)
Computational studies of proteins and nucleic acid (Dissertation)
 
Research Inventy : International Journal of Engineering and Science
Research Inventy : International Journal of Engineering and ScienceResearch Inventy : International Journal of Engineering and Science
Research Inventy : International Journal of Engineering and Science
 
Towards More Reliable 13C and 1H Chemical Shift Prediction: A Systematic Comp...
Towards More Reliable 13C and 1H Chemical Shift Prediction: A Systematic Comp...Towards More Reliable 13C and 1H Chemical Shift Prediction: A Systematic Comp...
Towards More Reliable 13C and 1H Chemical Shift Prediction: A Systematic Comp...
 
Main_Ms_JBNMR_Final_version
Main_Ms_JBNMR_Final_versionMain_Ms_JBNMR_Final_version
Main_Ms_JBNMR_Final_version
 
Protein secondary structure prediction by a neural network architecture with...
Protein secondary structure prediction by a neural network  architecture with...Protein secondary structure prediction by a neural network  architecture with...
Protein secondary structure prediction by a neural network architecture with...
 
CBE_Symposium_Poster_Aparajita - sjp
CBE_Symposium_Poster_Aparajita - sjpCBE_Symposium_Poster_Aparajita - sjp
CBE_Symposium_Poster_Aparajita - sjp
 
SAGE- Serial Analysis of Gene Expression
SAGE- Serial Analysis of Gene ExpressionSAGE- Serial Analysis of Gene Expression
SAGE- Serial Analysis of Gene Expression
 
3 D QSAR Approaches and Contour Map Analysis
3 D QSAR Approaches and Contour Map Analysis3 D QSAR Approaches and Contour Map Analysis
3 D QSAR Approaches and Contour Map Analysis
 
BEL110 presentation
BEL110 presentationBEL110 presentation
BEL110 presentation
 
Comparative Protein Structure Modeling and itsApplications
Comparative Protein Structure Modeling and itsApplicationsComparative Protein Structure Modeling and itsApplications
Comparative Protein Structure Modeling and itsApplications
 
sp2016ren
sp2016rensp2016ren
sp2016ren
 
A systematic approach for the generation and verification of structural hypot...
A systematic approach for the generation and verification of structural hypot...A systematic approach for the generation and verification of structural hypot...
A systematic approach for the generation and verification of structural hypot...
 
Crimson Publishers-Predicting Protein Transmembrane Regionsby Using LSTM Model
Crimson Publishers-Predicting Protein Transmembrane Regionsby Using LSTM ModelCrimson Publishers-Predicting Protein Transmembrane Regionsby Using LSTM Model
Crimson Publishers-Predicting Protein Transmembrane Regionsby Using LSTM Model
 
Gutell 059.fold.design.01.0419
Gutell 059.fold.design.01.0419Gutell 059.fold.design.01.0419
Gutell 059.fold.design.01.0419
 
Bs4201462467
Bs4201462467Bs4201462467
Bs4201462467
 

Mais de Robin Gutell

Mais de Robin Gutell (20)

Gutell 124.rna 2013-woese-19-vii-xi
Gutell 124.rna 2013-woese-19-vii-xiGutell 124.rna 2013-woese-19-vii-xi
Gutell 124.rna 2013-woese-19-vii-xi
 
Gutell 123.app environ micro_2013_79_1803
Gutell 123.app environ micro_2013_79_1803Gutell 123.app environ micro_2013_79_1803
Gutell 123.app environ micro_2013_79_1803
 
Gutell 122.chapter comparative analy_russell_2013
Gutell 122.chapter comparative analy_russell_2013Gutell 122.chapter comparative analy_russell_2013
Gutell 122.chapter comparative analy_russell_2013
 
Gutell 120.plos_one_2012_7_e38320_supplemental_data
Gutell 120.plos_one_2012_7_e38320_supplemental_dataGutell 120.plos_one_2012_7_e38320_supplemental_data
Gutell 120.plos_one_2012_7_e38320_supplemental_data
 
Gutell 119.plos_one_2017_7_e39383
Gutell 119.plos_one_2017_7_e39383Gutell 119.plos_one_2017_7_e39383
Gutell 119.plos_one_2017_7_e39383
 
Gutell 118.plos_one_2012.7_e38203.supplementalfig
Gutell 118.plos_one_2012.7_e38203.supplementalfigGutell 118.plos_one_2012.7_e38203.supplementalfig
Gutell 118.plos_one_2012.7_e38203.supplementalfig
 
Gutell 115.rna2dmap.bibm11.pp613-617.2011
Gutell 115.rna2dmap.bibm11.pp613-617.2011Gutell 115.rna2dmap.bibm11.pp613-617.2011
Gutell 115.rna2dmap.bibm11.pp613-617.2011
 
Gutell 113.ploso.2011.06.e18768
Gutell 113.ploso.2011.06.e18768Gutell 113.ploso.2011.06.e18768
Gutell 113.ploso.2011.06.e18768
 
Gutell 110.ant.v.leeuwenhoek.2010.98.195
Gutell 110.ant.v.leeuwenhoek.2010.98.195Gutell 110.ant.v.leeuwenhoek.2010.98.195
Gutell 110.ant.v.leeuwenhoek.2010.98.195
 
Gutell 109.ejp.2009.44.277
Gutell 109.ejp.2009.44.277Gutell 109.ejp.2009.44.277
Gutell 109.ejp.2009.44.277
 
Gutell 106.j.euk.microbio.2009.56.0142.2
Gutell 106.j.euk.microbio.2009.56.0142.2Gutell 106.j.euk.microbio.2009.56.0142.2
Gutell 106.j.euk.microbio.2009.56.0142.2
 
Gutell 105.zoologica.scripta.2009.38.0043
Gutell 105.zoologica.scripta.2009.38.0043Gutell 105.zoologica.scripta.2009.38.0043
Gutell 105.zoologica.scripta.2009.38.0043
 
Gutell 104.biology.direct.2008.03.016
Gutell 104.biology.direct.2008.03.016Gutell 104.biology.direct.2008.03.016
Gutell 104.biology.direct.2008.03.016
 
Gutell 103.structure.2008.16.0535
Gutell 103.structure.2008.16.0535Gutell 103.structure.2008.16.0535
Gutell 103.structure.2008.16.0535
 
Gutell 101.physica.a.2007.386.0564.good
Gutell 101.physica.a.2007.386.0564.goodGutell 101.physica.a.2007.386.0564.good
Gutell 101.physica.a.2007.386.0564.good
 
Gutell 100.imb.2006.15.533
Gutell 100.imb.2006.15.533Gutell 100.imb.2006.15.533
Gutell 100.imb.2006.15.533
 
Gutell 099.nature.2006.443.0931
Gutell 099.nature.2006.443.0931Gutell 099.nature.2006.443.0931
Gutell 099.nature.2006.443.0931
 
Gutell 098.jmb.2006.360.0978
Gutell 098.jmb.2006.360.0978Gutell 098.jmb.2006.360.0978
Gutell 098.jmb.2006.360.0978
 
Gutell 097.jphy.2006.42.0655
Gutell 097.jphy.2006.42.0655Gutell 097.jphy.2006.42.0655
Gutell 097.jphy.2006.42.0655
 
Gutell 096.jmb.2006.358.0193
Gutell 096.jmb.2006.358.0193Gutell 096.jmb.2006.358.0193
Gutell 096.jmb.2006.358.0193
 

Último

Artificial Intelligence: Facts and Myths
Artificial Intelligence: Facts and MythsArtificial Intelligence: Facts and Myths
Artificial Intelligence: Facts and Myths
Joaquim Jorge
 
CNv6 Instructor Chapter 6 Quality of Service
CNv6 Instructor Chapter 6 Quality of ServiceCNv6 Instructor Chapter 6 Quality of Service
CNv6 Instructor Chapter 6 Quality of Service
giselly40
 

Último (20)

Automating Google Workspace (GWS) & more with Apps Script
Automating Google Workspace (GWS) & more with Apps ScriptAutomating Google Workspace (GWS) & more with Apps Script
Automating Google Workspace (GWS) & more with Apps Script
 
A Domino Admins Adventures (Engage 2024)
A Domino Admins Adventures (Engage 2024)A Domino Admins Adventures (Engage 2024)
A Domino Admins Adventures (Engage 2024)
 
Handwritten Text Recognition for manuscripts and early printed texts
Handwritten Text Recognition for manuscripts and early printed textsHandwritten Text Recognition for manuscripts and early printed texts
Handwritten Text Recognition for manuscripts and early printed texts
 
The 7 Things I Know About Cyber Security After 25 Years | April 2024
The 7 Things I Know About Cyber Security After 25 Years | April 2024The 7 Things I Know About Cyber Security After 25 Years | April 2024
The 7 Things I Know About Cyber Security After 25 Years | April 2024
 
Bajaj Allianz Life Insurance Company - Insurer Innovation Award 2024
Bajaj Allianz Life Insurance Company - Insurer Innovation Award 2024Bajaj Allianz Life Insurance Company - Insurer Innovation Award 2024
Bajaj Allianz Life Insurance Company - Insurer Innovation Award 2024
 
Exploring the Future Potential of AI-Enabled Smartphone Processors
Exploring the Future Potential of AI-Enabled Smartphone ProcessorsExploring the Future Potential of AI-Enabled Smartphone Processors
Exploring the Future Potential of AI-Enabled Smartphone Processors
 
Artificial Intelligence: Facts and Myths
Artificial Intelligence: Facts and MythsArtificial Intelligence: Facts and Myths
Artificial Intelligence: Facts and Myths
 
CNv6 Instructor Chapter 6 Quality of Service
CNv6 Instructor Chapter 6 Quality of ServiceCNv6 Instructor Chapter 6 Quality of Service
CNv6 Instructor Chapter 6 Quality of Service
 
What Are The Drone Anti-jamming Systems Technology?
What Are The Drone Anti-jamming Systems Technology?What Are The Drone Anti-jamming Systems Technology?
What Are The Drone Anti-jamming Systems Technology?
 
Apidays Singapore 2024 - Building Digital Trust in a Digital Economy by Veron...
Apidays Singapore 2024 - Building Digital Trust in a Digital Economy by Veron...Apidays Singapore 2024 - Building Digital Trust in a Digital Economy by Veron...
Apidays Singapore 2024 - Building Digital Trust in a Digital Economy by Veron...
 
TrustArc Webinar - Stay Ahead of US State Data Privacy Law Developments
TrustArc Webinar - Stay Ahead of US State Data Privacy Law DevelopmentsTrustArc Webinar - Stay Ahead of US State Data Privacy Law Developments
TrustArc Webinar - Stay Ahead of US State Data Privacy Law Developments
 
[2024]Digital Global Overview Report 2024 Meltwater.pdf
[2024]Digital Global Overview Report 2024 Meltwater.pdf[2024]Digital Global Overview Report 2024 Meltwater.pdf
[2024]Digital Global Overview Report 2024 Meltwater.pdf
 
Evaluating the top large language models.pdf
Evaluating the top large language models.pdfEvaluating the top large language models.pdf
Evaluating the top large language models.pdf
 
ProductAnonymous-April2024-WinProductDiscovery-MelissaKlemke
ProductAnonymous-April2024-WinProductDiscovery-MelissaKlemkeProductAnonymous-April2024-WinProductDiscovery-MelissaKlemke
ProductAnonymous-April2024-WinProductDiscovery-MelissaKlemke
 
Boost Fertility New Invention Ups Success Rates.pdf
Boost Fertility New Invention Ups Success Rates.pdfBoost Fertility New Invention Ups Success Rates.pdf
Boost Fertility New Invention Ups Success Rates.pdf
 
2024: Domino Containers - The Next Step. News from the Domino Container commu...
2024: Domino Containers - The Next Step. News from the Domino Container commu...2024: Domino Containers - The Next Step. News from the Domino Container commu...
2024: Domino Containers - The Next Step. News from the Domino Container commu...
 
04-2024-HHUG-Sales-and-Marketing-Alignment.pptx
04-2024-HHUG-Sales-and-Marketing-Alignment.pptx04-2024-HHUG-Sales-and-Marketing-Alignment.pptx
04-2024-HHUG-Sales-and-Marketing-Alignment.pptx
 
Presentation on how to chat with PDF using ChatGPT code interpreter
Presentation on how to chat with PDF using ChatGPT code interpreterPresentation on how to chat with PDF using ChatGPT code interpreter
Presentation on how to chat with PDF using ChatGPT code interpreter
 
Powerful Google developer tools for immediate impact! (2023-24 C)
Powerful Google developer tools for immediate impact! (2023-24 C)Powerful Google developer tools for immediate impact! (2023-24 C)
Powerful Google developer tools for immediate impact! (2023-24 C)
 
Raspberry Pi 5: Challenges and Solutions in Bringing up an OpenGL/Vulkan Driv...
Raspberry Pi 5: Challenges and Solutions in Bringing up an OpenGL/Vulkan Driv...Raspberry Pi 5: Challenges and Solutions in Bringing up an OpenGL/Vulkan Driv...
Raspberry Pi 5: Challenges and Solutions in Bringing up an OpenGL/Vulkan Driv...
 

Gutell 112.j.phys.chem.b.2010.114.13497

  • 1. Coarse-Grained Model for Simulation of RNA Three-Dimensional Structures Zhen Xia,† David Paul Gardner,‡,§ Robin R. Gutell,‡,§ and Pengyu Ren*,†,§ Department of Biomedical Engineering, Section of IntegratiVe Biology and Center for Computational Biology and Bioinformatics, and Institute for Cellular and Molecular Biology, The UniVersity of Texas at Austin, Texas 78712, United States ReceiVed: May 28, 2010; ReVised Manuscript ReceiVed: August 31, 2010 The accurate prediction of an RNA’s three-dimensional structure from its “primary structure” will have a tremendous influence on the experimental design and its interpretation and ultimately our understanding of the many functions of RNA. This paper presents a general coarse-grained (CG) potential for modeling RNA 3-D structures. Each nucleotide is represented by five pseudo atoms, two for the backbone (one for the phosphate and another for the sugar) and three for the base to represent base-stacking interactions. The CG potential has been parametrized from statistical analysis of 688 RNA experimental structures. Molecular dynamic simulations of 15 RNA molecules with the length of 12-27 nucleotides have been performed using the CG potential, with performance comparable to that from all-atom simulations. For ∼75% of systems tested, simulated annealing led to native-like structures at least once out of multiple repeated runs. Furthermore, with weak distance restraints based on the knowledge of three to five canonical Watson-Crick pairs, all 15 RNAs tested are successfully folded to within 6.5 Å of native structures using the CG potential and simulated annealing. The results reveal that with a limited secondary structure model the current CG potential can reliably predict the 3-D structures for small RNA molecules. We also explored an all-atom force field to construct atomic structures from the CG simulations. Introduction The importance of RNA has been appreciated since the central dogma was proposed in 1958.1,2 Three RNA molecules, mRNA (mRNA), tRNA (tRNA), and rRNA (rRNA), are associated with the cell’s transcription of its DNA into RNA and then translated into proteins.3 While experiments as early as 1971 suggested that RNA is involved in catalysis during protein synthesis,4-6 experiments starting in 1982 confirmed that RNA is directly involved in catalysis, in many different RNA systems with difference chemical reactions.4,7-15 These RNAs form complex three-dimensional structures.16-33 Within the past few years, a large increase in the number of RNAs that form higher structure, associated with numerous functions in the cell, is the foundation for a major paradigm shift in the molecular biology of the cell; RNAs that do not code for proteins are directly associated with the regulation and overall function of the cell,34-44 including different cancers.45-47 Since more than 90% of the human genome is transcribed into RNAs that do not code for proteins,48,49 and the function of an increasing amount of this RNA is now being determined, the prediction of an RNA higher-order structure and its dynamics will provide great insight into the RNA’s contribution to the structure and function of a cell. Toward that end, computational approaches such as molecular modeling have made significant contributions to the understanding of three-dimensional struc- tures and chemical principles of RNA.50-60 The most successful approaches for protein structure prediction so far have been based on comparative analysis or reduced models derived from known structures.61-63 In recent years, increased effort has been devoted to RNA structure prediction as more and more RNA structures have been determined experimentally. A range of models have been developed for nucleic acids, from fully atomistic models to reduced representations.64-67 For example, a knowledge-based atomic energy function has been introduced to predict RNA tertiary structures in the FARNA package.68 Nucleotide cyclic motifs are used in MC-Fold and MC-Sym models to build RNA structure from sequence data.69 These two models seem suc- cessful in predicting the tertiary structure of small RNA molecules. In addition, physics-based atomic force fields such as AMBER70-73 and CHARMM74-76 describe the dynamic atomic interaction following traditional molecular mechanics, with parameters derived by fitting to ab initio quantum mechan- ics calculations and experimental data. It is now feasible with supercomputers to simulate dynamic biological systems as large as an entire virus in atomic detail.77 However, typical applica- tions of the atomistic force fields are usually limited to small oligomers of nucleic acids or routine simulation times on the order of a few nanoseconds.78 On the other hand, coarse-grained (CG) methods reduce the number of particles and eliminate high- frequency motions in the system. A CG model enlarges the time step in molecular dynamics simulations while also enhancing intrinsically faster dynamics.79-81 Several CG approaches, either knowledge or physics based, have been utilized to study the structures of nucleic acids.68,69,78,82-106 There has been a history of modeling DNA at meso- scale.65,78,82-84,86-89,92-97,99,105 Recently, studies such as Knotts IV and co-workers successfully predicted several important DNA behaviors, like salt-dependent melting, bubble formation, and rehybridization, with a CG model that uses three interaction sites for phosphate, sugar, and base, respectively.78 For RNA, * Corresponding author. Tel.: (512) 232-1832. Fax: (512)-471-0616. E-mail: pren@mail.utexas.edu. † Department of Biomedical Engineering. ‡ Section of Integrative Biology and Center for Computational Biology and Bioinformatics. § Institute for Cellular and Molecular Biology. J. Phys. Chem. B 2010, 114, 13497–13506 13497 10.1021/jp104926t  2010 American Chemical Society Published on Web 09/30/2010
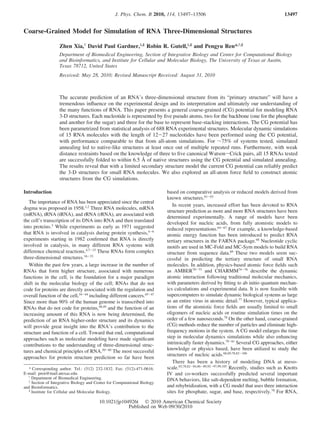
  • 2. Malhotra et al. first introduced a reduced potential to refine the 3-D structure of low-resolution rRNAs.52,59 Zhang et al. combined a highly reduced coarse-grained model and a Monte Carlo method to simulate the distribution of viral RNA inside the capsid of cowpea chlorotic mottle virus.100 In these works, each nucleotide was modeled as one bead to reduce the complexity of large RNAs. Cao et al. developed a reduced chain representation model to predict RNA folding thermodynamics based on a statistical mechanical theory.101 The RNA molecules were represented by their backbone, and two beads (phosphate and sugar) were used for each nucleotide. Later, Jonikas et al. integrated a coarse-grained model with knowledge-based po- tentials to generate plausible three-dimensional structures.107 Despite the development, automated programs for predicting RNA 3-D structures and their dynamic properties are required to increase their accuracy and robustness.108 In addition, the coarse-grained RNA potentials are mostly aimed at structural refinement rather than predicting dynamics properties. Aside from the energy or scoring function, the configuration searching and sampling methods are also important components of the structure prediction algorithms. The MC-Fold/MC-Sym and FARNA programs begin by generating structures from small RNA fragments with a few residues. Then, Las Vegas or Monte Carlo sampling is performed to generate a sampling of possible tertiary structures of the entire RNA.68,69 NAST utilizes MD simulations, combined with secondary structure information, to generate 3-D structure candidates for the RNA molecules.107 A coarse-grained (C3′-based one-bead CG model) energy function derived from the structural statistics is applied in the MD simulation. The ranking of structural clusters can be based on the NAST energy function or experimental data (solvent accessibility data from the hydroxyl radical foot printing). Herein we present an “intermediate” coarse-grained potential for modeling RNA 3-D structure using molecular dynamics. Previous CG RNA models typically used one52,100,107 or two101 particles for each nucleotide. To optimize the efficiency and accuracy, we developed a model that represents each nucleotide with five pseudo atoms: two of these represent the backbonesone for the sugar and the other for the phosphateswhile three pseudo atoms represent the stacking and base pairing for each base. The analytical potential energy functional forms, parametrization with 3-D structural statistics obtained from experimental structures and initial validation using molecular dynamics simulations of selected RNAs, are discussed. Experimental Methods Data Collection and Preparation. The CG potential was parametrized using statistics collected from available three- dimensional structures of RNA molecules (including both X-ray diffraction structures and nuclear magnetic resonance structures). The RNA structure files were downloaded from The Protein Data Bank (http://www.pdb.org/), Nucleic Acid Database (http:// ndbserver.rutgers.edu/index.html), RNA Comparative Analysis Database (rCAD, http://rcat.codeplex.com/, manuscript submit- ted), and the Comparative RNA Web (CRW) site109 (http:// www.rna.ccbb.utexas.edu/). Only 668 structure files that con- tained more than five base pairs and have the resolution records were analyzed for the statistical calculation. All of the coordi- nates obtained from nuclear magnetic resonance (NMR) struc- tural files were included in the statistical calculations. Coarse-Grained RNA Interaction Potential. In our CG model, each nucleotide is reduced to five pseudo atoms in RNA (Figure 1). Two of the five pseudo atoms represent phosphate and sugar, respectively, which is the minimum requirement to capture the backbone tertiary structures of RNA.110 Each base (A, G, C, and T) is represented by three pseudo atoms, connected by three virtual bonds into a triangle. Compared to earlier models with one particle for each base or each residue,78,107 the use of three pseudo atoms for each base provides us with better ability to capture the stacking and pairing of bases. As the different bases share some common pseudo atoms, nine unique types of pseudo atoms are needed to represent the four canonical RNA component bases in total (Figure 1). The improvement in computational efficiency arises from the reduction of number of particles and larger particle mass that enables a greater integration time step in molecular dynamics. The topological and physical properties of the pseudo atoms are listed in Table 1. The corresponding CG potential energy is calculated by where Ebonded and Enonbonded are pairwise bonded and nonbonded energy terms, each representing the sum of contributions of all pairs in the system. The bonded term is further decomposed into where Ebond, Eangle, and Edihedral are the bond stretching, angle- bending, and dihedral energies, respectively. In classical molecular mechanics, the nonbonded interaction consists of the van der Waals (VDW) and electrostatic contribu- tions. Since our CG model is derived from the 3-D structural statistics of experimental structures, an effective potential is used to represent the potential of mean force of all the nonbonded interactions, including the excluded volume repulsive, the attractive force, and the electrostatic force between nonbonded particles, as well as the solvation forces due to the environment. A Buckingham potential is utilized to describe the effective potential (see eq 9). For each term, the parametrization was performed based on the Boltzmann inversion of the corresponding atomistic distribution functions obtained from the experimental structures. The Boltz- mann inversion method performs a potential inversion from a set of known distributions of structural parameters to extract effective CG potentials. In our RNA CG system, the potentials calculated from the Boltzmann inversion method111,112 need to reproduce the distribution of structural parameters including 14 different bonds, 25 types of angles, 28 dihedral angles, and 19 intermolecular radial distribution functions extracted from statistical results of all available atomistic RNA structures (please see Tables 2-5 for more details). All the parameter- fitting works were performed with the software of Matlab Curve Fitting Tool. Bond Stretching. The distribution of bond lengths can be represented by the Gaussian function, which is calculated by where b, b0, and σ are the parameters obtained through fitting; kB is the Boltzmann factor; and T is absolute temperature. Taking Etotal ) Ebonded + Enonbonded (1) Ebonded ) Ebond + Eangle + Edihedral (2) Enonbonded ) Eeffective potential (3) P(l) ) 1 √2πσ e-(b - b0)2/2σ2 ) e-Estretch/kBT (4) 13498 J. Phys. Chem. B, Vol. 114, No. 42, 2010 Xia et al.
  • 3. the logarithm of both sides of eq 4 and dropping the constant term, after performing Boltzmann inversion, we have where the temperature, T, is set to be 298 K. Angle Bending. The distributions of bond angles can be weighted by a factor sin(θ) and renormalized by a factor Zn. The normalized distribution is expressed as where θ is the angle between neighboring bonds, while P(θ) and p(θ) are normalized and un-normalized distribution func- tions of θ. The distributions of bond angles between CG bonds were also fitted with the Gaussian function, and then the Boltzmann inversion was used to calculate Eangle. Dihedral Rotation. As in atomic force fields, the tensional energy takes the formula of Figure 1. (a) Schematic representation of the CG model for RNA. Phosphate and sugar are represented as one CG particle. The bases A, G, C, and U are represented as three CG particles for each. (b) The components of each CG base. The base is divided by the red dashed line. (c) Schematic representation of all-atom RNA backbone. TABLE 1: Properties of Nine CG Particles number CG particle name mass (amu) bond connections 1 P 94.970 2 2 S 97.054 3 3 CG 53.022 3 4 N6 42.030 2 5 N2 54.030 2 6 O6 43.014 2 7 O2 42.006 2 8 CU 26.016 3 9 CA 39.015 2 Ebond ) kBT 2σ2 (b - b0)2 ) Kbond(b - b0)2 (5) P(θ) ) Znp(θ)/sin(θ) ) e-Ebend/kBT (6) TABLE 2: Bond Stretching Interaction Parameters for the CG Model of RNA Fitted by the Gaussian Function and Obtained From Statistical Structures bond b0 Kbond 1-2 3.85 11.12 2-3 3.74 9.79 2-8 3.61 10.89 3-4 4.29 57.70 3-5 5.66 51.66 3-6 4.28 44.60 3-9 4.33 109.19 4-7 4.55 44.00 4-8 3.59 124.29 4-9 3.53 93.79 5-6 4.57 37.14 6-7 4.53 57.10 6-8 3.55 89.85 7-8 3.52 82.87 Eangle ) kBT 2σ2 (θ - θ0)2 ) Ka(θ - θ0)2 (7) CG Model for Simulation of RNA 3-D Structures J. Phys. Chem. B, Vol. 114, No. 42, 2010 13499
  • 4. where φ is the dihedral angle and Kn and δn (n ) 1, 2, 3) are force constants and phase angles. The Edihedral was also obtained from performing Boltzmann inversion. Nonbonded Interactions. A Buckingham potential,113 con- sisting of a 6 term and an exponential term, is used to represent the potential of mean force between a pair of nonbonded atoms, i and j where εij is the depth of the potential well; σij is the radius; and rij is the distance between a pair of atoms. Note that the above equation is used to describe the potential of mean force even though the symbol “E” and the formula are commonly used to represent potential energy. The constants we used here are the same as the MM3 force field.85,114-116 We use the pair-specific ε and σ parameters instead of the combing rule for unlike atom pair i and j. The Lennard-Jones (LJ) 6-12 potential and Buckingham potential fitted to the nonbonded interactions at the onset were generated. The Buckingham function is “softer” than the LJ 6-12 function in the repulsive region because the exponential term is more suitable to represent the nonbonded potentials in our CG model. However, as shown in Figure S3 (Supporting Information), even the Buckingham potential is not “soft” enough. In addition, some of the interactions (e.g., N2-N2) clearly show a second or more local minima which are ignored by the Buckingham potential. The complicated shape of the nonbonded potentials can be captured much more accurately by using the spline interpolation functions as in the previous statistical potentials for proteins.117 However, in the current study, we would like to explore the capability of the simple Buckingham potential that is implemented in almost all popular molecular modeling packages. In nonbonded potential fitting, we have chosen to primarily reproduce the global energy minima by using a weighted least-squares fit. The data points in the minimum energy area (0.5 Å within the TABLE 3: Bond Angle Interaction Parameters for the CG Model of RNA Fitted by the Gaussian Function and Obtained from Statistical Structures angle θ0 Ka 1-2-1 102.78 1.356 1-2-3 101.75 5.271 1-2-3′ a 75.89 1.864 1-2-8 100.79 9.115 1-2-8′ 74.40 2.386 2-1-2 106.18 2.040 2-3-4 154.72 7.130 2-3-5 104.12 12.734 2-3-6 153.94 8.162 2-3-9 108.78 10.611 2-8-4 163.79 6.794 2-8-6 163.79 6.794 2-8-7 88.99 15.930 3-4-9 66.45 35.882 3-5-6 79.38 16.156 3-6-5 48.06 21.701 4-3-9 48.33 49.428 4-7-8 49.44 24.490 4-8-7 79.78 29.398 4-9-3 65.22 17.290 5-3-6 52.57 50.065 6-7-8 50.54 38.613 6-8-7 79.46 31.109 7-4-8 50.84 29.033 7-6-8 49.98 30.600 a The prime in the table indicates the atom comes from its neighbor residue. TABLE 4: Optimized CG Parameters for Nonbonded Interaction Described by Equation 9, Including Similar and Unlike Pairs of CG Atoms CG atoms σ (initial) ε (initial)a σ (final) ε (final)b P-P 11 0.287 11.2778 0.1503 S-S 11.7 0.3827 12.1544 0.4162 C-C 4.4 0.8851 4.1836 0.9276 N6-N6 3.1 1.3875 3.4604 1.4312 N2-N2 4.8 1.1004 4.7928 1.1603 O6-O6 3.1 1.4354 3.7784 1.4635 O2-O2 4.9 1.0526 4.8614 1.0846 C-N6 5.1 0.6698 5.2158 0.3818 O6-O2 5.2 1.0526 5.4321 1.2972 N2-O2 2.8 1.9138 2.7974 2.0524 C-O6 5.2 0.8373 5.26 0.6972 C-O2 3.5 0.909 3.6176 0.8886 N6-O6 2.85 1.866 3.0427 1.8562 C-N2 4.25 0.8373 4.3342 0.8527 N6-O2 5.3 0.7416 5.6477 0.7942 N6-N2 5.3 1.232 5.3832 1.0547 O6-N2 5.4 0.7416 5.5622 0.5273 P-S 9.4 0.5263 9.4287 0.054 S-C 5.6 0.5502 5.615 0.5856 a Columns σ (initial) and ε (initial) are the nonbonded parameters obtained from statistical potential of mean force. b Columns σ (final) and ε (final) are the nonbonded parameters obtained after the optimization. Edihedral(φ) ) ∑ n)1 3 Kn[1 + cos(nφ - δn)] (8) TABLE 5: Optimized CG Parameters for the Dihedral Interaction Term Described by Equation 8 torsion V1 δ1 V2 δ2 V3 δ3 1′-2-3-4a 3.354 120 -0.606 180 -0.068 120 1′-2-3-9 3.801 120 0.383 180 -0.287 120 1-2-1′-2′ 1.358 0 0.944 180 0.574 0 1-2-3-4 2.964 15 -0.099 180 -0.247 15 1′-2-3-5 3.603 120 1.167 180 -0.325 120 1-2-3-5 3.768 0 0.52 180 0.581 0 1′-2-3-6 3.409 120 -0.265 180 -0.226 120 1-2-3-6 3.077 30 0.306 180 0.246 30 1-2-3-9 3.299 15 0.634 180 -0.204 15 1′-2-8-4 3.461 120 -0.617 180 0.294 120 1-2-8-4 3.321 30 1.121 180 -0.156 30 1′-2-8-6 2.737 120 -0.666 180 0.148 120 1-2-8-6 2.51 30 0.518 180 -0.17 30 1′-2-8-7 3.304 120 1.349 180 -0.342 120 1-2-8-7 3.844 0 0.567 180 0.534 0 2-1-2′-1′ -1.626 135 -0.113 180 -0.246 135 2′-1′-2-3 -1.661 60 0.455 180 0.311 60 2′-1-2-3 1.387 120 0.898 180 -0.516 120 2′-1′-2-8 -1.531 45 0.489 180 0.686 45 2′-1-2-8 1.38 135 0.908 180 -0.691 135 2-3-4-9 7.114 150 -2.4 180 0.516 150 2-3-5-6 -3.328 120 0.95 180 0.101 120 2-3-6-5 5.639 150 -2.063 180 -0.009 150 2-3-9-4 2.959 15 -1.022 180 0.666 15 2-8-4-7 5.024 165 -1.509 180 -1.807 165 2-8-6-7 4.756 165 -1.037 180 -1.455 165 2-8-7-4 -4.072 150 0.544 180 -0.144 150 2-8-7-6 3.51 0 0.425 180 0.457 0 a The prime in the table indicates the atom comes from its neighbor residue. Enonbonded ) εij[-2.25(σij/rij)6 + 1.84 × 10⁵ e-12.00(rij/σij) ] (9) 13500 J. Phys. Chem. B, Vol. 114, No. 42, 2010 Xia et al.
  • 5. potential minimum) were assigned a weight of two and the others one. The final fitting results are shown in Figure S3 in the Supporting Information. As discussed in the Results and Discussion section, a nonlinear optimization was later performed on the nonbonded parameters, after all bonded and nonbonded parameters in the CG model were obtained, by minimizing the root-mean-square deviation (rmsd) between the energy-mini- mized and the experimental structures of selected RNAs. The experimental structures were analyzed to generate the radial distribution functions (RDF) or g(r) for selected pairs of coarse- grained particles (Table 4). The set of 1-2 (directly bonded), 1-3 (separated by two bonds), and 1-4 (separated by three bonds) pairs was not included in RDF calculations. Then the potential of mean force, which corresponds to the Boltzmann inversion of the g(r), is determined from the RDF By combining eqs 9 and 10, we determine the initial values of ε and σ for each pair. We have also combined certain pairs (the same parameters were used) based on the similarity of the RDF obtained. Simulation Details. Fifteen different RNA molecules were selected for molecular dynamics simulations using the developed CG potential. For comparison, all-atom simulations were performed on the same set of RNAs using the amber99sb force field with explicit and implicit solvent in AMBER10.70,72,118 For the explicit solvent simulations, the TIP3P water model was used.119,120 The Particle Mesh Ewald (PME) method121,122 was applied to treat the long-range electrostatic interactions, and a 12 Å cutoff was employed for the van der Waals interactions. After the RNA was solved in the water box, 150 mM/L Na+ ions were added to the box, and then the Cl- ions were added to neutralize the whole system. All the RNA systems were equilibrated with a 5000-step energy minimization to remove the bad contacts. Then, the minimized configurations were used as the starting point for a 1 ns NPT molecular dynamics equilibration at 1 atm and 298 K. For the implicit solvent simulations, the Generalized-Born/Surface Area (GB/SA) model was used.123-128 The salt concentration was also 150 mM/L in implicit solvent systems. The time step for all production runs was 1 fs. The CG model molecular dynamics simulations were performed via the modified Beeman algorithm with the TINKER software package.129 Different time steps (1 to 10 fs) were tested in the CG MD simulations. The normal simulation time for all systems was 10-100 ns. Simulated annealing MD simulations were performed to fold 15 RNA molecules. In the simulated annealing, after the energy minimization and 2000 steps of equilibrium, the systems were heated to 1000 K within the first 2000 steps and then gradually cooled down to room temperature (298 K) over 100 ns with a linear schedule. For each RNA molecule, we performed five independent simulated annealing simulations starting with random seeds. Finally, we performed another three independent 100 ns simulated annealings under restraints set by the known secondary structure (Watson-Crick base pairs only). A flat-welled harmonic potential (also known as the Nuclear Overhauser Effect potential) was used to restrain the distance between the pseudo atoms CG and AU (Figure 1) in the canonical Watson-Crick base pairs with lower and upper bounds of 8.0 and 10.0 Å, respectively. The force constant for the harmonic potential is zero when the distance falls within the bounds and 0.5 kcal/Å2 beyond the bounds. Results and Discussion Determination of the RNA Coarse-Grained Model Pa- rameters. The probability distribution of all virtual bonds, angles, and torsions (shown in the Supporting Information) was used to fit the valence parameters using eqs 4-8. The fitted parameters for virtual bonds, angles, and torsions are given in Table 2, Table 3, and Table 5, respectively. The force constants of bonds and angles for pseudo atoms are smaller than those of atomic bonds and angles, meaning a larger time step could be used during the MD simulations in the CG model. As expected, the larger force constants of bonds and angles within the base make the bases fairly stiff (Table 2 and Table 3). However, they are still smaller than those of atomic constants by a factor of 3-10. The nonbonded parameters in eq 9 were obtained by mapping the radial distribution functions (RDFs) of all the pseudo atoms in existing RNA structures where nij(r) is the number of pairs in the given shell from r to r + dr; Ni is the total number of particle I in the system; and d is the mean bulk density of particle j. The reference state here is the expected number of contacts when two pseudo atoms i and j are at long distance, which is approximated as the average density of pseudo atoms j.130 Therefore, the g(r) could be normalized to 1 at long distance. The results from g(r) are plugged into eq 10 to get the potential of mean force, which is approximated to be the effective potential function of r. The effective potential functions are shown in the Supporting Information. The best fitting results for each type of CG atom are summarized in Table 4. Optimization of the Nonbonded Parameters. The RNA structural statistics we utilized to derive the nonbonded and bonded parameters effectively include contributions from all energy terms, although to different extents. For example, the actual conformational distribution is affected by both the torsion and nonbonded energy terms in the CG potential. To remove the “redundancy”, we directly compared the structures given by the coarse-grained potential with the experimental structures and adjusted the parameters. Since the RNA structure is most sensitive to the nonbonded interaction, we refined the nonbonded parameters using seven RNA molecules with diverse secondary and tertiary structures. The nonbonded parameters were refined by minimizing the difference between the energy-minimized CG structures and their corresponding experimental structures. First, energy minimization was performed on each of the seven RNA molecules, and the structural rmsd from the experimental structure was calculated based on all pseudo atoms. The average of the rmsd over the seven molecules is used as the target function in the optimization of the nonbonded parameters. An optimally conditioned variable metric nonlinear optimization algorithm in TINKER was utilized.129,131-133 The first derivative of the average rmsd with respect to each nonbonded parameter was calculated numerically. In total, 38 nonbonded parameters were optimized (Table 4). The average rmsd between the experimental and energy-minimized structures dropped from 3.35 to 1.75 Å by using the optimized nonbonded parameters. Validation of the Coarse-Grained Model. We have vali- dated the CG potential in two sets of simulations. First, molecular dynamics simulations of the native RNA structures were performed at room temperature to examine the rmsd Enonbonded(r) ) -kBT ln g(r) (10) gij(r) ) 1 Nidj nij(r) 4πr2 δr (11) CG Model for Simulation of RNA 3-D Structures J. Phys. Chem. B, Vol. 114, No. 42, 2010 13501
  • 6. fluctuation. Second, simulated annealing molecular dynamics simulations were applied to fold the RNA structures, with and without restraints set by the secondary structure information. Fifteen RNA molecules with high quality experimental structures were chosen for the model validation (Table 6). These RNAs represent common RNA structural motifs, such as a helix with and without noncanonical base pairs, hairpins, internal loops, bulges, and pseudoknots. The results of the regular room-temperature MD simulations are given in Table 6. The rmsd’s for both the coarse-grained and all-atom model were calculated as an average over the MD trajectories using the same atom set of five pseudo atoms for better comparison. One base pair at each of the terminals is ignored in all the rmsd calculations unless specified otherwise. The 15 RNA molecules investigated had an overall average rmsd with the CG model (3.36 Å). This is similar to the all-atom implicit solvent model (3.30 Å). The all-atom MD simulation with explicit solvent was even closer to the experimental structure, with an average rmsd of 2.21 Å. The rmsd for the CG model (1.66 Å) performed slightly better than the all-atom explicit solvent simulation (2.21 Å) for an A-form helix with canonical Watson-Crick base pairs only. Figure 2a shows the superposition of the native structure (1QCU) and the last frame of 10 ns CG MD simulation. The backbone is well preserved by the CG MD in 1QCU, as well as the base pair and base stacking interactions. As expected, somewhat larger rmsd’s have been observed at the 5′ and 3′ terminals of the double helix in both CG and all-atom MD simulations of 1QCU, consistent with the assumption that the lack of base stacking interactions and neighboring base-pair connections would decrease the stabilities of the helix terminals. The frameshifting RNA pesudoknot from beet western yellow virus (PDB ID: 1L2X) is a single chain with coaxial helices connected with two loops.134 The superposition of the native X-ray structure and the last frame of 10 ns MD CG simulation are shown in Figure 2b. The backbone is well represented in the CG model. The average rmsd of the CG model (2.84 Å) is quite similar to those given by the all-atom simulations using implicit (2.89 Å) and explicit solvent (2.73 Å). Both the all- atom model and the CG model showed a larger fluctuation for noncanonical Watson-Crick base pairs in 1L2X during the MD simulations. The observed unpaired bases which belong to the loops moved back and forth along the direction perpendicular to the backbone, which may play an important role in forming tertiary contacts. Among the 15 test RNAs, the largest rmsd (4.75 Å) was observed for 1LNT.135 1LNT is a 24-nt double-strand helix with a 5×5 nt interior loop. The superposition of the native X-ray structure and the final snapshot of MD simulation (Figure 2c) show that the large rmsd is mostly due to the base atoms and two terminals. The bases within the interior loop are much more flexible and disordered than base forming Watson-Crick base pairs. It is not surprising that the current CG model has difficulty in capturing them, given that RNA structures in the parametriza- tion set are dominated by canonical Watson-Crick base pairs. How well the MD simulations preserve the native structure is only a minimal check of the coarse-grained potential. It is more interesting and challenging to see if the CG potential can be used to “predict” RNA folds. The “folding” of RNA molecules by the CG model was examined by 100 ns simulated annealing molecular dynamics. In this process, the RNA molecule was denatured by being quickly heated to a temper- ature of 1000 K. With the system temperature gradually (over 100 ns) cooled back down to 298 K, the RNA molecules were expected to fold back to their native or native-like conforma- tions. We have performed five independent simulated annealing runs for each of the 15 RNAs. The final conformations were checked by comparing the structure of the last snapshot of trajectory to its native structure. The minimum and average rmsd’s among the five repeats are given in Table 7. The results indicated that ∼75% of RNAs fold back to their native-like structures (final all-pseudoatom rmsd < 6.5 Å) at least once among the five repeats. Examples of the simulation snapshots and the final annealed structures of 1ZIH (rmsd ) 3.8 Å) and 353D (rmsd ) 6.3 Å) could be found at Figure 3b and Figure 3d, respectively. Due to the limited sampling capability of the simulated annealing method, the RNA molecule is very likely to be trapped into a local minimum. For instance, all five simulated annealing repeats of the 1L2X (contains a pseudoknot) failed to fold back to its right coaxial structures and were stuck in different local minima. Another possible reason is a lack of chemical details in our energy potential function. The stability of some RNA tertiary motifs such as pseudoknots is highly dependent on the solvation environment and metal ion concen- tration, especially the magnesium hydration effect.136 Here we discuss in detail three RNAs that were successfully folded by the simulated annealing MD simulations, a hairpin, 1ZIH,137,138 and two helices: 353D139 and 1DQF.140 1ZIH is a 12-ntsinglestrandRANhairpincappedbyaGCAAtetraloop.138,141 The GCAA tetraloop belongs to the GNRA tetraloop family (N is A, C, G, or U; R is A or G)142 which is a basic building block of RNA structure that often provide sites for tertiary contacts or protein binding.50,142-145 At the beginning of an- nealing, the RNA was completely denatured due to the heating, showing a rmsd of about 10 Å (Figure 3a and 3b). The structure became stable after 70 ns, and the rmsd’s dropped to ∼3.8 Å when the temperature slowly decreased to 400 K (Figure 3b). Similar behavior was observed in the annealing of two A-form helices, 353D (Figure 3d) and 1DQF. 353D contains two U-G Wobbles, and 1DQF contains a bulge residue. Both rmsd’s converged to ∼4.5 Å at the end of the annealing (Figure 3a). Overall, the successes demonstrate that the CG potential is very promising for ab initio prediction of small RNA tertiary structure from sequence alone. TABLE 6: Comparison of All-Atom Average rmsd’s from the Native Crystal Structures for Both the CG Model and the Full-Atom Modelsa rmsd (Å) PDB ID CG model full-atom implicit water model (amber99sb ff) full-atom explicit water model (amber99sb ff) 157D 3.644 5.609 2.260 1DQF 2.478 3.274 1.935 1I9X 3.236 3.956 1.780 2JXQ 2.536 2.940 1.800 2K7E 3.675 4.560 3.560 353D 3.483 2.802 3.583 472D 3.137 2.467 1.500 1F5G 4.425 2.950 1.800 1KD3 4.570 3.740 2.560 1L2X 2.840 2.890 2.730 1LNT 4.751 2.610 1.880 1QCU 1.669 2.560 2.210 1ZIH 3.532 3.180 2.010 2AO5 3.326 2.090 1.350 1AL5 3.080 3.770 2.210 average 3.359 3.293 2.211 a All rmsd’s were obtained from all CG atoms (full-atom calculation using the same atom set as the CG model). 13502 J. Phys. Chem. B, Vol. 114, No. 42, 2010 Xia et al.
  • 7. We have examined the possibility of further refining the CG structures from the simulated annealing by mapping the structures to the corresponding all-atom models and performing all-atom MD simulations. The last frames from the 100 ns simulated annealing simulation of 1ZIH and 353D with rmsd’s around 5 Å were taken to generate the initial coordinates for the subsequent all-atom simulations using AMBER10. The all- atom structures were reconstructed from the CG structures via the following steps (please refer to Figure 1c for the atomic labels). (1) The planar all-atom bases were placed based on the three pseudo particles in the CG bases (Figure 1). The C1′ atom, which lies in the base plane, was constructed by extending from the N atom in the bases. Equilibrium bond and angle values from the amber99sb force field were used in constructing the atomic coordinates relative to each other. (2) The CG backbone particles P and S were turned into P and C4′ in the all-atom model. The backbones O5′ and C5′ were placed along the vector connecting P and C4′ with the P-O5′ and O5′-C5′ bond lengths to set to be one-third of the P-C4′ distance. Similarly, O3′ and C3′ were placed between C4′ and P in the opposite direction. The other two O atoms connecting to P were placed in the plane orthogonal to O3′-P-O4′. (3) The O4′ in the sugar ring was placed such that it lied in the plane of C3′-C4′- O4′-C1′. Using the C4′-O4′-C1′ as the anchor, the sugar ring (including directly bonded peripheral atoms) in a flat conforma- tion was then constructed. Note that in this new structure C5′ and C3′ were moved out of the C4′-P vector. (4) The all-atom structure was then relaxed via AMBER energy minimization, while the five atoms directly transferred from the CG model (three base atoms, P, and C4′) were constrained to the CG coordinates. The resulting all-atom structures were subjected to a 20 000-step energy minimization without constraints followed by a 20 ns MD simulation with the amber99sb force field and GB/SA implicit solvation model. For hairpin 1ZIH, the overall rmsd’s dropped slightly from ∼5.5 to 5 Å. However, the backbone structure of 1ZIH was significantly improved as the rmsd was reduced from 5.4 to 3.65 Å. The detailed base orientations in the GCAA loop could be seen in Figure 3c, which shows the superposition of the final conformation and native structure of the tetraloop. The GCA bases were stacked on top of each other instead of the CAA base stacking in native structure with ∼60° rotation. The rotation or flipping of the GNRA bases, similar to the U-turn motif,16,33,146 was observed in early studies by NMR analysis and other all-atom molecular dynamic simulations.138,147 The flipping of some of the bases toward the solvent in a tetraloop allows those bases to interact with other RNAs and proteins. For 353D, both all-atom rmsd’s and backbone rmsd’s remained mostly unchanged after the all- atom refinement. One possible reason is that the final structure of CG simulated annealing may be trapped in a local minimum, and the 20 ns all-atom simulation was not able to allow the helix to relax and rearrange into the native structure. The results indicate that the multistage approach is useful for construction and refinement of all-atom structures after the CG simulation provides the prediction of near-native structures. We also tested the ability of the CG potential to predict 3-D structure when limited restraints are introduced based on the secondary structure information (canonical base pairing) during the simulated annealing simulations. We added restraint by randomly picked 3-5 canonical Watson-Crick base pairs in each RNA molecule (Table 7). With these limited restraints, the CG model was able to predict all the 3-D structures for each tested RNA in all three independent repeats, with rmsd’s in the range of 2.8-6.5 Å (Table 7). The results are very encouraging as they demonstrate that limited knowledge of canonical base pairing from secondary structure prediction can greatly facilitate the 3-D structure prediction using a CG potential. Figure 2. Superposition of the final snapshot from 10 ns CG simulations (colored green) and native structure (colored blue). The backbones are represented as thick sticks, and the bases are shown as lines. (a) Superposition of RNA with 12 canonical Watson-Crick base pairs (PDB ID: 1QCU). (b) Superposition of the frameshifting RNA pesudoknot from beet western yellow virus (PDB ID: 1L2X), a single chain with coaxial helices connected by two loops. (c) Superposition of 24-nt dsRNA with a 5×5 nt internal loop (PDB ID: 1LNT). TABLE 7: Comparison of All-Atom RMSDs between the Final Structures of 100 ns Simulated-Annealing Simulations to Their Native Structures rmsd (Å) without restraints rmsd (Å) with restraints PDB ID MIN/AVGa MIN/AVG number of restrained pairs 157D 6.6/7.2 5.2/5.5 5 1AL5 6.4/8.4 5.2/5.8 5 1DQF 4.2/5.7 4.8/5.3 4 1F5G 5.2/7.0 5.8/5.9 5 1I9X 6.8/8.4 3.0/4.7 5 1KD3 8.0/9.1 5.3/5.6 5 1L2X 9.7/10.4 5.0/5.2 5 1LNT 6.5/7.7 5.0/5.6 5 1QCU 6.0/8.8 4.0/4.4 5 1ZIH 3.8/4.7 3.6/5.0 3 2AO5 5.1/6.5 2.8/4.6 5 2JXQ 4.1/6.4 3.0/4.8 5 2K7E 5.9/7.8 5.0/5.1 5 353D 4.8/6.0 4.0/5.5 5 472D 4.6/6.9 4.7/5.5 3 a The minimum and average rmsd value among all repeats (the restrained pairs shown in the last column on average correspond to ∼40% of each RNA). CG Model for Simulation of RNA 3-D Structures J. Phys. Chem. B, Vol. 114, No. 42, 2010 13503
  • 8. Computational Efficiency of the Coarse-Grained Model. The computational efficiency of the CG model is greatly improved when compared to the all-atom model. A nearly 2 orders of magnitude improvement in MD simulation speed was found with the same time step of 1 fs. This improvement is mainly due to the reduction in the number of bond, angle, and torsion calculations. Furthermore, because of the absence of high-frequency motions such as bond stretching in the all-atom model, a time step up to 10 fs can be applied to the MD simulation without a noticeable effect on energy and structural stability. In addition, in explicit all-atom simulations using a physical force field, not only is the number of atoms further increased due to the presence of the solvent but also the equilibration of water and counterions distribution is time- consuming. Therefore, the CG model can achieve an improve- ment of about 3 orders of magnitude in the simulation speed, which may enable us to study a large system or extend the simulation time from tens of nanoseconds to the scale of microseconds. Conclusions In summary, we developed and applied a new statistical coarse- grained potential to model RNA structures with molecular dynam- ics. In the coarse-grained potential, each nucleotide is represented by five pseudo atoms including three in the base ring. The bond, angle, torsion, and nonbonded parameters in the CG potential were derived based on the structural statistics sampled from experimental structures of over 600 RNA in PDB. The Boltzmann inversion was used to obtain the initial parameters for the CG potential. Subsequently the nonbonded parameters were optimized analyti- cally by comparing the CG minimum-energy structures with the experimental structures. The optimization was performed system- atically using the optimally conditioned variable metric nonlinear optimization algorithm in TINKER.129,131-133 The resulting potential was validated in molecular dynamics simulations of 15 RNAs, including helices, teraloops, stem loops, bulges, and pseudoknots. Room-temperature MD simulations starting from the native structures produced very reasonable rmsd (3.36 Å on average), indicating the CG potential is able to maintain Figure 3. (a) Comparison of all-atom rmsd’s for the structures 1ZIH, 353D, and 1DQF during the 100 ns simulated annealing simulations. The simulation temperature was increased to 1000 K within the beginning 2000 steps and then cooled down to room temperature, 298 K. The rmsd’s were calculated using all of the CG atoms. The figures show how the RNA molecules fold toward their native structures. (b) Snapshots taken from simulated annealing of 1ZIH. (c) The superposition of the final conformation (colored green) and native structure (colored blue) of the GCCA tetraloop after 20 ns full-atom MD refinement. The backbone is represented as a ribbon, and the base-stacking unit in a tetraloop is shown as sticks. (d) Snapshots taken from simulated annealing simulation of 353D. 13504 J. Phys. Chem. B, Vol. 114, No. 42, 2010 Xia et al.
  • 9. the native structure, or the native structures are minima on the CG potential energy surface. The coarse-grained potential was then applied to “predict” the 3-D structures of the 15 RNAs using multiple independent simulated annealing dynamics simulations. For most of the RNAs, at least one out of the five simulated annealing runs, the structure folded into a near native state (rmsd < 6.5 Å). We also noted that the CG potential was able to predict the base stacking behavior in a tetraloop. Furthermore, we also introduced limited distance restraints based on the knowledge of canonical base pairing in the secondary structure. The reliability of the structure prediction using CG potential was drastically improved, and all RNAs were folded into structures with rmsd’s less than 6.5 Å. We also investigated the possibility of using an amber all-atom force field to map and refine the CG model into all-atom structures. Overall, the performance of this simple CG potential is very promising. With limited knowledge of base-pairing from secondary structure prediction, the CG approach can reliably predict the 3-D structure for small RNA molecules of various topologies. The analytical functional form of the CG potential is compatible with existing molecular modeling packages such as NAMD148 and GROMACS,149 so that it can be easily adapted and take advantage of sophisticated simulation algorithms such as the replica exchange molecular dynamic method150 that is much more effective than simulated annealing for conforma- tional sampling. Further improvement of the accuracy of the CG potential can be achieved by incorporating more experi- mental structure and refinement of the parameters. To capture the nonbonded interaction more precisely, spline interpolation functions can be utilized instead of the current simple analytical function,117 In the future, extra types of pseudo atoms will be incorporated to represent the modified bases, especially by methylation, such as inosine (derived from adenine) or pseudou- ridine (derived from uracil) in tRNA. Acknowledgment. This research is supported by a grant from the Robert A. Welch Foundation to P.R. (F-1691), and R.G. acknowledges support by the Robert A. Welch Foundation (F-1427) and Microsoft Research. Z.X. is grateful to Yue Shi and Dr. Chunli Yan for their help with the AMBER simulations. The authors also acknowledge TeraGrid for providing the computing resources via grant TG-MCB100057. Note Added after ASAP Publication. This paper was published on the Web on September 30, 2010. An update was made to the Acknowledgment and the corrected version was reposted on October 4, 2010. Supporting Information Available: The probability distri- butions of all virtual bonds, angles, and torsions for parametri- zation are shown in Figures S1, S2, and S4, respectively. The potential of mean force for each coarse-grained pair could be seen in Figure S3. The rmsd’s during 20 ns all-atom simulation refinement are show in Figure S5. This material is available free of charge via the Internet at http://pubs.acs.org. References and Notes (1) Crick, F. Symp. Soc. Exp. Biol. 1958, XII, 138. (2) Crick, F. Nature 1970, 227, 561. (3) James, D. W.; Tania, A. B.; Stephen, P. B.; Alexander, G.; Michael, L.; Richard, L.; CSHLP, I. Molecular Biology of the Gene, 6th ed.; Benjamin Cummings: San Francisco, CA, 2007. (4) Stark, B. C.; Kole, R.; Bowman, E. J.; Altman, S. Proc. Natl. Acad. Sci. U.S.A. 1978, 75, 3717. (5) Noller, H. F.; Chaires, J. B. Proc. Natl. Acad. Sci. U.S.A. 1972, 69, 3115. (6) Noller, H. F.; Chang, C.; Thomas, G.; Aldridge, J. J. Mol. Biol. 1971, 61, 669. (7) Kruger, K.; Grabowski, P. J.; Zaug, A. J.; Sands, J.; Gottschling, D. E.; Cech, T. R. Cell 1982, 31, 147. (8) Guerrier-Takada, C.; Gardiner, K.; Marsh, T.; Pace, N.; Altman, S. Cell 1983, 35, 849. (9) Nahvi, A.; Sudarsan, N.; Ebert, M. S.; Zou, X.; Brown, K. L.; Breaker, R. R. Chem. Biol. 2002, 9, 1043. (10) Winkler, W.; Nahvi, A.; Breaker, R. R. Nature 2002, 419, 952. (11) Winkler, W. C.; Cohen-Chalamish, S.; Breaker, R. R. Proc. Natl. Acad. Sci. U.S.A. 2002, 99, 15908. (12) Rodionov, D. A.; Vitreschak, A. G.; Mironov, A. A.; Gelfand, M. S. Nucleic Acids Res. 2003, 31, 6748. (13) Vitreschak, A. G.; Rodionov, D. A.; Mironov, A. A.; Gelfand, M. S. Trends Genet. 2004, 20, 44. (14) Doudna, J. A.; Szostak, J. W. Nature 1989, 339, 519. (15) Noller, H. F.; Hoffarth, V.; Zimniak, L. Science 1992, 256, 1416. (16) Hingerty, B.; Brown, R. S.; Jack, A. J. Mol. Biol. 1978, 124, 523. (17) Ban, N.; Nissen, P.; Hansen, J.; Moore, P. B.; Steitz, T. A. Science 2000, 289, 905. (18) Wimberly, B. T.; Brodersen, D. E.; Clemons, W. M., Jr.; Morgan- Warren, R. J.; Carter, A. P.; Vonrhein, C.; Hartsch, T.; Ramakrishnan, V. Nature 2000, 407, 327. (19) Brodersen, D. E.; Clemons, W. M., Jr.; Carter, A. P.; Wimberly, B. T.; Ramakrishnan, V. J. Mol. Biol. 2002, 316, 725. (20) Kazantsev, A. V.; Krivenko, A. A.; Harrington, D. J.; Holbrook, S. R.; Adams, P. D.; Pace, N. R. Proc. Natl. Acad. Sci. U.S.A. 2005, 102, 13392. (21) Torres-Larios, A.; Swinger, K. K.; Krasilnikov, A. S.; Pan, T.; Mondragon, A. Nature 2005, 437, 584. (22) Serganov, A.; Huang, L.; Patel, D. J. Nature 2009, 458, 233. (23) Cate, J. H.; Gooding, A. R.; Podell, E.; Zhou, K.; Golden, B. L.; Kundrot, C. E.; Cech, T. R.; Doudna, J. A. Science 1996, 273, 1678. (24) Vidovic, I.; Nottrott, S.; Hartmuth, K.; Luhrmann, R.; Ficner, R. Mol. Cell. 2000, 6, 1331. (25) Serganov, A.; Yuan, Y. R.; Pikovskaya, O.; Polonskaia, A.; Malinina, L.; Phan, A. T.; Hobartner, C.; Micura, R.; Breaker, R. R.; Patel, D. J. Chem. Biol. 2004, 11, 1729. (26) Bessho, Y.; Shibata, R.; Sekine, S.; Murayama, K.; Higashijima, K.; Hori-Takemoto, C.; Shirouzu, M.; Kuramitsu, S.; Yokoyama, S. Proc. Natl. Acad. Sci. U.S.A. 2007, 104, 8293. (27) Klein, D. J.; Ferre-D’Amare, A. R. Science 2006, 313, 1752. (28) Serganov, A.; Huang, L.; Patel, D. J. Nature 2008, 455, 1263. (29) Dann, C. E., III; Wakeman, C. A.; Sieling, C. L.; Baker, S. C.; Irnov, I.; Winkler, W. C. Cell 2007, 130, 878. (30) Thore, S.; Leibundgut, M.; Ban, N. Science 2006, 312, 1208. (31) Montange, R. K.; Batey, R. T. Nature 2006, 441, 1172. (32) Hainzl, T.; Huang, S.; Sauer-Eriksson, A. E. Nature 2002, 417, 767. (33) Kim, S. H.; Suddath, F. L.; Quigley, G. J.; McPherson, A.; Sussman, J. L.; Wang, A. H.; Seeman, N. C.; Rich, A. Science 1974, 185, 435. (34) Costa, F. F. Bioessays 2007, 32, 599. (35) Spizzo, R.; Nicoloso, M. S.; Croce, C. M.; Calin, G. A. Cell 2009, 137, 586. (36) Frohlich, K. S.; Vogel, J. Curr. Opin. Microbiol. 2009, 12, 674. (37) Georg, J.; Voss, B.; Scholz, I.; Mitschke, J.; Wilde, A.; Hess, W. R. Mol. Syst. Biol. 2009, 5, 305. (38) Khraiwesh, B.; Arif, M. A.; Seumel, G. I.; Ossowski, S.; Weigel, D.; Reski, R.; Frank, W. Cell 2010, 140, 111. (39) Hale, C. R.; Zhao, P.; Olson, S.; Duff, M. O.; Graveley, B. R.; Wells, L.; Terns, R. M.; P., T. M. Cell 2009, 139, 945. (40) Marraffini, L. A.; Sontheimer, E. J. Nat. ReV. Genet. 2010, 11, 181. (41) Hamilton, A. J.; Baulcombe, D. C. Science 1999, 286, 950. (42) Lecellier, C. H.; Dunoyer, P.; Arar, K.; Lehmann-Che, J.; Eyquem, S.; Himber, C.; Saib, A.; Voinnet, O. Science 2005, 308, 557. (43) Buchon, N.; Vaury, C. Heredity 2006, 96, 195. (44) Mattick, J. S.; Taft, R. J.; Faulkner, G. J. Trends Genet. 2010, 26, 21. (45) Gupta, R. A.; Shah, N.; Wang, K. C.; Kim, J.; Horlings, H. M.; Wong, D. J.; Tsai, M.-C.; Hung, T.; Argani, P.; Rinn, J. L.; Wang, Y.; Brzoska, P.; Kong, B.; Li, R.; West, R. B.; van de Vijver, M. J.; Sukumar, S.; Chang, H. Y. Nature 2010, 464, 1071. (46) Croce, C. M. Nat. ReV. Genet. 2009, 10, 704. (47) Sassen, S.; Miska, E. A.; Caldas, C. Virchows Arch. 2008, 452, 1. (48) Hahn, M. W.; Wray, G. A. EVol. DeV. 2002, 4, 73. (49) Taft, R. J.; Pheasant, M.; Mattick, J. S. Bioessays 2007, 29, 288. (50) Michel, F.; Westhof, E. J. Mol. Biol. 1990, 216, 585. (51) Levitt, M. Nature 1969, 224, 759. (52) Malhotra, A.; Tan, R. K.; Harvey, S. C. Biophys. J. 1994, 66, 1777. (53) Fink, D. L.; Chen, R. O.; Noller, H. F.; Altman, R. B. RNA 1996, 2, 851. CG Model for Simulation of RNA 3-D Structures J. Phys. Chem. B, Vol. 114, No. 42, 2010 13505
  • 10. (54) Lehnert, V.; Jaeger, L.; Michel, F.; Westhof, E. Chem. Biol. 1996, 3, 993. (55) Wang, R.; Alexander, R. W.; VanLoock, M.; Vladimirov, S.; Bukhti- yarov, Y.; Harvey, S. C.; Cooperman, B. S. J. Mol. Biol. 1999, 286, 521. (56) Sommer, I.; Brimacombe, R. J. Comput. Chem. 2001, 22, 407. (57) Stagg, S. M.; Mears, J. A.; Harvey, S. C. J. Mol. Biol. 2003, 328, 49. (58) Shapiro, B. A.; Yingling, Y. G.; Kasprzak, W.; Bindewald, E. Curr. Opin. Struct. Biol. 2007, 17, 157. (59) Malhotra, A.; Harvey, S. C. J. Mol. Biol. 1994, 240, 308. (60) Devkota, B.; Petrov, A. S.; Lemieux, S.; Boz, M. B.; Tang, L.; Schneemann, A.; Johnson, J. E.; Harvey, S. C. Biopolymers 2009, 91, 530. (61) Meller, J.; Elber, R. Comput. Methods Protein Folding 2002, 120, 77. (62) Kryshtafovych, A.; Venclovas, C.; Fidelis, K.; Moult, J. Proteins: Struct., Funct., Bioinf. 2005, 61, 225. (63) Moult, J. Curr. Opin. Struct. Biol. 2005, 15, 285. (64) Zwieb, C.; Muller, F. Nucleic Acids Symp. Ser. 1997, 36, 69. (65) Orozco, M.; Perez, A.; Noy, A.; Luque, F. J. Chem. Soc. ReV. 2003, 32, 350. (66) Jossinet, F.; Westhof, E. Bioinformatics 2005, 21, 3320. (67) Wu, J. C.; Gardner, D. P.; Ozer, S.; Gutell, R. R.; Ren, P. J. Mol. Biol. 2009, 391, 769. (68) Das, R.; Baker, D. Proc. Natl. Acad. Sci. U.S.A. 2007, 104, 14664. (69) Parisien, M.; Major, F. Nature 2008, 452, 51. (70) Pearlman, D. A.; Case, D. A.; Caldwell, J. W.; Ross, W. S.; Cheatham, T. E.; Debolt, S.; Ferguson, D.; Seibel, G.; Kollman, P. Comput. Phys. Commun. 1995, 91, 1. (71) Cheatham, T. E., III; Cieplak, P.; Kollman, P. A. J. Biomol. Struct. Dyn. 1999, 16, 845. (72) Case, D. A.; Cheatham, T. E., III; Darden, T.; Gohlke, H.; Luo, R.; Merz, K. M., Jr.; Onufriev, A.; Simmerling, C.; Wang, B.; Woods, R. J. J. Comput. Chem. 2005, 26, 1668. (73) Perez, A.; Marchan, I.; Svozil, D.; Sponer, J.; Cheatham, T. E., III; Laughton, C. A.; Orozco, M. Biophys. J. 2007, 92, 3817. (74) Brooks, B. R.; Bruccoeri, R. E.; Olafson, B. D.; States, D. J.; Swaminathan, S.; Karplus, M. J. Comput. Chem. 1983, 4, 187. (75) MacKerell, A. D., Jr.; Banavali, N.; Foloppe, N. Biopolymers 2000, 56, 257. (76) Brooks, B. R.; Brooks, C. L., III; Mackerell, A. D., Jr.; Nilsson, L.; Petrella, R. J.; Roux, B.; Won, Y.; Archontis, G.; Bartels, C.; Boresch, S.; Caflisch, A.; Caves, L.; Cui, Q.; Dinner, A. R.; Feig, M.; Fischer, S.; Gao, J.; Hodoscek, M.; Im, W.; Kuczera, K.; Lazaridis, T.; Ma, J.; Ovchinnikov, V.; Paci, E.; Pastor, R. W.; Post, C. B.; Pu, J. Z.; Schaefer, M.; Tidor, B.; Venable, R. M.; Woodcock, H. L.; Wu, X.; Yang, W.; York, D. M.; Karplus, M. J. Comput. Chem. 2009, 30, 1545. (77) Freddolino, P. L.; Arkhipov, A. S.; Larson, S. B.; McPherson, A.; Schulten, K. Structure 2006, 14, 437. (78) Knotts, T. A.; Rathore, N.; Schwartz, D. C.; de Pablo, J. J. J. Chem. Phys. 2007, 126, 084901. (79) Golubkov, P. A.; Ren, P. Y. J. Chem. Phys. 2006, 125. (80) Scheraga, H. A.; Khalili, M.; Liwo, A. Annu. ReV. Phys. Chem. 2007, 58, 57. (81) Golubkov, P. A.; Wu, J. C.; Ren, P. Y. Phys. Chem. Chem. Phys. 2008, 10, 2050. (82) Maroun, R. C.; Olson, W. K. Biopolymers 1988, 27, 585. (83) Maroun, R. C.; Olson, W. K. Biopolymers 1988, 27, 561. (84) Hao, M. H.; Olson, W. K. Biopolymers 1989, 28, 873. (85) Allinger, N. L.; Yuh, Y. H.; Lii, J.-H. J. Am. Chem. Soc. 1989, 111, 8851. (86) Tan, R. K.; Harvey, S. C. J. Mol. Biol. 1989, 205, 573. (87) Sprous, D.; Harvey, S. C. Biophys. J. 1996, 70, 1893. (88) Sprous, D.; Tan, R. K.; Harvey, S. C. Biopolymers 1996, 39, 243. (89) Tan, R. K.; Sprous, D.; Harvey, S. C. Biopolymers 1996, 39, 259. (90) Massire, C.; Westhof, E. J. Mol. Graphics Modell. 1998, 16, 197. (91) Tanaka, I.; Nakagawa, A.; Hosaka, H.; Wakatsuki, S.; Mueller, F.; Brimacombe, R. RNA 1998, 4, 542. (92) Olson, W. K.; Zhurkin, V. B. Curr. Opin. Struct. Biol. 2000, 10, 286. (93) Matsumoto, A.; Olson, W. K. Biophys. J. 2002, 83, 22. (94) Coleman, B. D.; Olson, W. K.; Swigon, D. J. Chem. Phys. 2003, 118, 7127. (95) Mergell, B.; Ejtehadi, M. R.; Everaers, R. Phys. ReV. E 2003, 68, 021911. (96) Flammini, A.; Maritan, A.; Stasiak, A. Biophys. J. 2004, 87, 2968. (97) LaMarque, J. C.; Le, T. V.; Harvey, S. C. Biopolymers 2004, 73, 348. (98) Nielsen, S. O.; Lopez, C. F.; Srinivas, G.; Klein, M. L. J. Phys.: Condens. Matter 2004, 16, R481. (99) Peyrard, M. Nonlinearity 2004, 17, R1. (100) Zhang, D. Q.; Konecny, R.; Baker, N. A.; McCammon, J. A. Biopolymers 2004, 75, 325. (101) Cao, S.; Chen, S. J. RNA 2005, 11, 1884. (102) Tepper, H. L.; Voth, G. A. J. Chem. Phys. 2005, 122, 124906. (103) Li, X. J.; Kou, D. Z.; Rao, S. L.; Liang, H. J. J. Chem. Phys. 2006, 124. (104) Tan, R. K. Z.; Petrov, A. S.; Harvey, S. C. J. Chem. Theory Comput. 2006, 2, 529. (105) Vologodskii, A. Biophys. J. 2006, 90, 1594. (106) Ding, F.; Sharma, S.; Chalasani, P.; Demidov, V. V.; Broude, N. E.; Dokholyan, N. V. RNA 2008, 14, 1164. (107) Jonikas, M. A.; Radmer, R. J.; Laederach, A.; Das, R.; Pearlman, S.; Herschlag, D.; Altman, R. B. RNA 2009, 15, 189. (108) Ledford, H. Nature 2010, 465, 16. (109) Cannone, J. J.; Subramanian, S.; Schnare, M. N.; Collett, J. R.; D’Souza, L. M.; Du, Y.; Feng, B.; Lin, N.; Madabusi, L. V.; Muller, K. M.; Pande, N.; Shang, Z.; Yu, N.; Gutell, R. R. BMC Bioinf. 2002, 3, 2. (110) Duarte, C. M.; Pyle, A. M. J. Mol. Biol. 1998, 284, 1465. (111) Tschop, W.; Kremer, K.; Batoulis, J.; Burger, T.; Hahn, O. Acta Polym. 1998, 49, 61. (112) Muller-Plathe, F. ChemPhysChem 2002, 3, 754. (113) Buckingham, R. A. Proc. R. Soc. London, Ser. A 1938, 168, 264. (114) Allinger, N. L.; Yuh, Y. H.; Lii, J. H. J. Am. Chem. Soc. 1989, 111, 8551. (115) Lii, J. H.; Allinger, N. L. J. Am. Chem. Soc. 1989, 111, 8566. (116) Lii, J. H.; Allinger, N. L. J. Am. Chem. Soc. 1989, 111, 8576. (117) Summa, C. M.; Levitt, M. Proc. Natl. Acad. Sci. U.S.A. 2007, 104, 3177. (118) Case, D. A.; Darden, T. A.; Cheatham, T. E.; Simmerling, C. L.; Wang, J.; Duke, R. E.; Luo, R.; Crowley, M.; Walker, R. C.; Zhang, W.; Merz, K. M.; Wang, B.; Hayik, S.; Roitberg, A.; Seabra, G.; Kolossva´ry, I.; Wong, K. F.; Paesani, F.; Vanicek, J.; Wu, X.; Brozell, S. R.; Steinbrecher, T.; Gohlke, H.; Yang, L.; Tan, C.; Mongan, J.; Hornak, V.; Cui, G.; Mathews, D. H.; Seetin, M. G.; Sagui, C.; Babin, V.; Kollman, P. A. AMBER 10; University of California, San Francisco, 2008. (119) Jorgensen, W. L.; Chandrasekhar, J.; Madura, J.; Impey, R. W.; Klein, M. L. J. Chem. Phys. 1983, 79, 926. (120) Neria, E.; Karplus, M. J. Chem. Phys. 1996, 105, 10812. (121) Deserno, M.; Holm, C. J. Chem. Phys. 1998, 109, 7678. (122) Deserno, M.; Holm, C. J. Chem. Phys. 1998, 109, 7694. (123) Still, W. C.; Tempczyk, A.; Hawley, R. C.; Hendrickson, T. J. Am. Chem. Soc. 1990, 112, 6127. (124) Schaefer, M.; Karplus, M. J. Phys. Chem. 1996, 100, 1578. (125) Scarsi, M.; Apostolakis, J.; Caflisch, A. J. Phys. Chem. A 1997, 101, 8098. (126) Dominy, B. N.; Brooks, C. L. J. Phys. Chem. B 1999, 103, 3765. (127) Bashford, D.; Case, D. A. Annu. ReV. Phys. Chem. 2000, 51, 129. (128) Feig, M.; Im, W.; Brooks, C. L. J. Chem. Phys. 2004, 120, 903. (129) Ponder, J. W. TINKER - Software Tools for Molecular Design; Washington University Medical School, 2010. (130) Skolnick, J.; Jaroszewski, L.; Kolinski, A.; Godzik, A. Protein Sci. 1997, 6, 676. (131) Shanno, D. F.; Phua, K.-H. Math. Program. 1977, 25, 507. (132) Davidon, W. C. Math. Program. 1975, 9, 1. (133) Shanno, D. F.; Phua, K. H. J. Optim. Theory Appl. 1978, 25, 507. (134) Egli, M.; Minasov, G.; Su, L.; Rich, A. Proc. Natl. Acad. Sci. U.S.A. 2002, 99, 4302. (135) Deng, J.; Xiong, Y.; Pan, B.; Sundaralingam, M. Acta. Crystallogr., Sect. D: Biol. Crystallogr. 2003, 59, 1004. (136) Draper, D. E. Biophys. J. 2008, 95, 5489. (137) Heus, H. A.; Pardi, A. Science 1991, 253, 191. (138) Jucker, F. M.; Heus, H. A.; Yip, P. F.; Moors, E. H. M.; Pardi, A. J. Mol. Biol. 1996, 264, 968. (139) Betzel, C.; Lorenz, S.; Furste, J. P.; Bald, R.; Zhang, M.; Schneider, T. R.; Wilson, K. S.; Erdmann, V. A. Febs. Lett. 1994, 351, 159. (140) Xiong, Y.; Sundaralingam, M. RNA 2000, 6, 1316. (141) Correll, C. C.; Swinger, K. RNA 2003, 9, 355. (142) Woese, C. R.; Winker, S.; Gutell, R. R. Proc. Natl. Acad. Sci. U.S.A. 1990, 87, 8467. (143) Doherty, E. A.; Batey, R. T.; Masquida, B.; Doudna, J. A. Nat. Struct. Biol. 2001, 8, 339. (144) Nissen, P.; Ippolito, J. A.; Ban, N.; Moore, P. B.; Steitz, T. A. Proc. Natl. Acad. Sci. U.S.A. 2001, 98, 4899. (145) Cate, J. H.; Gooding, A. R.; Podell, E.; Zhou, K.; Golden, B. L.; Szewczak, A. A.; Kundrot, C. E.; Cech, T. R.; Doudna, J. A. Science 1996, 273, 1696. (146) Jucker, F. M.; Pardi, A. RNA 1995, 1, 219. (147) Sorin, E. J.; Engelhardt, M. A.; Herschlag, D.; Pande, V. S. J. Mol. Biol. 2002, 317, 493. (148) Phillips, J. C.; Braun, R.; Wang, W.; Gumbart, J.; Tajkhorshid, E.; Villa, E.; Chipot, C.; Skeel, R. D.; Kale, L.; Schulten, K. J. Comput. Chem. 2005, 26, 1781. (149) van der Spoel, D.; Lindahl, E.; Hess, B.; van Buuren, A. R.; Apol, E.; Meulenhoff, P. J.; Tieleman, D. P.; Sijbers, A. L.T. M.; Feenstra, K. A.; Drunen, R. v.; Berendsen, C. H. J. www.gromacs.org, (accessed Dec 2005). (150) Sugita, Y.; Okamoto, Y. Chem. Phys. Lett. 1999, 314, 141. JP104926T 13506 J. Phys. Chem. B, Vol. 114, No. 42, 2010 Xia et al.