Thesis presentation final
•
1 gostou•3,640 visualizações

This is my final thesis presentation.

Recomendados
Recomendados
Mais conteúdo relacionado
Destaque
Destaque (20)
Semelhante a Thesis presentation final
Semelhante a Thesis presentation final (20)
Mais de Robin De Croon
Mais de Robin De Croon (20)
Último
Último (20)
Thesis presentation final
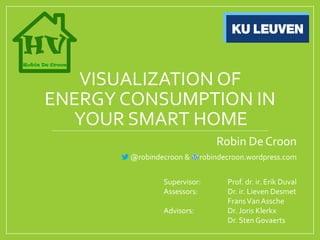
- 1. VISUALIZATION OF ENERGY CONSUMPTION IN YOUR SMART HOME Robin De Croon @robindecroon & robindecroon.wordpress.com Supervisor: Prof. dr. ir. Erik Duval Assessors: Dr. ir. Lieven Desmet FransVanAssche Advisors: Dr. Joris Klerkx Dr. Sten Govaerts
- 2. Content • Context • Design Methodology • Paper Mockups • Improvements • Implementation • Conclusion June 28, 2013 2 http://us.123rf.com/400wm/400/400/johan2011/johan20111108/johan2011110800040/10226809-3d-little-human-character-writing-with-a-pen-black.jpg
- 4. ExplanationTitle • DataVisualization • Energy Awareness • Smart HomeTechnology June 28, 2013 4 http://us.123rf.com/400wm/400/400/johan2011/johan20111202/johan2011120200085/12703570-3d-little-human-character-with-a-tablet-pad-blank-screen-for-copy-space-people-
- 5. EnergyAwareness GlobalWarming Major challenge of man kind June 28, 2013 5 http://4.bp.blogspot.com/-AOFUPvN5Fbc/UMbYptdHkEI/AAAAAAAAACM/Nng4hx3QT08/s1600/polar+bear.png &http://farm8.staticflickr.com/7145/6808983681_767c057854_o.jpg Save on household budget Save 15% on electricity bill M. Jahn, M. Jentsch, C. R. Prause, F. Pramudianto, A. Al-Akkad, and R. Reiners. The Energy Aware Smart Home. In 2010 5th International Conference on Future Information Technology,pages 1–8. IEEE, 2010. G. Wood and M. Newborough. Dynamic energy consumption indicators for domestic appliances: environment,behaviour and design. Energy and Buildings, 35(8):821–841, Sept. 2003.
- 6. Which data from your smart home do you want to visualize? June 28, 2013 6 13 16 17 19 34 36 62 0 10 20 30 40 50 60 70 How many hours TV did I watch? Other How many times did I use a (light) switch? How many times was I in a room? Which device did I use most? How warm was it in each room? How much energy did I use? Number of people http://goo.gl/oiSgI
- 9. Objectives • Analyze Smart HomeTechnologies • Search a partner • Get fine grained sensor data • Design proof-of-concept application • Usability • Practical feasibility June 28, 2013 9 http://www.performanceobjectivesnow.com/blog/wp-content/uploads/2011/07/stick_figure_solving_puzzle_400_wht.png
- 10. DESIGN METHODOLY Context Design Methodology Paper Mockups Improvements Implementation Conclusion
- 11. Design Based Research • Rapid prototyping • User stories • Prototypes (paper & digital) • User tests with think aloud • SUS Questionnaire June 28, 2013 11 http://farm8.staticflickr.com/7221/7351141086_85640e3c06.jpg How do I go back?
- 12. TargetAudience June 28, 2013 12 • (Smart) Home Owners • People interested in energy savings • People living in Europe • Age: 20+ • All income levels http://marketingyoucanuse.com/wp-content/uploads/2010/12/HittingTarget.jpg Target Audience
- 13. PAPER MOCKUPS Context Design Methodology Paper Mockups Improvements Implementation Conclusion
- 14. DesignCriteria • Consistency • Aesthetic • Separation of Concerns • Minimalistic • Diagrams ( ubigreen) • Financial Overview (VELObill) • Metaphors ( leafully) June 28, 2013 14 http://us.123rf.com/400wm/400/400/johan2011/johan20111207/johan2011120700008/14310549-3d-little-human-character-the-builder-looking-at-a-blueprint-front-view-people-series.jpg
- 15. Start Screen June 28, 2013 15 • Minimalistic Separation • 3 Key words DATA YOU SPHERE • Sphere is not used anymore 3D visualization not best visualization for this kind of information M. Krzywinski. Behind Every Great Visualization is a DesignPrinciple. http://www.youtube.com/watch?v=wzeF2hDlhoY,2009. opgeroepen op 24-05-2013.
- 16. DATA June 28, 2013 16 •5 categories Lights Water Heating Appliances Home Cinema •Electricity is divided in 3 categories •Pictures A. de Almeida, P. Fonseca, B. Schlomann, and N. Feilberg. Characterization of the household electricity consumption in the EU, potential energy savings and specific policy recommendations.Energy and Buildings, 43(8):1884–1894, Aug. 2011. T. Kamada and S. Kawai. A general framework for visualizing abstract objects and relations. ACM Transactions on Graphics, 10(1):1–39, Jan. 1991.
- 17. YOU June 28, 2013 17 • Where were you the most? •Treemap • Hierarchical data • Space filling visualization B. B. Bederson, B. Shneiderman, and M. Wattenberg. Orderedand quantum treemaps: Making effective use of 2D space to display hierarchies. ACM Transactions on Graphics, 21(4):833–854, Oct. 2002.
- 18. Navigation June 28, 2013 18 swipe lights metaphor swipe
- 20. Rapid Prototyping June 28, 2013 20 5 users 9 users 3 users 11 users SUS: 70/100 SUS: 80/100 SUS: 82,5/100 SUS: 87/100 Paper Prototype I Paper Prototype II Digital Prototype I Digital Prototype II
- 21. IMPROVEMENTS PAPER PROTOTYPE I June 28, 2013 21
- 22. TabletApplication? June 28, 2013 22 M. de Sá and L. Carriço. Low-fi prototypingfor mobile devices. In CHI ’06 extended abstracts on Human factors in computing systems - CHI EA ’06, page 694, New York, New York, USA, 2006. ACM Press.
- 23. Location June 28, 2013 23 5/5
- 24. InterpretationTreemap June 28, 2013 24 4/5
- 25. Home Screen June 28, 2013 25 3/5
- 26. InterpretationTree June 28, 2013 26 3/5
- 27. IMPROVEMENTS PAPER PROTOTYPE II June 28, 2013 27
- 28. Exhausting for the eyes June 28, 2013 28 S. Debbie, C. Jarrett, M. Woodroffe,S. Minocha. User Interface Design and Evaluation. Morgan Kaufmann. 2005 Me
- 29. InterpretationTreemap June 28, 2013 29 5/9 Meaning treemap
- 30. Tabs to change room June 28, 2013 30 4/9
- 31. Icons not clear June 28, 2013 31 6/9
- 32. IMPROVEMENTS DIGITAL PROTOTYPE I June 28, 2013 32
- 35. More detailed information June 28, 2013 35 3/3
- 36. Selecting a time period June 28, 2013 36 3/3
- 37. IMPROVEMENTS DIGITAL PROTOTYPE II June 28, 2013 37
- 38. Heating Metaphor June 28, 2013 38 4/11
- 39. RESULTS SUS QUESTIONNAIRE June 28, 2013 39
- 40. SUS Results June 28, 2013 40
- 41. SUS Score interpretation June 28, 2013 41 12,5 20,3 35,7 50,9 71,4 85,5 90,9 0 10 20 30 40 50 60 70 80 90 100 Worst Imaginable Awful Poor OK Good Excellent Best Imaginable SUS Scores AdjectieveRating A. Bangor, P. Kortum, and J. Miller. Determining what individual SUS scores mean: Adding an adjective rating scale. Journal of usability studies, 4(3):114–123, 2009.
- 42. June 28, 2013 42 https://picasaweb.google.com/100923738088214702616/Omini3d#5456698262314545906
- 43. Demo Movie •MOVIE June 28, 2013 43
- 45. Alarm (not used) Wireless router Miniserver Main on and off switch 6 small push buttons Status leds Loxone June 28, 2013 45
- 46. Deployment Diagram June 28, 2013 46
- 47. Belgium: € 0,212 0,00 0,05 0,10 0,15 0,20 0,25 0,30 EU-27(2) Euroarea(2) Denmark Germany Cyprus Belgium Spain Ireland Italy Sweden Austria Portugal Netherlands Slovakia Malta Luxembourg UnitedKingdom Finland Hungary Slovenia CzechRepublic France Poland Latvia Greece Lithuania Romania Estonia Bulgaria Norway Croatia Turkey Montenegro Basic price (without taxes and levies) Taxes and levies other than VAT VAT Calculate Usage June 28, 2013 47 http://epp.eurostat.ec.europa.eu/statistics_explained/index.php/Energy_price_statistics
- 48. CO2 Calculations June 28, 2013 48 Belgium: 253 0 200 400 600 800 1000 1200 CO2electricity(gr)perKwh http://www.eea.europa.eu/data-and-maps/figures/co2-electricity-g-per-kwh
- 49. Biggest Unsolved Problem June 28, 2013 49 • Measure real power usage • Unfortunately incompatible with Loxone • Measured data • Theoretical data 𝑝𝑜𝑤𝑒𝑟 𝑣𝑜𝑙𝑡𝑎𝑔𝑒 = 𝑐𝑢𝑟𝑟𝑒𝑛𝑐𝑒 ↔ 60 𝑊𝑎𝑡𝑡 230 𝑉 = 0,26 𝐴 & 2000 𝑊𝑎𝑡𝑡 230 𝑉 = 8,7 𝐴
- 51. Critical Reflection • Broad subject • Context Awareness • Finding a partner • Started to soon with a digital prototype • Happy with the result June 28, 2013 51
- 52. Objectives: reached June 28, 2013 52 Analyzed some smart home technologies Demec as partner Statistics from Loxone HomeViz as proof-of-concept application SUS score of 87 Real application on Google Play http://thumbs.dreamstime.com/z/3d-small-people-puzzle-insert-19284510.jpg
- 53. FutureWork • Evaluate influence on behavior • Support more Smart HomeTechnologies • Analyze statistics and make suggestions • Implement Social Functions June 28, 2013 53