SlideShare uma empresa Scribd logo
1 de 8
Baixar para ler offline
KEY PERFORMANC INDICATORS


                              Weekly Market Performance                       4-Jan        28-Dec    Change
                              All Share Price Index                        5,747.71       5,607.13     2.5%
                              S&P SL 20 Index                              3,121.71       3,068.99     1.7%
                              Market PE (x)                                    16.2           15.8     2.8%
               CE


                              Market PBV (x)                                    2.1            2.0     3.1%
                              Market Capitalization SLRs.Bn                2,207.82       2,153.94     2.5%


                              Total Turnover for the week SLRs.Mn          3,719.20       1,274.31   191.9%
                              Foreign Purchases SLRs.Mn                    2,462.87        811.18    203.6%
                              Foreign Sales SLRs.Mn                        2,061.05         69.17    2879.8%


                              Year to Date Market Performance
                              Change in ASPI                                   1.9%
                              Change in S&P SL 20                              1.2%
                              Total Turnover SLRs.Mn                       3,429.94
                              Net Foreign Purchases/(Sales) SLRs.Mn         295.75


                                                       Fundamental Analysis Division
4-Jan-13
                                                      Capital TRUST Research (Pvt) Ltd.
BANKING, FINANCE & INSURANCE                                                           Sector Index =       12,646.50                WoW Change = 3.9%                       Sector PE = 11.0                                Sector PBV = 1.7
                                            Price        WoW           No. of        M.CAP                                                                                                             Cash    Cash Per  DPS
                                      F                                                                      Net Profit (SLRs. Mn)                       EPS (SLRs.)                   PER (x)                                         NAV      PBV
            COMPANY                         SLRs        Change         shares        SLRs.                                                                                                            Balance   Share   Last FY
                                      Y                                                                                                                                                                                               (SLRs)     (x)
                                            4-Jan       in Price        (Mn)          Mn           2010/11          2011/12          2012/13         11/12         12/13           11/12   12/13 (F) (SLRs.Mn) (SLRs.) (SLRs.)
  Banks
  Commercial Bank         D                  104.90          1.90        780.01       86,813     5,507.50    FY   8,094.89    FY   7,622.80    9M    9.71    FY    9.15    9M       10.80       8.60     9,710.30     11.65    4.00    61.41      1.71
  Commercial Bank (X)     D                   93.30          2.80         53.47                                                                      9.71    FY    9.15    9M        9.61       7.65                  11.65    4.00    61.41      1.52
  DFCC                    M                  117.90          6.10        265.10       31,255     5,090.31    FY   2,900.21    FY   1,501.52    6M   10.94    FY    5.66    6M       10.78      10.41    17,976.84     67.81    4.00    98.48      1.20
  HNB                     D                  148.50          1.50        317.74       56,256     4,786.77    FY   6,148.84    FY   4,917.30    9M   15.47    FY   12.37    9M        9.60       9.00    16,154.37     40.65    4.50   111.08      1.34
  HNB (X)                 D                  113.90          1.70         79.64                                                                     15.47    FY   12.37    9M        7.36       6.90                  40.65    4.50   111.08      1.03
  NDB                     D                  140.90          2.60        164.20       23,136     2,149.53    FY   2,705.54    FY   2,040.92    9M   16.48    FY   12.43    9M        8.55       8.50    12,399.54     75.51    7.50   112.61      1.25
  NTB                     D                   59.00          4.00        230.61       13,606     1,084.23    FY   1,533.90    FY   1,459.73    9M    6.65    FY    6.33    9M        8.87       6.99     9,278.36     40.23    2.10    41.57      1.42
  Sampath                 D                  201.00          0.00        162.74       32,710     3,484.47    FY   4,150.62    FY   3,897.95    9M   25.51    FY   23.95    9M        7.88       6.29    23,786.20    146.16    4.50   148.23      1.36
  Pan Asia                D                   19.00          0.00        295.04        5,606       361.79    FY     824.01    FY     551.57    9M    2.79    FY    1.87    9M        6.80       7.62     5,946.94     20.16    1.00    13.10      1.45
  Seylan                  D                   60.00          4.70        173.33       16,298     1,207.23    FY   1,005.80    FY   1,613.96    9M    2.98    FY    4.77    9M       20.17       9.43     8,679.42     25.67    1.00    56.91      1.05
  Seylan (X)              D                   35.80          0.60        164.75                                                                      2.98    FY    4.77    -        12.03       5.62                  25.67    1.00    56.91      0.63
  Union Bank              D                   13.90          0.10        349.25        4,855      149.80     FY    294.23     FY     173.13    9M    0.84    FY    0.50    9M       16.50      21.03     3,102.30      8.88     -      15.20      0.91
  HDFC                    D                   52.00          1.20         64.71        3,365      246.69     FY    309.65     FY      10.28    9M    4.79    FY    0.16    9M       10.87     245.43     2,962.66     45.78    5.00    36.25      1.43
  Finance & Leasing Companies
  Asia Capital            M                   30.20         (0.10)      110.00         3,322      988.02     FY    889.95     FY    (285.23)   6M    8.09    FY   (2.59)   6M         3.73     (5.82)      (28.66)    (0.26)   6.95     6.92     4.36
  Softlogic Finance       M                   25.60          1.60        37.45           959       68.54     FY    105.63     FY      55.33    6M    2.82    FY    1.48    6M         9.08      8.67        75.64      2.02    1.50    29.77     0.86
  CDB                     M                   42.90          1.90        46.30         1,986      528.55     FY    632.77     FY     245.52    6M   11.65    FY    4.52    6M         3.68      4.74      (105.69)    (1.95)   1.00    45.67     0.94
  CDB (X)                 M                   33.00          2.90         8.01                                                                      11.65    FY    4.52    -          2.83      3.65                  (1.95)   1.00    45.67     0.72
  Central Finance         M                  176.00         15.40       104.88        18,459     1,827.03    FY   2,676.62    FY   1,581.57    6M   25.52    FY   15.08    6M         6.90      5.84       596.58      5.69    2.50   140.53     1.25
  First Capital           M                   12.50          0.20       101.25         1,266       934.81    FY    (170.77)   FY     107.13    6M   (1.69)   FY    1.06    6M        (7.41)     5.91         2.52      0.02    2.00    12.34     1.01
  Lanka Orix Leasing      M                   55.00          1.10       475.20        26,136     3,840.23    FY   6,259.86    FY   1,262.06    6M   13.17    FY    2.66    6M         4.18     10.35      (179.89)    (0.38)    -      43.37     1.27
  Lanka Orix Finance      M                    3.90          0.10     2,800.00        10,920     1,246.09    FY   1,245.79    FY     543.06    6M    0.44    FY    0.19    6M         8.77     10.05       546.07      0.20     -       1.89     2.06
  LB Finance              M                  150.00          2.00        69.26        10,389     1,020.37    FY   1,625.08    FY     862.11    6M   23.46    FY   12.45    6M         6.39      6.03     1,637.70     23.65    5.00    65.30     2.30
  MBSL                    D                   20.20         (0.30)      135.00         2,727       492.35    FY     353.14    FY      53.68    9M    2.62    FY    0.40    9M         7.72     38.10     2,001.67     14.83    1.25    22.06     0.92
  Nation Lanka Finance    M                   10.70          1.00       249.91         2,674      (376.22)   FY     (69.04)   FY    (181.49)   6M   (0.28)   FY   (0.73)   6M       (38.73)    (7.37)      283.05      1.13     -       1.74     6.16
  People's Finance        M                   37.50          3.00        74.58         2,797       106.86    FY     345.42    FY     176.67    6M    4.63    FY    2.37    6M         8.10      7.92     1,056.37     14.16    1.14    25.18     1.49
  People's Leasing        M                   14.30          1.10     1,560.00        22,308     2,604.77    FY   4,503.00    FY   1,505.00    6M    2.89    FY    0.96    6M         4.95      7.41     1,229.00      0.79    1.00    12.26     1.17
  People's Merchant       M                   15.00          0.30        67.50         1,013       (61.66)   FY       0.51    FY     (35.60)   6M    0.01    FY   (0.53)   6M     2,000.99    (14.22)     (278.00)    (4.12)    -      13.20     1.14
  Sinhaputhra Finance     M                   80.40          2.60         6.30           506        26.93    FY      54.15    FY      31.19    6M    8.60    FY    4.95    6M         9.35      8.11        83.55     13.27    2.00   123.96     0.65
  Singer Finance          M                   14.10          0.40       165.33         2,331       112.04    FY     225.55    FY     120.62    6M    1.36    FY    0.73    6M        10.34      9.66       (67.54)    (0.41)   0.52    10.85     1.30
  SMB Leasing             D                    1.00          0.00     1,191.77         1,499        27.12    FY     (35.28)   FY      44.37    9M   (0.02)   FY    0.02    9M       (51.19)    30.53       145.89      0.08     -       0.53     1.89
  SMB Leasing (X)         D                    0.50          0.10       614.07                                                                      (0.02)   FY     -      -        (25.59)    15.26                   0.08     -       0.53     0.94
  Swarnamahal Financial   M                    3.60          0.50       500.00         1,800     62.79       FY     140.75    FY      71.65    6M    0.28    FY    0.14    6M        12.79     12.56       (7.98)     (0.02)    -       1.01     3.56
  The Finance             M                   19.00          0.30        57.97         1,751 (3,830.14)      FY    (353.40)   FY    (751.69)   6M   (2.24)   FY   (4.76)   6M        (8.49)    (2.00)      87.63       1.51     -     (29.22)   (0.65)
  The Finance (X)         M                    6.50          0.20       100.00                                                                      (2.24)   FY     -      -         (2.91)    (0.68)                  1.51     -     (29.22)   (0.22)
  Vallibel Finance        M                   32.00          0.90        41.55         1,330      107.71     FY    238.98     FY     128.66    6M    5.75    FY    3.10    6M         5.56      5.17       (48.99)    (1.18)   1.00    18.61     1.72
  Insurance Companies
  Amana Takaful           D                    1.80         0.10      1,000.00         1,800      (35.58)    FY     (92.19)   FY      17.08    6M   (0.09)   FY    0.02    6M       (19.52)    52.69      546.71       0.55     -       0.89      2.03
  Ceylinco Insurance      D                  925.00       108.20         20.00        20,621      961.64     FY   1,372.17    FY     483.51    9M   51.95    FY   18.30    9M        17.81     37.90      309.86      11.73    6.50   425.89      2.17
  Ceylinco Insurance (X)  D                  330.70        (6.20)         6.41                                                                      51.95    FY   18.30    9M         6.37     13.55                  11.73    6.50   425.89      0.78
  Aviva NDB Insurance     D                  330.00         0.10         30.00         9,900      600.17     FY    691.61     FY     266.43    9M   23.05    FY    8.88    9M        14.31     27.87      421.97      14.07    9.00   116.63      2.83
  HNB Assurance           D                   49.40        (1.40)        50.00         2,470      241.74     FY    274.63     FY     139.88    9M    5.49    FY    2.80    9M         8.99     13.24       83.13       1.66    2.10    32.95      1.50
  Janashakthi Insurance   D                   10.90
                                              10 90         0.20
                                                            0 20        363.00
                                                                        363 00         3,957
                                                                                       3 957      770.35
                                                                                                  770 35     FY    636.29
                                                                                                                   636 29     FY     163.77
                                                                                                                                     163 77    6M    1.75
                                                                                                                                                     1 75    FY    0.45
                                                                                                                                                                   0 45    6M         6.22
                                                                                                                                                                                      6 22     12.08
                                                                                                                                                                                               12 08      239.17
                                                                                                                                                                                                          239 17       0.66
                                                                                                                                                                                                                       0 66    1.00
                                                                                                                                                                                                                               1 00     8.65
                                                                                                                                                                                                                                        8 65      1.26
                                                                                                                                                                                                                                                  1 26
  Union Assurance         D                   83.70        (0.20)        85.71         7,174      511.97     FY    695.59     FY     222.71    9M    8.12    FY    2.60    9M        10.31     24.16      304.36       3.55    5.00    42.81      1.96

                                                                                                                    Fundamental Analysis Division
Note:Forward PER is arrived at based on the annualised EPS adjusted for any exceptional items.                    Capital TRUST Research (Pvt) Ltd.                                                                                                    ‐  1 ‐
BEVERAGE, FOOD & TOBACCO                                                               Sector Index =       16,350.61                 WoW Change = 4.3%                       Sector PE = 19.4                                 Sector PBV = 5.9
                                            Price        WoW           No. of        M.CAP                                                                                                                 Cash     Cash Per   DPS
                                      F                                                                      Net Profit (SLRs. Mn)                        EPS (SLRs.)                  PER (x)                                            NAV     PBV
            COMPANY                         SLRs        Change         shares        SLRs.                                                                                                               Balance     Share    Last FY
                                      Y                                                                                                                                                                                                  (SLRs)    (x)
                                           4-Jan        in Price        (Mn)          Mn           2010/11            2011/12         2012/13         11/12         12/13           11/12     12/13 (F) (SLRs.Mn) (SLRs.) (SLRs.)
  Bairaha Farms                      M      157.00           6.90         16.00       2,512        485.95 FY         432.57 FY         68.54 6M      27.04    FY    4.28    6M         5.81      18.33      120.67      7.54     4.00    100.50    1.56
  Cargills                           M      150.00           4.50        224.00      33,600      1,088.55 FY       1,079.09 FY        326.86 6M       4.82    FY    1.46    6M        31.14      51.40 (3,445.98)     (15.38)    2.00     34.22    4.38
  Ceylon Tobacco                     D      859.00          39.90        187.32     160,911      5,097.10 FY       6,568.83 FY      6,192.00 9M      35.07    FY   33.06    9M        24.50      19.49    9,996.00     53.36    38.65     24.20   35.49
  Renuka Shaw Wallace                M       36.30           0.30         44.89       1,699        161.22 FY         142.03 FY        126.63 6M       3.00    FY    2.68    6M        12.08       6.78      371.02      7.85     1.00     48.20    0.75
  Renuka Shaw Wallace (X)            M       29.30          (0.20)         2.39                                                                       3.00    FY    2.68    -          9.75       5.47                  7.85     1.00     48.20    0.61
  Ceylon Cold Stores                 M      132.00           7.10         95.04       12,545       199.54    FY    2,242.41    FY     430.30    6M   23.59    FY    4.53    6M         5.59      14.58     (321.77)    (3.39)    4.00     77.17    1.71
  Distilleries                       M      168.90           3.20        300.00       50,670     8,124.04    FY    5,675.37    FY   3,078.41    6M   18.92    FY   10.26    6M         8.93       8.23 (7,777.21)     (25.92)    3.00    133.86    1.26
  HVA Foods                          M       14.00           0.70         66.43          930        46.34    FY        9.26    FY      25.54    6M    0.14    FY    0.38    6M       100.40      18.21       52.00      0.78      -        7.48    1.87
  Kotmale Holdings                   M       38.50          (0.30)        31.40        1,209        75.28    FY       83.42    FY      43.46    6M    2.66    FY    1.38    6M        14.49      13.91       30.99      0.99     2.00     21.45    1.79
  LMF                                M       98.40           2.20         40.00        3,936        43.38    FY      187.23    FY     125.47    6M    4.68    FY    3.14    6M        21.02      15.68     (360.23)    (9.01)    1.00     53.41    1.84
  Lion Brewery                       M      297.70          12.70         80.00       23,816       832.29    FY    1,262.23    FY     627.95    6M   15.78    FY    7.85    6M        18.87      18.96    2,385.86     29.82     4.00     68.66    4.34
  Keels Food Products                M       77.90           2.90         25.50        1,986        30.36    FY      129.64    FY      22.73    6M    5.08    FY    0.89    6M        15.32      43.70      620.99     24.35     0.67     57.77    1.35
  Nestle                             D    1,597.60          97.60         53.73       85,832     1,901.12    FY    2,633.29    FY   2,044.12    9M   49.01    FY   38.05    9M        32.59      31.49 (1,374.56)     (25.58)   47.50     52.59   30.38
  Renuka Agri                        M        4.70           0.00        561.75        2,640       144.01    FY      311.41    FY     198.72    6M    0.55    FY    0.35    6M         8.48       6.64      321.79      0.57     0.14      3.41    1.38
  Three Acre Farms                   D       54.50           1.60         23.55        1,283       229.08    FY      157.52    FY      68.00    9M    6.69    FY    2.89    9M         8.15      14.15       37.75      1.60      -       35.18    1.55

  CHEMICALS & PHAMACEUTICALS                                                             Sector Index =        7,351.51                 WoW Change = 2.6%                       Sector PE = 7.9                                  Sector PBV = 1.2
                                            Price        WoW           No. of        M.CAP                                                                                                              Cash      Cash Per   DPS
                                      F                                                                      Net Profit (SLRs. Mn)                        EPS (SLRs.)                   PER (x)                                           NAV     PBV
            COMPANY                         SLRs        Change         shares        SLRs.                                                                                                             Balance     Share    Last FY
                                      Y                                                                                                                                                                                                  (SLRs)    (x)
                                            4-Jan       in Price        (Mn)          Mn          2010/11            2011/12          2012/13         11/12         12/13           11/12   12/13 (F) (SLRs.Mn) (SLRs.) (SLRs.)
  Chemanex                           M        80.00          5.00         15.75        1,260       36.93 FY           5.97 FY           4.57 6M       0.38    FY    0.29    6M       211.20   137.86       93.65      5.95     1.50       80.60     0.99
  CIC                                M        65.00          1.80         72.90        5,930      926.55 FY         916.47 FY          23.55 6M       9.67    FY    0.25    6M         6.72   130.79 (8,314.51)     (87.73)    3.20       76.36     0.85
  CIC (X)                            M        54.50         (0.70)        21.87                                                                       9.67    FY    0.25               5.64   109.66                (87.73)    3.20       76.36     0.71
  Haycarb                            M       175.00          0.00         29.71        5,200       505.09    FY     539.04     FY    422.39     6M   18.14    FY   14.22    6M         9.65     6.16 (1,043.35)     (35.12)    5.50      123.20     1.42
  Lankem Ceylon                      M       171.90         11.20         24.00        4,126     1,131.11    FY     552.21     FY    (83.84)    6M   23.01    FY   (3.49)   6M         7.47   (24.60)    (932.33)   (38.85)    2.50      153.92     1.12


  CONSTRUCTION & ENGINEERING                                                             Sector Index =        2,745.02                 WoW Change = 5.1%                       Sector PE = 13.8                                 Sector PBV = 1.6
                                            Price        WoW           No. of        M.CAP                                                                                                               Cash     Cash Per   DPS
                                      F                                                                      Net Profit (SLRs. Mn)                        EPS (SLRs.)                   PER (x)                                           NAV     PBV
            COMPANY                         SLRs        Change         shares        SLRs.                                                                                                             Balance     Share    Last FY
                                      Y                                                                                                                                                                                                  (SLRs)    (x)
                                            4-Jan       in Price        (Mn)          Mn           2010/11           2011/12          2012/13         11/12         12/13           11/12   12/13 (F) (SLRs.Mn) (SLRs.) (SLRs.)
  Dockyard                           D       225.00         10.00         71.86       16,168     2,080.74    FY    1,804.00    FY   1,538.17    9M   25.10    FY   21.41    9M         8.96      7.88   3,872.03     53.88     6.00      140.53     1.60
  Lankem Development                 M         7.50          0.00         60.00          450       (27.01)   FY     (470.13)   FY      (8.79)   6M   (7.84)   FY   (0.15)   6M        (0.96) (25.61)     (226.04)    (3.77)     -         14.02     0.53
  MTD Walkers                        M        28.00          1.60        114.36        3,202      (244.69)   FY      129.14    FY      40.65    6M    1.13    FY    0.36    6M        24.79     39.39 (1,006.37)     (8.80)     -         31.79     0.88


  FOOTWEAR & TEXTILE                                                                     Sector Index =           837.69                WoW Change = 3.8%                       Sector PE = N/A                                  Sector PBV = 1.7
                                            Price        WoW           No. of        M.CAP                                                                                                               Cash       Cash Per    DPS
                                      F                                                                      Net Profit (SLRs. Mn)                        EPS (SLRs.)                   PER (x)                                           NAV     PBV
            COMPANY                         SLRs        Change         shares        SLRs.                                                                                                              Balance      Share     Last FY
                                      Y                                                                                                                                                                                                  (SLRs)    (x)
                                            4-Jan       in Price        (Mn)          Mn           2010/11            2011/12         2012/13         11/12         12/13           11/12    12/13 (F) (SLRs.Mn) (SLRs.) (SLRs.)
  Ceylon Leather Products            M        80.00          2.10         34.23        2,739       106.94 FY          91.87 FY         43.98 6M       2.68    FY    1.28    6M        29.81     31.13      180.75       5.28      1.00    87.18     0.92
  Hayleys MGT                        M        12.00          0.50        152.34        1,828      (799.53) FY       (872.65) FY       (85.11) 6M     (5.73)   FY   (0.56)   6M        (2.09) (10.74) (1,321.17)        (8.67)     0.83    12.51     0.96
  Odel                               M        20.50          0.80        272.13        5,579
                                                                                        ,          208.91 FY         202.01 FY        104.14 6M       0.74    FY    0.38    6M        27.62     26.79     (
                                                                                                                                                                                                          (642.11))    (
                                                                                                                                                                                                                       (2.36))    0.50    16.60     1.24
  Kuruwita Textile                   M        21.30          1.00         25.00           533     (341.08) FY       (204.32) FY      (111.91) 6M     (8.17)   FY   (4.48)   6M        (2.61)    (2.38)    (927.12)    (37.08)     1.00    34.72     0.61

                                                                                                                     Fundamental Analysis Division
Note:Forward PER is arrived at based on the annualised EPS adjusted for any exceptional items.                     Capital TRUST Research (Pvt) Ltd.                                                                                                     ‐  2 ‐
HOTELS                                                                                 Sector Index =           3,618.97             WoW Change = 1.8%                         Sector PE = 37.9                                 Sector PBV = 2.1
                                            Price        WoW           No. of        M.CAP                                                                                                                  Cash    Cash Per  DPS
                                      F                                                                      Net Profit (SLRs. Mn)                       EPS (SLRs.)                    PER (x)                                            NAV     PBV
            COMPANY                         SLRs        Change         shares        SLRs.                                                                                                                 Balance   Share   Last FY
                                      Y                                                                                                                                                                                                   (SLRs)    (x)
                                            4-Jan       in Price        (Mn)          Mn           2010/11           2011/12         2012/13          11/12          12/13           11/12      12/13 (F) (SLRs.Mn) (SLRs.) (SLRs.)
  City Hotels
  Asian Hotels                       M        75.90          0.90        442.78       33,607     1,774.52    FY    2,150.57    FY    972.12    6M    4.86     FY    2.20     6M        15.63      17.29    2,119.00      4.79      4.00    33.03     2.30
  Galadari                           D        14.10         (0.10)       182.43        2,572         2.24    FY     (266.05)   FY   (646.34)   9M   (1.46)    FY   (3.54)    9M        (9.67)     (2.98)     766.99      4.20       -       3.00     4.70
  Renuka City Hotel                  M       240.00          0.00          7.00        1,680       171.77    FY      457.84    FY    155.29    6M   65.41     FY   22.18     6M         3.67       5.41    1,096.80    156.69      6.00   310.30     0.77
  Hotel Services                     M        17.20          0.00        176.00        3,027        52.70    FY     (189.09)   FY   (203.01)   6M   (1.07)    FY   (1.15)    6M       (16.01)     (7.46)     (35.44)    (0.20)      -       6.96     2.47
  Taj Lanka Hotels                   M        29.80          0.00        139.64        4,161        99.30    FY      124.77    FY    107.72    6M    0.89     FY    0.77     6M        33.35      19.31      452.93      3.24       -      15.88     1.88
  Trans Asia                         M        74.90          1.10        200.00       14,980       659.77    FY      630.55    FY    374.53    6M    3.15     FY    1.87     6M        23.76      20.00      458.29      2.29      2.00    26.05     2.87
  Resorts
  Aitken Spence Hotels               M        75.00          2.30       336.29        25,222     1,034.07    FY    1,395.29    FY    399.16    6M     4.15    FY     1.19    6M        18.08      31.59    2,210.57      6.57      0.70    33.73     2.22
  Browns Beach                       M        18.50          0.40       129.60         2,398        (1.77)   FY      129.02    FY     95.65    6M     1.00    FY     0.74    6M        18.58      12.53    1,994.02     15.39       -      26.16     0.71
  Amaya Leisure                      M        84.00         (1.00)       48.03         4,035       469.72    FY      296.08    FY    164.29    6M     6.16    FY     3.42    6M        13.63      12.28       68.71      1.43      6.00    47.40     1.77
  Eden                               M        35.00          0.00        52.80         1,848       101.46    FY      145.96    FY     41.35    6M     2.76    FY     0.78    6M        12.66      22.34      289.48      5.48      0.20    29.44     1.19
  Hunas Falls                        M        60.00         (3.00)        5.63            338       14.53    FY       19.50    FY     18.85    6M     3.47    FY     3.35    6M        17.31       8.95       28.55      5.07      0.50    19.28     3.11
  Keels Hotels                       M        13.80          0.10     1,456.15        20,095       523.94    FY    1,105.27    FY    156.85    6M     0.76    FY     0.11    6M        18.18      64.06     (423.55)    (0.29)     0.30     9.31     1.48
  Marawila Resorts                   M         7.40          0.00       122.50            907       19.21    FY       14.96    FY     (5.26)   6M     0.12    FY    (0.04)   6M        60.60     (86.19)      23.29      0.19       -       7.07     1.05
  Mahaweli Reach                     M        21.20          0.40        47.07            998       46.61    FY        7.95    FY     48.74    6M     0.17    FY     1.04    6M       125.58      10.24        0.67      0.01       -      19.02     1.11
     g
  Pegasus                            M        42.80          2.80        30.39          ,
                                                                                       1,301        48.85    FY      112.49    FY     38.68    6M     3.70    FY     1.27    6M        11.56      16.82       62.84      2.07      0.50    44.11     0.97
  Citrus Leisure                     M        26.90          0.60        96.48         2,595        14.84    FY       (9.52)   FY    (17.42)   6M    (0.10)   FY    (0.18)   6M      (272.63)    (74.50)    (314.27)    (3.26)      -      30.58     0.88
  Royal Palms Beach                  M        46.00          3.00        50.00         2,300       108.33    FY      126.28    FY     15.72    6M     2.53    FY     0.31    6M        18.21      73.15       23.00      0.46      0.80    28.84     1.60
  Hotels Corp.                       M        21.50         (1.00)      171.83         3,694        40.62    FY       27.77    FY      1.98    6M     0.16    FY     0.01    6M       133.01     935.25      (63.31)    (0.37)      -      34.30     0.63
  Palm Garden*                       M       155.00         18.90        14.29         2,215        15.31    FY     (993.41)   FY   (416.08)   6M   (69.51)   FY   (29.11)   6M        (2.23)     (2.66)       6.83      0.48       -     175.22     0.88
  Light House                        M        53.50          4.50        46.00         2,461        60.48    FY      109.58    FY     26.35    6M     2.38    FY     0.57    6M        22.46      46.71      108.95      2.37      2.00    50.58     1.06
  Fortress                           M        16.50          0.20       110.89         1,830        84.40    FY      119.02    FY     35.35    6M     1.07    FY     0.32    6M        15.37      25.88       86.17      0.78       -       7.07     2.33
  Dolphin Hotels                     M        36.00         (0.50)       31.62         1,138        20.67    FY       91.04    FY     54.98    6M     2.88    FY     1.74    6M        12.50      10.35       23.91      0.76      1.50    27.93     1.29
  Sigiriya Village                   M        70.00          7.30         9.00            630       27.71    FY       40.47    FY     10.88    6M     4.50    FY     1.21    6M        15.57      28.94        7.75      0.86      2.00    58.05     1.21
  Hotel Sigiriya                     M        84.80          3.80         5.86            497       14.97    FY       46.87    FY     24.14    6M     8.00    FY     4.12    6M        10.60      10.29       12.70      2.17      5.00    38.10     2.23
  Serendib Hotels                    M        24.00          0.50        75.51         2,468       116.50    FY       30.09    FY     36.26    6M     0.27    FY     0.33    6M        88.95      36.91       78.75      0.71       -      14.09     1.70
  Serendib Hotels (X)                M        18.20          0.40        36.01                                                                        0.27    FY     0.33    -         67.45      27.99                  0.71       -      14.09     1.29
  Tangerine Beach Hotel              M        84.00          3.60        20.00         1,680       73.99     FY     127.84     FY     27.02    6M     6.39    FY     1.35    6M        13.14      31.09       15.24      0.76      0.50   101.07     0.83
  *During December 2012 Riverina Hotels PLC was amalgamated with Palm Garden Hotels PLC. All the assets and liabilities of Palm Garden are adjusted for the transaction.

  HEALTH CARE                                                                            Sector Index =           588.35               WoW Change = 1.1%                         Sector PE = 35.9                                 Sector PBV = 2.3
                                            Price        WoW           No. of        M.CAP                                                                                                                  Cash      Cash Per   DPS
                                      F                                                                      Net Profit (SLRs. Mn)                       EPS (SLRs.)                    PER (x)                                            NAV     PBV
            COMPANY                         SLRs        Change         shares        SLRs.                                                                                                                 Balance     Share    Last FY
                                      Y                                                                                                                                                                                                   (SLRs)    (x)
                                            4-Jan       in Price        (Mn)          Mn           2010/11           2011/12         2012/13         11/12           12/13           11/12      12/13 (F) (SLRs.Mn) (SLRs.) (SLRs.)
  Asiri Surgical                     M         9.40          0.20       528.46         4,968       267.23 FY        506.92 FY        214.91 6M       0.96     FY     0.41    6M         9.80       11.56     (219.19)    (0.41)    0.26     7.43     1.27
  Asiri Central                      M       226.00         (3.00)       22.33         5,047      (176.52) FY       110.61 FY        (38.10) 6M      4.95     FY    (1.71)   6M        45.63      (66.23)     (13.67)    (0.61)     -      88.10     2.57
  Asiri Hospitals                    M        11.00         (0.10)    1,099.09        12,090       190.80 FY        600.23 FY        288.44 6M       0.55     FY     0.26    6M        20.14       20.96 (1,081.46)      (0.98)    0.21     5.98     1.84
  Ceylon Hospitals                   M        92.00          0.90        25.53         2,933       128.04 FY        251.16 FY        130.00 6M       7.41     FY     3.84    6M        12.41       11.99     (160.83)    (4.75)    2.00    73.71     1.25
  Ceylon Hospitals (X)               M        70.00          3.00         8.35                                                                       7.41     FY     3.84    -          9.44        9.12                 (4.75)    2.00    73.71     0.95
  Lanka Hospials                     D        40.70          1.40       223.73         9,106       289.14    FY     438.10     FY    285.18    9M    1.96     FY     1.27    9M        20.78       23.95      761.26      3.40     0.50    15.72     2.59
  Nawaloka                           M         3.10          0.10     1,409.51         4,369     1,070.72    FY     270.69     FY    285.26    6M    0.19     FY     0.20    6M        16.14        7.66     (374.37)    (0.27)    0.05     2.43     1.28


                                                                                                                     Fundamental Analysis Division
Note:Forward PER is arrived at based on the annualised EPS adjusted for any exceptional items.                     Capital TRUST Research (Pvt) Ltd.                                                                                                      ‐  3 ‐
DIVERSIFIED                                                                            Sector Index =     1,847.24                WoW Change = 1.4%                     Sector PE = 25.2                                 Sector PBV = 2.2
                                            Price        WoW           No. of        M.CAP                                                                                                            Cash     Cash Per   DPS
                                      F                                                                   Net Profit (SLRs. Mn)                    EPS (SLRs.)                   PER (x)                                            NAV     PBV
            COMPANY                         SLRs        Change         shares        SLRs.                                                                                                          Balance     Share    Last FY
                                      Y                                                                                                                                                                                            (SLRs)    (x)
                                            4-Jan       in Price        (Mn)          Mn           2010/11         2011/12       2012/13        11/12        12/13            11/12      12/13 (F) (SLRs.Mn) (SLRs.) (SLRs.)
  Aitken Spence                      M       120.00          0.00       406.00       48,720      2,535.96 FY    3,709.16 FY    1,371.98 6M      9.14    FY   3.38     6M        13.13       17.76 (3,614.51)      (8.90)    1.40    63.82     1.88
  Carsons                            M       440.00          8.20       196.39       86,410      4,540.71 FY    5,762.76 FY    1,337.90 6M     29.34    FY   6.81     6M        14.99       32.29 (6,870.65)     (34.99)    2.00   164.94     2.67
  C T Holdings                       M       129.70          5.70       183.10       23,748        864.03 FY    1,158.90 FY      343.23 6M      6.33    FY   1.87     6M        20.49       34.59 (3,918.85)     (21.40)    2.05    68.89     1.88
  CFLB                               M        35.70          1.20       180.00        6,426      1,146.90 FY    1,286.89 FY      188.13 6M      7.15    FY   1.05     6M         4.99       17.08 (1,044.13)      (5.80)    0.30    32.11     1.11
  Dunamis Capital                    M        12.20         (0.80)      123.00        1,501        780.33 FY     (263.12) FY      10.78 6M     (2.14)   FY   0.09     6M        (5.70)      69.58        4.85      0.04      -       8.97     1.36
  Expolanka Holdings                 M         7.10          0.00     1,954.92       13,880      1,546.85 FY    1,054.79 FY      583.06 6M      0.54    FY   0.30     6M        13.16       11.90    1,346.59      0.69     0.12     4.48     1.59
  Free Lanka Capital Holdings        M         2.70          0.20     1,368.00        3,694        477.48 FY       62.17 FY      203.23 6M      0.05    FY   0.15     6M        59.41        9.09      937.43      0.69     0.05     4.85     0.56
  Hayleys                            M       315.00         10.30        75.00       23,625        677.18 FY    2,519.73 FY      591.56 6M     33.60    FY   7.89     6M         9.38       19.97 (13,192.63) (175.90)      4.00   250.97     1.26
  Hemas Holdings                     M        28.10          1.50       515.29       14,480      1,210.16 FY    1,209.06 FY      722.11 6M      2.35    FY   1.40     6M        11.98       10.03      665.14      1.29     0.50    21.24     1.32
  JKH                                M       219.90          0.50       851.51      187,247      8,245.59 FY    9,775.01 FY    4,070.45 6M     11.48    FY   4.78     6M        19.16       23.00 22,305.89       26.20     3.50    87.92     2.50
  Richard Pieris                     M         7.90          0.10     1,939.24       15,320      1,680.68 FY    2,339.85 FY    1,015.07 6M      1.21    FY   0.52     6M         6.55        7.55     (841.22)    (0.43)    0.30     3.52     2.24
  Softlogic Holdings                 M        11.30          0.50       779.00        8,803        829.25 FY      483.28 FY      204.58 6M      0.62    FY   0.26     6M        18.21       21.51 (1,789.51)      (2.30)    0.13    10.03     1.13
  Sunshine Holdings                  M        29.00          0.20       133.33        3,867        500.20 FY      426.34 FY      282.46 6M      3.20    FY   2.12     6M         9.07        6.84      140.29      1.05     0.30    22.76     1.27
  Vallibel One                       M        19.00          0.50     1,086.56       20,645        578.61 FY    2,024.99 FY      796.53 6M      1.86    FY   0.73     6M        10.19       12.96      878.43      0.81     0.30    28.07     0.68


  INVESTMENT TRUST                                                                       Sector Index =    19,642.97                WoW Change = 1.6%                     Sector PE = 26.0                                 Sector PBV = 1.8
                                            Price        WoW           No. of        M.CAP                                                                                                            Cash     Cash Per   DPS
                                      F                                                                              (SLRs.
                                                                                                          Net Profit (SLRs Mn)                     EPS (SLRs.)
                                                                                                                                                       (SLRs )                   PER (x)                                            NAV     PBV
            COMPANY                         SLRs        Change         shares        SLRs.                                                                                                          Balance     Share    Last FY
                                      Y                                                                                                                                                                                            (SLRs)    (x)
                                            4-Jan       in Price        (Mn)          Mn           2010/11         2011/12        2012/13       11/12         12/13           11/12      12/13 (F) (SLRs.Mn) (SLRs.) (SLRs.)
  Ascot Holdings                     M       180.00         (4.00)         7.99        1,437        47.39 FY      (44.90) FY       22.63 6M    (5.62)   FY    2.83    6M       (32.02)      31.76      (18.97)    (2.38)     -      70.87     2.54
  Ceylon Guardian                    M       183.90         (0.10)        82.10       15,098     2,962.76 FY    1,980.24 FY       474.58 6M    24.12    FY    5.78    6M         7.62       15.91    1,217.99     14.84     2.00   168.92     1.09
  Ceylon Investment                  M        86.00          2.00         98.51        8,472     1,340.62 FY    1,010.49 FY       299.46 6M    10.26    FY    3.04    6M         8.38       14.15      574.01      5.83     1.25    82.28     1.05
  Environmental Resources            M        16.00          1.00        349.37        5,590       443.40 FY      125.91 FY       (18.96) 6M    0.36    FY   (0.05)   6M        44.40     (147.38)     654.15      1.87      -      23.96     0.67
  Renuka Holdings                    M        38.20          1.40         44.52        1,866       618.47 FY      256.39 FY        78.24 6M     5.03    FY    1.54    6M         7.59       12.44      368.15      7.23     0.70    42.40     0.90
  Renuka Holdings (X)                M        25.80          1.30          6.43                                                                 5.03    FY    1.54    -          5.13        8.40                  7.23     0.70    42.40     0.61

  LAND & PROPERTY                                                                        Sector Index =        514.72               WoW Change = 1.7%                     Sector PE = 8.5                                  Sector PBV = 0.8
                                            Price        WoW           No. of        M.CAP                                                                                                          Cash     Cash Per   DPS
                                      F                                                                   Net Profit (SLRs. Mn)                    EPS (SLRs.)                    PER (x)                                           NAV     PBV
            COMPANY                         SLRs        Change         shares        SLRs.                                                                                                        Balance     Share    Last FY
                                      Y                                                                                                                                                                                            (SLRs)    (x)
                                            4-Jan       in Price        (Mn)          Mn          2010/11          2011/12        2012/13       11/12         12/13           11/12    12/13 (F) (SLRs.Mn) (SLRs.) (SLRs.)
  C T Land                           M        26.20          1.50         48.75        1,277      184.22 FY       225.71 FY        80.00 6M     4.63    FY    1.64    6M         5.66       7.98     (47.74)    (0.98)    1.40      49.62     0.53
  Cargo Boat                         M        79.80          1.60         10.20          814      160.96 FY        87.90 FY        51.12 6M     8.62    FY    5.01    6M         9.26       7.96     118.46     11.61     2.00      74.74     1.07
  City Housing & Real Estate         M        16.30          0.40         13.38          218     (117.19) FY        4.21 FY        57.44 6M     0.31    FY    4.29    6M        51.84       1.90      19.23      1.44      -        13.27     1.23
  Colombo Land                       D        36.10          1.00        199.88        7,216      484.70 FY       304.23 FY       (15.51) 9M    1.52    FY   (0.08)   9M        23.72 (348.90)        91.30      0.46      -        18.22     1.98
  East West                          M        15.90          1.10        138.24        2,198        6.85 FY       (54.85) FY       (0.91) 6M   (0.40)   FY   (0.01)   6M       (40.08) (1,205.85)      8.97      0.06      -         9.64     1.65
  Equity One                         M        32.00         (1.00)        40.32        1,290       41.76 FY        81.31 FY        13.18 6M     2.02    FY    0.33    6M        15.87      48.96      22.09      0.55      -        38.75     0.83
  Equity Two                         M        26.90          0.40         31.00          834       29.49 FY        43.17 FY         1.16 6M     1.39    FY    0.04    6M        19.32     360.68      12.05      0.39     0.30      17.77     1.51
  Kelsey Developments                M        15.40         (0.60)        17.43          268      (11.59) FY      (18.17) FY      (30.27) 6M   (1.04)   FY   (1.74)   6M       (14.77)     (4.43)      3.20      0.18      -         4.69     3.29
  Overseas Reality                   D        14.20         (0.10)       843.48       11,977      844.28 FY     2,646.92 FY       444.87 9M     3.14    FY    0.53    9M         4.53      20.19   1,771.31      2.10     0.30      23.48     0.60
  PDL                                D        47.00         (2.70)        66.00        3,102      251.79 FY       306.73 FY       247.85 9M     4.65    FY    3.76    9M        10.11       9.39      48.44      0.73     2.50      32.16     1.46
  Seylan Developments                D         9.90          0.80        147.96        1,465      (27.74) FY       19.43 FY        75.07 9M     0.13    FY    0.51    9M        75.38      14.64      26.58      0.18     0.10      30.28     0.33
  Touchwood                          M         9.50          0.50        106.91        1,016      341.11 FY       104.57 FY       125.25 6M     0.98    FY    1.17    6M         9.71       4.05     123.35      1.15     0.10      29.39     0.32
  York Arcade                        M        17.70          0.70         12.00          212       14.02 FY        16.91 FY         5.96 6M     1.41    FY    0.50    6M        12.56      17.81      22.42      1.87     0.40       9.89     1.79


                                                                                                                  Fundamental Analysis Division
Note:Forward PER is arrived at based on the annualised EPS adjusted for any exceptional items.                  Capital TRUST Research (Pvt) Ltd.                                                                                                  ‐  4 ‐
MANUFACTURING                                                                          Sector Index =        2,658.89                  WoW Change = 2.0%                       Sector PE = 10.1                                 Sector PBV = 1.6
                                            Price        WoW           No. of        M.CAP                                                                                                                   Cash     Cash Per   DPS
                                      F                                                                      Net Profit (SLRs. Mn)                        EPS (SLRs.)                   PER (x)                                            NAV     PBV
             COMPANY                        SLRs        Change         shares        SLRs.                                                                                                                 Balance     Share    Last FY
                                      Y                                                                                                                                                                                                   (SLRs)    (x)
                                            4-Jan       in Price        (Mn)          Mn          2010/11             2011/12         2012/13          11/12         12/13           11/12      12/13 (F) (SLRs.Mn) (SLRs.) (SLRs.)
  ACL                                M        68.20          0.70         59.89        4,085      232.55 FY          503.26 FY        199.32 6M        8.40    FY    3.33    6M         8.12       10.25      (61.64)    (1.03)    0.70    87.32     0.78
  ACL Plastics                       M        99.00         (0.80)         4.21          417       75.31 FY           53.30 FY         28.05 6M       12.65    FY    6.66    6M         7.82        7.43       13.24      3.14     5.25   136.90     0.72
  ACME                               M        15.00          0.10         25.61          384       21.13 FY           13.40 FY        (38.77) 6M       0.52    FY   (1.51)   6M        28.68       (4.95)     133.28      5.20      -      19.71     0.76
  Blue Diamonds                      M         4.30          0.20        103.30          736      (14.21) FY          10.02 FY         (9.18) 6M       0.04    FY   (0.04)   6M       110.19      (60.13)      69.40      0.27      -       1.16     3.71
  Blue Diamonds (X)                  M         1.90          0.00        153.37                                                                        0.04    FY   (0.04)   -         48.69      (26.57)                           -       1.16     1.64
  Bogala Graphite                    D        25.00          1.40         47.32        1,183        70.33    FY        33.16    FY      29.85    9M    0.70    FY    0.63    9M        35.67       29.72       40.42      0.85     0.25     4.30     5.81
  Chevron                            D       205.40          3.00        120.00       24,648     1,501.27    FY     2,000.62    FY   1,716.26    9M   16.67    FY   14.30    9M        12.32       10.77    1,988.28     16.57    11.00    34.62     5.93
  Dankotuwa Porcelain                M        17.50          1.40         72.25        1,264       (16.87)   5Q*      (94.64)   FY      54.87    6M   (1.31)   FY    0.76    6M       (13.36)      11.52      (54.30)    (0.75)     -      10.61     1.65
  Dipped Products                    M       103.10         (6.90)        59.86        6,172       446.61    FY     1,866.63    FY     630.70    9M   31.18    FY   10.54    9M         3.31        4.89 (2,281.47)     (38.11)    6.00    95.48     1.08
  Grain Elevators                    D        59.00          1.10         60.00        3,540       474.87    FY       387.82    FY     361.76    9M    6.46    FY    6.03    9M         9.13       10.62       79.68      1.33     1.00    48.75     1.21
  Kelani Cables                      M        70.80          0.80         21.80        1,543       133.73    FY       284.82    FY     118.03    6M   13.07    FY    5.41    6M         5.42        6.54      (90.67)    (4.16)    2.50    93.01     0.76
  Kelani Tyres                       M        37.10          2.60         80.40        2,983       260.84    FY       299.20    FY     211.29    6M    3.72    FY    2.63    6M         9.97        7.06      (86.03)    (1.07)    1.40    18.95     1.96
  Lanka Ceramic                      M        65.00          5.70         30.00        1,950       254.97    FY       522.71    FY      75.37    6M   17.42    FY    2.51    6M         3.73       12.94     (474.69)   (15.82)    1.10    84.16     0.77
  Lanka Floortiles                   M        65.00          0.10         53.05        3,448       505.07    FY       600.14    FY     213.02    6M   11.31    FY    4.02    6M         5.75        8.09     (246.17)    (4.64)    4.00    53.13     1.22
  Lanka Walltiles                    M        61.00          1.00         54.60        3,331       484.47    FY       751.73    FY     135.28    6M   13.77    FY    2.48    6M         4.43       12.31     (589.25)   (10.79)    4.00    75.06     0.81
  Laxapana Batteries                 M         6.90          0.00         39.00          269         6.40    FY       (73.90)   FY     (45.10)   6M   (1.89)   FY   (1.16)   6M        (3.64)      (2.98)       5.90      0.15      -       3.60     1.92
  Swisstek                           M        14.80          1.70         27.37          405        10.80    FY        20.67    FY     (15.63)   6M    0.76    FY   (0.57)   6M        19.60      (12.96)     (69.60)    (2.54)     -      21.17     0.70
  Piramal Glass                      M         6.10          0.10        950.09        5,796       578.67    FY       686.44    FY     414.07    6M    0.72    FY    0.44    6M         8.44        7.00     (134.29)    (0.14)    0.36     3.44     1.77
  Regnis                             D        60.00         (0.60)        11.27          676        71.81    FY        83.27    FY      64.48    9M    7.39    FY    5.72    9M         8.12        7.86      (51.89)    (4.60)    2.57    61.40     0.98
  Royal Ceramic                      M        99.00          5.00        110.79       10,968     1,441.20    FY     1,958.43    FY     681.14    6M   17.68    FY    6.15    6M         5.60        8.05     (912.11)    (8.23)    3.25    69.64     1.42
  Sierra Cabels                      M         2.70          0.30        537.51        1,451        15.16    FY       107.47    FY      (8.11)   6M    0.20    FY   (0.02)   6M        13.50      (89.44)     (72.40)    (0.13)    0.10     3.29     0.82
  Singer Industries                  D       142.70          7.10          3.85          549       118.17    FY        46.49    FY       5.36    9M   12.09    FY    1.39    9M        11.81       76.79       (2.94)    (0.76)    8.75   207.24     0.69
  Tokyo Cement                       M        28.00          0.00        202.50        7,675       874.01    FY       973.32    FY     134.01    6M    3.20    FY    0.44    6M         8.74       31.73      167.80      0.55     1.30    19.92     1.41
  Tokyo Cement (X)                   M        19.80          0.30        101.25                                                                        3.20    FY    0.44    -          6.18       22.44                  0.55     1.30    19.92     0.99
  * Change in the financial year

  MOTOR                                                                                  Sector Index =       15,577.53                  WoW Change = 1.0%                       Sector PE = 5.3                                  Sector PBV = 1.9
                                            Price        WoW           No. of        M.CAP                                                                                                                  Cash      Cash Per   DPS
                                      F                                                                      Net Profit (SLRs. Mn)                        EPS (SLRs.)                   PER (x)                                            NAV     PBV
             COMPANY                        SLRs        Change         shares        SLRs.                                                                                                                 Balance     Share    Last FY
                                      Y                                                                                                                                                                                                   (SLRs)    (x)
                                           4-Jan        in Price        (Mn)          Mn           2010/11             2011/12         2012/13     11/12             12/13           11/12      12/13 (F) (SLRs.Mn) (SLRs.) (SLRs.)
  Lanka Ashok Leyland                M    1,750.00           0.00          3.62        6,336       648.89 FY        1,206.24 FY        341.23 6M 333.14        FY   94.24    6M         5.25        9.28     (127.56)   (35.23)   60.00   649.34     2.70
  Colonial Motors                    M      145.00         (15.00)         9.12        1,323       231.69 FY        1,161.85 FY        181.82 6M 127.34        FY   19.93    6M         1.14        3.64      302.46     33.15     4.00   290.55     0.50
  DIMO                               M      601.40          (3.60)         8.88        5,338     2,121.75 FY        2,697.33 FY        465.59 6M 303.87        FY   52.45    6M         1.98        5.73 (3,591.93) (404.66)      40.00   863.74     0.70
  Sathosa Motors                     M      225.00          34.00          6.03        1,358       110.51 FY          175.78 FY         77.91 6M  29.13        FY   12.91    6M         7.72        8.71      363.91     60.31     5.00   106.56     2.11
  United Motors                      M       98.50           2.20         67.27        6,626       903.27 FY        2,275.36 FY      1,290.62 6M  33.83        FY   19.19    6M         2.91        2.57      164.96      2.45     9.00    97.37     1.01

  POWER & ENERGY                                                                         Sector Index =            108.45                WoW Change = 2.2%                       Sector PE = 12.4                                 Sector PBV = 1.4
                                            Price        WoW           No. of        M.CAP                                                                                                                Cash     Cash Per   DPS
                                      F                                                                      Net Profit (SLRs. Mn)                        EPS (SLRs.)                    PER (x)                                           NAV     PBV
             COMPANY                        SLRs        Change         shares        SLRs.                                                                                                              Balance     Share    Last FY
                                      Y                                                                                                                                                                                                   (SLRs)    (x)
                                            4-Jan       in Price        (Mn)          Mn          2010/11             2011/12          2012/13         11/12         12/13           11/12   12/13 (F) (SLRs.Mn) (SLRs.) (SLRs.)
  Hemas Power                        M        24.00          1.50        125.20        3,005      425.76 FY          270.33 FY         135.63 6M       2.16    FY    1.08    6M        11.12     11.08    (917.57)    (7.33)    2.00       19.15     1.25
  Lanka IOC                          M        19.50          0.00        532.53       10,384      876.53 FY          905.94 FY       1,374.86 6M       1.70    FY    2.58    6M        11.46      3.78     917.09      1.72      -         21.58     0.90
  Laugfs Gas                         M        26.50          0.80        335.00        9,855      852.70 FY          930.34 FY         427.45 6M       2.40    FY    1.10    6M        11.02     12.00   1,106.57      2.86     1.50       16.16     1.64
  Laugfs Gas (X)                     M        18.80          0.50         52.00                                                                        2.40    FY    1.10    6M         7.82      8.51                 2.86     1.50       16.16     1.16
  Panasian Power                     M         2.90          0.40        500.00        1,450      151.24     FY       80.84     FY     13.69     6M    0.16    FY    0.03    6M        17.94     52.96      55.43      0.11     0.15        1.47     1.97
  Vallibel Power                     M         6.50          0.00        747.11        4,856
                                                                                        ,         422.83     FY      254.07     FY    169.03     6M    0.34    FY    0.23    6M        19.11     14.37      28.44      0.04     0.25        2.66     2.44
  Vidullanka                         M         3.90          0.10        477.27        1,861      166.36     FY       59.13     FY     14.56     6M    0.12    FY    0.03    6M        31.48     63.92      72.03      0.15     0.07        2.28     1.71


                                                                                                                      Fundamental Analysis Division
Note:Forward PER is arrived at based on the annualised EPS adjusted for any exceptional items.                      Capital TRUST Research (Pvt) Ltd.                                                                                                     ‐  5 ‐
INFORMATION TECHNOLOGY                                                                            Sector Index =               113.45                        WoW Change = 5.0%                                  Sector PE = 15.6                                                     Sector PBV = 1.4
                                                 Price          WoW            No. of          M.CAP                                                                                                                                       Cash      Cash Per   DPS
                                          F                                                                                 Net Profit (SLRs. Mn)                                     EPS (SLRs.)                           PER (x)                                                               NAV           PBV
             COMPANY                             SLRs          Change          shares          SLRs.                                                                                                                                      Balance     Share    Last FY
                                          Y                                                                                                                                                                                                                                                      (SLRs)          (x)
                                                 4-Jan         in Price         (Mn)            Mn              2010/11               2011/12              2012/13               11/12              12/13              11/12   12/13 (F) (SLRs.Mn) (SLRs.) (SLRs.)
  E-Channelling                          M          6.30            0.60         122.13             769           8.34 FY             80.21 FY              24.09 6M             0.66     FY        0.20      6M          9.59    15.97       21.53      0.18      -                                 1.10         5.74
  PC House                               M          5.50            0.10         228.93           1,259         178.93 FY             86.87 FY              (3.44) 6M            0.38     FY       (0.02)     6M         14.49 (183.07)     (165.35)    (0.72)    0.25                               6.03         0.91

  PLANTATIONS                                                                                       Sector Index =               825.06                        WoW Change = 2.1%                                  Sector PE = 7.5                                                      Sector PBV = 1.0
                                                 Price          WoW            No. of          M.CAP                                                                                                                                             Cash     Cash Per   DPS
                                          F                                                                                 Net Profit (SLRs. Mn)                                     EPS (SLRs.)                           PER (x)                                                               NAV           PBV
             COMPANY                             SLRs          Change          shares          SLRs.                                                                                                                                           Balance     Share    Last FY
                                          Y                                                                                                                                                                                                                                                      (SLRs)          (x)
                                                 4-Jan         in Price         (Mn)            Mn              2010/11               2011/12              2012/13              11/12              12/13               11/12        12/13 (F) (SLRs.Mn) (SLRs.) (SLRs.)
  Agalawatte                             D         33.00            0.40          25.00             825         164.12 FY            156.75 FY             120.31 9M            6.27      FY       4.81       9M          5.26          5.14      (91.89)    (3.68)    2.50                        40.16          0.82
  Balangoda                              D         39.40            1.40          23.64             931         164.41 FY             16.67 FY             128.96 9M            0.71      FY       5.46       9M         55.86          5.42      192.11      8.13     2.00                        62.32          0.63
  Bogawantalawa                          M         12.50            0.40          83.75           1,047          94.65 FY           (299.07) FY            138.04 6M           (3.57)     FY       1.65       6M         (3.50)         3.79      (10.90)    (0.13)    0.50                        10.00          1.25
  Elpitiya                               M         19.00            0.90          72.87           1,384         363.50 FY             97.03 FY             197.00 6M            1.33      FY       2.70       6M         14.27          3.51      (90.33)    (1.24)    0.36                        22.38          0.85
  Hapugastenne                           D         38.60           (1.40)         46.32           1,788         285.42 FY           (219.04) FY             89.07 9M           (4.73)     FY       1.92       9M         (8.16)        15.05     (120.55)    (2.60)    2.00                        27.15          1.42
  Horana                                 M         26.00            0.90          25.00             650         329.60 FY             83.93 FY              52.60 6M            3.36      FY       2.10       6M          7.74          6.18     (158.37)    (6.33)    1.00                        42.91          0.61
  Kahawatte                              D         33.10           (0.40)         79.89           2,644         328.78 FY             52.79 FY              73.43 9M            0.66      FY       0.92       9M         50.09         27.01     (211.10)    (2.64)     -                          13.81          2.40
  Kegalle                                M        104.00            0.00          25.00           2,600         837.75 FY            681.49 FY             279.66 6M           27.26      FY      11.19       6M          3.82          4.65    2,006.09     80.24     3.00                       126.77          0.82
  Kelani Valley                          D         84.00            4.00          34.00           2,856         320.68 FY            460.49 FY             386.98 9M           13.54      FY      11.38       9M          6.20          5.54      431.13     12.68     5.00                        70.06          1.20
  Kotagala                               M         73.00           (0.80)         32.00           2,336         667.77 FY            438.61 FY             212.54 6M           13.71      FY       6.64       6M          5.33          5.50      (97.62)    (3.05)    2.00                        81.87          0.89
    adu s a
  Madulsima                              D          5 0
                                                   15.70           (0 0)
                                                                   (0.10)          9 00
                                                                                  29.00              55
                                                                                                    455         ( 98)
                                                                                                                (41.98) FY           ( 3 3)
                                                                                                                                     (23.23) FY            ( 3 60) 9
                                                                                                                                                           (73.60) 9M          (0 80)
                                                                                                                                                                               (0.80)     FY      ( 5 )
                                                                                                                                                                                                  (2.54)      9
                                                                                                                                                                                                              9M        ( 9 60)
                                                                                                                                                                                                                        (19.60)        ( 6 )
                                                                                                                                                                                                                                       (4.64)     (95 56)
                                                                                                                                                                                                                                                  (95.56)    (3 30)
                                                                                                                                                                                                                                                             (3.30)     -                          5 0
                                                                                                                                                                                                                                                                                                   57.02          0 8
                                                                                                                                                                                                                                                                                                                  0.28
  Malwatte                               D          4.70            0.10         224.59           1,159         424.22 FY             86.69 FY             310.21 9M            0.35      FY       1.25       9M         13.42          2.81       40.91      0.17     0.05                         8.65          0.54
  Malwatte (X)                           D          4.50            0.20          23.00                                                                                                                       -          12.85          2.69                  0.17     0.05                         8.65          0.52
  Maskeliya                              M         13.00            0.60          53.95             701          42.48      FY      (370.38)      FY        55.73      6M      (6.86)     FY        1.03      6M         (1.89)         6.29     (140.10)    (2.60)     -                          28.92          0.45
  Namunukula                             M         80.30            7.10          23.75           1,907         409.33      FY       374.67       FY       175.69      6M      15.78      FY        7.40      6M          5.09          5.43      176.72      7.44     1.70                        73.18          1.10
  Talawakelle                            D         26.60            2.60          23.75             632         147.44      FY       (92.58)      FY        68.60      9M      (3.90)     FY        2.89      9M         (6.82)         6.91     (107.59)    (4.53)    2.50                        45.26          0.59
  Udupussellawa                          D         29.10            0.00          19.40             565         138.94      FY      (199.07)      FY        54.44      9M     (10.26)     FY        2.81      9M         (2.84)         7.78     (124.57)    (6.42)     -                          15.97          1.82
  Watawala                               M         12.20            0.20         236.67           2,887         642.47      FY       412.59       FY       343.56      6M       1.74      FY        1.45      6M          7.00          4.20       97.11      0.41     0.35                        13.07          0.93

  TELECOMMUNICATIONS                                                                                Sector Index =               163.28                        WoW Change = -0.1%                                 Sector PE = 15.0                                                     Sector PBV = 1.5
                                                 Price          WoW            No. of          M.CAP                                                                                                                                        Cash    Cash Per  DPS
                                          F                                                                                 Net Profit (SLRs. Mn)                                     EPS (SLRs.)                           PER (x)                                                               NAV           PBV
             COMPANY                             SLRs          Change          shares          SLRs.                                                                                                                                      Balance    Share   Last FY
                                          Y                                                                                                                                                                                                                                                      (SLRs)          (x)
                                                 4-Jan         in Price         (Mn)            Mn             2010/11                2011/12             2012/13                11/12              12/13              11/12   12/13 (F) (SLRs.Mn) (SLRs.) (SLRs.)
  Dialog Telekom                         D          8.20            0.00       8,143.78         66,779       5,047.44 FY           5,353.62 FY          5,092.74 9M              0.66     FY        0.63      9M         12.47     9.83    4,772.35     0.59    0.25                                4.45          1.84
  SLT                                    D         43.90           (0.10)      1,804.86         79,233       3,943.00 FY           4,781.00 FY          2,862.00 9M              2.65     FY        1.59      9M         16.57    20.76    4,618.00     2.56    0.85                               30.45          1.44

  TRADING                                                                                           Sector Index =            17,086.00                        WoW Change = 0.9%                                  Sector PE = 13.8                                                     Sector PBV = 1.7
                                                 Price          WoW            No. of          M.CAP                                                                                                                                       Cash      Cash Per   DPS
                                          F                                                                                 Net Profit (SLRs. Mn)                                     EPS (SLRs.)                           PER (x)                                                               NAV           PBV
             COMPANY                             SLRs          Change          shares          SLRs.                                                                                                                                      Balance     Share    Last FY
                                          Y                                                                                                                                                                                                                                                      (SLRs)          (x)
                                                 4-Jan         in Price         (Mn)            Mn             2010/11      2011/12                        2012/13              11/12               12/13              11/12   12/13 (F) (SLRs.Mn) (SLRs.) (SLRs.)
  Brown & Company                        M        128.20            4.00          70.88           9,086      2,188.22 FY 1,177.19 FY                       (29.12) 6M          16.61      FY       (0.41)     6M          7.72 (156.01)     (216.23)    (3.05)    1.32                            202.00          0.63
  C.W. Mackie                            M         76.00           (0.60)         35.99           2,735        254.62 5Q*  383.10 FY                        97.52 6M           10.65      FY        2.71      6M          7.14    14.02      (16.53)    (0.46)    2.00                             47.69          1.59
  Tess Agro                              M          2.70            0.30         180.00             486         20.32 FY    17.66 FY                        (9.14) 6M           0.10      FY       (0.05)     6M         27.53   (26.59)     (50.63)    (0.28)    0.05                              1.67          1.62
  * Change in the financial year
    The information and the opinions contained herein were compiled by Capital TRUST Research (Pvt) Ltd, and are based on information obtained from reliable sources in good faith. However, such information has not been independently verified and no guarantee, representation or warranty expressed or 
    implied is made by Capital TRUST Research (Pvt) Ltd and its related companies as to its accuracy or completeness. This report is not and should not be construed as an offer to sell or a solicitation of an offer to buy any security. Neither Capital TRUST Research (Pvt) Ltd nor its related companies, directors 
    and employees can be held liable whatsoever for any direct or consequential loss arising from any use of this report or the information contained herein. 
             l         b h l l bl h              f                             ll             f            f h               h f                      h


                                                                                                                                      Fundamental Analysis Division
Note:Forward PER is arrived at based on the annualised EPS adjusted for any exceptional items.                                      Capital TRUST Research (Pvt) Ltd.                                                                                                                                                  ‐  6 ‐
TELEPHONE : (011)- 2 174 174   HOTLINE : (011)- 2 174 175     FAX : (011)- 2 174 173   E MAIL : inquiries@capitaltrust.lk

TRADING DIVISION                                                  BOARD OF DIRECTORS
Tushan Wickramasinghe           (011)-2174184    0777-313456      Moksevi Prelis                      (Chairman)
Dakshana Gooneratne             (011)-2174194    0777-360492      Tushan Wickramasinghe               (Managing Director/CEO)
Lawrence David                  (011)-2174164    0777-289331      Sarath Rajapakse                    (Director)
M J M Husni                     (011)-2174102    0773-219503
Sandesh Jayakody                (011)-2174103    0773-733273
Nilantha Perera                 (011)-2174104    0777-715970
Kavin Kodytuakku                (011)-2174105    0777-536870
Saliya Gamagedera               (011)-2174108    0773-219506
Asanka Perera                   (011)-2174109    0773-291847
Rohitha Wickramasinghe          (011)-2174112    0777-536880
Radheeka Pillai                 (011)-2174115    0777-287936
Sajee Perera                    (011)-2174113    0777-287941
Gayan Vithanage                 (011)-2174114    0777-287933
Shanmugassharma Rakesh          (011)-2174117    0777-536877
Rasika Vithanage                (011)-2174118    0777-536898
Danushka Arambegedra            (011)-2174122    0777-270867
Rukshan Perera                  (011)-2174119    0777-536883
Chamila Fernando                (011)-2174121    0777-536887
Laxman Ratnayake                (011)-2174116    0777-287948
Sanjaya Jayasundara             (011)-2174185    0772-015881
Shehan Mendis                   (011)-2174134    0777-305684
Dylan Nonis                     (011)-2174124    0777-560615
Vishva Karunaratne              (011)-2174131    0777-560585
Nilosan Kanagaraj               (011)-2174128    0777-560665
Dilshard Hameed                 (011)-2174132    0773-142242
Anushan Kandasamy               (011)-2174123    0777-722622
Rajitha Elapata                 (011)-2174129    0773-141356
Ruchith Jayathilake             (011)-2174138    0775-696412

KANDY BRANCH
Arjuna Wilbawa                  (081)-2205 486   0773-291846
Suranga Guruge                  (081)-2205
                                (081) 2205 481   0773-291845
                                                 0773 291845
Dasantha Herath                 (081)-2205 493   0773-865305
Roshan Helage                   (081)-2205 483   0773-823507
Mohomed Faizan                  (081)-2205 491   0777-840256
Ananda Wijenayake               (081)-2205 482   0777-840254
FAX                             (081)-2201050

KURUNEGALA BRANCH
Bogala Samaranayake             (037)-2223 863   0773-688604
Dammika Senarathne              (037)-2223 861   0777-560699
Disantha Banneheke              (037)-2223 860   0777-597953
FAX                             (037)-2220859

NEGOMBO BRANCH
Sanjeewa Perera                 (031)-2228470    0773-291848
Sujith Kumara                   (031)-2228471    0773-291849
Narada Abeysinghe               (031)-2228473    0773-833997
Srikanth Anton                  (031)-2228474    0773-219505
FAX                             (031)-2227894

MATARA BRANCH                                                     CUSTOMER SERVICE DIVISION
Venura Gamage                   (041)-2236200    0773-936222      Mohomed Adil                    (011)-2174177     0773-399900
Thusitha Karunaratne            (041)-2236205    0773-865302      Prashani Perera                 (011)-2174167     0773-167777
Prasad Jagoda                   (041)-2236201    0773 596338      Raveesha Karunaratne            (011)-2174168     0773-577761
Prabath Rathnayaka              (041)-2236203    0773-785157      Ruvani Liyanapathirana          (011)-2174190     0777-536882
Anurada Dahanayaka              (041)-2236202    0773-596339
Jagath Rathnayake               (041)-2236204    0773-758304      ACCOUNTS DIVISION
Lasitha Wijewardana             (041)-2236111    0777-354824      Methmal Senivirathne            (011)-2174110     0777-766727
Tharanga Wijeweera              (041)-2236208    0777-359156      Ranjini Jayawardena             (011)-2174142     0773-596336
FAX                             (041)-235644                      Subani Wimalarathne             (011)-2174143     0772-015882
                                                                  Kumari De Alwis                 (011)-2174144     0772-015886
MORATUWA BRANCH
Suneth Fernando                 (011)-2642 516   0773-633533      DOCUMENTATION DIVISION
Anuradha Weerakkody             (011)-2642 517   0777-354760      N.M.A Navaratne                 (011)-2174150     0777-287931
FAX                             (011)-2648747
                                                                  CAPITAL TRUST RESEARCH (PVT) LTD
KALUTARA BRANCH                                                   Charitha Gunasekere             (011)-2174140     0773-865301
Kamal Perera                    (034)-2224657    0773-633531      Shashitha Jayakody              (011)-2174139     0777-361394
Asoka Dharmatilaka              (034)-2224842    0773-865300      Kaushalya Jayathilake                             0778-649496
FAX                             (034)-2224285
                                                                  CAPITAL TRUST INFORMATION TECHNOLOGIES (PVT) LTD
KIRIBATHGODA BRANCH                                               Upul Dissanayake                (011)-2174111     0777-771818
Asiri Perera                    (011)-2918478    0773-692812
Thilina Yahampatharachchi       (011)-2918291    0773-219502      CAPITAL TRUST CREDIT (PVT) LIMITED
FAX                             (011)-2918028                     Savindini Akarawita             (011)-2174151     0777-722265
                                                                  Madusha Gunawardena             (011)-2174153     0775-754078
JAFFNA BRANCH
Jayaroshman Ketheesh            (021)-2219 532   0777-270922

Mais conteúdo relacionado

Mais procurados

Calendar Year 2012 Portofolio
Calendar Year 2012 PortofolioCalendar Year 2012 Portofolio
Calendar Year 2012 PortofolioRoyalGold
 
Bank of baroda_q4_fy10
Bank of baroda_q4_fy10Bank of baroda_q4_fy10
Bank of baroda_q4_fy10mittalmanisha
 
Ubs investment banking challenge campus finals presentation (dillon capital)
Ubs investment banking challenge campus finals presentation (dillon capital)Ubs investment banking challenge campus finals presentation (dillon capital)
Ubs investment banking challenge campus finals presentation (dillon capital)jphil90
 
Pdg Apresentacao 1 Q07 Eng
Pdg Apresentacao 1 Q07 EngPdg Apresentacao 1 Q07 Eng
Pdg Apresentacao 1 Q07 EngPDG Realty
 
How to calculate industry's capm ,pe ratio ggm,
How to calculate industry's capm ,pe ratio ggm,How to calculate industry's capm ,pe ratio ggm,
How to calculate industry's capm ,pe ratio ggm,Komal Bhandare
 
Spectroscopic study of growth and characterisation of l valine
Spectroscopic study of growth and characterisation of l valineSpectroscopic study of growth and characterisation of l valine
Spectroscopic study of growth and characterisation of l valineREVATHIAMBIKA VENUGOPAL
 

Mais procurados (12)

Houston Market Report August 2010
Houston Market Report August 2010Houston Market Report August 2010
Houston Market Report August 2010
 
Calendar Year 2012 Portofolio
Calendar Year 2012 PortofolioCalendar Year 2012 Portofolio
Calendar Year 2012 Portofolio
 
Bank of baroda_q4_fy10
Bank of baroda_q4_fy10Bank of baroda_q4_fy10
Bank of baroda_q4_fy10
 
asbury
asburyasbury
asbury
 
Ubs investment banking challenge campus finals presentation (dillon capital)
Ubs investment banking challenge campus finals presentation (dillon capital)Ubs investment banking challenge campus finals presentation (dillon capital)
Ubs investment banking challenge campus finals presentation (dillon capital)
 
Assignment vos
Assignment vosAssignment vos
Assignment vos
 
Pdg Apresentacao 1 Q07 Eng
Pdg Apresentacao 1 Q07 EngPdg Apresentacao 1 Q07 Eng
Pdg Apresentacao 1 Q07 Eng
 
Pi Financials Mar 2 2009
Pi Financials   Mar  2  2009Pi Financials   Mar  2  2009
Pi Financials Mar 2 2009
 
KBank Daily Update Dec 7
KBank Daily Update Dec 7KBank Daily Update Dec 7
KBank Daily Update Dec 7
 
How to calculate industry's capm ,pe ratio ggm,
How to calculate industry's capm ,pe ratio ggm,How to calculate industry's capm ,pe ratio ggm,
How to calculate industry's capm ,pe ratio ggm,
 
Spectroscopic study of growth and characterisation of l valine
Spectroscopic study of growth and characterisation of l valineSpectroscopic study of growth and characterisation of l valine
Spectroscopic study of growth and characterisation of l valine
 
Cipla 20-09-2010
Cipla   20-09-2010Cipla   20-09-2010
Cipla 20-09-2010
 

Destaque

Su linh cam vthtlvn
Su linh cam   vthtlvnSu linh cam   vthtlvn
Su linh cam vthtlvnDONXUAN
 
Chủ nhật, ngày 21 tháng 4 năm 2013
Chủ nhật, ngày 21 tháng 4 năm 2013Chủ nhật, ngày 21 tháng 4 năm 2013
Chủ nhật, ngày 21 tháng 4 năm 2013DONXUAN
 
Chủ nhật, ngày 28 tháng 4 năm 2013
Chủ nhật, ngày 28 tháng 4 năm 2013Chủ nhật, ngày 28 tháng 4 năm 2013
Chủ nhật, ngày 28 tháng 4 năm 2013DONXUAN
 
Chủ nhậ14
Chủ nhậ14Chủ nhậ14
Chủ nhậ14DONXUAN
 
Chủ nhật
Chủ nhậtChủ nhật
Chủ nhậtDONXUAN
 
Incorporating an opening title sequence (grand prix) powerpoint
Incorporating an opening title sequence (grand prix) powerpointIncorporating an opening title sequence (grand prix) powerpoint
Incorporating an opening title sequence (grand prix) powerpointFee_Fee
 
CHẲNG ĐƯỢC MAY MẮN
CHẲNG ĐƯỢC MAY MẮN CHẲNG ĐƯỢC MAY MẮN
CHẲNG ĐƯỢC MAY MẮN DONXUAN
 
Chủ nhật, ngày 12 thang 5
Chủ nhật, ngày 12 thang 5Chủ nhật, ngày 12 thang 5
Chủ nhật, ngày 12 thang 5DONXUAN
 
Kt nhập môn tuần 3 1
Kt nhập môn tuần 3 1Kt nhập môn tuần 3 1
Kt nhập môn tuần 3 1DONXUAN
 
Feliz cumpleaños mi amor
Feliz cumpleaños mi amorFeliz cumpleaños mi amor
Feliz cumpleaños mi amorPollo Vr
 
Thong diep cua_yeu_thuong
Thong diep cua_yeu_thuongThong diep cua_yeu_thuong
Thong diep cua_yeu_thuongDONXUAN
 
Từ đấng tạo hoá đến chúa giê xu christ
Từ đấng tạo hoá đến chúa giê xu christTừ đấng tạo hoá đến chúa giê xu christ
Từ đấng tạo hoá đến chúa giê xu christDONXUAN
 

Destaque (17)

Doc3 (2)
Doc3 (2)Doc3 (2)
Doc3 (2)
 
Amal _Al Beiti CV
Amal _Al Beiti CVAmal _Al Beiti CV
Amal _Al Beiti CV
 
Su linh cam vthtlvn
Su linh cam   vthtlvnSu linh cam   vthtlvn
Su linh cam vthtlvn
 
Chủ nhật, ngày 21 tháng 4 năm 2013
Chủ nhật, ngày 21 tháng 4 năm 2013Chủ nhật, ngày 21 tháng 4 năm 2013
Chủ nhật, ngày 21 tháng 4 năm 2013
 
Chủ nhật, ngày 28 tháng 4 năm 2013
Chủ nhật, ngày 28 tháng 4 năm 2013Chủ nhật, ngày 28 tháng 4 năm 2013
Chủ nhật, ngày 28 tháng 4 năm 2013
 
Chủ nhậ14
Chủ nhậ14Chủ nhậ14
Chủ nhậ14
 
Chủ nhật
Chủ nhậtChủ nhật
Chủ nhật
 
Incorporating an opening title sequence (grand prix) powerpoint
Incorporating an opening title sequence (grand prix) powerpointIncorporating an opening title sequence (grand prix) powerpoint
Incorporating an opening title sequence (grand prix) powerpoint
 
CHẲNG ĐƯỢC MAY MẮN
CHẲNG ĐƯỢC MAY MẮN CHẲNG ĐƯỢC MAY MẮN
CHẲNG ĐƯỢC MAY MẮN
 
ตรุษจีน
ตรุษจีนตรุษจีน
ตรุษจีน
 
Chủ nhật, ngày 12 thang 5
Chủ nhật, ngày 12 thang 5Chủ nhật, ngày 12 thang 5
Chủ nhật, ngày 12 thang 5
 
Foot craft by park avenue
Foot craft by park avenueFoot craft by park avenue
Foot craft by park avenue
 
Kt nhập môn tuần 3 1
Kt nhập môn tuần 3 1Kt nhập môn tuần 3 1
Kt nhập môn tuần 3 1
 
Feliz cumpleaños mi amor
Feliz cumpleaños mi amorFeliz cumpleaños mi amor
Feliz cumpleaños mi amor
 
Thong diep cua_yeu_thuong
Thong diep cua_yeu_thuongThong diep cua_yeu_thuong
Thong diep cua_yeu_thuong
 
Candle Production
Candle ProductionCandle Production
Candle Production
 
Từ đấng tạo hoá đến chúa giê xu christ
Từ đấng tạo hoá đến chúa giê xu christTừ đấng tạo hoá đến chúa giê xu christ
Từ đấng tạo hoá đến chúa giê xu christ
 

Semelhante a Key performance indicators 04 01 2013

081121 eicher valuation(1)
081121 eicher valuation(1)081121 eicher valuation(1)
081121 eicher valuation(1)Tanesh Gagnani
 
Silver river manufacturing company
Silver river manufacturing companySilver river manufacturing company
Silver river manufacturing companyPawan Kawan
 
Saudi economy 2012
Saudi economy  2012Saudi economy  2012
Saudi economy 2012Gale Pooley
 
Copy of copy of neri soverdollars 1
Copy of copy of neri soverdollars 1Copy of copy of neri soverdollars 1
Copy of copy of neri soverdollars 1joanwafa
 
ACC Q1FY15: Earnings mildly below expectation; outlook remains strong
 ACC Q1FY15: Earnings mildly below expectation; outlook remains strong ACC Q1FY15: Earnings mildly below expectation; outlook remains strong
ACC Q1FY15: Earnings mildly below expectation; outlook remains strongIndiaNotes.com
 
Fundamental Equity Analysis - World Gold Miners
Fundamental Equity Analysis - World Gold MinersFundamental Equity Analysis - World Gold Miners
Fundamental Equity Analysis - World Gold MinersBCV
 
Epgp0 macr group assignment - term v - group 4
Epgp0 macr  group assignment - term v - group 4Epgp0 macr  group assignment - term v - group 4
Epgp0 macr group assignment - term v - group 4Rajendra Inani
 
MBL Infrastructure IPO
MBL Infrastructure IPOMBL Infrastructure IPO
MBL Infrastructure IPOKunal
 
Venture Capitalist competition Analysis Team Lollapalooza
Venture Capitalist competition Analysis Team LollapaloozaVenture Capitalist competition Analysis Team Lollapalooza
Venture Capitalist competition Analysis Team Lollapaloozadoshihardik
 
capital one Printer Friendly Version of the Financial Supplement
capital one Printer Friendly Version of the Financial Supplementcapital one Printer Friendly Version of the Financial Supplement
capital one Printer Friendly Version of the Financial Supplementfinance13
 

Semelhante a Key performance indicators 04 01 2013 (20)

Finalaya weekly wrap_05oct2012
Finalaya weekly wrap_05oct2012Finalaya weekly wrap_05oct2012
Finalaya weekly wrap_05oct2012
 
081121 eicher valuation(1)
081121 eicher valuation(1)081121 eicher valuation(1)
081121 eicher valuation(1)
 
Silver river manufacturing company
Silver river manufacturing companySilver river manufacturing company
Silver river manufacturing company
 
Finalaya weekly wrap_16nov2012
Finalaya weekly wrap_16nov2012Finalaya weekly wrap_16nov2012
Finalaya weekly wrap_16nov2012
 
Saudi economy 2012
Saudi economy  2012Saudi economy  2012
Saudi economy 2012
 
Copy of copy of neri soverdollars 1
Copy of copy of neri soverdollars 1Copy of copy of neri soverdollars 1
Copy of copy of neri soverdollars 1
 
Finalaya weekly wrap_12apr2013
Finalaya weekly wrap_12apr2013Finalaya weekly wrap_12apr2013
Finalaya weekly wrap_12apr2013
 
Titan Industries
Titan Industries Titan Industries
Titan Industries
 
ACC Q1FY15: Earnings mildly below expectation; outlook remains strong
 ACC Q1FY15: Earnings mildly below expectation; outlook remains strong ACC Q1FY15: Earnings mildly below expectation; outlook remains strong
ACC Q1FY15: Earnings mildly below expectation; outlook remains strong
 
Fundamental Equity Analysis - World Gold Miners
Fundamental Equity Analysis - World Gold MinersFundamental Equity Analysis - World Gold Miners
Fundamental Equity Analysis - World Gold Miners
 
Finalaya weekly wrap_14sep2012
Finalaya weekly wrap_14sep2012Finalaya weekly wrap_14sep2012
Finalaya weekly wrap_14sep2012
 
Epgp0 macr group assignment - term v - group 4
Epgp0 macr  group assignment - term v - group 4Epgp0 macr  group assignment - term v - group 4
Epgp0 macr group assignment - term v - group 4
 
Wmt Model Template
Wmt Model TemplateWmt Model Template
Wmt Model Template
 
Avalin resp cap7
Avalin resp cap7Avalin resp cap7
Avalin resp cap7
 
MBL Infrastructure IPO
MBL Infrastructure IPOMBL Infrastructure IPO
MBL Infrastructure IPO
 
Venture Capitalist competition Analysis Team Lollapalooza
Venture Capitalist competition Analysis Team LollapaloozaVenture Capitalist competition Analysis Team Lollapalooza
Venture Capitalist competition Analysis Team Lollapalooza
 
Daily report
Daily reportDaily report
Daily report
 
capital one Printer Friendly Version of the Financial Supplement
capital one Printer Friendly Version of the Financial Supplementcapital one Printer Friendly Version of the Financial Supplement
capital one Printer Friendly Version of the Financial Supplement
 
Ppt ideko spx_team
Ppt ideko spx_teamPpt ideko spx_team
Ppt ideko spx_team
 
Indices 03 apr2013051406
Indices 03 apr2013051406Indices 03 apr2013051406
Indices 03 apr2013051406
 

Último

Dharavi Russian callg Girls, { 09892124323 } || Call Girl In Mumbai ...
Dharavi Russian callg Girls, { 09892124323 } || Call Girl In Mumbai ...Dharavi Russian callg Girls, { 09892124323 } || Call Girl In Mumbai ...
Dharavi Russian callg Girls, { 09892124323 } || Call Girl In Mumbai ...Pooja Nehwal
 
VIP Kolkata Call Girl Serampore 👉 8250192130 Available With Room
VIP Kolkata Call Girl Serampore 👉 8250192130  Available With RoomVIP Kolkata Call Girl Serampore 👉 8250192130  Available With Room
VIP Kolkata Call Girl Serampore 👉 8250192130 Available With Roomdivyansh0kumar0
 
20240429 Calibre April 2024 Investor Presentation.pdf
20240429 Calibre April 2024 Investor Presentation.pdf20240429 Calibre April 2024 Investor Presentation.pdf
20240429 Calibre April 2024 Investor Presentation.pdfAdnet Communications
 
Call Girls In Yusuf Sarai Women Seeking Men 9654467111
Call Girls In Yusuf Sarai Women Seeking Men 9654467111Call Girls In Yusuf Sarai Women Seeking Men 9654467111
Call Girls In Yusuf Sarai Women Seeking Men 9654467111Sapana Sha
 
New dynamic economic model with a digital footprint | European Business Review
New dynamic economic model with a digital footprint | European Business ReviewNew dynamic economic model with a digital footprint | European Business Review
New dynamic economic model with a digital footprint | European Business ReviewAntonis Zairis
 
Call US 📞 9892124323 ✅ Kurla Call Girls In Kurla ( Mumbai ) secure service
Call US 📞 9892124323 ✅ Kurla Call Girls In Kurla ( Mumbai ) secure serviceCall US 📞 9892124323 ✅ Kurla Call Girls In Kurla ( Mumbai ) secure service
Call US 📞 9892124323 ✅ Kurla Call Girls In Kurla ( Mumbai ) secure servicePooja Nehwal
 
fca-bsps-decision-letter-redacted (1).pdf
fca-bsps-decision-letter-redacted (1).pdffca-bsps-decision-letter-redacted (1).pdf
fca-bsps-decision-letter-redacted (1).pdfHenry Tapper
 
Quantitative Analysis of Retail Sector Companies
Quantitative Analysis of Retail Sector CompaniesQuantitative Analysis of Retail Sector Companies
Quantitative Analysis of Retail Sector Companiesprashantbhati354
 
Chapter 2.ppt of macroeconomics by mankiw 9th edition
Chapter 2.ppt of macroeconomics by mankiw 9th editionChapter 2.ppt of macroeconomics by mankiw 9th edition
Chapter 2.ppt of macroeconomics by mankiw 9th editionMuhammadHusnain82237
 
Andheri Call Girls In 9825968104 Mumbai Hot Models
Andheri Call Girls In 9825968104 Mumbai Hot ModelsAndheri Call Girls In 9825968104 Mumbai Hot Models
Andheri Call Girls In 9825968104 Mumbai Hot Modelshematsharma006
 
VVIP Pune Call Girls Katraj (7001035870) Pune Escorts Nearby with Complete Sa...
VVIP Pune Call Girls Katraj (7001035870) Pune Escorts Nearby with Complete Sa...VVIP Pune Call Girls Katraj (7001035870) Pune Escorts Nearby with Complete Sa...
VVIP Pune Call Girls Katraj (7001035870) Pune Escorts Nearby with Complete Sa...Call Girls in Nagpur High Profile
 
Bladex Earnings Call Presentation 1Q2024
Bladex Earnings Call Presentation 1Q2024Bladex Earnings Call Presentation 1Q2024
Bladex Earnings Call Presentation 1Q2024Bladex
 
(DIYA) Bhumkar Chowk Call Girls Just Call 7001035870 [ Cash on Delivery ] Pun...
(DIYA) Bhumkar Chowk Call Girls Just Call 7001035870 [ Cash on Delivery ] Pun...(DIYA) Bhumkar Chowk Call Girls Just Call 7001035870 [ Cash on Delivery ] Pun...
(DIYA) Bhumkar Chowk Call Girls Just Call 7001035870 [ Cash on Delivery ] Pun...ranjana rawat
 
(ANIKA) Budhwar Peth Call Girls Just Call 7001035870 [ Cash on Delivery ] Pun...
(ANIKA) Budhwar Peth Call Girls Just Call 7001035870 [ Cash on Delivery ] Pun...(ANIKA) Budhwar Peth Call Girls Just Call 7001035870 [ Cash on Delivery ] Pun...
(ANIKA) Budhwar Peth Call Girls Just Call 7001035870 [ Cash on Delivery ] Pun...ranjana rawat
 
Best VIP Call Girls Noida Sector 18 Call Me: 8448380779
Best VIP Call Girls Noida Sector 18 Call Me: 8448380779Best VIP Call Girls Noida Sector 18 Call Me: 8448380779
Best VIP Call Girls Noida Sector 18 Call Me: 8448380779Delhi Call girls
 
20240417-Calibre-April-2024-Investor-Presentation.pdf
20240417-Calibre-April-2024-Investor-Presentation.pdf20240417-Calibre-April-2024-Investor-Presentation.pdf
20240417-Calibre-April-2024-Investor-Presentation.pdfAdnet Communications
 
call girls in Nand Nagri (DELHI) 🔝 >༒9953330565🔝 genuine Escort Service 🔝✔️✔️
call girls in  Nand Nagri (DELHI) 🔝 >༒9953330565🔝 genuine Escort Service 🔝✔️✔️call girls in  Nand Nagri (DELHI) 🔝 >༒9953330565🔝 genuine Escort Service 🔝✔️✔️
call girls in Nand Nagri (DELHI) 🔝 >༒9953330565🔝 genuine Escort Service 🔝✔️✔️9953056974 Low Rate Call Girls In Saket, Delhi NCR
 
Call Girls Service Nagpur Maya Call 7001035870 Meet With Nagpur Escorts
Call Girls Service Nagpur Maya Call 7001035870 Meet With Nagpur EscortsCall Girls Service Nagpur Maya Call 7001035870 Meet With Nagpur Escorts
Call Girls Service Nagpur Maya Call 7001035870 Meet With Nagpur Escortsranjana rawat
 
(TANVI) Call Girls Nanded City ( 7001035870 ) HI-Fi Pune Escorts Service
(TANVI) Call Girls Nanded City ( 7001035870 ) HI-Fi Pune Escorts Service(TANVI) Call Girls Nanded City ( 7001035870 ) HI-Fi Pune Escorts Service
(TANVI) Call Girls Nanded City ( 7001035870 ) HI-Fi Pune Escorts Serviceranjana rawat
 

Último (20)

Dharavi Russian callg Girls, { 09892124323 } || Call Girl In Mumbai ...
Dharavi Russian callg Girls, { 09892124323 } || Call Girl In Mumbai ...Dharavi Russian callg Girls, { 09892124323 } || Call Girl In Mumbai ...
Dharavi Russian callg Girls, { 09892124323 } || Call Girl In Mumbai ...
 
Commercial Bank Economic Capsule - April 2024
Commercial Bank Economic Capsule - April 2024Commercial Bank Economic Capsule - April 2024
Commercial Bank Economic Capsule - April 2024
 
VIP Kolkata Call Girl Serampore 👉 8250192130 Available With Room
VIP Kolkata Call Girl Serampore 👉 8250192130  Available With RoomVIP Kolkata Call Girl Serampore 👉 8250192130  Available With Room
VIP Kolkata Call Girl Serampore 👉 8250192130 Available With Room
 
20240429 Calibre April 2024 Investor Presentation.pdf
20240429 Calibre April 2024 Investor Presentation.pdf20240429 Calibre April 2024 Investor Presentation.pdf
20240429 Calibre April 2024 Investor Presentation.pdf
 
Call Girls In Yusuf Sarai Women Seeking Men 9654467111
Call Girls In Yusuf Sarai Women Seeking Men 9654467111Call Girls In Yusuf Sarai Women Seeking Men 9654467111
Call Girls In Yusuf Sarai Women Seeking Men 9654467111
 
New dynamic economic model with a digital footprint | European Business Review
New dynamic economic model with a digital footprint | European Business ReviewNew dynamic economic model with a digital footprint | European Business Review
New dynamic economic model with a digital footprint | European Business Review
 
Call US 📞 9892124323 ✅ Kurla Call Girls In Kurla ( Mumbai ) secure service
Call US 📞 9892124323 ✅ Kurla Call Girls In Kurla ( Mumbai ) secure serviceCall US 📞 9892124323 ✅ Kurla Call Girls In Kurla ( Mumbai ) secure service
Call US 📞 9892124323 ✅ Kurla Call Girls In Kurla ( Mumbai ) secure service
 
fca-bsps-decision-letter-redacted (1).pdf
fca-bsps-decision-letter-redacted (1).pdffca-bsps-decision-letter-redacted (1).pdf
fca-bsps-decision-letter-redacted (1).pdf
 
Quantitative Analysis of Retail Sector Companies
Quantitative Analysis of Retail Sector CompaniesQuantitative Analysis of Retail Sector Companies
Quantitative Analysis of Retail Sector Companies
 
Chapter 2.ppt of macroeconomics by mankiw 9th edition
Chapter 2.ppt of macroeconomics by mankiw 9th editionChapter 2.ppt of macroeconomics by mankiw 9th edition
Chapter 2.ppt of macroeconomics by mankiw 9th edition
 
Andheri Call Girls In 9825968104 Mumbai Hot Models
Andheri Call Girls In 9825968104 Mumbai Hot ModelsAndheri Call Girls In 9825968104 Mumbai Hot Models
Andheri Call Girls In 9825968104 Mumbai Hot Models
 
VVIP Pune Call Girls Katraj (7001035870) Pune Escorts Nearby with Complete Sa...
VVIP Pune Call Girls Katraj (7001035870) Pune Escorts Nearby with Complete Sa...VVIP Pune Call Girls Katraj (7001035870) Pune Escorts Nearby with Complete Sa...
VVIP Pune Call Girls Katraj (7001035870) Pune Escorts Nearby with Complete Sa...
 
Bladex Earnings Call Presentation 1Q2024
Bladex Earnings Call Presentation 1Q2024Bladex Earnings Call Presentation 1Q2024
Bladex Earnings Call Presentation 1Q2024
 
(DIYA) Bhumkar Chowk Call Girls Just Call 7001035870 [ Cash on Delivery ] Pun...
(DIYA) Bhumkar Chowk Call Girls Just Call 7001035870 [ Cash on Delivery ] Pun...(DIYA) Bhumkar Chowk Call Girls Just Call 7001035870 [ Cash on Delivery ] Pun...
(DIYA) Bhumkar Chowk Call Girls Just Call 7001035870 [ Cash on Delivery ] Pun...
 
(ANIKA) Budhwar Peth Call Girls Just Call 7001035870 [ Cash on Delivery ] Pun...
(ANIKA) Budhwar Peth Call Girls Just Call 7001035870 [ Cash on Delivery ] Pun...(ANIKA) Budhwar Peth Call Girls Just Call 7001035870 [ Cash on Delivery ] Pun...
(ANIKA) Budhwar Peth Call Girls Just Call 7001035870 [ Cash on Delivery ] Pun...
 
Best VIP Call Girls Noida Sector 18 Call Me: 8448380779
Best VIP Call Girls Noida Sector 18 Call Me: 8448380779Best VIP Call Girls Noida Sector 18 Call Me: 8448380779
Best VIP Call Girls Noida Sector 18 Call Me: 8448380779
 
20240417-Calibre-April-2024-Investor-Presentation.pdf
20240417-Calibre-April-2024-Investor-Presentation.pdf20240417-Calibre-April-2024-Investor-Presentation.pdf
20240417-Calibre-April-2024-Investor-Presentation.pdf
 
call girls in Nand Nagri (DELHI) 🔝 >༒9953330565🔝 genuine Escort Service 🔝✔️✔️
call girls in  Nand Nagri (DELHI) 🔝 >༒9953330565🔝 genuine Escort Service 🔝✔️✔️call girls in  Nand Nagri (DELHI) 🔝 >༒9953330565🔝 genuine Escort Service 🔝✔️✔️
call girls in Nand Nagri (DELHI) 🔝 >༒9953330565🔝 genuine Escort Service 🔝✔️✔️
 
Call Girls Service Nagpur Maya Call 7001035870 Meet With Nagpur Escorts
Call Girls Service Nagpur Maya Call 7001035870 Meet With Nagpur EscortsCall Girls Service Nagpur Maya Call 7001035870 Meet With Nagpur Escorts
Call Girls Service Nagpur Maya Call 7001035870 Meet With Nagpur Escorts
 
(TANVI) Call Girls Nanded City ( 7001035870 ) HI-Fi Pune Escorts Service
(TANVI) Call Girls Nanded City ( 7001035870 ) HI-Fi Pune Escorts Service(TANVI) Call Girls Nanded City ( 7001035870 ) HI-Fi Pune Escorts Service
(TANVI) Call Girls Nanded City ( 7001035870 ) HI-Fi Pune Escorts Service
 

Key performance indicators 04 01 2013

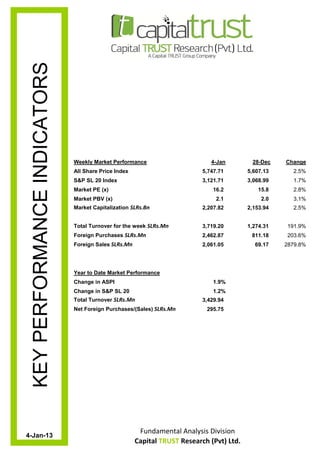
  • 1. KEY PERFORMANC INDICATORS Weekly Market Performance 4-Jan 28-Dec Change All Share Price Index 5,747.71 5,607.13 2.5% S&P SL 20 Index 3,121.71 3,068.99 1.7% Market PE (x) 16.2 15.8 2.8% CE Market PBV (x) 2.1 2.0 3.1% Market Capitalization SLRs.Bn 2,207.82 2,153.94 2.5% Total Turnover for the week SLRs.Mn 3,719.20 1,274.31 191.9% Foreign Purchases SLRs.Mn 2,462.87 811.18 203.6% Foreign Sales SLRs.Mn 2,061.05 69.17 2879.8% Year to Date Market Performance Change in ASPI 1.9% Change in S&P SL 20 1.2% Total Turnover SLRs.Mn 3,429.94 Net Foreign Purchases/(Sales) SLRs.Mn 295.75 Fundamental Analysis Division 4-Jan-13 Capital TRUST Research (Pvt) Ltd.
  • 2. BANKING, FINANCE & INSURANCE Sector Index = 12,646.50 WoW Change = 3.9% Sector PE = 11.0 Sector PBV = 1.7 Price WoW No. of M.CAP Cash Cash Per DPS F Net Profit (SLRs. Mn) EPS (SLRs.) PER (x) NAV PBV COMPANY SLRs Change shares SLRs. Balance Share Last FY Y (SLRs) (x) 4-Jan in Price (Mn) Mn 2010/11 2011/12 2012/13 11/12 12/13 11/12 12/13 (F) (SLRs.Mn) (SLRs.) (SLRs.) Banks Commercial Bank D 104.90 1.90 780.01 86,813 5,507.50 FY 8,094.89 FY 7,622.80 9M 9.71 FY 9.15 9M 10.80 8.60 9,710.30 11.65 4.00 61.41 1.71 Commercial Bank (X) D 93.30 2.80 53.47 9.71 FY 9.15 9M 9.61 7.65 11.65 4.00 61.41 1.52 DFCC M 117.90 6.10 265.10 31,255 5,090.31 FY 2,900.21 FY 1,501.52 6M 10.94 FY 5.66 6M 10.78 10.41 17,976.84 67.81 4.00 98.48 1.20 HNB D 148.50 1.50 317.74 56,256 4,786.77 FY 6,148.84 FY 4,917.30 9M 15.47 FY 12.37 9M 9.60 9.00 16,154.37 40.65 4.50 111.08 1.34 HNB (X) D 113.90 1.70 79.64 15.47 FY 12.37 9M 7.36 6.90 40.65 4.50 111.08 1.03 NDB D 140.90 2.60 164.20 23,136 2,149.53 FY 2,705.54 FY 2,040.92 9M 16.48 FY 12.43 9M 8.55 8.50 12,399.54 75.51 7.50 112.61 1.25 NTB D 59.00 4.00 230.61 13,606 1,084.23 FY 1,533.90 FY 1,459.73 9M 6.65 FY 6.33 9M 8.87 6.99 9,278.36 40.23 2.10 41.57 1.42 Sampath D 201.00 0.00 162.74 32,710 3,484.47 FY 4,150.62 FY 3,897.95 9M 25.51 FY 23.95 9M 7.88 6.29 23,786.20 146.16 4.50 148.23 1.36 Pan Asia D 19.00 0.00 295.04 5,606 361.79 FY 824.01 FY 551.57 9M 2.79 FY 1.87 9M 6.80 7.62 5,946.94 20.16 1.00 13.10 1.45 Seylan D 60.00 4.70 173.33 16,298 1,207.23 FY 1,005.80 FY 1,613.96 9M 2.98 FY 4.77 9M 20.17 9.43 8,679.42 25.67 1.00 56.91 1.05 Seylan (X) D 35.80 0.60 164.75 2.98 FY 4.77 - 12.03 5.62 25.67 1.00 56.91 0.63 Union Bank D 13.90 0.10 349.25 4,855 149.80 FY 294.23 FY 173.13 9M 0.84 FY 0.50 9M 16.50 21.03 3,102.30 8.88 - 15.20 0.91 HDFC D 52.00 1.20 64.71 3,365 246.69 FY 309.65 FY 10.28 9M 4.79 FY 0.16 9M 10.87 245.43 2,962.66 45.78 5.00 36.25 1.43 Finance & Leasing Companies Asia Capital M 30.20 (0.10) 110.00 3,322 988.02 FY 889.95 FY (285.23) 6M 8.09 FY (2.59) 6M 3.73 (5.82) (28.66) (0.26) 6.95 6.92 4.36 Softlogic Finance M 25.60 1.60 37.45 959 68.54 FY 105.63 FY 55.33 6M 2.82 FY 1.48 6M 9.08 8.67 75.64 2.02 1.50 29.77 0.86 CDB M 42.90 1.90 46.30 1,986 528.55 FY 632.77 FY 245.52 6M 11.65 FY 4.52 6M 3.68 4.74 (105.69) (1.95) 1.00 45.67 0.94 CDB (X) M 33.00 2.90 8.01 11.65 FY 4.52 - 2.83 3.65 (1.95) 1.00 45.67 0.72 Central Finance M 176.00 15.40 104.88 18,459 1,827.03 FY 2,676.62 FY 1,581.57 6M 25.52 FY 15.08 6M 6.90 5.84 596.58 5.69 2.50 140.53 1.25 First Capital M 12.50 0.20 101.25 1,266 934.81 FY (170.77) FY 107.13 6M (1.69) FY 1.06 6M (7.41) 5.91 2.52 0.02 2.00 12.34 1.01 Lanka Orix Leasing M 55.00 1.10 475.20 26,136 3,840.23 FY 6,259.86 FY 1,262.06 6M 13.17 FY 2.66 6M 4.18 10.35 (179.89) (0.38) - 43.37 1.27 Lanka Orix Finance M 3.90 0.10 2,800.00 10,920 1,246.09 FY 1,245.79 FY 543.06 6M 0.44 FY 0.19 6M 8.77 10.05 546.07 0.20 - 1.89 2.06 LB Finance M 150.00 2.00 69.26 10,389 1,020.37 FY 1,625.08 FY 862.11 6M 23.46 FY 12.45 6M 6.39 6.03 1,637.70 23.65 5.00 65.30 2.30 MBSL D 20.20 (0.30) 135.00 2,727 492.35 FY 353.14 FY 53.68 9M 2.62 FY 0.40 9M 7.72 38.10 2,001.67 14.83 1.25 22.06 0.92 Nation Lanka Finance M 10.70 1.00 249.91 2,674 (376.22) FY (69.04) FY (181.49) 6M (0.28) FY (0.73) 6M (38.73) (7.37) 283.05 1.13 - 1.74 6.16 People's Finance M 37.50 3.00 74.58 2,797 106.86 FY 345.42 FY 176.67 6M 4.63 FY 2.37 6M 8.10 7.92 1,056.37 14.16 1.14 25.18 1.49 People's Leasing M 14.30 1.10 1,560.00 22,308 2,604.77 FY 4,503.00 FY 1,505.00 6M 2.89 FY 0.96 6M 4.95 7.41 1,229.00 0.79 1.00 12.26 1.17 People's Merchant M 15.00 0.30 67.50 1,013 (61.66) FY 0.51 FY (35.60) 6M 0.01 FY (0.53) 6M 2,000.99 (14.22) (278.00) (4.12) - 13.20 1.14 Sinhaputhra Finance M 80.40 2.60 6.30 506 26.93 FY 54.15 FY 31.19 6M 8.60 FY 4.95 6M 9.35 8.11 83.55 13.27 2.00 123.96 0.65 Singer Finance M 14.10 0.40 165.33 2,331 112.04 FY 225.55 FY 120.62 6M 1.36 FY 0.73 6M 10.34 9.66 (67.54) (0.41) 0.52 10.85 1.30 SMB Leasing D 1.00 0.00 1,191.77 1,499 27.12 FY (35.28) FY 44.37 9M (0.02) FY 0.02 9M (51.19) 30.53 145.89 0.08 - 0.53 1.89 SMB Leasing (X) D 0.50 0.10 614.07 (0.02) FY - - (25.59) 15.26 0.08 - 0.53 0.94 Swarnamahal Financial M 3.60 0.50 500.00 1,800 62.79 FY 140.75 FY 71.65 6M 0.28 FY 0.14 6M 12.79 12.56 (7.98) (0.02) - 1.01 3.56 The Finance M 19.00 0.30 57.97 1,751 (3,830.14) FY (353.40) FY (751.69) 6M (2.24) FY (4.76) 6M (8.49) (2.00) 87.63 1.51 - (29.22) (0.65) The Finance (X) M 6.50 0.20 100.00 (2.24) FY - - (2.91) (0.68) 1.51 - (29.22) (0.22) Vallibel Finance M 32.00 0.90 41.55 1,330 107.71 FY 238.98 FY 128.66 6M 5.75 FY 3.10 6M 5.56 5.17 (48.99) (1.18) 1.00 18.61 1.72 Insurance Companies Amana Takaful D 1.80 0.10 1,000.00 1,800 (35.58) FY (92.19) FY 17.08 6M (0.09) FY 0.02 6M (19.52) 52.69 546.71 0.55 - 0.89 2.03 Ceylinco Insurance D 925.00 108.20 20.00 20,621 961.64 FY 1,372.17 FY 483.51 9M 51.95 FY 18.30 9M 17.81 37.90 309.86 11.73 6.50 425.89 2.17 Ceylinco Insurance (X) D 330.70 (6.20) 6.41 51.95 FY 18.30 9M 6.37 13.55 11.73 6.50 425.89 0.78 Aviva NDB Insurance D 330.00 0.10 30.00 9,900 600.17 FY 691.61 FY 266.43 9M 23.05 FY 8.88 9M 14.31 27.87 421.97 14.07 9.00 116.63 2.83 HNB Assurance D 49.40 (1.40) 50.00 2,470 241.74 FY 274.63 FY 139.88 9M 5.49 FY 2.80 9M 8.99 13.24 83.13 1.66 2.10 32.95 1.50 Janashakthi Insurance D 10.90 10 90 0.20 0 20 363.00 363 00 3,957 3 957 770.35 770 35 FY 636.29 636 29 FY 163.77 163 77 6M 1.75 1 75 FY 0.45 0 45 6M 6.22 6 22 12.08 12 08 239.17 239 17 0.66 0 66 1.00 1 00 8.65 8 65 1.26 1 26 Union Assurance D 83.70 (0.20) 85.71 7,174 511.97 FY 695.59 FY 222.71 9M 8.12 FY 2.60 9M 10.31 24.16 304.36 3.55 5.00 42.81 1.96 Fundamental Analysis Division Note:Forward PER is arrived at based on the annualised EPS adjusted for any exceptional items. Capital TRUST Research (Pvt) Ltd. ‐  1 ‐
  • 3. BEVERAGE, FOOD & TOBACCO Sector Index = 16,350.61 WoW Change = 4.3% Sector PE = 19.4 Sector PBV = 5.9 Price WoW No. of M.CAP Cash Cash Per DPS F Net Profit (SLRs. Mn) EPS (SLRs.) PER (x) NAV PBV COMPANY SLRs Change shares SLRs. Balance Share Last FY Y (SLRs) (x) 4-Jan in Price (Mn) Mn 2010/11 2011/12 2012/13 11/12 12/13 11/12 12/13 (F) (SLRs.Mn) (SLRs.) (SLRs.) Bairaha Farms M 157.00 6.90 16.00 2,512 485.95 FY 432.57 FY 68.54 6M 27.04 FY 4.28 6M 5.81 18.33 120.67 7.54 4.00 100.50 1.56 Cargills M 150.00 4.50 224.00 33,600 1,088.55 FY 1,079.09 FY 326.86 6M 4.82 FY 1.46 6M 31.14 51.40 (3,445.98) (15.38) 2.00 34.22 4.38 Ceylon Tobacco D 859.00 39.90 187.32 160,911 5,097.10 FY 6,568.83 FY 6,192.00 9M 35.07 FY 33.06 9M 24.50 19.49 9,996.00 53.36 38.65 24.20 35.49 Renuka Shaw Wallace M 36.30 0.30 44.89 1,699 161.22 FY 142.03 FY 126.63 6M 3.00 FY 2.68 6M 12.08 6.78 371.02 7.85 1.00 48.20 0.75 Renuka Shaw Wallace (X) M 29.30 (0.20) 2.39 3.00 FY 2.68 - 9.75 5.47 7.85 1.00 48.20 0.61 Ceylon Cold Stores M 132.00 7.10 95.04 12,545 199.54 FY 2,242.41 FY 430.30 6M 23.59 FY 4.53 6M 5.59 14.58 (321.77) (3.39) 4.00 77.17 1.71 Distilleries M 168.90 3.20 300.00 50,670 8,124.04 FY 5,675.37 FY 3,078.41 6M 18.92 FY 10.26 6M 8.93 8.23 (7,777.21) (25.92) 3.00 133.86 1.26 HVA Foods M 14.00 0.70 66.43 930 46.34 FY 9.26 FY 25.54 6M 0.14 FY 0.38 6M 100.40 18.21 52.00 0.78 - 7.48 1.87 Kotmale Holdings M 38.50 (0.30) 31.40 1,209 75.28 FY 83.42 FY 43.46 6M 2.66 FY 1.38 6M 14.49 13.91 30.99 0.99 2.00 21.45 1.79 LMF M 98.40 2.20 40.00 3,936 43.38 FY 187.23 FY 125.47 6M 4.68 FY 3.14 6M 21.02 15.68 (360.23) (9.01) 1.00 53.41 1.84 Lion Brewery M 297.70 12.70 80.00 23,816 832.29 FY 1,262.23 FY 627.95 6M 15.78 FY 7.85 6M 18.87 18.96 2,385.86 29.82 4.00 68.66 4.34 Keels Food Products M 77.90 2.90 25.50 1,986 30.36 FY 129.64 FY 22.73 6M 5.08 FY 0.89 6M 15.32 43.70 620.99 24.35 0.67 57.77 1.35 Nestle D 1,597.60 97.60 53.73 85,832 1,901.12 FY 2,633.29 FY 2,044.12 9M 49.01 FY 38.05 9M 32.59 31.49 (1,374.56) (25.58) 47.50 52.59 30.38 Renuka Agri M 4.70 0.00 561.75 2,640 144.01 FY 311.41 FY 198.72 6M 0.55 FY 0.35 6M 8.48 6.64 321.79 0.57 0.14 3.41 1.38 Three Acre Farms D 54.50 1.60 23.55 1,283 229.08 FY 157.52 FY 68.00 9M 6.69 FY 2.89 9M 8.15 14.15 37.75 1.60 - 35.18 1.55 CHEMICALS & PHAMACEUTICALS Sector Index = 7,351.51 WoW Change = 2.6% Sector PE = 7.9 Sector PBV = 1.2 Price WoW No. of M.CAP Cash Cash Per DPS F Net Profit (SLRs. Mn) EPS (SLRs.) PER (x) NAV PBV COMPANY SLRs Change shares SLRs. Balance Share Last FY Y (SLRs) (x) 4-Jan in Price (Mn) Mn 2010/11 2011/12 2012/13 11/12 12/13 11/12 12/13 (F) (SLRs.Mn) (SLRs.) (SLRs.) Chemanex M 80.00 5.00 15.75 1,260 36.93 FY 5.97 FY 4.57 6M 0.38 FY 0.29 6M 211.20 137.86 93.65 5.95 1.50 80.60 0.99 CIC M 65.00 1.80 72.90 5,930 926.55 FY 916.47 FY 23.55 6M 9.67 FY 0.25 6M 6.72 130.79 (8,314.51) (87.73) 3.20 76.36 0.85 CIC (X) M 54.50 (0.70) 21.87 9.67 FY 0.25 5.64 109.66 (87.73) 3.20 76.36 0.71 Haycarb M 175.00 0.00 29.71 5,200 505.09 FY 539.04 FY 422.39 6M 18.14 FY 14.22 6M 9.65 6.16 (1,043.35) (35.12) 5.50 123.20 1.42 Lankem Ceylon M 171.90 11.20 24.00 4,126 1,131.11 FY 552.21 FY (83.84) 6M 23.01 FY (3.49) 6M 7.47 (24.60) (932.33) (38.85) 2.50 153.92 1.12 CONSTRUCTION & ENGINEERING Sector Index = 2,745.02 WoW Change = 5.1% Sector PE = 13.8 Sector PBV = 1.6 Price WoW No. of M.CAP Cash Cash Per DPS F Net Profit (SLRs. Mn) EPS (SLRs.) PER (x) NAV PBV COMPANY SLRs Change shares SLRs. Balance Share Last FY Y (SLRs) (x) 4-Jan in Price (Mn) Mn 2010/11 2011/12 2012/13 11/12 12/13 11/12 12/13 (F) (SLRs.Mn) (SLRs.) (SLRs.) Dockyard D 225.00 10.00 71.86 16,168 2,080.74 FY 1,804.00 FY 1,538.17 9M 25.10 FY 21.41 9M 8.96 7.88 3,872.03 53.88 6.00 140.53 1.60 Lankem Development M 7.50 0.00 60.00 450 (27.01) FY (470.13) FY (8.79) 6M (7.84) FY (0.15) 6M (0.96) (25.61) (226.04) (3.77) - 14.02 0.53 MTD Walkers M 28.00 1.60 114.36 3,202 (244.69) FY 129.14 FY 40.65 6M 1.13 FY 0.36 6M 24.79 39.39 (1,006.37) (8.80) - 31.79 0.88 FOOTWEAR & TEXTILE Sector Index = 837.69 WoW Change = 3.8% Sector PE = N/A Sector PBV = 1.7 Price WoW No. of M.CAP Cash Cash Per DPS F Net Profit (SLRs. Mn) EPS (SLRs.) PER (x) NAV PBV COMPANY SLRs Change shares SLRs. Balance Share Last FY Y (SLRs) (x) 4-Jan in Price (Mn) Mn 2010/11 2011/12 2012/13 11/12 12/13 11/12 12/13 (F) (SLRs.Mn) (SLRs.) (SLRs.) Ceylon Leather Products M 80.00 2.10 34.23 2,739 106.94 FY 91.87 FY 43.98 6M 2.68 FY 1.28 6M 29.81 31.13 180.75 5.28 1.00 87.18 0.92 Hayleys MGT M 12.00 0.50 152.34 1,828 (799.53) FY (872.65) FY (85.11) 6M (5.73) FY (0.56) 6M (2.09) (10.74) (1,321.17) (8.67) 0.83 12.51 0.96 Odel M 20.50 0.80 272.13 5,579 , 208.91 FY 202.01 FY 104.14 6M 0.74 FY 0.38 6M 27.62 26.79 ( (642.11)) ( (2.36)) 0.50 16.60 1.24 Kuruwita Textile M 21.30 1.00 25.00 533 (341.08) FY (204.32) FY (111.91) 6M (8.17) FY (4.48) 6M (2.61) (2.38) (927.12) (37.08) 1.00 34.72 0.61 Fundamental Analysis Division Note:Forward PER is arrived at based on the annualised EPS adjusted for any exceptional items. Capital TRUST Research (Pvt) Ltd. ‐  2 ‐
  • 4. HOTELS Sector Index = 3,618.97 WoW Change = 1.8% Sector PE = 37.9 Sector PBV = 2.1 Price WoW No. of M.CAP Cash Cash Per DPS F Net Profit (SLRs. Mn) EPS (SLRs.) PER (x) NAV PBV COMPANY SLRs Change shares SLRs. Balance Share Last FY Y (SLRs) (x) 4-Jan in Price (Mn) Mn 2010/11 2011/12 2012/13 11/12 12/13 11/12 12/13 (F) (SLRs.Mn) (SLRs.) (SLRs.) City Hotels Asian Hotels M 75.90 0.90 442.78 33,607 1,774.52 FY 2,150.57 FY 972.12 6M 4.86 FY 2.20 6M 15.63 17.29 2,119.00 4.79 4.00 33.03 2.30 Galadari D 14.10 (0.10) 182.43 2,572 2.24 FY (266.05) FY (646.34) 9M (1.46) FY (3.54) 9M (9.67) (2.98) 766.99 4.20 - 3.00 4.70 Renuka City Hotel M 240.00 0.00 7.00 1,680 171.77 FY 457.84 FY 155.29 6M 65.41 FY 22.18 6M 3.67 5.41 1,096.80 156.69 6.00 310.30 0.77 Hotel Services M 17.20 0.00 176.00 3,027 52.70 FY (189.09) FY (203.01) 6M (1.07) FY (1.15) 6M (16.01) (7.46) (35.44) (0.20) - 6.96 2.47 Taj Lanka Hotels M 29.80 0.00 139.64 4,161 99.30 FY 124.77 FY 107.72 6M 0.89 FY 0.77 6M 33.35 19.31 452.93 3.24 - 15.88 1.88 Trans Asia M 74.90 1.10 200.00 14,980 659.77 FY 630.55 FY 374.53 6M 3.15 FY 1.87 6M 23.76 20.00 458.29 2.29 2.00 26.05 2.87 Resorts Aitken Spence Hotels M 75.00 2.30 336.29 25,222 1,034.07 FY 1,395.29 FY 399.16 6M 4.15 FY 1.19 6M 18.08 31.59 2,210.57 6.57 0.70 33.73 2.22 Browns Beach M 18.50 0.40 129.60 2,398 (1.77) FY 129.02 FY 95.65 6M 1.00 FY 0.74 6M 18.58 12.53 1,994.02 15.39 - 26.16 0.71 Amaya Leisure M 84.00 (1.00) 48.03 4,035 469.72 FY 296.08 FY 164.29 6M 6.16 FY 3.42 6M 13.63 12.28 68.71 1.43 6.00 47.40 1.77 Eden M 35.00 0.00 52.80 1,848 101.46 FY 145.96 FY 41.35 6M 2.76 FY 0.78 6M 12.66 22.34 289.48 5.48 0.20 29.44 1.19 Hunas Falls M 60.00 (3.00) 5.63 338 14.53 FY 19.50 FY 18.85 6M 3.47 FY 3.35 6M 17.31 8.95 28.55 5.07 0.50 19.28 3.11 Keels Hotels M 13.80 0.10 1,456.15 20,095 523.94 FY 1,105.27 FY 156.85 6M 0.76 FY 0.11 6M 18.18 64.06 (423.55) (0.29) 0.30 9.31 1.48 Marawila Resorts M 7.40 0.00 122.50 907 19.21 FY 14.96 FY (5.26) 6M 0.12 FY (0.04) 6M 60.60 (86.19) 23.29 0.19 - 7.07 1.05 Mahaweli Reach M 21.20 0.40 47.07 998 46.61 FY 7.95 FY 48.74 6M 0.17 FY 1.04 6M 125.58 10.24 0.67 0.01 - 19.02 1.11 g Pegasus M 42.80 2.80 30.39 , 1,301 48.85 FY 112.49 FY 38.68 6M 3.70 FY 1.27 6M 11.56 16.82 62.84 2.07 0.50 44.11 0.97 Citrus Leisure M 26.90 0.60 96.48 2,595 14.84 FY (9.52) FY (17.42) 6M (0.10) FY (0.18) 6M (272.63) (74.50) (314.27) (3.26) - 30.58 0.88 Royal Palms Beach M 46.00 3.00 50.00 2,300 108.33 FY 126.28 FY 15.72 6M 2.53 FY 0.31 6M 18.21 73.15 23.00 0.46 0.80 28.84 1.60 Hotels Corp. M 21.50 (1.00) 171.83 3,694 40.62 FY 27.77 FY 1.98 6M 0.16 FY 0.01 6M 133.01 935.25 (63.31) (0.37) - 34.30 0.63 Palm Garden* M 155.00 18.90 14.29 2,215 15.31 FY (993.41) FY (416.08) 6M (69.51) FY (29.11) 6M (2.23) (2.66) 6.83 0.48 - 175.22 0.88 Light House M 53.50 4.50 46.00 2,461 60.48 FY 109.58 FY 26.35 6M 2.38 FY 0.57 6M 22.46 46.71 108.95 2.37 2.00 50.58 1.06 Fortress M 16.50 0.20 110.89 1,830 84.40 FY 119.02 FY 35.35 6M 1.07 FY 0.32 6M 15.37 25.88 86.17 0.78 - 7.07 2.33 Dolphin Hotels M 36.00 (0.50) 31.62 1,138 20.67 FY 91.04 FY 54.98 6M 2.88 FY 1.74 6M 12.50 10.35 23.91 0.76 1.50 27.93 1.29 Sigiriya Village M 70.00 7.30 9.00 630 27.71 FY 40.47 FY 10.88 6M 4.50 FY 1.21 6M 15.57 28.94 7.75 0.86 2.00 58.05 1.21 Hotel Sigiriya M 84.80 3.80 5.86 497 14.97 FY 46.87 FY 24.14 6M 8.00 FY 4.12 6M 10.60 10.29 12.70 2.17 5.00 38.10 2.23 Serendib Hotels M 24.00 0.50 75.51 2,468 116.50 FY 30.09 FY 36.26 6M 0.27 FY 0.33 6M 88.95 36.91 78.75 0.71 - 14.09 1.70 Serendib Hotels (X) M 18.20 0.40 36.01 0.27 FY 0.33 - 67.45 27.99 0.71 - 14.09 1.29 Tangerine Beach Hotel M 84.00 3.60 20.00 1,680 73.99 FY 127.84 FY 27.02 6M 6.39 FY 1.35 6M 13.14 31.09 15.24 0.76 0.50 101.07 0.83 *During December 2012 Riverina Hotels PLC was amalgamated with Palm Garden Hotels PLC. All the assets and liabilities of Palm Garden are adjusted for the transaction. HEALTH CARE Sector Index = 588.35 WoW Change = 1.1% Sector PE = 35.9 Sector PBV = 2.3 Price WoW No. of M.CAP Cash Cash Per DPS F Net Profit (SLRs. Mn) EPS (SLRs.) PER (x) NAV PBV COMPANY SLRs Change shares SLRs. Balance Share Last FY Y (SLRs) (x) 4-Jan in Price (Mn) Mn 2010/11 2011/12 2012/13 11/12 12/13 11/12 12/13 (F) (SLRs.Mn) (SLRs.) (SLRs.) Asiri Surgical M 9.40 0.20 528.46 4,968 267.23 FY 506.92 FY 214.91 6M 0.96 FY 0.41 6M 9.80 11.56 (219.19) (0.41) 0.26 7.43 1.27 Asiri Central M 226.00 (3.00) 22.33 5,047 (176.52) FY 110.61 FY (38.10) 6M 4.95 FY (1.71) 6M 45.63 (66.23) (13.67) (0.61) - 88.10 2.57 Asiri Hospitals M 11.00 (0.10) 1,099.09 12,090 190.80 FY 600.23 FY 288.44 6M 0.55 FY 0.26 6M 20.14 20.96 (1,081.46) (0.98) 0.21 5.98 1.84 Ceylon Hospitals M 92.00 0.90 25.53 2,933 128.04 FY 251.16 FY 130.00 6M 7.41 FY 3.84 6M 12.41 11.99 (160.83) (4.75) 2.00 73.71 1.25 Ceylon Hospitals (X) M 70.00 3.00 8.35 7.41 FY 3.84 - 9.44 9.12 (4.75) 2.00 73.71 0.95 Lanka Hospials D 40.70 1.40 223.73 9,106 289.14 FY 438.10 FY 285.18 9M 1.96 FY 1.27 9M 20.78 23.95 761.26 3.40 0.50 15.72 2.59 Nawaloka M 3.10 0.10 1,409.51 4,369 1,070.72 FY 270.69 FY 285.26 6M 0.19 FY 0.20 6M 16.14 7.66 (374.37) (0.27) 0.05 2.43 1.28 Fundamental Analysis Division Note:Forward PER is arrived at based on the annualised EPS adjusted for any exceptional items. Capital TRUST Research (Pvt) Ltd. ‐  3 ‐
  • 5. DIVERSIFIED Sector Index = 1,847.24 WoW Change = 1.4% Sector PE = 25.2 Sector PBV = 2.2 Price WoW No. of M.CAP Cash Cash Per DPS F Net Profit (SLRs. Mn) EPS (SLRs.) PER (x) NAV PBV COMPANY SLRs Change shares SLRs. Balance Share Last FY Y (SLRs) (x) 4-Jan in Price (Mn) Mn 2010/11 2011/12 2012/13 11/12 12/13 11/12 12/13 (F) (SLRs.Mn) (SLRs.) (SLRs.) Aitken Spence M 120.00 0.00 406.00 48,720 2,535.96 FY 3,709.16 FY 1,371.98 6M 9.14 FY 3.38 6M 13.13 17.76 (3,614.51) (8.90) 1.40 63.82 1.88 Carsons M 440.00 8.20 196.39 86,410 4,540.71 FY 5,762.76 FY 1,337.90 6M 29.34 FY 6.81 6M 14.99 32.29 (6,870.65) (34.99) 2.00 164.94 2.67 C T Holdings M 129.70 5.70 183.10 23,748 864.03 FY 1,158.90 FY 343.23 6M 6.33 FY 1.87 6M 20.49 34.59 (3,918.85) (21.40) 2.05 68.89 1.88 CFLB M 35.70 1.20 180.00 6,426 1,146.90 FY 1,286.89 FY 188.13 6M 7.15 FY 1.05 6M 4.99 17.08 (1,044.13) (5.80) 0.30 32.11 1.11 Dunamis Capital M 12.20 (0.80) 123.00 1,501 780.33 FY (263.12) FY 10.78 6M (2.14) FY 0.09 6M (5.70) 69.58 4.85 0.04 - 8.97 1.36 Expolanka Holdings M 7.10 0.00 1,954.92 13,880 1,546.85 FY 1,054.79 FY 583.06 6M 0.54 FY 0.30 6M 13.16 11.90 1,346.59 0.69 0.12 4.48 1.59 Free Lanka Capital Holdings M 2.70 0.20 1,368.00 3,694 477.48 FY 62.17 FY 203.23 6M 0.05 FY 0.15 6M 59.41 9.09 937.43 0.69 0.05 4.85 0.56 Hayleys M 315.00 10.30 75.00 23,625 677.18 FY 2,519.73 FY 591.56 6M 33.60 FY 7.89 6M 9.38 19.97 (13,192.63) (175.90) 4.00 250.97 1.26 Hemas Holdings M 28.10 1.50 515.29 14,480 1,210.16 FY 1,209.06 FY 722.11 6M 2.35 FY 1.40 6M 11.98 10.03 665.14 1.29 0.50 21.24 1.32 JKH M 219.90 0.50 851.51 187,247 8,245.59 FY 9,775.01 FY 4,070.45 6M 11.48 FY 4.78 6M 19.16 23.00 22,305.89 26.20 3.50 87.92 2.50 Richard Pieris M 7.90 0.10 1,939.24 15,320 1,680.68 FY 2,339.85 FY 1,015.07 6M 1.21 FY 0.52 6M 6.55 7.55 (841.22) (0.43) 0.30 3.52 2.24 Softlogic Holdings M 11.30 0.50 779.00 8,803 829.25 FY 483.28 FY 204.58 6M 0.62 FY 0.26 6M 18.21 21.51 (1,789.51) (2.30) 0.13 10.03 1.13 Sunshine Holdings M 29.00 0.20 133.33 3,867 500.20 FY 426.34 FY 282.46 6M 3.20 FY 2.12 6M 9.07 6.84 140.29 1.05 0.30 22.76 1.27 Vallibel One M 19.00 0.50 1,086.56 20,645 578.61 FY 2,024.99 FY 796.53 6M 1.86 FY 0.73 6M 10.19 12.96 878.43 0.81 0.30 28.07 0.68 INVESTMENT TRUST Sector Index = 19,642.97 WoW Change = 1.6% Sector PE = 26.0 Sector PBV = 1.8 Price WoW No. of M.CAP Cash Cash Per DPS F (SLRs. Net Profit (SLRs Mn) EPS (SLRs.) (SLRs ) PER (x) NAV PBV COMPANY SLRs Change shares SLRs. Balance Share Last FY Y (SLRs) (x) 4-Jan in Price (Mn) Mn 2010/11 2011/12 2012/13 11/12 12/13 11/12 12/13 (F) (SLRs.Mn) (SLRs.) (SLRs.) Ascot Holdings M 180.00 (4.00) 7.99 1,437 47.39 FY (44.90) FY 22.63 6M (5.62) FY 2.83 6M (32.02) 31.76 (18.97) (2.38) - 70.87 2.54 Ceylon Guardian M 183.90 (0.10) 82.10 15,098 2,962.76 FY 1,980.24 FY 474.58 6M 24.12 FY 5.78 6M 7.62 15.91 1,217.99 14.84 2.00 168.92 1.09 Ceylon Investment M 86.00 2.00 98.51 8,472 1,340.62 FY 1,010.49 FY 299.46 6M 10.26 FY 3.04 6M 8.38 14.15 574.01 5.83 1.25 82.28 1.05 Environmental Resources M 16.00 1.00 349.37 5,590 443.40 FY 125.91 FY (18.96) 6M 0.36 FY (0.05) 6M 44.40 (147.38) 654.15 1.87 - 23.96 0.67 Renuka Holdings M 38.20 1.40 44.52 1,866 618.47 FY 256.39 FY 78.24 6M 5.03 FY 1.54 6M 7.59 12.44 368.15 7.23 0.70 42.40 0.90 Renuka Holdings (X) M 25.80 1.30 6.43 5.03 FY 1.54 - 5.13 8.40 7.23 0.70 42.40 0.61 LAND & PROPERTY Sector Index = 514.72 WoW Change = 1.7% Sector PE = 8.5 Sector PBV = 0.8 Price WoW No. of M.CAP Cash Cash Per DPS F Net Profit (SLRs. Mn) EPS (SLRs.) PER (x) NAV PBV COMPANY SLRs Change shares SLRs. Balance Share Last FY Y (SLRs) (x) 4-Jan in Price (Mn) Mn 2010/11 2011/12 2012/13 11/12 12/13 11/12 12/13 (F) (SLRs.Mn) (SLRs.) (SLRs.) C T Land M 26.20 1.50 48.75 1,277 184.22 FY 225.71 FY 80.00 6M 4.63 FY 1.64 6M 5.66 7.98 (47.74) (0.98) 1.40 49.62 0.53 Cargo Boat M 79.80 1.60 10.20 814 160.96 FY 87.90 FY 51.12 6M 8.62 FY 5.01 6M 9.26 7.96 118.46 11.61 2.00 74.74 1.07 City Housing & Real Estate M 16.30 0.40 13.38 218 (117.19) FY 4.21 FY 57.44 6M 0.31 FY 4.29 6M 51.84 1.90 19.23 1.44 - 13.27 1.23 Colombo Land D 36.10 1.00 199.88 7,216 484.70 FY 304.23 FY (15.51) 9M 1.52 FY (0.08) 9M 23.72 (348.90) 91.30 0.46 - 18.22 1.98 East West M 15.90 1.10 138.24 2,198 6.85 FY (54.85) FY (0.91) 6M (0.40) FY (0.01) 6M (40.08) (1,205.85) 8.97 0.06 - 9.64 1.65 Equity One M 32.00 (1.00) 40.32 1,290 41.76 FY 81.31 FY 13.18 6M 2.02 FY 0.33 6M 15.87 48.96 22.09 0.55 - 38.75 0.83 Equity Two M 26.90 0.40 31.00 834 29.49 FY 43.17 FY 1.16 6M 1.39 FY 0.04 6M 19.32 360.68 12.05 0.39 0.30 17.77 1.51 Kelsey Developments M 15.40 (0.60) 17.43 268 (11.59) FY (18.17) FY (30.27) 6M (1.04) FY (1.74) 6M (14.77) (4.43) 3.20 0.18 - 4.69 3.29 Overseas Reality D 14.20 (0.10) 843.48 11,977 844.28 FY 2,646.92 FY 444.87 9M 3.14 FY 0.53 9M 4.53 20.19 1,771.31 2.10 0.30 23.48 0.60 PDL D 47.00 (2.70) 66.00 3,102 251.79 FY 306.73 FY 247.85 9M 4.65 FY 3.76 9M 10.11 9.39 48.44 0.73 2.50 32.16 1.46 Seylan Developments D 9.90 0.80 147.96 1,465 (27.74) FY 19.43 FY 75.07 9M 0.13 FY 0.51 9M 75.38 14.64 26.58 0.18 0.10 30.28 0.33 Touchwood M 9.50 0.50 106.91 1,016 341.11 FY 104.57 FY 125.25 6M 0.98 FY 1.17 6M 9.71 4.05 123.35 1.15 0.10 29.39 0.32 York Arcade M 17.70 0.70 12.00 212 14.02 FY 16.91 FY 5.96 6M 1.41 FY 0.50 6M 12.56 17.81 22.42 1.87 0.40 9.89 1.79 Fundamental Analysis Division Note:Forward PER is arrived at based on the annualised EPS adjusted for any exceptional items. Capital TRUST Research (Pvt) Ltd. ‐  4 ‐
  • 6. MANUFACTURING Sector Index = 2,658.89 WoW Change = 2.0% Sector PE = 10.1 Sector PBV = 1.6 Price WoW No. of M.CAP Cash Cash Per DPS F Net Profit (SLRs. Mn) EPS (SLRs.) PER (x) NAV PBV COMPANY SLRs Change shares SLRs. Balance Share Last FY Y (SLRs) (x) 4-Jan in Price (Mn) Mn 2010/11 2011/12 2012/13 11/12 12/13 11/12 12/13 (F) (SLRs.Mn) (SLRs.) (SLRs.) ACL M 68.20 0.70 59.89 4,085 232.55 FY 503.26 FY 199.32 6M 8.40 FY 3.33 6M 8.12 10.25 (61.64) (1.03) 0.70 87.32 0.78 ACL Plastics M 99.00 (0.80) 4.21 417 75.31 FY 53.30 FY 28.05 6M 12.65 FY 6.66 6M 7.82 7.43 13.24 3.14 5.25 136.90 0.72 ACME M 15.00 0.10 25.61 384 21.13 FY 13.40 FY (38.77) 6M 0.52 FY (1.51) 6M 28.68 (4.95) 133.28 5.20 - 19.71 0.76 Blue Diamonds M 4.30 0.20 103.30 736 (14.21) FY 10.02 FY (9.18) 6M 0.04 FY (0.04) 6M 110.19 (60.13) 69.40 0.27 - 1.16 3.71 Blue Diamonds (X) M 1.90 0.00 153.37 0.04 FY (0.04) - 48.69 (26.57) - 1.16 1.64 Bogala Graphite D 25.00 1.40 47.32 1,183 70.33 FY 33.16 FY 29.85 9M 0.70 FY 0.63 9M 35.67 29.72 40.42 0.85 0.25 4.30 5.81 Chevron D 205.40 3.00 120.00 24,648 1,501.27 FY 2,000.62 FY 1,716.26 9M 16.67 FY 14.30 9M 12.32 10.77 1,988.28 16.57 11.00 34.62 5.93 Dankotuwa Porcelain M 17.50 1.40 72.25 1,264 (16.87) 5Q* (94.64) FY 54.87 6M (1.31) FY 0.76 6M (13.36) 11.52 (54.30) (0.75) - 10.61 1.65 Dipped Products M 103.10 (6.90) 59.86 6,172 446.61 FY 1,866.63 FY 630.70 9M 31.18 FY 10.54 9M 3.31 4.89 (2,281.47) (38.11) 6.00 95.48 1.08 Grain Elevators D 59.00 1.10 60.00 3,540 474.87 FY 387.82 FY 361.76 9M 6.46 FY 6.03 9M 9.13 10.62 79.68 1.33 1.00 48.75 1.21 Kelani Cables M 70.80 0.80 21.80 1,543 133.73 FY 284.82 FY 118.03 6M 13.07 FY 5.41 6M 5.42 6.54 (90.67) (4.16) 2.50 93.01 0.76 Kelani Tyres M 37.10 2.60 80.40 2,983 260.84 FY 299.20 FY 211.29 6M 3.72 FY 2.63 6M 9.97 7.06 (86.03) (1.07) 1.40 18.95 1.96 Lanka Ceramic M 65.00 5.70 30.00 1,950 254.97 FY 522.71 FY 75.37 6M 17.42 FY 2.51 6M 3.73 12.94 (474.69) (15.82) 1.10 84.16 0.77 Lanka Floortiles M 65.00 0.10 53.05 3,448 505.07 FY 600.14 FY 213.02 6M 11.31 FY 4.02 6M 5.75 8.09 (246.17) (4.64) 4.00 53.13 1.22 Lanka Walltiles M 61.00 1.00 54.60 3,331 484.47 FY 751.73 FY 135.28 6M 13.77 FY 2.48 6M 4.43 12.31 (589.25) (10.79) 4.00 75.06 0.81 Laxapana Batteries M 6.90 0.00 39.00 269 6.40 FY (73.90) FY (45.10) 6M (1.89) FY (1.16) 6M (3.64) (2.98) 5.90 0.15 - 3.60 1.92 Swisstek M 14.80 1.70 27.37 405 10.80 FY 20.67 FY (15.63) 6M 0.76 FY (0.57) 6M 19.60 (12.96) (69.60) (2.54) - 21.17 0.70 Piramal Glass M 6.10 0.10 950.09 5,796 578.67 FY 686.44 FY 414.07 6M 0.72 FY 0.44 6M 8.44 7.00 (134.29) (0.14) 0.36 3.44 1.77 Regnis D 60.00 (0.60) 11.27 676 71.81 FY 83.27 FY 64.48 9M 7.39 FY 5.72 9M 8.12 7.86 (51.89) (4.60) 2.57 61.40 0.98 Royal Ceramic M 99.00 5.00 110.79 10,968 1,441.20 FY 1,958.43 FY 681.14 6M 17.68 FY 6.15 6M 5.60 8.05 (912.11) (8.23) 3.25 69.64 1.42 Sierra Cabels M 2.70 0.30 537.51 1,451 15.16 FY 107.47 FY (8.11) 6M 0.20 FY (0.02) 6M 13.50 (89.44) (72.40) (0.13) 0.10 3.29 0.82 Singer Industries D 142.70 7.10 3.85 549 118.17 FY 46.49 FY 5.36 9M 12.09 FY 1.39 9M 11.81 76.79 (2.94) (0.76) 8.75 207.24 0.69 Tokyo Cement M 28.00 0.00 202.50 7,675 874.01 FY 973.32 FY 134.01 6M 3.20 FY 0.44 6M 8.74 31.73 167.80 0.55 1.30 19.92 1.41 Tokyo Cement (X) M 19.80 0.30 101.25 3.20 FY 0.44 - 6.18 22.44 0.55 1.30 19.92 0.99 * Change in the financial year MOTOR Sector Index = 15,577.53 WoW Change = 1.0% Sector PE = 5.3 Sector PBV = 1.9 Price WoW No. of M.CAP Cash Cash Per DPS F Net Profit (SLRs. Mn) EPS (SLRs.) PER (x) NAV PBV COMPANY SLRs Change shares SLRs. Balance Share Last FY Y (SLRs) (x) 4-Jan in Price (Mn) Mn 2010/11 2011/12 2012/13 11/12 12/13 11/12 12/13 (F) (SLRs.Mn) (SLRs.) (SLRs.) Lanka Ashok Leyland M 1,750.00 0.00 3.62 6,336 648.89 FY 1,206.24 FY 341.23 6M 333.14 FY 94.24 6M 5.25 9.28 (127.56) (35.23) 60.00 649.34 2.70 Colonial Motors M 145.00 (15.00) 9.12 1,323 231.69 FY 1,161.85 FY 181.82 6M 127.34 FY 19.93 6M 1.14 3.64 302.46 33.15 4.00 290.55 0.50 DIMO M 601.40 (3.60) 8.88 5,338 2,121.75 FY 2,697.33 FY 465.59 6M 303.87 FY 52.45 6M 1.98 5.73 (3,591.93) (404.66) 40.00 863.74 0.70 Sathosa Motors M 225.00 34.00 6.03 1,358 110.51 FY 175.78 FY 77.91 6M 29.13 FY 12.91 6M 7.72 8.71 363.91 60.31 5.00 106.56 2.11 United Motors M 98.50 2.20 67.27 6,626 903.27 FY 2,275.36 FY 1,290.62 6M 33.83 FY 19.19 6M 2.91 2.57 164.96 2.45 9.00 97.37 1.01 POWER & ENERGY Sector Index = 108.45 WoW Change = 2.2% Sector PE = 12.4 Sector PBV = 1.4 Price WoW No. of M.CAP Cash Cash Per DPS F Net Profit (SLRs. Mn) EPS (SLRs.) PER (x) NAV PBV COMPANY SLRs Change shares SLRs. Balance Share Last FY Y (SLRs) (x) 4-Jan in Price (Mn) Mn 2010/11 2011/12 2012/13 11/12 12/13 11/12 12/13 (F) (SLRs.Mn) (SLRs.) (SLRs.) Hemas Power M 24.00 1.50 125.20 3,005 425.76 FY 270.33 FY 135.63 6M 2.16 FY 1.08 6M 11.12 11.08 (917.57) (7.33) 2.00 19.15 1.25 Lanka IOC M 19.50 0.00 532.53 10,384 876.53 FY 905.94 FY 1,374.86 6M 1.70 FY 2.58 6M 11.46 3.78 917.09 1.72 - 21.58 0.90 Laugfs Gas M 26.50 0.80 335.00 9,855 852.70 FY 930.34 FY 427.45 6M 2.40 FY 1.10 6M 11.02 12.00 1,106.57 2.86 1.50 16.16 1.64 Laugfs Gas (X) M 18.80 0.50 52.00 2.40 FY 1.10 6M 7.82 8.51 2.86 1.50 16.16 1.16 Panasian Power M 2.90 0.40 500.00 1,450 151.24 FY 80.84 FY 13.69 6M 0.16 FY 0.03 6M 17.94 52.96 55.43 0.11 0.15 1.47 1.97 Vallibel Power M 6.50 0.00 747.11 4,856 , 422.83 FY 254.07 FY 169.03 6M 0.34 FY 0.23 6M 19.11 14.37 28.44 0.04 0.25 2.66 2.44 Vidullanka M 3.90 0.10 477.27 1,861 166.36 FY 59.13 FY 14.56 6M 0.12 FY 0.03 6M 31.48 63.92 72.03 0.15 0.07 2.28 1.71 Fundamental Analysis Division Note:Forward PER is arrived at based on the annualised EPS adjusted for any exceptional items. Capital TRUST Research (Pvt) Ltd. ‐  5 ‐
  • 7. INFORMATION TECHNOLOGY Sector Index = 113.45 WoW Change = 5.0% Sector PE = 15.6 Sector PBV = 1.4 Price WoW No. of M.CAP Cash Cash Per DPS F Net Profit (SLRs. Mn) EPS (SLRs.) PER (x) NAV PBV COMPANY SLRs Change shares SLRs. Balance Share Last FY Y (SLRs) (x) 4-Jan in Price (Mn) Mn 2010/11 2011/12 2012/13 11/12 12/13 11/12 12/13 (F) (SLRs.Mn) (SLRs.) (SLRs.) E-Channelling M 6.30 0.60 122.13 769 8.34 FY 80.21 FY 24.09 6M 0.66 FY 0.20 6M 9.59 15.97 21.53 0.18 - 1.10 5.74 PC House M 5.50 0.10 228.93 1,259 178.93 FY 86.87 FY (3.44) 6M 0.38 FY (0.02) 6M 14.49 (183.07) (165.35) (0.72) 0.25 6.03 0.91 PLANTATIONS Sector Index = 825.06 WoW Change = 2.1% Sector PE = 7.5 Sector PBV = 1.0 Price WoW No. of M.CAP Cash Cash Per DPS F Net Profit (SLRs. Mn) EPS (SLRs.) PER (x) NAV PBV COMPANY SLRs Change shares SLRs. Balance Share Last FY Y (SLRs) (x) 4-Jan in Price (Mn) Mn 2010/11 2011/12 2012/13 11/12 12/13 11/12 12/13 (F) (SLRs.Mn) (SLRs.) (SLRs.) Agalawatte D 33.00 0.40 25.00 825 164.12 FY 156.75 FY 120.31 9M 6.27 FY 4.81 9M 5.26 5.14 (91.89) (3.68) 2.50 40.16 0.82 Balangoda D 39.40 1.40 23.64 931 164.41 FY 16.67 FY 128.96 9M 0.71 FY 5.46 9M 55.86 5.42 192.11 8.13 2.00 62.32 0.63 Bogawantalawa M 12.50 0.40 83.75 1,047 94.65 FY (299.07) FY 138.04 6M (3.57) FY 1.65 6M (3.50) 3.79 (10.90) (0.13) 0.50 10.00 1.25 Elpitiya M 19.00 0.90 72.87 1,384 363.50 FY 97.03 FY 197.00 6M 1.33 FY 2.70 6M 14.27 3.51 (90.33) (1.24) 0.36 22.38 0.85 Hapugastenne D 38.60 (1.40) 46.32 1,788 285.42 FY (219.04) FY 89.07 9M (4.73) FY 1.92 9M (8.16) 15.05 (120.55) (2.60) 2.00 27.15 1.42 Horana M 26.00 0.90 25.00 650 329.60 FY 83.93 FY 52.60 6M 3.36 FY 2.10 6M 7.74 6.18 (158.37) (6.33) 1.00 42.91 0.61 Kahawatte D 33.10 (0.40) 79.89 2,644 328.78 FY 52.79 FY 73.43 9M 0.66 FY 0.92 9M 50.09 27.01 (211.10) (2.64) - 13.81 2.40 Kegalle M 104.00 0.00 25.00 2,600 837.75 FY 681.49 FY 279.66 6M 27.26 FY 11.19 6M 3.82 4.65 2,006.09 80.24 3.00 126.77 0.82 Kelani Valley D 84.00 4.00 34.00 2,856 320.68 FY 460.49 FY 386.98 9M 13.54 FY 11.38 9M 6.20 5.54 431.13 12.68 5.00 70.06 1.20 Kotagala M 73.00 (0.80) 32.00 2,336 667.77 FY 438.61 FY 212.54 6M 13.71 FY 6.64 6M 5.33 5.50 (97.62) (3.05) 2.00 81.87 0.89 adu s a Madulsima D 5 0 15.70 (0 0) (0.10) 9 00 29.00 55 455 ( 98) (41.98) FY ( 3 3) (23.23) FY ( 3 60) 9 (73.60) 9M (0 80) (0.80) FY ( 5 ) (2.54) 9 9M ( 9 60) (19.60) ( 6 ) (4.64) (95 56) (95.56) (3 30) (3.30) - 5 0 57.02 0 8 0.28 Malwatte D 4.70 0.10 224.59 1,159 424.22 FY 86.69 FY 310.21 9M 0.35 FY 1.25 9M 13.42 2.81 40.91 0.17 0.05 8.65 0.54 Malwatte (X) D 4.50 0.20 23.00 - 12.85 2.69 0.17 0.05 8.65 0.52 Maskeliya M 13.00 0.60 53.95 701 42.48 FY (370.38) FY 55.73 6M (6.86) FY 1.03 6M (1.89) 6.29 (140.10) (2.60) - 28.92 0.45 Namunukula M 80.30 7.10 23.75 1,907 409.33 FY 374.67 FY 175.69 6M 15.78 FY 7.40 6M 5.09 5.43 176.72 7.44 1.70 73.18 1.10 Talawakelle D 26.60 2.60 23.75 632 147.44 FY (92.58) FY 68.60 9M (3.90) FY 2.89 9M (6.82) 6.91 (107.59) (4.53) 2.50 45.26 0.59 Udupussellawa D 29.10 0.00 19.40 565 138.94 FY (199.07) FY 54.44 9M (10.26) FY 2.81 9M (2.84) 7.78 (124.57) (6.42) - 15.97 1.82 Watawala M 12.20 0.20 236.67 2,887 642.47 FY 412.59 FY 343.56 6M 1.74 FY 1.45 6M 7.00 4.20 97.11 0.41 0.35 13.07 0.93 TELECOMMUNICATIONS Sector Index = 163.28 WoW Change = -0.1% Sector PE = 15.0 Sector PBV = 1.5 Price WoW No. of M.CAP Cash Cash Per DPS F Net Profit (SLRs. Mn) EPS (SLRs.) PER (x) NAV PBV COMPANY SLRs Change shares SLRs. Balance Share Last FY Y (SLRs) (x) 4-Jan in Price (Mn) Mn 2010/11 2011/12 2012/13 11/12 12/13 11/12 12/13 (F) (SLRs.Mn) (SLRs.) (SLRs.) Dialog Telekom D 8.20 0.00 8,143.78 66,779 5,047.44 FY 5,353.62 FY 5,092.74 9M 0.66 FY 0.63 9M 12.47 9.83 4,772.35 0.59 0.25 4.45 1.84 SLT D 43.90 (0.10) 1,804.86 79,233 3,943.00 FY 4,781.00 FY 2,862.00 9M 2.65 FY 1.59 9M 16.57 20.76 4,618.00 2.56 0.85 30.45 1.44 TRADING Sector Index = 17,086.00 WoW Change = 0.9% Sector PE = 13.8 Sector PBV = 1.7 Price WoW No. of M.CAP Cash Cash Per DPS F Net Profit (SLRs. Mn) EPS (SLRs.) PER (x) NAV PBV COMPANY SLRs Change shares SLRs. Balance Share Last FY Y (SLRs) (x) 4-Jan in Price (Mn) Mn 2010/11 2011/12 2012/13 11/12 12/13 11/12 12/13 (F) (SLRs.Mn) (SLRs.) (SLRs.) Brown & Company M 128.20 4.00 70.88 9,086 2,188.22 FY 1,177.19 FY (29.12) 6M 16.61 FY (0.41) 6M 7.72 (156.01) (216.23) (3.05) 1.32 202.00 0.63 C.W. Mackie M 76.00 (0.60) 35.99 2,735 254.62 5Q* 383.10 FY 97.52 6M 10.65 FY 2.71 6M 7.14 14.02 (16.53) (0.46) 2.00 47.69 1.59 Tess Agro M 2.70 0.30 180.00 486 20.32 FY 17.66 FY (9.14) 6M 0.10 FY (0.05) 6M 27.53 (26.59) (50.63) (0.28) 0.05 1.67 1.62 * Change in the financial year The information and the opinions contained herein were compiled by Capital TRUST Research (Pvt) Ltd, and are based on information obtained from reliable sources in good faith. However, such information has not been independently verified and no guarantee, representation or warranty expressed or  implied is made by Capital TRUST Research (Pvt) Ltd and its related companies as to its accuracy or completeness. This report is not and should not be construed as an offer to sell or a solicitation of an offer to buy any security. Neither Capital TRUST Research (Pvt) Ltd nor its related companies, directors  and employees can be held liable whatsoever for any direct or consequential loss arising from any use of this report or the information contained herein.  l b h l l bl h f ll f f h h f h Fundamental Analysis Division Note:Forward PER is arrived at based on the annualised EPS adjusted for any exceptional items. Capital TRUST Research (Pvt) Ltd. ‐  6 ‐
  • 8. TELEPHONE : (011)- 2 174 174 HOTLINE : (011)- 2 174 175 FAX : (011)- 2 174 173 E MAIL : inquiries@capitaltrust.lk TRADING DIVISION BOARD OF DIRECTORS Tushan Wickramasinghe (011)-2174184 0777-313456 Moksevi Prelis (Chairman) Dakshana Gooneratne (011)-2174194 0777-360492 Tushan Wickramasinghe (Managing Director/CEO) Lawrence David (011)-2174164 0777-289331 Sarath Rajapakse (Director) M J M Husni (011)-2174102 0773-219503 Sandesh Jayakody (011)-2174103 0773-733273 Nilantha Perera (011)-2174104 0777-715970 Kavin Kodytuakku (011)-2174105 0777-536870 Saliya Gamagedera (011)-2174108 0773-219506 Asanka Perera (011)-2174109 0773-291847 Rohitha Wickramasinghe (011)-2174112 0777-536880 Radheeka Pillai (011)-2174115 0777-287936 Sajee Perera (011)-2174113 0777-287941 Gayan Vithanage (011)-2174114 0777-287933 Shanmugassharma Rakesh (011)-2174117 0777-536877 Rasika Vithanage (011)-2174118 0777-536898 Danushka Arambegedra (011)-2174122 0777-270867 Rukshan Perera (011)-2174119 0777-536883 Chamila Fernando (011)-2174121 0777-536887 Laxman Ratnayake (011)-2174116 0777-287948 Sanjaya Jayasundara (011)-2174185 0772-015881 Shehan Mendis (011)-2174134 0777-305684 Dylan Nonis (011)-2174124 0777-560615 Vishva Karunaratne (011)-2174131 0777-560585 Nilosan Kanagaraj (011)-2174128 0777-560665 Dilshard Hameed (011)-2174132 0773-142242 Anushan Kandasamy (011)-2174123 0777-722622 Rajitha Elapata (011)-2174129 0773-141356 Ruchith Jayathilake (011)-2174138 0775-696412 KANDY BRANCH Arjuna Wilbawa (081)-2205 486 0773-291846 Suranga Guruge (081)-2205 (081) 2205 481 0773-291845 0773 291845 Dasantha Herath (081)-2205 493 0773-865305 Roshan Helage (081)-2205 483 0773-823507 Mohomed Faizan (081)-2205 491 0777-840256 Ananda Wijenayake (081)-2205 482 0777-840254 FAX (081)-2201050 KURUNEGALA BRANCH Bogala Samaranayake (037)-2223 863 0773-688604 Dammika Senarathne (037)-2223 861 0777-560699 Disantha Banneheke (037)-2223 860 0777-597953 FAX (037)-2220859 NEGOMBO BRANCH Sanjeewa Perera (031)-2228470 0773-291848 Sujith Kumara (031)-2228471 0773-291849 Narada Abeysinghe (031)-2228473 0773-833997 Srikanth Anton (031)-2228474 0773-219505 FAX (031)-2227894 MATARA BRANCH CUSTOMER SERVICE DIVISION Venura Gamage (041)-2236200 0773-936222 Mohomed Adil (011)-2174177 0773-399900 Thusitha Karunaratne (041)-2236205 0773-865302 Prashani Perera (011)-2174167 0773-167777 Prasad Jagoda (041)-2236201 0773 596338 Raveesha Karunaratne (011)-2174168 0773-577761 Prabath Rathnayaka (041)-2236203 0773-785157 Ruvani Liyanapathirana (011)-2174190 0777-536882 Anurada Dahanayaka (041)-2236202 0773-596339 Jagath Rathnayake (041)-2236204 0773-758304 ACCOUNTS DIVISION Lasitha Wijewardana (041)-2236111 0777-354824 Methmal Senivirathne (011)-2174110 0777-766727 Tharanga Wijeweera (041)-2236208 0777-359156 Ranjini Jayawardena (011)-2174142 0773-596336 FAX (041)-235644 Subani Wimalarathne (011)-2174143 0772-015882 Kumari De Alwis (011)-2174144 0772-015886 MORATUWA BRANCH Suneth Fernando (011)-2642 516 0773-633533 DOCUMENTATION DIVISION Anuradha Weerakkody (011)-2642 517 0777-354760 N.M.A Navaratne (011)-2174150 0777-287931 FAX (011)-2648747 CAPITAL TRUST RESEARCH (PVT) LTD KALUTARA BRANCH Charitha Gunasekere (011)-2174140 0773-865301 Kamal Perera (034)-2224657 0773-633531 Shashitha Jayakody (011)-2174139 0777-361394 Asoka Dharmatilaka (034)-2224842 0773-865300 Kaushalya Jayathilake 0778-649496 FAX (034)-2224285 CAPITAL TRUST INFORMATION TECHNOLOGIES (PVT) LTD KIRIBATHGODA BRANCH Upul Dissanayake (011)-2174111 0777-771818 Asiri Perera (011)-2918478 0773-692812 Thilina Yahampatharachchi (011)-2918291 0773-219502 CAPITAL TRUST CREDIT (PVT) LIMITED FAX (011)-2918028 Savindini Akarawita (011)-2174151 0777-722265 Madusha Gunawardena (011)-2174153 0775-754078 JAFFNA BRANCH Jayaroshman Ketheesh (021)-2219 532 0777-270922