QSM Chap 10 Service Culture in Tourism and Hospitality Industry.pptx
Small cap tech year end review 2011
1. SMALL CAP TECH YEAR-END REVIEW
December 14, 2011
2011 SMALL CAP TECH YEAR-END REVIEW AND 2012 OUTLOOK
After a tumultuous 2011 where equity values were primarily driven by macro-economic and political events, we enter 2012 with more caution
than we did entering 2011. The incessantly pessimistic perspective from Europe, which dominated the second half of 2011, has begun to
affect the performance of some of our small-cap coverage list. Stocks with global footprints that rely on CAPEX budgets from their client
base appear to be facing headwinds during H1 2012. There is increasing evidence that projects milestones are being delayed, scaled back, or
even cancelled as big spenders conserve cash in the face of Euro debt crisis uncertainty. As a result, we see a slow start to 2012, followed by
a stronger finish.
Somewhat surprisingly, we are seeing some evidence that the US economy is experiencing an up-tick in both employment and confidence
(both business and consumer). As a result, we believe that performance risk for US consumer-facing stocks may decline in 2012.
We see the most upside in stocks that rely less on CAPEX budgets, and tap less macro-economic sensitive OPEX budgets through multi-year
term licenses, or transactional licensing.
Although we believe that the general market should show more strength in H2’12, our near-term perspective is cautious with OPEX over
CAPEX, US consumer over Euro enterprise.
TABLE OF CONTENTS
2011 Small Cap Tech Year-End Review and 2012 Outlook ............................................................................... 1
2011: Two Years in One ............................................................................................................................... 2
H1’11: US Employment Trends Fuel Optimism ...................................................................................... 2
H2’11: “The Emporers Have No Clothes” Crushes Confidence Starting in August ................................ 3
2012: Mirror Opposite of 2011 as Long as Europe Does Not Implode................................................................ 3
Pessimistic H1’12; Optimistic H2’12 ....................................................................................................... 3
Canadian Tech Balance Sheets Remain Solid Entering 2012.................................................................. 4
RES 30 Performed Well during FY’11 > 15% LTM Growth of Top and Bottom Line............................... 4
Coverage List 2012: CAPEX Caution and OPEX Optimism................................................................................. 5
Continuing Macro Technology Themes for 2012 ................................................................................... 6
Risks and Rants for 2012......................................................................................................................... 7
Member of the Investment Industry Regulatory Organization of Canada (IIROC) Analyst: Ron Shuttleworth Associate: Kelsey Lobsinger
Participating Organization – Toronto Stock Exchange (TSX) 416.603.7381 ext. 250 416.603.7381 ext. 228
Member – Canadian Investor Protection Fund (CIPF) rs@mpartners.ca kl@mpartners.ca
2. SMALL CAP TECH YEAR-END REVIEW
December 14, 2011
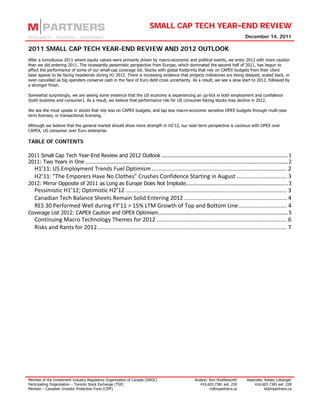
2011: TWO YEARS IN ONE
NASDAQ Composite Index
OPTIMISM PESSIMISM
3.00k
2.90k
Euro crisis: Greece
2.80k
2.70k
2.60k
2.50k
2.40k Japan: 9.1 magnitude earthquake,
Tsunami & Fukushima End of QE2
2.30k
Euro crisis: Italy
Debt ceiling debate
2.20k
11
01 1
15 1
30 1
1
g- 011
1
28 1
1
l-2 1 1
08 1
15 1
1
-1 11
11
13 1
24 1
1
20 1
1
18 1
11
- 2 11
10 1
1
1
01
1
01
1
ay 201
1
01
1
1
Ju 2 01
1
01
1
1
1
No - 20
No - 20
20
No -20
Ap - 20
Fe -2 0
20
20
Ap -2 0
Ju -2 0
Ju -20
20
Ja - 20
Fe - 20
20
Ju -2 0
Se -20
-2
Au -2
-2
-2
-2
4-
-
5-
2-
6-
-
2-
8
22
01
0
03
6
1
06
-0
-1
-1
l-1
-0
-3
v-
v-
v-
g-
r-
r-
b-
b-
n-
n-
p-
p-
n-
n-
ct
ct
ar
ar
ar
ay
Au
Se
Ja
O
O
M
M
M
M
M
H1’11: US EMPLOYMENT TRENDS FUEL OPTIMISM
M Partners entered 2011 with an
BUY HOLD SELL optimistic outlook for its technology
coverage universe
5 - 1
First quarter 2011 was characterized by cautious optimism that the recession of 2008 was finally in the rear-view mirror. The Federal
Reserve forecasted US GDP growth to reach 3.5% while the US economy continued to benefit from active stimulus like QE2.
US unemployment dropped below 9% in February for the first time since May 2009, and trended to a two-year low in March 2011.
Optimism was reflected by elevated market liquidity reaching all the way down to the Canadian technology small cap and micro-caps,
which were, for the first time since 2007, demonstrating healthy levels of trade volumes – especially in February.
LTM Liquidity Trends
400,000 $300,000
Avg Volume Avg Value
350,000
$250,000
Nov 111,290 $ 132,880
300,000 Dec 134,177 $ 118,684
$200,000 Jan 202,324 $ 175,066
250,000
Avg Daily Volume
Feb 371,723 $ 279,524
Mar 215,502 $ 220,864
200,000 $150,000
Apr 242,405 $ 226,909
150,000 May 229,690 $ 203,622
$100,000
June 147,062 $ 124,683
100,000 July 101,961 $ 91,915
$50,000 Aug 94,305 $ 71,021
50,000
Sept 82,712 $ 64,049
Oct 93,897 $ 61,453
0 $0
Nov Dec Jan Feb Mar Apr May June July Aug Sept Oct Nov Nov 106,235 $ 69,081
Source: Capital IQ, M Partners
Avg Volume Avg Value
The NASDAQ index peaked on February 17 at 2,831 after running up from 2,691 at the beginning of the year.
In general, technology stocks benefited from elevated enterprise investments in productivity, a surge in consumer smartphone adoption,
an acceleration of the emergence of the mobile web, and more emphasis on the cloud. There were capacity stresses within the mobile
ecosystem, which stocks under coverage (InterDigital (IDCC-NASDAQ), Sandvine (SVC-TSX), Bridgewater Systems (BWC-TSX), and
Redknee (RKN-TSX)) were forecasted to benefit from directly.
Optimism in Q1 was reflected in the “risk on” trade, which priced the RES 30 Canadian Small Cap Tech Index ahead of the main
TSX/S&P index on an EV/EBITDA basis. Essentially, investors were interested again in growth stocks and technology growth in particular.
On March 11, 2011 a 9.0 magnitude earthquake and tsunami hit Japan a few hundred kilometers north of Tokyo. Riveting images of the
utter destruction and then the slow motion Fukushima nuclear disaster consumed world attention and helped to erase the year-to-date
gains on the NASDAQ. More importantly for the technology sector, intermittent power disruptions, evacuations, and the sheer size of the
disaster combined to disrupt parts supply chains for electronics ranging from iPhones to data servers. The disaster impacted directly on
the performance of two companies under coverage. IDCC suffered reduced royalties from per-unit Japan-based customers such as Sharp
and Kyocera. Sandvine performance was impacted by delays at NTT and component shortages for some of its server hardware.
Member of the Investment Industry Regulatory Organization of Canada (IIROC) Analyst: Ron Shuttleworth Associate: Kelsey Lobsinger
Participating Organization – Toronto Stock Exchange (TSX) 416.603.7381 ext. 250 416.603.7381 ext. 228
Member – Canadian Investor Protection Fund (CIPF) rs@mpartners.ca kl@mpartners.ca
3. SMALL CAP TECH YEAR-END REVIEW
December 14, 2011
H2’11: “THE EMPERORS HAVE NO CLOTHES” CRUSHES CONFIDENCE STARTING IN AUGUST
The remarkable recovery by Japan from the earthquake and tsunami, along with solid Q2’11 corporate earnings, helped to return the
NASDAQ to a 52-week high of 2869 in mid-July - just three months after the post-tsunami correction.
QE2 ended in June.
By May, the US unemployment rate had climbed back above 9.0%, peaking at 9.2% in June. The unnecessary and unnecessarily nasty
US debt ceiling debate revealed how ineffective the polarized US Congress has become in prioritizing budget policies to help sustain
economic growth, increase employment, and help boost consumer confidence. Market disappointment at US Congressional intractability
was reflected in a 17% decline of the NASDAQ index over a period of only two weeks.
Just as it became clear that the United States Congress was essentially dysfunctional, the Euro Debt Crisis suddenly became more acute
as Greek bonds were downgraded and it appeared more likely that, despite two years of austerity, Greece was at risk of defaulting on its
debt and creating a contagion of disorderly default within the Euro Zone.
Markets essentially ignored positive earnings fundamentals and whipsawed with debt crisis announcements from dithering European
Union officials. Governments in Greece, Italy and Slovakia fell as a direct consequence of elevated policy risk. At this time, the Euro debt
crisis has entered its 19th month, and remains the single greatest risk to global financial systems and driver behind depressed equity
values. September – crisis on; indices down. October – crisis off; indices up. November – crisis on, indices down.
In the meantime, US employment fundamentals have recently shown improvement to the best levels since the early stages of the
employment fallout of the 2008 financial crisis. These positive data points are overshadowed by the Euro crisis, although they may be
supporting a small up trend in the volatile indices.
For the first time during FY 2011, the Euro crisis is impacting the performance of our coverage list. Regardless of market segment, all
companies under coverage that rely on Capital Expenditures (CAPEX) to fund contracts have reported delays in both orders and project
milestones. The root cause of most of the project delays appears to be related to uncertainty in the financial markets, and the risk of
future access to capital. Stocks impacted by CAPEX spending restraints include Redknee (RKN-TSX), VIQ Solutions (VQS-TSX), Sandvine
(SVC-TSX) and International DataCasting (IDC-TSX). We believe that each of these companies has sufficient net cash to adjust to
reduced client CAPEX spending for multiple quarters. On an equal weighted basis, 25% of the mean percentage of market cap is covered
by cash among these four stocks.
2012: MIRROR OPPOSITE OF 2011 AS LONG AS EUROPE DOES NOT IMPLODE
PESSIMISTIC H1’12; OPTIMISTIC H2’12
M Partners enters 2012 with a cautious
BUY HOLD SELL outlook for its technology coverage
universe
7 3 1
Due to severe austerity in several Euro countries, some of Europe is probably in recession right now. Trade imbalances between Euro
countries in recession and Euro countries expanding economically are at once masked by the monetary union, and exposed by individual
sovereign bond yields.
Because the US Federal Reserve, in concert with other G20 central banks and the European Union, is actively promoting systemic
liquidity, we think that chance of a “Lehman Bros 2” financial meltdown resulting from the Euro debt crisis is in the lower quartile of
possibility.
We believe that a recession in Europe could be relatively shallow and short due to ongoing central bank activism. However, evidence
suggests that stocks under coverage, which rely on CAPEX budgets, should experience at least one more quarter of reduced
performance. Commentary from recent quarterly conference calls has common themes, which we have contemplated in FY’12 estimates:
o Minimal year-end budget flushing;
o Multi-quarter delays to some project milestones;
o Sequential quarterly delays (Qt1 delays picked up in Qt2 but offset by Qt2 delays); and
o Project re-scoping.
Decelerating CAPEX appears to be connected to market uncertainty and fear among heavy CAPEX spenders such as network operators
directly related to the Euro debt crisis.
It is not all bad for stocks under coverage. Holiday activity, an uptick in employment and an apparent stabilization of US home prices
have made American consumers slightly more optimistic and apparently less sensitive to Euro Zone risks entering 2012. As a result, we
believe that stocks with exposure to consumers, and in particular US consumers, are less risky than they were earlier in 2011.
Member of the Investment Industry Regulatory Organization of Canada (IIROC) Analyst: Ron Shuttleworth Associate: Kelsey Lobsinger
Participating Organization – Toronto Stock Exchange (TSX) 416.603.7381 ext. 250 416.603.7381 ext. 228
Member – Canadian Investor Protection Fund (CIPF) rs@mpartners.ca kl@mpartners.ca
4. SMALL CAP TECH YEAR-END REVIEW
December 14, 2011
We also believe that stocks with term or transactional licenses and exposure to operational budgets (OPEX) are a good spot to be in the
short-term or until large networks feel more comfortable spending CAPEX.
Ten of the eleven technology stocks that are under coverage are small cap and should continue to be impacted by low liquidity during
H1’12. We believe that as the Eurozone risk recedes in the new year, and optimism for the US economy improves, investors may begin
to return more meaningfully to equity markets. We think that the “risk on” trade should create more liquidity and less discounted
valuations for small cap technology stocks during H2’12.
The technology sector should also be impacted positively during 2012 by a backlog of high profile IPOs that were delayed in 2011. A
long-rumored Facebook IPO could result in more investor interest in the entire sector, which could positively impact small cap technology
stocks by H2’12.
CANADIAN TECH BALANCE SHEETS REMAIN SOLID ENTERING 2012
TSX Tech Company Totals
Market Cap ($M) Cash ($M) Cash as % of MC
Large-Cap 9 > $1B $ 30,344 $ 3,556 11.7%
Mid-Cap 5 >$0.5B<$1.0B $ 3,240 $ 697 21.5%
Small-Cap 35 >$50M<$0.5B $ 6,009 $ 1,421 23.6%
Micro-Cap 74 >$5M<$50M $ 1,432 $ 310 21.7%
TOTAL 123 $ 41,025 $ 5,985 14.6%
Source: Capital IQ, M Partners
Of the 123 companies in the technology group of the TSX and TSXV worth over $5M, all but 14 companies are considered to be small
cap or micro cap stocks. Approximately 21.7% of aggregate small cap market cap value is in cash, which implies two things:
o In general, small cap technology companies are well fortified against future market shocks.
o Investors do not value the current and future cash flows generated by the operations.
The size of the group continues to contract, exiting 2012 with approximately ten fewer listings. Since the beginning of the year, several
small cap companies have been acquired including Bridgewater Systems, MOSAID, Zarlink, and March Networks. Combined, these
companies represent approximately $1.4B of shareholder value.
Two significant technology IPOs occurred in the Canadian technology sector. In May, NexJ raised $43.7M and then in November, Avigilon
raised approximately $20M in a public offering.
RES 30 PERFORMED WELL DURING FY’11 > 15% LTM GROWTH OF TOP AND BOTTOM LINE
The M Partners RES Small Cap Tech Index tracks the overall performance and liquidity of 30 companies which we believe are most
representative of the state of the 123 companies with market capitalizations between $5M and $500M that comprise the Canadian Small Cap
Technology Sector (see Appendix A). These 30 companies are covered by at least three equity analysts and therefore provide us with a
consensus view of forward looking multiples. We also report on the overall performance and liquidity of the larger group of 123 technology
companies that comprise the sector, along with related transactional activity.
Revenue, EBITDA & Cash Growth
RES 30 ($M) 11/30/2010 11/30/2011 Change
LTM Revenue $4,791 $5,585 16.6%
LTM EBITDA $559 $646 15.7%
Cash & Equiv. $1,120 $1,226 9.5%
S&P/TSX ($B) 11/30/2010 11/30/2011 Change
LTM Revenue $981 $1,048 6.9%
LTM EBITDA $183 $204 11.9%
Source: Capital IQ, M Partners
*Includes Mood Media, which replaced Bridgewater Systems
The RES 30 index grew revenues by 16.6% and delivered nearly $800M of new revenue over the last twelve months.
As well, the group increased LTM EBITDA by 15.7%, generating about $90M of aggregate EBITDA growth over the same time period,
showing earnings leverage and massively outperforming the general economy, which improved by roughly 2%, as measured by GDP.
Revenue, EBITDA & Cash Growth Cash as % of Market Capitalization
RES 30 ($M) 11/30/2010 11/30/2011 Change
RES 30 ($M)* 11/30/2008 11/30/2009 11/30/2010 11/30/2011
LTM Revenue $4,791 $5,585 16.6%
LTM EBITDA $559 $646 15.7% Aggregate Cash $787 $957 $1,109 $1,208
Cash & Equiv. $1,120 $1,226 9.5% Aggregate Market Cap $3,380 $4,820 $6,094 $6,532
S&P/TSX ($B) 11/30/2010 11/30/2011 Change % of Market Cap 23.3% 19.9% 18.2% 18.5%
LTM Revenue $981 $1,048 6.9%
Source: Capital IQ, M Partners
LTM EBITDA $183 $204 11.9%
Source: Capital IQ, M Partners *Excludes Bridgewater Systems & Mood Media, 29 companies included
*Includes Mood Media, which replaced Bridgewater Systems
Member of the Investment Industry Regulatory Organization of Canada (IIROC) Analyst: Ron Shuttleworth Associate: Kelsey Lobsinger
Participating Organization – Toronto Stock Exchange (TSX) 416.603.7381 ext. 250 416.603.7381 ext. 228
Member – Canadian Investor Protection Fund (CIPF) rs@mpartners.ca kl@mpartners.ca
5. SMALL CAP TECH YEAR-END REVIEW
December 14, 2011
RES 30 Segmented by Market Capitalization
No. Total MC ($M)
Total Large Cap 0 > $1B $ -
Total Mid-Cap 3 >$0.5B<$1.0B $ 1,907
Total Small-Cap 23 >$50M<$0.5B $ 4,799
Total Micro-Cap 4 <$50M $ 115
30 $ 6,820
Source: CapitalIQ, M Partners
November 1st to November 30th Performance RES 30 -5.0% LTM Performance RES 30 -3.4%
Coverage List -6.4% S&P/TSX -7.2%
S&P/TSX -0.4% Coverage List -19.8%
4.00% 40.00%
2.00% 30.00%
0.00%
20.00%
-2.00%
% Return
10.00%
-4.00%
-6.00% 0.00%
-8.00% -10.00%
-10.00%
-20.00%
-12.00%
-30.00%
Nov-07-2011
Nov-21-2011
-14.00%
Jan-12-2011
Jan-26-2011
Jun-03-2011
Jun-17-2011
Jul-01-2011
Jul-15-2011
Jul-29-2011
Dec-01-2010
Dec-15-2010
Dec-29-2010
Feb-09-2011
Feb-24-2011
Mar-10-2011
Mar-24-2011
Apr-07-2011
Apr-21-2011
May-06-2011
May-20-2011
Aug-12-2011
Aug-26-2011
Sep-12-2011
Sep-26-2011
Oct-10-2011
Oct-24-2011
1
1
1
07 1
1
1
1
1
1
1
1
1
1
1
22 1
1
1
1
1
1
1
01
01
01
1
01
01
01
01
01
01
01
01
01
01
01
01
01
01
01
01
No 2 01
No -2 0
-2
-2
-2
-2
-2
-2
-2
-2
-2
-2
-2
-2
-2
-2
-2
-2
-2
-2
-2
1-
01
02
03
04
08
09
10
11
14
15
16
17
18
21
23
24
25
28
-3
v-
v-
v-
v-
v-
v-
v-
v-
v-
v-
v-
v-
v-
v-
v-
v-
v-
v-
v-
v-
ct
No
No
No
No
No
No
No
No
No
No
No
No
No
No
No
No
No
No
O
RES 30 S&P/TSX Coverage List RES 30 S&P/TSX Coverage List
Source: Capital IQ, M Partners Source: Capital IQ, M Partners
The Euro Crisis added more uncertainty to worldwide markets during November, resulting in a significant decline in the performance of
all categories of stocks.
The full-year performance of the RES 30 and the M Partners coverage list has followed the market.
COVERAGE LIST 2012: CAPEX CAUTION AND OPEX OPTIMISM
Exiting 2011, our recommendations have become more cautious as we have had an opportunity to dissect performances of five reporting
companies over the past two weeks.
Recommendation Market Data EV/EBITDA Multiples Liquidity
% Chg. Target Market Comp Medians Avg Daily
Target Implied Share 30-Day 365-Day Market Cap
Market Data and Valuation Rating Prior S/O Ent. Value Volume (Last
Price Return Price Chg. Chg. (M) FYE FYE+1 FYE FYE+1 FYE FYE+1
Close Week)
Coverage List
InterDigital, Inc. (NasdaqGS:IDCC) $118.00 BUY 175.6% $42.81 -1.5% -5.5% 21.5% 45.5 $1,947.64 $1,487.05 29.6x 14.8x 9.0x 4.5x 10.6x 9.7x 805,180
Descartes Systems Group Inc. (NasdaqGS:DSGX) $10.00 BUY 40.6% $7.11 -1.1% -3.4% -1.0% 62.3 $443.05 $380.12 16.9x 13.1x 11.5x 8.9x 17.3x 13.9x 34,730
TeleNav, Inc. (NasdaqGS:TNAV) $14.00 BUY 65.9% $8.44 1.0% -6.8% 22.3% 41.3 $348.27 $155.05 6.7x 6.0x 2.7x 2.4x 4.5x 4.6x 127,260
Sandvine Corporation (TSX:SVC) $1.40 HOLD 16.7% $1.20 -34.8% -34.1% -57.4% 137.9 $165.47 $90.38 29.2x 12.5x 22.3x 9.6x 16.0x 12.7x 194,900
Redknee Solutions, Inc. (TSX:RKN) $1.70 BUY 78.9% $0.95 -4.0% -17.4% -34.5% 64.0 $60.83 $56.20 38.9x 8.6x 21.0x 4.7x 15.4x 12.6x 227,420
GuestLogix Inc. (TSX:GXI) $0.50 SELL 25.0% $0.40 1.3% -7.0% -55.6% 64.8 $25.93 $20.74 4.5x 5.2x 3.4x 4.0x 5.3x 3.5x 28,750
PNI Digital Media Inc. (TSX:PN) $2.40 BUY 192.7% $0.82 0.0% 2.5% -50.3% 34.2 $28.08 $25.06 21.3x 10.3x 6.7x 3.2x 9.0x 6.1x 31,730
VIQ Solutions Inc. (TSXV:VQS) $0.30 HOLD 9.1% $0.28 0.0% 0.0% -38.9% 90.3 $24.83 $23.29 20.3x 7.3x 18.5x 6.7x 8.9x 7.9x 36,330
Cyberplex Inc. (TSX:CX) $0.15 HOLD 76.5% $0.09 -5.6% -26.1% -81.9% 133.8 $11.38 $34.10 8.8x 5.5x 7.0x 4.4x 8.7x 6.9x 142,160
Vendtek Systems Inc. (TSXV:VSI) $0.80 BUY 146.2% $0.33 0.0% -14.5% -18.8% 52.5 $17.07 $13.22 NM 8.5x NM 3.0x 6.8x 6.0x 16,960
International Datacasting Corporation (TSX:IDC) $0.40 BUY 53.8% $0.26 -10.3% -13.3% -7.1% 60.4 $15.71 $8.46 27.0x 6.7x 13.5x 3.3x 8.4x 7.1x 11,570
In July InterDigital (NASDAQ:IDCC, BUY - $118.00) announced that it had hired Barclays and Evercore to review strategic options
regarding its patent portfolio. InterDigital represents the best event-driven trade within our coverage list. Investors remain anxious that a
transaction conclude soon. Uncertainty has weighed on the stock price because the company is not communicating any progress related
to the process. However, the timeframe is still within the range of recent similar transactions. If the process does not conclude by year-
end 2011, we believe that the company will need to either conclude the process or communicate progress prior to its next quarterly
performance report in mid-February.
Descartes Systems Group (TSX:DSG, Q-DSGX, BUY - $10.00) remains our top fundamental pick. With 93% recurring revenue,
EBITDA margins near 30%, and between 15% and 20% annualized growth, the fundamentals are very similar to SaaS providers in other
business to business sectors. DSG is priced more like a logistics provider and sits at a 31% discount to the median multiple of its peers.
TeleNav (NASDAQ:TNAV, BUY - $14.00) already has global automotive deals with Ford (live) and a deal with Delphi (we think this is
Volkswagen/Audi), which will go live in 2012, and it has almost 30 million mobile users with traction in Latin America and with China
Mobile. It trades at an EV/EBITDA discount to its peers which we think is unwarranted. Within our coverage list, Telenav is one of the
least impacted by CAPEX risk and has nearly $5.00 CPS.
Member of the Investment Industry Regulatory Organization of Canada (IIROC) Analyst: Ron Shuttleworth Associate: Kelsey Lobsinger
Participating Organization – Toronto Stock Exchange (TSX) 416.603.7381 ext. 250 416.603.7381 ext. 228
Member – Canadian Investor Protection Fund (CIPF) rs@mpartners.ca kl@mpartners.ca
6. SMALL CAP TECH YEAR-END REVIEW
December 14, 2011
PNI Digital (TSX:PN, BUY - $2.40) has made several significant deals with major retailers including Rite-Aid, Walgreens, Costco
Canada, and Tesco that have doubled its end locations from 14,000 to 27,000. Revenues ($24M FY’11E) are essentially 100% recurring
and benefitting from the re-emergence of US consumer confidence. We do not believe that the recent catalysts are priced into the stock.
Redknee (TSX:RKN, BUY - $1.70) Although Redknee has disclosed in a recent investors call that it has experienced delays, we
believe that with over 40% recurring revenue and a new emphasis on term-based contracts that it should perform well on a relative
basis to its peers in 2012. A large channel deal is expected to be announced at the World Mobile Congress in February which may not be
priced into the stock.
Sandvine (TSX:SVC, HOLD - $1.40) warned of a significant miss for Q4’11 revenues and earnings. Sandvine is sensitive to CAPEX
fluctuations and, due to its emphasis on channel relationships, has limited visibility into contract risk. It can ride out the project
uncertainty of H1’12 because it has $75M of cash, or $0.54 CPS, zero debt and 300 sticky customers.
Cyberplex (TSX:CX, HOLD - $0.15) announced Q3 guidance that projects 10% to 15% sequential growth, after having come to a
resolution with its lenders in September. There is a lot of uncertainty heading into 2012 regarding its relationship with Yahoo!, and the
potential impact on its business model of rumored M&A activity. The Yahoo! relationship represents approximately 80% of its revenue
and all of its profitability.
Guestlogix (TSX:GXI, SELL - $0.50) announced disappointing earnings which included disclosures that the company still has yet to
earn meaningful revenue from merchandising programs that is has spent over two years designing and piloting with airline clients, and
that revenue has decreased in part due to airline clients renewing at lower minimal guarantees, which we believe is indicative of a lack of
pricing power. As we enter 2012, there are still no meaningful announcements that will contribute to the $3.0M of incremental quarterly
revenue promised by management.
Investors do not care about micro-caps with game changing catalysts. Even as companies execute toward game changing
catalysts, share price and volumes have declined since the beginning of the summer. Despite significant growth opportunities, most of
the smaller companies on our coverage list were hit particularly hard by adverse capital market conditions during the past few months.
Investors fear another liquidity trap similar to the one experienced in 2008. In addition, these companies are also experiencing CAPEX
spending delays related to the Euro debt crisis. International Datacasting (TSX:IDC, BUY - $0.40), VIQ Solutions (TSXV:VQS,
HOLD - $0.30) and Vendtek Systems (TSXV:VSI, BUY - $0.80) are executing towards significant catalysts, although each of their
catalyst paths have slowed due to CAPEX spending risks. Although there are project delays, these stocks remain buys because lack of
liquidity has weighed on the share price. Each of these companies is profitable and earnings multiples are discounted to peers by
between 35% and 50%. Combined net cash balances represent over 20% of combined market cap, so there is minimal balance sheet
risk.
CONTINUING MACRO TECHNOLOGY THEMES FOR 2012
Convergence of the living room: This is a continuation of a theme from 2011 and a dream by Apple, Microsoft and Google for a few
years. As the cloud has matured, the converged living room is more possible than ever and there may be a game changer launched in
2012. Whatever happens, competition for the household wallet will heat up among networks and content providers. We are watching
TransGaming (TSX:TNG, not rated) in this market.
The consumerization of the enterprise: Increasingly, we are seeing BYOD (Bring Your Own Device) strategies being employed by
large enterprises. This could have profound impact on enterprise device sales and could help accelerate adoption of tablets. More
importantly, we may see more consumer-oriented term and transaction licensing models that are enabled by cloud-based infrastructure.
We think that Descartes Systems Group is well positioned to benefit and, due to its transactional business model, is increasingly
attractive to major enterprise software vendors such as SAP and Oracle among others.
Mobile broadband: Most global networks are at various stages of deploying 4G LTE network upgrades during 2012 and we should see
the first broad shipments of 4G devices during the year – probably about 6 months ahead of adoption patterns forecasted as late as
2010. 4G LTE adoption will benefit IDCC directly as long as it can sign up licensees in a timely manner. Broadband needs are being
driven primarily by video, which represents approximately 60% of all data. Sandvine is staking claim on video packet management, and
it should drive Sandvine’s performance by H2’12.
Handset patent war: Exiting 2011, most mobile device manufacturers are engaged in multiple global patent disputes. There are
several dozen current actions being fought simultaneously. The war, we believe, is about future gross margins on devices as devices
become commoditized. With the most valuable 4G/LTE patent portfolio available for sale, shareholders of InterDigital could benefit
from a significant windfall as a direct result of the patent war.
Location-based everything: Location is a new mobile computing variable that has been deployed with various levels of success so far.
We see 2012 as demarcation point where the category matures. Improved services combined with maturing business models could result
in improved performance by category vendors. Telenav runs the gamut of LBS services, and is poised to deliver a fully integrated
mobile-to-auto navigation system this coming summer.
Data security, processing security and user privacy: Although the nuisance of everyday spam has been contained, there have
been several high profile hacking events, and cyber attacks so far during 2011 which is putting an emphasis on the category for 2011.
Content discovery and curation: How does someone find the right app out of 500,000 on the iOS platform? How does someone find
a great song out of the millions available. More importantly, how do content creators and distributors make money? These areas of
Member of the Investment Industry Regulatory Organization of Canada (IIROC) Analyst: Ron Shuttleworth Associate: Kelsey Lobsinger
Participating Organization – Toronto Stock Exchange (TSX) 416.603.7381 ext. 250 416.603.7381 ext. 228
Member – Canadian Investor Protection Fund (CIPF) rs@mpartners.ca kl@mpartners.ca
7. SMALL CAP TECH YEAR-END REVIEW
December 14, 2011
opportunity could be prominent during 2012. We believe that PNI Digital Media is positioned well in the printing market. We are
watching Mood Media (TSX:MM, not rated) in this market.
Massive IPOs: the market is anticipating massive IPOs led by Facebook, which could provide a liquidity shot for the whole sector.
RISKS AND RANTS FOR 2012
Although there are solid and interesting trends continuing in the technology sector, and small cap tech seems to be performing
particularly well (15% YoY growth in revenue and earnings) in the face of H2’11 headwinds, we are detecting some temporary slowing
entering FY’12. We have attempted to incorporate uncertainty in both our forecasts, and our relative multiple valuations, although we
believe that after a muted H1’12, there should be a return to higher trajectory growth in H2’12. This growth is dependent upon two main
trends: 1) a shallow and quick recession in Europe 2) continued employment recovery in the United States. However there are a few
events that could derail our forecasts:
The partial or complete collapse of the Euro-zone: Although there are some immediate tactical responses to the debt crisis that
could be beneficial, there is no resolution to the impact of the trade imbalances among members. The ongoing debt crisis could result in
the dissolution of the European monetary pact, which could create disorderly default of multiple European economies, extending and
deepening the recession that Europe is probably already in now. Even with extensive intervention by central banks elsewhere, disorderly
European defaults could send the world into an economic depression.
Chinese economic growth moderating: exiting 2011, commentary from the region hints that growth is moderating and rumors of
speculative real estate bubbles persist. Recent easing of capital requirements for domestic banks hints at accommodation. Combined
with a European recession, weakness in China could impair growth in H2’12.
US policy risk: Without meaningful tax reform and budget prioritization, there are two impending risks that could derail recovery in the
United States. If congress is unable to extend employee payroll tax cuts then we see US consumer demand drying up again as the
shrinking US middle class pulls back on discretionary spending. Similarly, if the US government deploys austerity measures on top of
state and municipal austerity, we see risk that recent increases in employment could be reversed temporarily. The bottom line is that
after several quarters of balance sheet repair, the US consumer is starting to feel slightly better and beginning to spend disposable
income. Tax increases and job cuts would kill the “green shoots” of US consumer demand, possibly sending the US economy back into
recession.
Iran: Iran is turning into the single greatest risk to world security. A major escalating event in 2012 related to Iran could disrupt energy
supplies, and stress the finances of fragile European and American economies for 2012 and possibly beyond.
Aging population: As people get older they tend to spend less and save more. Europe, Japan and North America are getting older. In
the United States, the largest cohort of people as percentage of the total population is getting prepared to retire over the next five years.
These folks make up 80% of the 1% and about 60% of the net assets of the country and they are not spending much of it. Although
aggregate demand is increasing from cohorts under 55 years of age, it is a weaker engine than in previous decades, and it is still very
leveraged. The bottom line is that the top-heavy demographics have sidelined a lot of wealth that would otherwise help drive stronger
demand and higher levels of employment during 2012, which would otherwise help the US economy to better withstand economic risk
elsewhere in the world.
Member of the Investment Industry Regulatory Organization of Canada (IIROC) Analyst: Ron Shuttleworth Associate: Kelsey Lobsinger
Participating Organization – Toronto Stock Exchange (TSX) 416.603.7381 ext. 250 416.603.7381 ext. 228
Member – Canadian Investor Protection Fund (CIPF) rs@mpartners.ca kl@mpartners.ca
9. M|PARTNERS
Toronto Vancouver
100 Wellington Street West 1080 Mainland Street
Suite 2201 Suite 409
Toronto, Ontario Vancouver, British Columbia
M5K 1K2 V6Z 3E3
Canada Canada
T: 416-603-4343 T: 604-687-0755
As a full-service investment bank, M Partners’ first priority lies in the financial satisfaction of its clients. In keeping with the firm’s self-imposed high
standards, M Partners’ approach to investment is anything but standardized. Aiming to create new opportunities and ideas for clients rather than
steering them towards typical investment outlets, M Partners has adopted a keen strategy of focused and relevant research. Such knowledge-driven
efforts, coupled with the ample skills of the firm’s management, produces successful services ranging from account management to advisory
engagements.
M Partners received Investment Industry Regulatory Organization of Canada (IIROC) approval on April 14th 2005 and trades under broker number 97.
The team currently has 40 members of varying degrees of financial experience, including principals Thomas Kofman and Steve Isenberg, who have a
combined 45 years of financial experience and are well known in the field. This backbone of strong leadership will help chart the firm’s course into the
future. In the coming months and years, M Partners will be focusing on a number of verticals, including environmental and infrastructure, real estate,
mining, merchandising and consumer products, and other special situations.
M Partners has strong financial backers who have extensive capital markets experience. The firm is a member of IIROC, a participating member of the
Toronto Stock Exchange, The TSX Venture Stock Exchange, PURE, CHI-X, OMEGA, TMX and the Canadian Investor Protection Fund (CIPF).
M Partners does not make a market for an equity or equity related security of the subject issuer.
Disclosure
The particulars contained herein were obtained from sources which we believe to be reliable but are not guaranteed by us and may be incomplete. The
opinions expressed are based upon our analysis and interpretation of these particulars and are not to be construed as a solicitation or offer to buy or
sell the securities mentioned herein.
Disclosure codes are used in accordance with Policy 3400 of IIROC.
Description of Possible Disclosure Codes
1. M Partners or its affiliates collectively beneficially own 1% or more of any class of equity securities of the company which is the subject of the
research report.
2. The analyst or any associate of the analyst responsible for the report or public comment hold shares in the company.
3. M Partners or a director or officer of M Partners or any analyst provided services to the company for remuneration other than normal investment
advisory or trade execution services within the preceding 12 months, (may seek compensation for investment banking services from the company
herein within the next 3 months).
4. The director, officer, employee or research analyst is an officer, director or employee of the company, or serves in an advisory capacity to the
company.
5. The analyst has viewed the material operations of the company. We define material operations as an issuer's corporate head office and its main
production facility or a satellite facility that is representative of the company's operations.
6. M Partners provided investment banking services for the company during the 12 months preceding the publication of the research report
7. The analyst preparing the report received compensation based upon M Partners investment banking revenues for this issuer
Dissemination
All final research reports are disseminated to institutional clients of M Partners simultaneously in electronic form. Hard copies will be disseminated to
any client that has requested to be on the distribution list of M Partners. Reproduction of this report in whole or in part without permission is prohibited.
Research Analysts
The Research Analyst(s) who prepare this report certify that their respective report accurately reflects his/her personal opinion and that no part of
his/her compensation was, is, or will be directly or indirectly related to the specific recommendations or views as to the securities or companies. M
Partners compensates its research analysts from a variety of sources and research analysts may or may not receive compensation based upon M
Partners investment banking revenue.
Rating System Summary of Recommendations
Buy: Price expected to rise As of September 30, 2011
Sell: Price is inflated and expected to decrease Buy 42 93%
Hold: Properly priced Hold 2 5%
Speculative Buy: Price expected to rise; material risk to the investment exists Sell 1 2%
Under Review: Not currently rated Total 45 100%
M|PARTNERS
Research • Trading • Advisory