SlideShare uma empresa Scribd logo
1 de 8
Baixar para ler offline
February 14, 2006
                                    Equity Volatility Snapshot
      Ryan Renicker, CFA            •     Industry group returns and volatility. We analyze last week’s returns and changes in implied
        1.212.526.9425                    volatility across S&P 500 industry groups. This, combined with changes in call and put skews, can
ryan.renicker@lehman.com                  shed light on the risk expectations and potential directional biases the option market is pricing for
      Devapriya Mallick                   each underlying industry group.
       1.212.526.5429
     dmallik@lehman.com
                                    •     Expiration Watch. We highlight call and put strikes that are within 1% of the stock’s closing
                                          price having high open interest relative to the average volume in the underlying. This might
                                          indicate the stock is more likely to become “pinned” to the respective strike on expiration.


                                    •     Volatility Screen/Earnings Watch. We update our Volatility Screen to identify stocks possibly
                                          having rich or cheap options. We also update our Earnings Watch to estimate the expected stock
                                          price reaction the options market is pricing in for upcoming earnings releases.


Lehman Brothers does and seeks to do business with companies covered in its research reports. As a result, investors should be aware that the firm may have a conflict of
interest that could affect the objectivity of this report.

Customers of Lehman Brothers in the United States can receive independent, third-party research on the company or companies covered in this report, at no cost to them,
where such research is available. Customers can access this independent research at www.lehmanlive.com or can call 1-800-2LEHMAN to request a copy of this research.

Investors should consider this report as only a single factor in making their investment decision.


PLEASE SEE ANALYST(S) CERTIFICATION AND IMPORTANT DISCLOSURES BEGINNING ON PAGE 7.
Equity Derivatives Strategy | Equity Volatility Snapshot


                                  Industry Returns and Changing Risk Expectations
                                  We analyze last week’s1 performance of S&P 500 industry groups, and incorporate option market
                                  information to infer how each group’s risk expectations and potential directional biases (changes in put
                                  or call skews) reacted to each respective industry’s performance. As Figure 1 illustrates, last week’s
                                  returns tended to be negatively correlated with changes in implied volatility (which is typical). In Figure
                                  2, we present last week’s changes in put and call skews for each industry group2.

                                  Last week, the Telecom Services industry group gained 2.3% although its weighted-average 3-month
                                  ATM implied volatility rose as well, consistent with its trend since late January. This industry group also
                                  had the highest increase in its weighted-average call skew, possibly indicating a decline in demand
                                  for out-of-the-money calls on Telecom names.

                                  Implied volatility for the Auto & Components industry group ended higher last week, after the group
                                  declined about 1.5%. However, the industry’s put skew and call skew increased during the
                                  retracement, which we believe could be a signal that investors could have been buying downside
                                  protection and selling upside participation.

                                  Another industry group having interesting volatility vs. performance patterns was Software & Services,
                                  within which ATM implied volatility remained relatively flat, even as the group declined about 1.2% for
                                  the week. In addition, its put skew declined and at-the-money implied volatility rose relative to out-of-
                                  the-money call implied volatility.


Figure 1: Last Week’s Performance vs Change in 3M Implied Vol.                              Figure 2: Last Week’s Change in Put and Call Skew (in vol pts.)
                                                                                                                                 Put Skew Change   Call Skew Change
                        Tech Hard & Equip                                                               Industry Group
                                                                                                                                      (1 week)          (1 week)
                             Telecom Svc
                                                                                            House & Pers Prod                        0.03%              -2.41%
                       Comml Svc & Suppl
                            Capital Goods                                                   Semi & Semi Equip                        0.29%              -0.64%
                                Insurance                                                   Pharma & Biotech                         0.09%              -0.43%
                       H Care Equip & Svc                                                   Utilities                                0.10%              -0.25%
                        Semi & Semi Equip                                                   Food Bev & Tobacco                       0.33%              -0.22%
                            Transportation                                                  Insurance                                -0.10%             -0.19%
                         Pharma & Biotech                                                   Cons Dur & Apparel                       0.13%              -0.13%
                       Consumer Services                                                    Comml Svc & Suppl                        0.20%              -0.12%
                                      Banks                                                 Capital Goods                            -0.13%             -0.11%
                                       Media                                                Tech Hard & Equip                        0.40%              -0.06%
                                  Retailing                                                 Energy                                   -0.10%             -0.06%
                      Food Bev & Tobacco                                                    Banks                                    0.09%              -0.03%
                             Divers Financ
                                                                                            Divers Financ                            0.12%              -0.03%
                        Food & Stpls Retail
                                                                                            Transportation                           0.06%              -0.02%
                               Real Estate
                                                                                            H Care Equip & Svc                       0.11%              0.00%
                                      Utilities
                                                                                            Real Estate                              0.37%              0.00%
                        House & Pers Prod
                                                                                            Materials                                -0.36%             0.01%
                      Softw are & Services
                                                                                            Retailing                                0.10%              0.03%
                       Auto & Components
                       Cons Dur & Apparel                                                   Media                                    -0.92%             0.13%
                                 Materials                                                  Consumer Services                        -0.04%             0.23%
                                     Energy                                                 Food & Stpls Retail                      0.17%              0.45%
                                                                                            Software & Services                      -0.16%             0.85%
  -7%    -6%    -5%   -4%      -3%         -2%      -1%      0%      1%      2%   3%   4%
                                                                                            Auto & Components                        0.38%              1.14%
                        1-w eek Return        Implied Vol Change (1 w eek)
                                                                                            Telecom Svc                              0.29%              1.38%


Source: Lehman Brothers, OptionMetrics                                                      Source: Lehman Brothers, OptionMetrics


                                  1
                                       We define “last week” as the time period between the close on 2/6 and the close on 2/13.
                                  2
                                    We calculate each industry group’s put skew by taking the difference between the market-cap weighted 20 delta put
                                  implied volatility and ATM implied volatility for each constituent within the industry group. We calculate the call skew by
                                  taking the difference between the market-cap weighted-average ATM implied volatility and the 20 delta call implied
                                  volatility for each constituent within the industry group.


                                                                                                                                         February 14, 2006            2
Equity Derivatives Strategy | Equity Volatility Snapshot


                                 Expiration Only 3 Days Away: Stocks to Watch
                                 We found the return distribution on expiration for stocks closing near a strike price before expiration
                                 tends to have a higher probability of returns relatively close to 0%, versus the average S&P 500 stock.
                                 In addition, the probability of stocks becoming “pinned” to their respective strike price tends to be
                                 increase if their open interest of contracts outstanding is relatively high versus their average daily
                                 volume3. This phenomenon is possibly due to delta-hedging activity among traders who are long
                                 gamma, which is likely to dampen moves in the underlying since it involves buying the underlying
                                 shares as their price declines and selling shares as they rise.

                                 With expiration only 3 days away (2/17), we highlight the calls and puts (for stocks within the S&P
                                 500) expiring on Friday whose strikes are within 1% of last night’s closing price for each respective
                                 stock. Figure 3 and Figure 4 display the strike prices having the largest number of contracts
                                 outstanding as a proportion of the average daily volume in their underlying. The PRU 75 strike, HSP
                                 45 strike and UPS 75 strike have the highest total open interest (puts + calls) as a proportion of their
                                 respective average daily stock volumes.


Figure 3: Calls With Highest Open Interest / Volume Ratio                                  Figure 4: Puts With Highest Open Interest / Volume Ratio
                                                                                Open                                                                                       Open
                     Open                     Average Stock   Distance from                                     Open                     Average Stock   Distance from
  Ticker   Strike              Close (2/13)                                   Interest /     Ticker   Strike              Close (2/13)                                   Interest /
                    Interest                  Volume (20d)    Closing Price                                    Interest                  Volume (20d)    Closing Price
                                                                               Volume                                                                                     Volume
PRU          75      11,657       74.61         1,935,455         0.5%           60%       PRU          75      7,301        74.61         1,935,455         0.5%           38%
HSP          45      3,708        45.26          632,450          0.6%           59%       HSP          45      2,132        45.26          632,450          0.6%           34%
KSS          45      19,465       45.15         3,969,209         0.3%           49%       UPS          75      9,515        75.03         2,878,580         0.0%           33%
UPS          75      13,047       75.03         2,878,580         0.0%           45%       ABK          75      1,650        75.48          540,645          0.6%           31%
SIAL         65      1,533        64.87          397,547          0.2%           39%       TIN          45      2,945        44.62         1,002,500         0.9%           29%
SHLD        120      4,905       119.28         1,391,904         0.6%           35%       COP          60      32,177       59.45        12,281,621         0.9%           26%
RAI         100      2,014       100.94          605,870          0.9%           33%       IBM          80      16,988       80.44         6,948,270         0.5%           24%
ABK          75      1,669        75.48          540,645          0.6%           31%       IP          32.5     6,574         32.7         2,823,560         0.6%           23%
ABT         42.5     12,866       42.83         5,125,129         0.8%           25%       AMZN        37.5     18,090       37.86         8,220,290         1.0%           22%
GDT          75      12,683        74.9         5,168,400         0.1%           25%       KMI          90      1,871        90.44          900,515          0.5%           21%
HD           40      20,227        39.7         8,425,745         0.8%           24%       SHLD        120      2,796       119.28         1,391,904         0.6%           20%
COH          35      6,763        35.33         2,861,535         0.9%           24%       CMI         100      1,744         99.5          875,985          0.5%           20%
GD          120      2,071       119.92          881,270          0.1%           24%       GDT          75      9,576         74.9         5,168,400         0.1%           19%
MS           60      8,826        59.81         3,840,444         0.3%           23%       WHR          85      1,965        85.83         1,090,820         1.0%           18%
AXP         52.5     13,156       53.02         5,777,820         1.0%           23%       AA           30      9,445        30.24         5,778,825         0.8%           16%
JPM          40      26,350       39.77        11,681,051         0.6%           23%       PD          140      5,529       139.84         3,404,610         0.1%           16%
AT           60      5,320         59.9         2,362,020         0.2%           23%       ADP          45      4,253        45.41         2,627,360         0.9%           16%
NKE          85      5,465        84.28         2,450,665         0.9%           22%       KSS          45      6,356        45.15         3,969,209         0.3%           16%
BOL          70      1,927        70.05          907,370          0.1%           21%       HD           40      13,439        39.7         8,425,745         0.8%           16%
TIN          45      2,128        44.62         1,002,500         0.9%           21%       COH          35      4,324        35.33         2,861,535         0.9%           15%
CLX          60      2,003        60.31         1,013,735         0.5%           20%       CLX          60      1,521        60.31         1,013,735         0.5%           15%
IBM          80      13,630       80.44         6,948,270         0.5%           20%       MAS          30      4,015        29.91         2,714,950         0.3%           15%
TGT          55      7,373        54.54         3,965,574         0.8%           19%       NUE          80      4,682        79.36         3,181,790         0.8%           15%
KLAC        52.5     8,758        52.89         4,740,525         0.7%           18%       GS          140      5,814       139.65         4,064,250         0.3%           14%
CMI         100      1,564         99.5          875,985          0.5%           18%       XOM          60      30,370        59.6        21,462,878         0.7%           14%
DG          17.5     5,982        17.41         3,402,770         0.5%           18%       DD           40      6,975        40.15         5,245,469         0.4%           13%
AET         100      3,740         99.5         2,159,740         0.5%           17%       IPG          10      3,228        10.08         2,448,130         0.8%           13%
DD           40      8,772        40.15         5,245,469         0.4%           17%       HUM          50      2,964        50.42         2,386,240         0.8%           12%
COP          60      19,952       59.45        12,281,621         0.9%           16%       CI          120      1,351       119.69         1,102,635         0.3%           12%
PG           60      12,615       59.44         7,924,454         0.9%           16%       YUM          50      1,686        50.09         1,420,765         0.2%           12%


Source: Lehman Brothers, OptionMetrics                                                     Source: Lehman Brothers, OptionMetrics


                                 3
                                  Please see our report Impact of Option Expiration on Underlying Price Changes, Options Strategy Monthly, February
                                 2006 for further details.


                                                                                                                                              February 14, 2006                       3
Equity Derivatives Strategy | Equity Volatility Snapshot


                                    Lehman Brothers Volatility Screen
                                    We update the list of stocks identified by the Lehman Brothers Volatility Screen as possibly having rich
                                    or cheap options. This screen allows investors to identify potentially rich or cheap one or three month
                                    options to efficiently express directional views on the underlying stock or identify attractive long or short
                                    volatility candidates. In Figure 5, we present the current list of stocks having relatively rich options.


Figure 5: Stocks Displaying “Rich” Volatility Characteristics
                                                                                                                                Std Devs from   Std Devs from    Std Devs from
                                                                   Lehman                              Expected    3-Month
                                                                                 Lehman                                         Mean (3-Month   Mean (3-Month   Mean (3-Month
 Ticker               Name                   GICS Sector           Company                    Price    Earnings    Implied                                                       Rich/Cheap
                                                                                Sector View                                       Implied vs      Implied vs    Implied vs S&P
                                                                    Rating                               Date      Volatility
                                                                                                                                   Realized)        Sector)           500)
AAPL      APPLE COMPUTER INC          Information Technology     2-Equal weight 2-Neutral      64.71   4/13/2006     48%             1.2              1.2              1.4          Rich
ALEX      ALEXANDER & BALDWIN INC     Industrials                0-Unrated      0-Unrated      47.45   4/27/2006     29%             1.3              1.6              1.6          Rich
ALL       ALLSTATE CORP               Financials                 1-Overweight   1-Positive     52.64   4/20/2006     19%             1.2              1.5              1.5          Rich
ASO       AMSOUTH BANCORPORATION      Financials                 3-Underweight 2-Neutral       26.92   4/19/2006     19%             1.5              1.6              1.5          Rich
AVP       AVON PRODUCTS INC           Consumer Staples           3-Underweight 2-Neutral       27.24   5/2/2006      29%             1.1              1.5              1.4          Rich
BEC       BECKMAN COULTER INC         Health Care                0-Unrated      0-Unrated      58.71   2/17/2006     29%             1.8              2.0              2.0          Rich
BHI       BAKER HUGHES INC            Energy                     2-Equal weight 1-Positive     69.26   2/16/2006     39%             1.6              1.6              4.3          Rich
BKH       BLACK HILLS CORP            Utilities                  RS-Rating Suspe2-Neutral      34.37   5/9/2006      23%             2.3              1.8              1.6          Rich
BLI       BIG LOTS INC                Consumer Discretionary     0-Unrated      0-Unrated      13.22   2/23/2006     40%             1.9              1.7              1.6          Rich
BTU       PEABODY ENERGY CORP         Energy                     1-Overweight   1-Positive     85.51   4/19/2006     47%             1.6              1.5              2.0          Rich
CAKE      CHEESECAKE FACTORY (THE)    Consumer Discretionary     2-Equal weight 2-Neutral      36.19   4/19/2006     30%             2.3              1.4              1.8          Rich
CAT       CATERPILLAR INC             Industrials                2-Equal weight 2-Neutral      68.62   4/24/2006     27%             1.3              1.9              1.8          Rich
DELL      DELL INC                    Information Technology     1-Overweight   2-Neutral      31.57   2/16/2006     26%             1.0              1.5              1.8          Rich
DLX       DELUXE CORP                 Industrials                0-Unrated      0-Unrated      26.17   4/28/2006     26%             1.2              2.6              2.4          Rich
DNR       DENBURY RESOURCES INC       Energy                     2-Equal weight 1-Positive     26.55   2/23/2006     46%             2.8              1.4              2.1          Rich
DVN       DEVON ENERGY CORPORATION Energy                        1-Overweight   1-Positive     58.00   5/4/2006      39%             1.2              1.9              2.1          Rich
EOP       EQUITY OFFICE PROPERTIES TR Financials                 3-Underweight 2-Neutral       30.02   4/28/2006     22%             1.4              1.2              1.1          Rich
ESRX      EXPRESS SCRIPTS INC         Health Care                2-Equal weight 2-Neutral      91.63   2/22/2006     37%             1.8              2.4              2.1          Rich
EXC       EXELON CORP                 Utilities                  1-Overweight   3-Negative     55.59   4/25/2006     25%             2.4              1.6              1.4          Rich
FLR       FLUOR CORP                  Industrials                2-Equal weight 2-Neutral      81.12   3/1/2006      29%             2.7              1.3              1.3          Rich
FPL       FPL GROUP INC               Utilities                  RS-Rating Suspe3-Negative     41.66   4/26/2006     19%             1.3              1.0              1.2          Rich
GM        GENERAL MOTORS CORP         Consumer Discretionary     2-Equal weight 3-Negative     22.00   4/19/2006     70%             1.0              2.1              2.0          Rich
GPC       GENUINE PARTS CO            Consumer Discretionary     2-Equal weight 3-Negative     42.14   2/21/2006     20%             2.0              1.6              1.8          Rich
HNZ       HJ HEINZ CO                 Consumer Staples           2-Equal weight 3-Negative     35.26   2/28/2006     19%             2.9              2.9              2.2          Rich
HPQ       HEWLETT-PACKARD CO          Information Technology     1-Overweight   2-Neutral      31.74   2/15/2006     32%             1.7              2.3              2.4          Rich
ISRG      INTUITIVE SURGICAL INC      Health Care                0-Unrated      0-Unrated     101.02   4/21/2006     60%             1.4              2.4              2.2          Rich
JP        JEFFERSON-PILOT CORP        Financials                 RS-Rating Suspe2-Neutral      58.46   4/27/2006     29%             4.7              5.0              4.8          Rich
KRI       KNIGHT RIDDER INC           Consumer Discretionary     3-Underweight 3-Negative      62.48   4/13/2006     25%             3.0              2.1              1.8          Rich
KSE       KEYSPAN CORP                Utilities                  2-Equal weight 2-Neutral      36.03   2/24/2006     17%             1.2              1.2              1.9          Rich
LEA       LEAR CORP                   Consumer Discretionary     3-Underweight 3-Negative      22.36   4/21/2006     53%             1.7              2.7              2.5          Rich
LTR       LOEWS CORP                  Financials                 0-Unrated      0-Unrated      95.72   2/16/2006     21%             2.5              1.7              1.5          Rich
MAS       MASCO CORP                  Industrials                2-Equal weight 2-Neutral      29.91   2/14/2006     25%             1.8              1.8              1.8          Rich
MHK       MOHAWK INDUSTRIES INC       Consumer Discretionary     2-Equal weight 2-Neutral      80.63   2/15/2006     25%             1.5              2.1              2.4          Rich
MI        MARSHALL & ILSLEY CORP      Financials                 2-Equal weight 2-Neutral      42.23   4/12/2006     19%             2.9              2.3              1.9          Rich
MO        ALTRIA GROUP INC            Consumer Staples           2-Equal weight 1-Positive     71.25   4/20/2006     28%             1.4              1.4              1.4          Rich
MRBK      MERCANTILE BANKSHARES CORPFinancials                   1-Overweight   2-Neutral      37.00   4/26/2006     22%             3.2              2.8              2.6          Rich
MYG       MAYTAG CORP                 Consumer Discretionary     0-Unrated      0-Unrated      16.61   4/21/2006     64%             1.9              2.8              2.9          Rich
NAV       NAVISTAR INTERNATIONAL      Industrials                0-Unrated      0-Unrated      27.32   2/28/2006     39%             1.2              1.7              1.7          Rich
NUE       NUCOR CORP                  Materials                  2-Equal weight 1-Positive     79.36   4/21/2006     43%             1.9              1.0              1.6          Rich
OKE       ONEOK INC                   Utilities                  1-Overweight   2-Neutral      26.59   2/22/2006     24%             2.3              1.0              1.2          Rich
ORI       OLD REPUBLIC INTL CORP      Financials                 0-Unrated      0-Unrated      21.26   4/28/2006     20%             1.1              1.1              1.2          Rich
REG       REGENCY CENTERS CORP        Financials                 0-Unrated      0-Unrated      61.83   5/3/2006      22%             1.9              1.3              1.3          Rich
RL        POLO RALPH LAUREN CORP      Consumer Discretionary     0-Unrated      0-Unrated      55.00   6/9/2006      29%             1.2              1.2              1.4          Rich
RYN       RAYONIER INC                Financials                 0-Unrated      0-Unrated      41.14   4/26/2006     21%             1.1              1.2              1.2          Rich
SAFC      SAFECO CORP                 Financials                 1-Overweight   1-Positive     51.66   4/19/2006     23%             1.9              2.3              2.1          Rich
SFG       STANCORP FINANCIAL GROUP    Financials                 3-Underweight 2-Neutral       51.70   4/26/2006     27%             1.6              2.1              1.9          Rich
SHW       SHERWIN-WILLIAMS CO/THE     Consumer Discretionary     0-Unrated      0-Unrated      53.03   4/21/2006     27%             2.3              3.5              2.8          Rich
SII       SMITH INTERNATIONAL INC     Energy                     2-Equal weight 1-Positive     38.52   4/25/2006     41%             1.3              1.3              4.3          Rich
SOV       SOVEREIGN BANCORP INC       Financials                 RS-Rating Suspe1-Positive     20.64   4/19/2006     26%             1.5              1.4              1.4          Rich
STR       QUESTAR CORP                Utilities                  1-Overweight   2-Neutral      74.92   2/14/2006     31%             1.4              1.2              1.2          Rich
SWN       SOUTHWESTERN ENERGY CO      Energy                     0-Unrated      0-Unrated      32.64   2/28/2006     56%             2.1              1.2              1.5          Rich
TRB       TRIBUNE CO                  Consumer Discretionary     3-Underweight 3-Negative      30.74   4/13/2006     24%             1.6              1.5              1.4          Rich
VRX       VALEANT PHARMACEUTICALS INTHealth Care                 0-Unrated      0-Unrated      17.08   2/24/2006     72%             2.3              2.6              2.5          Rich
WHR       WHIRLPOOL CORP              Consumer Discretionary     0-Unrated      0-Unrated      85.83   4/21/2006     30%             1.1              1.1              1.4          Rich
WMI       WASTE MANAGEMENT INC        Industrials                1-Overweight   1-Positive     33.04   2/14/2006     20%             1.2              1.0              1.8          Rich
WTR       AQUA AMERICA INC            Utilities                  0-Unrated      0-Unrated      27.28   2/17/2006     30%             3.6              1.9              1.8          Rich
X         UNITED STATES STEEL CORP    Materials                  2-Equal weight 1-Positive     54.28   4/26/2006     55%             2.6              3.1              4.1          Rich


Source: Lehman Brothers, OptionMetrics, Bloomberg, FAME
Note: This screen does not exclude stocks with illiquid options. Investors should consider liquidity before entering into an options position. Stocks that appear as unrated are either
not covered by Lehman Brothers fundamental analysts or are currently subject to research restrictions. Our universe includes stocks included in either the S&P 500 or the NDX.

                                    In Figure 6, we provide the current list of stocks having relatively cheap options.


Figure 6: Stocks Displaying “Cheap” Volatility Characteristics
                                                                                                                                Std Devs from   Std Devs from    Std Devs from
                                                                   Lehman                              Expected    3-Month
                                                                                 Lehman                                         Mean (3-Month   Mean (3-Month   Mean (3-Month
 Ticker               Name                   GICS Sector           Company                    Price    Earnings    Implied                                                       Rich/Cheap
                                                                                Sector View                                       Implied vs      Implied vs    Implied vs S&P
                                                                    Rating                               Date      Volatility
                                                                                                                                   Realized)        Sector)           500)
ACS       AFFILIATED COMPUTER SVCS-A    Information Technology   0-Unrated      0-Unrated      62.49   4/21/2006     23%             -2.4            -1.9             -1.2         Cheap
C         CITIGROUP INC                 Financials               1-Overweight   1-Positive     45.68   4/13/2006     15%             -1.7            -1.1             -1.1         Cheap
CSCO      CISCO SYSTEMS INC             Information Technology   RS-Rating Suspe2-Neutral      19.55   5/10/2006     21%             -1.3            -2.1             -1.4         Cheap
DGX       QUEST DIAGNOSTICS             Health Care              1-Overweight   2-Neutral      51.96   4/21/2006     18%             -1.1            -1.2             -1.3         Cheap
EW        EDWARDS LIFESCIENCES CORP     Health Care              0-Unrated      0-Unrated      43.31   4/21/2006     20%             -2.0            -1.2             -1.0         Cheap
HC        HANOVER COMPRESSOR CO         Energy                   2-Equal weight 1-Positive     16.16   2/15/2006     31%             -1.6            -1.9             -1.1         Cheap
MNST      MONSTER WORLDWIDE INC         Industrials              0-Unrated      0-Unrated      46.96   4/26/2006     36%             -1.2            -1.3             -1.3         Cheap
PLCM      POLYCOM INC                   Information Technology   1-Overweight   2-Neutral      19.23   4/20/2006     34%             -2.2            -2.3             -1.6         Cheap
SMTC      SEMTECH CORP                  Information Technology   2-Equal weight 1-Positive     19.06   3/1/2006      34%             -2.4            -1.9             -1.4         Cheap
UVN       UNIVISION COMMUNICATIONS-A    Consumer Discretionary   1-Overweight   3-Negative     34.40   3/2/2006      27%             -1.1            -2.0             -1.6         Cheap


Source: Lehman Brothers, OptionMetrics, Bloomberg, FAME
Note: Acquisition targets with very low volatility have been removed from this list. Stocks that appear as unrated are either not covered by Lehman Brothers fundamental analysts or
are currently subject to research restrictions. Our universe includes stocks included in either the S&P 500 or the NDX.


                                                                                                                                                                February 14, 2006             4
Equity Derivatives Strategy | Equity Volatility Snapshot


                                   Earnings Watch: Companies Reporting 2/14 – 2/24
                                   We incorporate implied volatility information to ascertain the expected stock price reaction priced in
                                   by the options market for upcoming earnings announcements. Please see Options Strategy Monthly:
                                                          th
                                   Low Volatility in the 7 Inning? (January 10, 2006) for further details.

                                   In Figure 7, we present this week’s edition of the Earnings Watch.


Figure 7: Expected Absolute Stock Price Reactions to Upcoming Earnings Announcements
                                                                                                               Average Absolute Stock Price         Average Stock Price Move
                                                           Expected                      Implied 1-day Stock
      Ticker                     Name                                  Price (1/23/06)                           Move Following Earnings               Following Earnings
                                                         Earnings Date                       Price Move
                                                                                                                     Announcements                      Announcements
DE             DEERE & CO                                  14-Feb-06            73.80           2.7%                      4.7%                                -0.2%
SIAL           SIGMA-ALDRICH                               14-Feb-06            64.87           0.9%                      2.9%                                0.7%
AMAT           APPLIED MATERIALS INC                       15-Feb-06            19.86           3.1%                      1.7%                                0.4%
BIIB           BIOGEN IDEC INC                             15-Feb-06            43.71           1.1%                      2.0%                                1.0%
DTE            DTE ENERGY COMPANY                          15-Feb-06            42.23           0.5%                      0.9%                                -0.4%
FE             FIRSTENERGY CORP                            15-Feb-06            48.84           0.8%                      0.9%                                0.1%
GENZ           GENZYME CORP                                15-Feb-06            67.54           2.2%                      3.6%                                1.2%
HPQ            HEWLETT-PACKARD CO                          15-Feb-06            31.74           4.8%                      5.3%                                1.0%
JNY            JONES APPAREL GROUP INC                     15-Feb-06            31.64           4.4%                      3.6%                                -0.1%
NTAP           NETWORK APPLIANCE INC                       15-Feb-06            31.43           5.2%                      8.0%                                3.2%
ODP            OFFICE DEPOT INC                            15-Feb-06            32.94           3.1%                      3.4%                                1.2%
PGN            PROGRESS ENERGY INC                         15-Feb-06            44.18           1.2%                      0.8%                                -0.3%
BHI            BAKER HUGHES INC                            16-Feb-06            69.26           1.0%                      2.3%                                -0.2%
DELL           DELL INC                                    16-Feb-06            31.57           3.6%                      4.8%                                1.2%
INTU           INTUIT INC                                  16-Feb-06            53.08           2.8%                      4.9%                                -1.6%
JCP            J.C. PENNEY CO INC                          16-Feb-06            55.40           1.9%                      2.9%                                0.6%
LTR            LOEWS CORP                                  16-Feb-06            95.72           1.3%                      1.6%                                0.9%
NVDA           NVIDIA CORP                                 16-Feb-06            44.05           5.6%                      10.4%                               0.4%
PLD            PROLOGIS                                    16-Feb-06            50.75           0.8%                      1.7%                                -0.2%
TGT            TARGET CORP                                 16-Feb-06            54.54           1.5%                      2.0%                                0.9%
WPI            WATSON PHARMACEUTICALS INC                  16-Feb-06            32.12           3.2%                      5.7%                                0.4%
CPB            CAMPBELL SOUP CO                            17-Feb-06            29.45           0.7%                      2.7%                                0.0%
PCG            P G & E CORP                                17-Feb-06            36.75           0.8%                        0.9%                              -0.3%
RSH            RADIOSHACK CORP                             17-Feb-06            21.52           3.0%                        4.4%                              -0.7%
CCU            CLEAR CHANNEL COMMUNICATIONS                21-Feb-06            28.66           1.0%                        1.3%                              -0.6%
GPC            GENUINE PARTS CO                            21-Feb-06            42.14           0.9%                        2.9%                               1.7%
NOVL           NOVELL INC                                  22-Feb-06             9.07           1.5%                        6.0%                              -2.7%
RRD            RR DONNELLEY & SONS CO                      22-Feb-06            31.75           1.0%                        1.4%                               0.4%
S              SPRINT NEXTEL CORP                          22-Feb-06            22.96           1.4%                        1.9%                               0.3%
SRE            SEMPRA ENERGY                               22-Feb-06            46.70           0.9%                        1.3%                               0.3%
BLI            BIG LOTS INC                                23-Feb-06            13.22           1.7%                        3.9%                               3.2%
CMS            CMS ENERGY CORP                             23-Feb-06            14.15           0.9%                        1.9%                              -0.9%
DCN            DANA CORP                                   23-Feb-06             4.08           4.7%                        2.4%                               0.3%
GPS            GAP INC/THE                                 23-Feb-06            18.00           0.8%                        2.0%                              -1.1%
LTD            LIMITED BRANDS INC                          23-Feb-06            23.84           1.0%                        2.1%                              -1.2%
SWY            SAFEWAY INC                                 23-Feb-06            22.44           0.1%                        3.3%                              -0.5%
AIG            AMERICAN INTERNATIONAL GROUP                24-Feb-06            67.94           0.7%                        1.9%                               1.0%
CZN            CITIZENS COMMUNICATIONS CO                  24-Feb-06            12.26           0.7%                        1.1%                              -0.2%
KSE            KEYSPAN CORP                                24-Feb-06            36.03           0.7%                        1.1%                              -0.1%

Source: Source: Lehman Brothers, Bloomberg
Note: This list does not exclude illiquid options. Investors should consider liquidity of options before entering a trade. For details on the methodology we use to calculate the implied
stock price move, please see “Earnings Impact on Implied and Realized Volatility”, included in the Options Strategy Monthly, January 10, 2006.


                                                                                                                                                   February 14, 2006                   5
Equity Derivatives Strategy | Equity Volatility Snapshot


                              Volatility Screen User Interface

                                                                                                        Obtain Implied Volatility
                                                                                                           Analytics for an
                                                                                                           Individual Stock


                                                                                                                         Screen Universe for
                                                                                                                       Rich/Cheap Volatility, By
                                                                                                                        Sector, Analyst Rating,
                                                                                                                           Earnings Period


                      Implied and Realized Volatility                                             Implied and Realized Rich/Cheap Indicators for
                       for Individual Stock Screened                                                        Individual Stock Screened

Note: Stocks that appear as unrated are either not covered by Lehman Brothers fundamental analysts or are currently subject to research restrictions.

                              Volatility Screen Summary Output
                                                                                              Number of Standard Deviations Above or Below
                                                                                                         Spreads’ 2-Year Average
                                                        Current 1-Month                          If > 1 then “Rich”. If < -1 then “Cheap”
                                                        Implied Volatility


                                                                                              Rich/Cheap Metrics:              Rich/Cheap Metrics:
                              Company Details                                                       1-Month                          3-Month
                                                                                                Implied Volatility               Implied Volatility


                                                                                                                              February 14, 2006         6
Equity Derivatives Strategy | Equity Volatility Snapshot


Analyst Certification:
The respective research analysts responsible for the fundamental ratings hereby certify (1) that the views expressed in this research email accurately reflect our
personal views about any or all of the subject securities or issuers referred to in this email and (2) no part of our compensation was, is or will be directly or indirectly
related to the specific recommendations or views expressed in this email.

I, Ryan Renicker, hereby certify (1) that the views expressed in this research email accurately reflect my personal views about any or all of the subject securities or
issuers referred to in this email and (2) no part of my compensation was, is or will be directly or indirectly related to the specific recommendations or views expressed
in this email.

To the extent that any of the conclusions are based on a quantitative model, Lehman Brothers hereby certifies (1) that the views expressed in this research email
accurately reflect the firm's quantitative research model (2) no part of the firm's compensation was, is or will be directly or indirectly related to the specific
recommendations or views expressed in this research report.

Important Disclosures
Lehman Brothers does and seeks to do business with companies covered in its research reports. As a result, investors should be aware that the firm may have a
conflict of interest that could affect the objectivity of this email communication.


Customers of Lehman Brothers in the United States can receive independent, third-party research on the company or companies covered in this report, at no cost to
them, where such research is available. Customers can access this independent research at www.lehmanlive.com or can call 1-800-2-LEHMAN to request a copy of
this research.

Investors should consider this communication as only a single factor in making their investment decision.


The analysts responsible for preparing this report have received compensation based upon various factors including the Firm’s total revenues, a portion of which is
generated by investment banking activities.


Stock price and ratings history charts along with other important disclosures are available on our disclosure website at www.lehman.com/disclosures


And may also be obtained by sending a written request to: LEHMAN BROTHERS CONTROL ROOM , 745 SEVENTH AVENUE, 19TH FLOOR NEW YORK, NY
10019


Options are not suitable for all investors and the risks of option trading should be weighed against the potential rewards.
Supporting documents that form the basis of the recommendations are available on request. Please note that the trade ideas within
this report in no way relate to the fundamental ratings applied to European stocks by Lehman Brothers' Equity Research.

Guide to Lehman Brothers Equity Research Rating System

Our coverage analysts use a relative rating system in which they rate stocks as 1-Overweight, 2- Equal weight or 3-Underweight (see definitions below) relative to other
companies covered by the analyst or a team of analysts that are deemed to be in the same industry sector (“the sector coverage universe”). To see a list of companies that
comprise a particular sector coverage universe, please go to www.lehman.com/disclosures.

In addition to the stock rating, we provide sector views which rate the outlook for the sector coverage universe as 1-Positive, 2-Neutral or 3-Negative (see definitions below).
A rating system using terms such as buy, hold and sell is not the equivalent of our rating system. Investors should carefully read the entire research report including the
definitions of all ratings and not infer its contents from ratings alone.


Stock Rating

1-Overweight - The stock is expected to outperform the unweighted expected total return of the sector coverage universe over a 12-month investment horizon.

2-Equal weight - The stock is expected to perform in line with the unweighted expected total return of the sector coverage universe over a 12-month investment horizon.

3-Underweight - The stock is expected to underperform the unweighted expected total return of the sector coverage universe over a 12-month investment horizon.

RS-Rating Suspended - The rating and target price have been suspended temporarily to comply with applicable regulations and/or firm policies in certain circumstances
including when Lehman Brothers is acting in an advisory capacity on a merger or strategic transaction involving the company.Sector View

1-Positive - sector coverage universe fundamentals are improving.

2-Neutral - sector coverage universe fundamentals are steady, neither improving nor deteriorating.

3-Negative - sector coverage universe fundamentals are deteriorating.


                                                                                                                                                February 14, 2006                  7
Equity Derivatives Strategy | Equity Volatility Snapshot


Distribution of Ratings:

Lehman Brothers Equity Research has 1859 companies under coverage.

43% have been assigned a 1-Overweight rating which, for purposes of mandatory disclosures, is classified as a Buy rating, 35% of companies with this rating are investment
banking clients of the Firm.

40% have been assigned a 2-Equal weight rating which, for purposes of mandatory disclosures, is classified as a Hold rating, 6% of companies with this rating are
investment banking clients of the Firm.

17% have been assigned a 3-Underweight rating which, for purposes of mandatory disclosures, is classified as a Sell rating, 76% of companies with this rating are
investment banking clients of the Firm.


This material has been prepared and/or issued by Lehman Brothers Inc., member SIPC, and/or one of its affiliates (“Lehman Brothers”) and has been approved by
Lehman Brothers International (Europe), authorized and regulated by the Financial Services Authority, in connection with its distribution in the European Economic
Area. This material is distributed in Japan by Lehman Brothers Japan Inc., and in Hong Kong by Lehman Brothers Asia Limited. This material is distributed in Australia
by Lehman Brothers Australia Pty Limited, and in Singapore by Lehman Brothers Inc., Singapore Branch. (“LBIS”). Where this material is distributed by LBIS, please
note that it is intended for general circulation only and the recommendations contained herein does not take into account the specific investment objectives, financial
situation or particular needs of any particular person. An investor should consult his Lehman Brothers’ representative regarding the suitability of the product and take
into account his specific investment objectives, financial situation or particular needs before he makes a commitment to purchase the investment product. This material
is distributed in Korea by Lehman Brothers International (Europe) Seoul Branch. This document is for information purposes only and it should not be regarded as an
offer to sell or as a solicitation of an offer to buy the securities or other instruments mentioned in it. No part of this document may be reproduced in any manner
without the written permission of Lehman Brothers. With the exception of disclosures relating to Lehman Brothers, this research report is based on current public
information that Lehman Brothers considers reliable, but we make no representation that it is accurate or complete, and it should not be relied on as such. In the case
of any disclosure to the effect that Lehman Brothers Inc. or its affiliates beneficially own 1% or more of any class of common equity securities of the subject company,
the computation of beneficial ownership of securities is based upon the methodology used to compute ownership under Section 13(d) of the United States' Securities
Exchange Act of 1934. In the case of any disclosure to the effect that Lehman Brothers Inc. and/or its affiliates hold a short position of at least 1% of the outstanding
share capital of a particular company, such disclosure relates solely to the ordinary share capital of the company. Accordingly, while such calculation represents
Lehman Brothers’ holdings net of any long position in the ordinary share capital of the company, such calculation excludes any rights or obligations that Lehman
Brothers may otherwise have, or which may accrue in the future, with respect to such ordinary share capital. Similarly such calculation does not include any shares
held or owned by Lehman Brothers where such shares are held under a wider agreement or arrangement (be it with a client or a counterparty) concerning the shares
of such company (e.g. prime broking and/or stock lending activity). Any such disclosure represents the position of Lehman Brothers as of the last business day of the
calendar month preceding the date of this report.


This material is provided with the understanding that Lehman Brothers is not acting in a fiduciary capacity. Opinions expressed herein reflect the opinion of Lehman
Brothers and are subject to change without notice. The products mentioned in this document may not be eligible for sale in some states or countries, and they may not
be suitable for all types of investors. If an investor has any doubts about product suitability, he should consult his Lehman Brothers representative. The value of and the
income produced by products may fluctuate, so that an investor may get back less than he invested. Value and income may be adversely affected by exchange rates,
interest rates, or other factors. Past performance is not necessarily indicative of future results. If a product is income producing, part of the capital invested may be
used to pay that income. © 2006 Lehman Brothers. All rights reserved. Additional information is available on request. Please contact a Lehman Brothers entity in your
home jurisdiction.


Lehman Brothers policy for managing conflicts of interest in connection with investment research is available at www.lehman.com/researchconflictspolicy. Ratings,
earnings per share forecasts and price targets contained in the Firm's equity research reports covering U.S. companies are available at
www.lehman.com/disclosures.

Complete disclosure information on companies covered by Lehman Brothers Equity Research is available at www.lehman.com/disclosures.


                                                                                                                                            February 14, 2006                 8

Mais conteúdo relacionado

Mais procurados

CTIA Playbook June 2012
CTIA Playbook June 2012CTIA Playbook June 2012
CTIA Playbook June 2012Mosio
 
BillingViews Direct-to-Bill Mobile Payment Survey Details
BillingViews Direct-to-Bill Mobile Payment Survey DetailsBillingViews Direct-to-Bill Mobile Payment Survey Details
BillingViews Direct-to-Bill Mobile Payment Survey DetailsBillingViews
 
Strategic analysis telco ismael soto oct 2012
Strategic analysis telco ismael soto   oct 2012Strategic analysis telco ismael soto   oct 2012
Strategic analysis telco ismael soto oct 2012Yatepeino.com
 
Multiplus - Credit Suisse Conference
Multiplus - Credit Suisse ConferenceMultiplus - Credit Suisse Conference
Multiplus - Credit Suisse ConferenceMultiplus
 
Compostition of services growth in indian economy
Compostition of services growth in indian economyCompostition of services growth in indian economy
Compostition of services growth in indian economyiim indore
 

Mais procurados (6)

Carlos Danel Is Transparency Enough?
Carlos Danel Is Transparency Enough?Carlos Danel Is Transparency Enough?
Carlos Danel Is Transparency Enough?
 
CTIA Playbook June 2012
CTIA Playbook June 2012CTIA Playbook June 2012
CTIA Playbook June 2012
 
BillingViews Direct-to-Bill Mobile Payment Survey Details
BillingViews Direct-to-Bill Mobile Payment Survey DetailsBillingViews Direct-to-Bill Mobile Payment Survey Details
BillingViews Direct-to-Bill Mobile Payment Survey Details
 
Strategic analysis telco ismael soto oct 2012
Strategic analysis telco ismael soto   oct 2012Strategic analysis telco ismael soto   oct 2012
Strategic analysis telco ismael soto oct 2012
 
Multiplus - Credit Suisse Conference
Multiplus - Credit Suisse ConferenceMultiplus - Credit Suisse Conference
Multiplus - Credit Suisse Conference
 
Compostition of services growth in indian economy
Compostition of services growth in indian economyCompostition of services growth in indian economy
Compostition of services growth in indian economy
 

Semelhante a Equity volatility snapshot21406

The Suprising Technology Economics of Mainframes vs Distributed Servers
The Suprising Technology Economics of Mainframes vs Distributed ServersThe Suprising Technology Economics of Mainframes vs Distributed Servers
The Suprising Technology Economics of Mainframes vs Distributed Serversjabenjamusibm
 
The Surprising Technology Economics of Mainframe vs. Distributed Servers:
The Surprising Technology Economics of Mainframe vs. Distributed Servers:The Surprising Technology Economics of Mainframe vs. Distributed Servers:
The Surprising Technology Economics of Mainframe vs. Distributed Servers:IBM India Smarter Computing
 
2012 Connell & Partners Fall Pulse Survey Participant Report
2012 Connell & Partners Fall Pulse Survey Participant Report2012 Connell & Partners Fall Pulse Survey Participant Report
2012 Connell & Partners Fall Pulse Survey Participant ReportConnell & Partners
 
Sebacia Inc.- Startup Company Venture Capital Financing Deal Terms & Valuations
Sebacia Inc.- Startup Company Venture Capital Financing Deal Terms & ValuationsSebacia Inc.- Startup Company Venture Capital Financing Deal Terms & Valuations
Sebacia Inc.- Startup Company Venture Capital Financing Deal Terms & ValuationsVC Experts, Inc.
 
air products & chemicals 2008 June3 JPMorgan
air products & chemicals 2008 June3 JPMorganair products & chemicals 2008 June3 JPMorgan
air products & chemicals 2008 June3 JPMorganfinance26
 
air products & chemicals 2008 May 21 Goldman Sachs
air products & chemicals 2008 May 21 Goldman Sachsair products & chemicals 2008 May 21 Goldman Sachs
air products & chemicals 2008 May 21 Goldman Sachsfinance26
 
SU Student Investment Fund - Fall 2010
SU Student Investment Fund - Fall 2010SU Student Investment Fund - Fall 2010
SU Student Investment Fund - Fall 2010fb18077
 
Korea Fund, Inc. Second Quarter 2012
Korea Fund, Inc. Second Quarter 2012Korea Fund, Inc. Second Quarter 2012
Korea Fund, Inc. Second Quarter 2012Company Spotlight
 
pepco AugustInvestorMeetings2007Final
pepco AugustInvestorMeetings2007Finalpepco AugustInvestorMeetings2007Final
pepco AugustInvestorMeetings2007Finalfinance41
 
Sri Lanka Stock Market Quarterly earnings update sep 2011
Sri Lanka Stock Market Quarterly earnings update sep 2011Sri Lanka Stock Market Quarterly earnings update sep 2011
Sri Lanka Stock Market Quarterly earnings update sep 2011Ishara Gamage
 
Q11 Healthcare Report
Q11 Healthcare ReportQ11 Healthcare Report
Q11 Healthcare ReportMMMTechLaw
 
Industrials M&A Report
Industrials M&A ReportIndustrials M&A Report
Industrials M&A ReportMMMTechLaw
 
2012 SMB Disaster Preparedness Survey Global Results May 2012
2012 SMB Disaster Preparedness Survey Global Results May 20122012 SMB Disaster Preparedness Survey Global Results May 2012
2012 SMB Disaster Preparedness Survey Global Results May 2012Symantec
 
Corporate Earnings Watch - Expected Stock Price Movement on Announcement
Corporate Earnings Watch - Expected Stock Price Movement on AnnouncementCorporate Earnings Watch - Expected Stock Price Movement on Announcement
Corporate Earnings Watch - Expected Stock Price Movement on AnnouncementRYAN RENICKER
 

Semelhante a Equity volatility snapshot21406 (20)

The Suprising Technology Economics of Mainframes vs Distributed Servers
The Suprising Technology Economics of Mainframes vs Distributed ServersThe Suprising Technology Economics of Mainframes vs Distributed Servers
The Suprising Technology Economics of Mainframes vs Distributed Servers
 
The Surprising Technology Economics of Mainframe vs. Distributed Servers:
The Surprising Technology Economics of Mainframe vs. Distributed Servers:The Surprising Technology Economics of Mainframe vs. Distributed Servers:
The Surprising Technology Economics of Mainframe vs. Distributed Servers:
 
2012 Connell & Partners Fall Pulse Survey Participant Report
2012 Connell & Partners Fall Pulse Survey Participant Report2012 Connell & Partners Fall Pulse Survey Participant Report
2012 Connell & Partners Fall Pulse Survey Participant Report
 
Sebacia Inc.- Startup Company Venture Capital Financing Deal Terms & Valuations
Sebacia Inc.- Startup Company Venture Capital Financing Deal Terms & ValuationsSebacia Inc.- Startup Company Venture Capital Financing Deal Terms & Valuations
Sebacia Inc.- Startup Company Venture Capital Financing Deal Terms & Valuations
 
air products & chemicals 2008 June3 JPMorgan
air products & chemicals 2008 June3 JPMorganair products & chemicals 2008 June3 JPMorgan
air products & chemicals 2008 June3 JPMorgan
 
3Q11 Results Presentation
3Q11 Results Presentation3Q11 Results Presentation
3Q11 Results Presentation
 
air products & chemicals 2008 May 21 Goldman Sachs
air products & chemicals 2008 May 21 Goldman Sachsair products & chemicals 2008 May 21 Goldman Sachs
air products & chemicals 2008 May 21 Goldman Sachs
 
SU Student Investment Fund - Fall 2010
SU Student Investment Fund - Fall 2010SU Student Investment Fund - Fall 2010
SU Student Investment Fund - Fall 2010
 
Korea fund4q presentation
Korea fund4q presentationKorea fund4q presentation
Korea fund4q presentation
 
AEP | Credit Suisse 2011 Energy Summit
AEP | Credit Suisse 2011 Energy SummitAEP | Credit Suisse 2011 Energy Summit
AEP | Credit Suisse 2011 Energy Summit
 
Korea Fund, Inc. Second Quarter 2012
Korea Fund, Inc. Second Quarter 2012Korea Fund, Inc. Second Quarter 2012
Korea Fund, Inc. Second Quarter 2012
 
pepco AugustInvestorMeetings2007Final
pepco AugustInvestorMeetings2007Finalpepco AugustInvestorMeetings2007Final
pepco AugustInvestorMeetings2007Final
 
Sri Lanka Stock Market Quarterly earnings update sep 2011
Sri Lanka Stock Market Quarterly earnings update sep 2011Sri Lanka Stock Market Quarterly earnings update sep 2011
Sri Lanka Stock Market Quarterly earnings update sep 2011
 
Q11 Healthcare Report
Q11 Healthcare ReportQ11 Healthcare Report
Q11 Healthcare Report
 
US Stocks
US StocksUS Stocks
US Stocks
 
Industrials M&A Report
Industrials M&A ReportIndustrials M&A Report
Industrials M&A Report
 
Request rbc
Request rbcRequest rbc
Request rbc
 
2012 SMB Disaster Preparedness Survey Global Results May 2012
2012 SMB Disaster Preparedness Survey Global Results May 20122012 SMB Disaster Preparedness Survey Global Results May 2012
2012 SMB Disaster Preparedness Survey Global Results May 2012
 
Zeus: home of the heavies
Zeus: home of the heaviesZeus: home of the heavies
Zeus: home of the heavies
 
Corporate Earnings Watch - Expected Stock Price Movement on Announcement
Corporate Earnings Watch - Expected Stock Price Movement on AnnouncementCorporate Earnings Watch - Expected Stock Price Movement on Announcement
Corporate Earnings Watch - Expected Stock Price Movement on Announcement
 

Mais de RYAN RENICKER

Convertible Bonds and Call Overwrites - 2007
Convertible Bonds and Call Overwrites - 2007Convertible Bonds and Call Overwrites - 2007
Convertible Bonds and Call Overwrites - 2007RYAN RENICKER
 
Indicators Used to Identify Rich or Cheap Options
Indicators Used to Identify Rich or Cheap OptionsIndicators Used to Identify Rich or Cheap Options
Indicators Used to Identify Rich or Cheap OptionsRYAN RENICKER
 
The Lehman Brothers Volatility Screening Tool
The Lehman Brothers Volatility Screening ToolThe Lehman Brothers Volatility Screening Tool
The Lehman Brothers Volatility Screening ToolRYAN RENICKER
 
Options on the VIX and Mean Reversion in Implied Volatility Skews
Options on the VIX and Mean Reversion in Implied Volatility Skews Options on the VIX and Mean Reversion in Implied Volatility Skews
Options on the VIX and Mean Reversion in Implied Volatility Skews RYAN RENICKER
 
Various Media Citations - Ryan Renicker, CFA
Various Media Citations - Ryan Renicker, CFAVarious Media Citations - Ryan Renicker, CFA
Various Media Citations - Ryan Renicker, CFARYAN RENICKER
 
Options Trade Cheap Following Q2 Earnings - 2005
Options Trade Cheap Following Q2 Earnings - 2005Options Trade Cheap Following Q2 Earnings - 2005
Options Trade Cheap Following Q2 Earnings - 2005RYAN RENICKER
 
Telecom / Media Overview - Buy-Write Google (GOOG)
Telecom / Media Overview - Buy-Write Google (GOOG)Telecom / Media Overview - Buy-Write Google (GOOG)
Telecom / Media Overview - Buy-Write Google (GOOG)RYAN RENICKER
 
Equity Derivatives Strategy - A Stock Picker's Market?
Equity Derivatives Strategy - A Stock Picker's Market?Equity Derivatives Strategy - A Stock Picker's Market?
Equity Derivatives Strategy - A Stock Picker's Market?RYAN RENICKER
 
Technology Stocks: A Stock Picker's Market?
Technology Stocks: A Stock Picker's Market?Technology Stocks: A Stock Picker's Market?
Technology Stocks: A Stock Picker's Market?RYAN RENICKER
 
How to Strengthen Portfolio Returns as the Dollar Weakens!
How to Strengthen Portfolio Returns as the Dollar Weakens!How to Strengthen Portfolio Returns as the Dollar Weakens!
How to Strengthen Portfolio Returns as the Dollar Weakens!RYAN RENICKER
 
SMH - Semiconductor Stock Options Cheap Despite CATALYSTS AHEAD!
SMH - Semiconductor Stock Options Cheap Despite CATALYSTS AHEAD!SMH - Semiconductor Stock Options Cheap Despite CATALYSTS AHEAD!
SMH - Semiconductor Stock Options Cheap Despite CATALYSTS AHEAD!RYAN RENICKER
 
Stock Options on ANF and GPS - The Market's Expectation for Same-Store Sales
Stock Options on ANF and GPS - The Market's Expectation for Same-Store SalesStock Options on ANF and GPS - The Market's Expectation for Same-Store Sales
Stock Options on ANF and GPS - The Market's Expectation for Same-Store SalesRYAN RENICKER
 
Option Strategies for Power and Utilities Industries
Option Strategies for Power and Utilities IndustriesOption Strategies for Power and Utilities Industries
Option Strategies for Power and Utilities IndustriesRYAN RENICKER
 
Options Strategy Monthly - 2006 - Low Volatility in the 7th Inning? Housing M...
Options Strategy Monthly - 2006 - Low Volatility in the 7th Inning? Housing M...Options Strategy Monthly - 2006 - Low Volatility in the 7th Inning? Housing M...
Options Strategy Monthly - 2006 - Low Volatility in the 7th Inning? Housing M...RYAN RENICKER
 
Pinning of Stock Prices on Expiration Date - Equity Options
Pinning of Stock Prices on Expiration Date - Equity OptionsPinning of Stock Prices on Expiration Date - Equity Options
Pinning of Stock Prices on Expiration Date - Equity OptionsRYAN RENICKER
 
The Risk and Return of the Buy Write Strategy On The Russell 2000 Index
The Risk and Return of the Buy Write Strategy On The Russell 2000 IndexThe Risk and Return of the Buy Write Strategy On The Russell 2000 Index
The Risk and Return of the Buy Write Strategy On The Russell 2000 IndexRYAN RENICKER
 
Option Strategies - Natural Gas Trading Opportunities
Option Strategies - Natural Gas Trading OpportunitiesOption Strategies - Natural Gas Trading Opportunities
Option Strategies - Natural Gas Trading OpportunitiesRYAN RENICKER
 
McDonald's Options are Trading Rich - Super Sized Volatility
McDonald's Options are Trading Rich - Super Sized VolatilityMcDonald's Options are Trading Rich - Super Sized Volatility
McDonald's Options are Trading Rich - Super Sized VolatilityRYAN RENICKER
 
Career and Job-Search Bibliography - Compiled by Richard Greene
Career and Job-Search Bibliography - Compiled by Richard GreeneCareer and Job-Search Bibliography - Compiled by Richard Greene
Career and Job-Search Bibliography - Compiled by Richard GreeneRYAN RENICKER
 
Option Implied Volatility for Small Cap Stocks
Option Implied Volatility for Small Cap StocksOption Implied Volatility for Small Cap Stocks
Option Implied Volatility for Small Cap StocksRYAN RENICKER
 

Mais de RYAN RENICKER (20)

Convertible Bonds and Call Overwrites - 2007
Convertible Bonds and Call Overwrites - 2007Convertible Bonds and Call Overwrites - 2007
Convertible Bonds and Call Overwrites - 2007
 
Indicators Used to Identify Rich or Cheap Options
Indicators Used to Identify Rich or Cheap OptionsIndicators Used to Identify Rich or Cheap Options
Indicators Used to Identify Rich or Cheap Options
 
The Lehman Brothers Volatility Screening Tool
The Lehman Brothers Volatility Screening ToolThe Lehman Brothers Volatility Screening Tool
The Lehman Brothers Volatility Screening Tool
 
Options on the VIX and Mean Reversion in Implied Volatility Skews
Options on the VIX and Mean Reversion in Implied Volatility Skews Options on the VIX and Mean Reversion in Implied Volatility Skews
Options on the VIX and Mean Reversion in Implied Volatility Skews
 
Various Media Citations - Ryan Renicker, CFA
Various Media Citations - Ryan Renicker, CFAVarious Media Citations - Ryan Renicker, CFA
Various Media Citations - Ryan Renicker, CFA
 
Options Trade Cheap Following Q2 Earnings - 2005
Options Trade Cheap Following Q2 Earnings - 2005Options Trade Cheap Following Q2 Earnings - 2005
Options Trade Cheap Following Q2 Earnings - 2005
 
Telecom / Media Overview - Buy-Write Google (GOOG)
Telecom / Media Overview - Buy-Write Google (GOOG)Telecom / Media Overview - Buy-Write Google (GOOG)
Telecom / Media Overview - Buy-Write Google (GOOG)
 
Equity Derivatives Strategy - A Stock Picker's Market?
Equity Derivatives Strategy - A Stock Picker's Market?Equity Derivatives Strategy - A Stock Picker's Market?
Equity Derivatives Strategy - A Stock Picker's Market?
 
Technology Stocks: A Stock Picker's Market?
Technology Stocks: A Stock Picker's Market?Technology Stocks: A Stock Picker's Market?
Technology Stocks: A Stock Picker's Market?
 
How to Strengthen Portfolio Returns as the Dollar Weakens!
How to Strengthen Portfolio Returns as the Dollar Weakens!How to Strengthen Portfolio Returns as the Dollar Weakens!
How to Strengthen Portfolio Returns as the Dollar Weakens!
 
SMH - Semiconductor Stock Options Cheap Despite CATALYSTS AHEAD!
SMH - Semiconductor Stock Options Cheap Despite CATALYSTS AHEAD!SMH - Semiconductor Stock Options Cheap Despite CATALYSTS AHEAD!
SMH - Semiconductor Stock Options Cheap Despite CATALYSTS AHEAD!
 
Stock Options on ANF and GPS - The Market's Expectation for Same-Store Sales
Stock Options on ANF and GPS - The Market's Expectation for Same-Store SalesStock Options on ANF and GPS - The Market's Expectation for Same-Store Sales
Stock Options on ANF and GPS - The Market's Expectation for Same-Store Sales
 
Option Strategies for Power and Utilities Industries
Option Strategies for Power and Utilities IndustriesOption Strategies for Power and Utilities Industries
Option Strategies for Power and Utilities Industries
 
Options Strategy Monthly - 2006 - Low Volatility in the 7th Inning? Housing M...
Options Strategy Monthly - 2006 - Low Volatility in the 7th Inning? Housing M...Options Strategy Monthly - 2006 - Low Volatility in the 7th Inning? Housing M...
Options Strategy Monthly - 2006 - Low Volatility in the 7th Inning? Housing M...
 
Pinning of Stock Prices on Expiration Date - Equity Options
Pinning of Stock Prices on Expiration Date - Equity OptionsPinning of Stock Prices on Expiration Date - Equity Options
Pinning of Stock Prices on Expiration Date - Equity Options
 
The Risk and Return of the Buy Write Strategy On The Russell 2000 Index
The Risk and Return of the Buy Write Strategy On The Russell 2000 IndexThe Risk and Return of the Buy Write Strategy On The Russell 2000 Index
The Risk and Return of the Buy Write Strategy On The Russell 2000 Index
 
Option Strategies - Natural Gas Trading Opportunities
Option Strategies - Natural Gas Trading OpportunitiesOption Strategies - Natural Gas Trading Opportunities
Option Strategies - Natural Gas Trading Opportunities
 
McDonald's Options are Trading Rich - Super Sized Volatility
McDonald's Options are Trading Rich - Super Sized VolatilityMcDonald's Options are Trading Rich - Super Sized Volatility
McDonald's Options are Trading Rich - Super Sized Volatility
 
Career and Job-Search Bibliography - Compiled by Richard Greene
Career and Job-Search Bibliography - Compiled by Richard GreeneCareer and Job-Search Bibliography - Compiled by Richard Greene
Career and Job-Search Bibliography - Compiled by Richard Greene
 
Option Implied Volatility for Small Cap Stocks
Option Implied Volatility for Small Cap StocksOption Implied Volatility for Small Cap Stocks
Option Implied Volatility for Small Cap Stocks
 

Último

Call US 📞 9892124323 ✅ Kurla Call Girls In Kurla ( Mumbai ) secure service
Call US 📞 9892124323 ✅ Kurla Call Girls In Kurla ( Mumbai ) secure serviceCall US 📞 9892124323 ✅ Kurla Call Girls In Kurla ( Mumbai ) secure service
Call US 📞 9892124323 ✅ Kurla Call Girls In Kurla ( Mumbai ) secure servicePooja Nehwal
 
The Economic History of the U.S. Lecture 22.pdf
The Economic History of the U.S. Lecture 22.pdfThe Economic History of the U.S. Lecture 22.pdf
The Economic History of the U.S. Lecture 22.pdfGale Pooley
 
TEST BANK For Corporate Finance, 13th Edition By Stephen Ross, Randolph Weste...
TEST BANK For Corporate Finance, 13th Edition By Stephen Ross, Randolph Weste...TEST BANK For Corporate Finance, 13th Edition By Stephen Ross, Randolph Weste...
TEST BANK For Corporate Finance, 13th Edition By Stephen Ross, Randolph Weste...ssifa0344
 
00_Main ppt_MeetupDORA&CyberSecurity.pptx
00_Main ppt_MeetupDORA&CyberSecurity.pptx00_Main ppt_MeetupDORA&CyberSecurity.pptx
00_Main ppt_MeetupDORA&CyberSecurity.pptxFinTech Belgium
 
The Economic History of the U.S. Lecture 26.pdf
The Economic History of the U.S. Lecture 26.pdfThe Economic History of the U.S. Lecture 26.pdf
The Economic History of the U.S. Lecture 26.pdfGale Pooley
 
Instant Issue Debit Cards - School Designs
Instant Issue Debit Cards - School DesignsInstant Issue Debit Cards - School Designs
Instant Issue Debit Cards - School Designsegoetzinger
 
03_Emmanuel Ndiaye_Degroof Petercam.pptx
03_Emmanuel Ndiaye_Degroof Petercam.pptx03_Emmanuel Ndiaye_Degroof Petercam.pptx
03_Emmanuel Ndiaye_Degroof Petercam.pptxFinTech Belgium
 
WhatsApp 📞 Call : 9892124323 ✅Call Girls In Chembur ( Mumbai ) secure service
WhatsApp 📞 Call : 9892124323  ✅Call Girls In Chembur ( Mumbai ) secure serviceWhatsApp 📞 Call : 9892124323  ✅Call Girls In Chembur ( Mumbai ) secure service
WhatsApp 📞 Call : 9892124323 ✅Call Girls In Chembur ( Mumbai ) secure servicePooja Nehwal
 
The Economic History of the U.S. Lecture 23.pdf
The Economic History of the U.S. Lecture 23.pdfThe Economic History of the U.S. Lecture 23.pdf
The Economic History of the U.S. Lecture 23.pdfGale Pooley
 
High Class Call Girls Nagpur Grishma Call 7001035870 Meet With Nagpur Escorts
High Class Call Girls Nagpur Grishma Call 7001035870 Meet With Nagpur EscortsHigh Class Call Girls Nagpur Grishma Call 7001035870 Meet With Nagpur Escorts
High Class Call Girls Nagpur Grishma Call 7001035870 Meet With Nagpur Escortsranjana rawat
 
(DIYA) Bhumkar Chowk Call Girls Just Call 7001035870 [ Cash on Delivery ] Pun...
(DIYA) Bhumkar Chowk Call Girls Just Call 7001035870 [ Cash on Delivery ] Pun...(DIYA) Bhumkar Chowk Call Girls Just Call 7001035870 [ Cash on Delivery ] Pun...
(DIYA) Bhumkar Chowk Call Girls Just Call 7001035870 [ Cash on Delivery ] Pun...ranjana rawat
 
Vip Call US 📞 7738631006 ✅Call Girls In Sakinaka ( Mumbai )
Vip Call US 📞 7738631006 ✅Call Girls In Sakinaka ( Mumbai )Vip Call US 📞 7738631006 ✅Call Girls In Sakinaka ( Mumbai )
Vip Call US 📞 7738631006 ✅Call Girls In Sakinaka ( Mumbai )Pooja Nehwal
 
The Economic History of the U.S. Lecture 19.pdf
The Economic History of the U.S. Lecture 19.pdfThe Economic History of the U.S. Lecture 19.pdf
The Economic History of the U.S. Lecture 19.pdfGale Pooley
 
Best VIP Call Girls Noida Sector 18 Call Me: 8448380779
Best VIP Call Girls Noida Sector 18 Call Me: 8448380779Best VIP Call Girls Noida Sector 18 Call Me: 8448380779
Best VIP Call Girls Noida Sector 18 Call Me: 8448380779Delhi Call girls
 
The Economic History of the U.S. Lecture 30.pdf
The Economic History of the U.S. Lecture 30.pdfThe Economic History of the U.S. Lecture 30.pdf
The Economic History of the U.S. Lecture 30.pdfGale Pooley
 
Pooja 9892124323 : Call Girl in Juhu Escorts Service Free Home Delivery
Pooja 9892124323 : Call Girl in Juhu Escorts Service Free Home DeliveryPooja 9892124323 : Call Girl in Juhu Escorts Service Free Home Delivery
Pooja 9892124323 : Call Girl in Juhu Escorts Service Free Home DeliveryPooja Nehwal
 
The Economic History of the U.S. Lecture 20.pdf
The Economic History of the U.S. Lecture 20.pdfThe Economic History of the U.S. Lecture 20.pdf
The Economic History of the U.S. Lecture 20.pdfGale Pooley
 
Booking open Available Pune Call Girls Wadgaon Sheri 6297143586 Call Hot Ind...
Booking open Available Pune Call Girls Wadgaon Sheri  6297143586 Call Hot Ind...Booking open Available Pune Call Girls Wadgaon Sheri  6297143586 Call Hot Ind...
Booking open Available Pune Call Girls Wadgaon Sheri 6297143586 Call Hot Ind...Call Girls in Nagpur High Profile
 
Booking open Available Pune Call Girls Shivane 6297143586 Call Hot Indian Gi...
Booking open Available Pune Call Girls Shivane  6297143586 Call Hot Indian Gi...Booking open Available Pune Call Girls Shivane  6297143586 Call Hot Indian Gi...
Booking open Available Pune Call Girls Shivane 6297143586 Call Hot Indian Gi...Call Girls in Nagpur High Profile
 

Último (20)

Call US 📞 9892124323 ✅ Kurla Call Girls In Kurla ( Mumbai ) secure service
Call US 📞 9892124323 ✅ Kurla Call Girls In Kurla ( Mumbai ) secure serviceCall US 📞 9892124323 ✅ Kurla Call Girls In Kurla ( Mumbai ) secure service
Call US 📞 9892124323 ✅ Kurla Call Girls In Kurla ( Mumbai ) secure service
 
The Economic History of the U.S. Lecture 22.pdf
The Economic History of the U.S. Lecture 22.pdfThe Economic History of the U.S. Lecture 22.pdf
The Economic History of the U.S. Lecture 22.pdf
 
TEST BANK For Corporate Finance, 13th Edition By Stephen Ross, Randolph Weste...
TEST BANK For Corporate Finance, 13th Edition By Stephen Ross, Randolph Weste...TEST BANK For Corporate Finance, 13th Edition By Stephen Ross, Randolph Weste...
TEST BANK For Corporate Finance, 13th Edition By Stephen Ross, Randolph Weste...
 
00_Main ppt_MeetupDORA&CyberSecurity.pptx
00_Main ppt_MeetupDORA&CyberSecurity.pptx00_Main ppt_MeetupDORA&CyberSecurity.pptx
00_Main ppt_MeetupDORA&CyberSecurity.pptx
 
The Economic History of the U.S. Lecture 26.pdf
The Economic History of the U.S. Lecture 26.pdfThe Economic History of the U.S. Lecture 26.pdf
The Economic History of the U.S. Lecture 26.pdf
 
Instant Issue Debit Cards - School Designs
Instant Issue Debit Cards - School DesignsInstant Issue Debit Cards - School Designs
Instant Issue Debit Cards - School Designs
 
03_Emmanuel Ndiaye_Degroof Petercam.pptx
03_Emmanuel Ndiaye_Degroof Petercam.pptx03_Emmanuel Ndiaye_Degroof Petercam.pptx
03_Emmanuel Ndiaye_Degroof Petercam.pptx
 
WhatsApp 📞 Call : 9892124323 ✅Call Girls In Chembur ( Mumbai ) secure service
WhatsApp 📞 Call : 9892124323  ✅Call Girls In Chembur ( Mumbai ) secure serviceWhatsApp 📞 Call : 9892124323  ✅Call Girls In Chembur ( Mumbai ) secure service
WhatsApp 📞 Call : 9892124323 ✅Call Girls In Chembur ( Mumbai ) secure service
 
Commercial Bank Economic Capsule - April 2024
Commercial Bank Economic Capsule - April 2024Commercial Bank Economic Capsule - April 2024
Commercial Bank Economic Capsule - April 2024
 
The Economic History of the U.S. Lecture 23.pdf
The Economic History of the U.S. Lecture 23.pdfThe Economic History of the U.S. Lecture 23.pdf
The Economic History of the U.S. Lecture 23.pdf
 
High Class Call Girls Nagpur Grishma Call 7001035870 Meet With Nagpur Escorts
High Class Call Girls Nagpur Grishma Call 7001035870 Meet With Nagpur EscortsHigh Class Call Girls Nagpur Grishma Call 7001035870 Meet With Nagpur Escorts
High Class Call Girls Nagpur Grishma Call 7001035870 Meet With Nagpur Escorts
 
(DIYA) Bhumkar Chowk Call Girls Just Call 7001035870 [ Cash on Delivery ] Pun...
(DIYA) Bhumkar Chowk Call Girls Just Call 7001035870 [ Cash on Delivery ] Pun...(DIYA) Bhumkar Chowk Call Girls Just Call 7001035870 [ Cash on Delivery ] Pun...
(DIYA) Bhumkar Chowk Call Girls Just Call 7001035870 [ Cash on Delivery ] Pun...
 
Vip Call US 📞 7738631006 ✅Call Girls In Sakinaka ( Mumbai )
Vip Call US 📞 7738631006 ✅Call Girls In Sakinaka ( Mumbai )Vip Call US 📞 7738631006 ✅Call Girls In Sakinaka ( Mumbai )
Vip Call US 📞 7738631006 ✅Call Girls In Sakinaka ( Mumbai )
 
The Economic History of the U.S. Lecture 19.pdf
The Economic History of the U.S. Lecture 19.pdfThe Economic History of the U.S. Lecture 19.pdf
The Economic History of the U.S. Lecture 19.pdf
 
Best VIP Call Girls Noida Sector 18 Call Me: 8448380779
Best VIP Call Girls Noida Sector 18 Call Me: 8448380779Best VIP Call Girls Noida Sector 18 Call Me: 8448380779
Best VIP Call Girls Noida Sector 18 Call Me: 8448380779
 
The Economic History of the U.S. Lecture 30.pdf
The Economic History of the U.S. Lecture 30.pdfThe Economic History of the U.S. Lecture 30.pdf
The Economic History of the U.S. Lecture 30.pdf
 
Pooja 9892124323 : Call Girl in Juhu Escorts Service Free Home Delivery
Pooja 9892124323 : Call Girl in Juhu Escorts Service Free Home DeliveryPooja 9892124323 : Call Girl in Juhu Escorts Service Free Home Delivery
Pooja 9892124323 : Call Girl in Juhu Escorts Service Free Home Delivery
 
The Economic History of the U.S. Lecture 20.pdf
The Economic History of the U.S. Lecture 20.pdfThe Economic History of the U.S. Lecture 20.pdf
The Economic History of the U.S. Lecture 20.pdf
 
Booking open Available Pune Call Girls Wadgaon Sheri 6297143586 Call Hot Ind...
Booking open Available Pune Call Girls Wadgaon Sheri  6297143586 Call Hot Ind...Booking open Available Pune Call Girls Wadgaon Sheri  6297143586 Call Hot Ind...
Booking open Available Pune Call Girls Wadgaon Sheri 6297143586 Call Hot Ind...
 
Booking open Available Pune Call Girls Shivane 6297143586 Call Hot Indian Gi...
Booking open Available Pune Call Girls Shivane  6297143586 Call Hot Indian Gi...Booking open Available Pune Call Girls Shivane  6297143586 Call Hot Indian Gi...
Booking open Available Pune Call Girls Shivane 6297143586 Call Hot Indian Gi...
 

Equity volatility snapshot21406

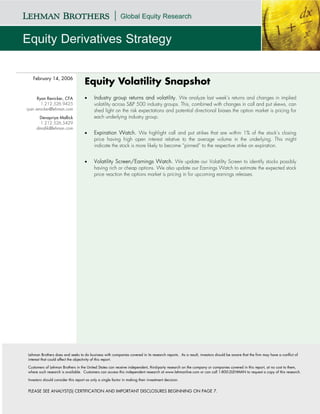
  • 1. February 14, 2006 Equity Volatility Snapshot Ryan Renicker, CFA • Industry group returns and volatility. We analyze last week’s returns and changes in implied 1.212.526.9425 volatility across S&P 500 industry groups. This, combined with changes in call and put skews, can ryan.renicker@lehman.com shed light on the risk expectations and potential directional biases the option market is pricing for Devapriya Mallick each underlying industry group. 1.212.526.5429 dmallik@lehman.com • Expiration Watch. We highlight call and put strikes that are within 1% of the stock’s closing price having high open interest relative to the average volume in the underlying. This might indicate the stock is more likely to become “pinned” to the respective strike on expiration. • Volatility Screen/Earnings Watch. We update our Volatility Screen to identify stocks possibly having rich or cheap options. We also update our Earnings Watch to estimate the expected stock price reaction the options market is pricing in for upcoming earnings releases. Lehman Brothers does and seeks to do business with companies covered in its research reports. As a result, investors should be aware that the firm may have a conflict of interest that could affect the objectivity of this report. Customers of Lehman Brothers in the United States can receive independent, third-party research on the company or companies covered in this report, at no cost to them, where such research is available. Customers can access this independent research at www.lehmanlive.com or can call 1-800-2LEHMAN to request a copy of this research. Investors should consider this report as only a single factor in making their investment decision. PLEASE SEE ANALYST(S) CERTIFICATION AND IMPORTANT DISCLOSURES BEGINNING ON PAGE 7.
  • 2. Equity Derivatives Strategy | Equity Volatility Snapshot Industry Returns and Changing Risk Expectations We analyze last week’s1 performance of S&P 500 industry groups, and incorporate option market information to infer how each group’s risk expectations and potential directional biases (changes in put or call skews) reacted to each respective industry’s performance. As Figure 1 illustrates, last week’s returns tended to be negatively correlated with changes in implied volatility (which is typical). In Figure 2, we present last week’s changes in put and call skews for each industry group2. Last week, the Telecom Services industry group gained 2.3% although its weighted-average 3-month ATM implied volatility rose as well, consistent with its trend since late January. This industry group also had the highest increase in its weighted-average call skew, possibly indicating a decline in demand for out-of-the-money calls on Telecom names. Implied volatility for the Auto & Components industry group ended higher last week, after the group declined about 1.5%. However, the industry’s put skew and call skew increased during the retracement, which we believe could be a signal that investors could have been buying downside protection and selling upside participation. Another industry group having interesting volatility vs. performance patterns was Software & Services, within which ATM implied volatility remained relatively flat, even as the group declined about 1.2% for the week. In addition, its put skew declined and at-the-money implied volatility rose relative to out-of- the-money call implied volatility. Figure 1: Last Week’s Performance vs Change in 3M Implied Vol. Figure 2: Last Week’s Change in Put and Call Skew (in vol pts.) Put Skew Change Call Skew Change Tech Hard & Equip Industry Group (1 week) (1 week) Telecom Svc House & Pers Prod 0.03% -2.41% Comml Svc & Suppl Capital Goods Semi & Semi Equip 0.29% -0.64% Insurance Pharma & Biotech 0.09% -0.43% H Care Equip & Svc Utilities 0.10% -0.25% Semi & Semi Equip Food Bev & Tobacco 0.33% -0.22% Transportation Insurance -0.10% -0.19% Pharma & Biotech Cons Dur & Apparel 0.13% -0.13% Consumer Services Comml Svc & Suppl 0.20% -0.12% Banks Capital Goods -0.13% -0.11% Media Tech Hard & Equip 0.40% -0.06% Retailing Energy -0.10% -0.06% Food Bev & Tobacco Banks 0.09% -0.03% Divers Financ Divers Financ 0.12% -0.03% Food & Stpls Retail Transportation 0.06% -0.02% Real Estate H Care Equip & Svc 0.11% 0.00% Utilities Real Estate 0.37% 0.00% House & Pers Prod Materials -0.36% 0.01% Softw are & Services Retailing 0.10% 0.03% Auto & Components Cons Dur & Apparel Media -0.92% 0.13% Materials Consumer Services -0.04% 0.23% Energy Food & Stpls Retail 0.17% 0.45% Software & Services -0.16% 0.85% -7% -6% -5% -4% -3% -2% -1% 0% 1% 2% 3% 4% Auto & Components 0.38% 1.14% 1-w eek Return Implied Vol Change (1 w eek) Telecom Svc 0.29% 1.38% Source: Lehman Brothers, OptionMetrics Source: Lehman Brothers, OptionMetrics 1 We define “last week” as the time period between the close on 2/6 and the close on 2/13. 2 We calculate each industry group’s put skew by taking the difference between the market-cap weighted 20 delta put implied volatility and ATM implied volatility for each constituent within the industry group. We calculate the call skew by taking the difference between the market-cap weighted-average ATM implied volatility and the 20 delta call implied volatility for each constituent within the industry group. February 14, 2006 2
  • 3. Equity Derivatives Strategy | Equity Volatility Snapshot Expiration Only 3 Days Away: Stocks to Watch We found the return distribution on expiration for stocks closing near a strike price before expiration tends to have a higher probability of returns relatively close to 0%, versus the average S&P 500 stock. In addition, the probability of stocks becoming “pinned” to their respective strike price tends to be increase if their open interest of contracts outstanding is relatively high versus their average daily volume3. This phenomenon is possibly due to delta-hedging activity among traders who are long gamma, which is likely to dampen moves in the underlying since it involves buying the underlying shares as their price declines and selling shares as they rise. With expiration only 3 days away (2/17), we highlight the calls and puts (for stocks within the S&P 500) expiring on Friday whose strikes are within 1% of last night’s closing price for each respective stock. Figure 3 and Figure 4 display the strike prices having the largest number of contracts outstanding as a proportion of the average daily volume in their underlying. The PRU 75 strike, HSP 45 strike and UPS 75 strike have the highest total open interest (puts + calls) as a proportion of their respective average daily stock volumes. Figure 3: Calls With Highest Open Interest / Volume Ratio Figure 4: Puts With Highest Open Interest / Volume Ratio Open Open Open Average Stock Distance from Open Average Stock Distance from Ticker Strike Close (2/13) Interest / Ticker Strike Close (2/13) Interest / Interest Volume (20d) Closing Price Interest Volume (20d) Closing Price Volume Volume PRU 75 11,657 74.61 1,935,455 0.5% 60% PRU 75 7,301 74.61 1,935,455 0.5% 38% HSP 45 3,708 45.26 632,450 0.6% 59% HSP 45 2,132 45.26 632,450 0.6% 34% KSS 45 19,465 45.15 3,969,209 0.3% 49% UPS 75 9,515 75.03 2,878,580 0.0% 33% UPS 75 13,047 75.03 2,878,580 0.0% 45% ABK 75 1,650 75.48 540,645 0.6% 31% SIAL 65 1,533 64.87 397,547 0.2% 39% TIN 45 2,945 44.62 1,002,500 0.9% 29% SHLD 120 4,905 119.28 1,391,904 0.6% 35% COP 60 32,177 59.45 12,281,621 0.9% 26% RAI 100 2,014 100.94 605,870 0.9% 33% IBM 80 16,988 80.44 6,948,270 0.5% 24% ABK 75 1,669 75.48 540,645 0.6% 31% IP 32.5 6,574 32.7 2,823,560 0.6% 23% ABT 42.5 12,866 42.83 5,125,129 0.8% 25% AMZN 37.5 18,090 37.86 8,220,290 1.0% 22% GDT 75 12,683 74.9 5,168,400 0.1% 25% KMI 90 1,871 90.44 900,515 0.5% 21% HD 40 20,227 39.7 8,425,745 0.8% 24% SHLD 120 2,796 119.28 1,391,904 0.6% 20% COH 35 6,763 35.33 2,861,535 0.9% 24% CMI 100 1,744 99.5 875,985 0.5% 20% GD 120 2,071 119.92 881,270 0.1% 24% GDT 75 9,576 74.9 5,168,400 0.1% 19% MS 60 8,826 59.81 3,840,444 0.3% 23% WHR 85 1,965 85.83 1,090,820 1.0% 18% AXP 52.5 13,156 53.02 5,777,820 1.0% 23% AA 30 9,445 30.24 5,778,825 0.8% 16% JPM 40 26,350 39.77 11,681,051 0.6% 23% PD 140 5,529 139.84 3,404,610 0.1% 16% AT 60 5,320 59.9 2,362,020 0.2% 23% ADP 45 4,253 45.41 2,627,360 0.9% 16% NKE 85 5,465 84.28 2,450,665 0.9% 22% KSS 45 6,356 45.15 3,969,209 0.3% 16% BOL 70 1,927 70.05 907,370 0.1% 21% HD 40 13,439 39.7 8,425,745 0.8% 16% TIN 45 2,128 44.62 1,002,500 0.9% 21% COH 35 4,324 35.33 2,861,535 0.9% 15% CLX 60 2,003 60.31 1,013,735 0.5% 20% CLX 60 1,521 60.31 1,013,735 0.5% 15% IBM 80 13,630 80.44 6,948,270 0.5% 20% MAS 30 4,015 29.91 2,714,950 0.3% 15% TGT 55 7,373 54.54 3,965,574 0.8% 19% NUE 80 4,682 79.36 3,181,790 0.8% 15% KLAC 52.5 8,758 52.89 4,740,525 0.7% 18% GS 140 5,814 139.65 4,064,250 0.3% 14% CMI 100 1,564 99.5 875,985 0.5% 18% XOM 60 30,370 59.6 21,462,878 0.7% 14% DG 17.5 5,982 17.41 3,402,770 0.5% 18% DD 40 6,975 40.15 5,245,469 0.4% 13% AET 100 3,740 99.5 2,159,740 0.5% 17% IPG 10 3,228 10.08 2,448,130 0.8% 13% DD 40 8,772 40.15 5,245,469 0.4% 17% HUM 50 2,964 50.42 2,386,240 0.8% 12% COP 60 19,952 59.45 12,281,621 0.9% 16% CI 120 1,351 119.69 1,102,635 0.3% 12% PG 60 12,615 59.44 7,924,454 0.9% 16% YUM 50 1,686 50.09 1,420,765 0.2% 12% Source: Lehman Brothers, OptionMetrics Source: Lehman Brothers, OptionMetrics 3 Please see our report Impact of Option Expiration on Underlying Price Changes, Options Strategy Monthly, February 2006 for further details. February 14, 2006 3
  • 4. Equity Derivatives Strategy | Equity Volatility Snapshot Lehman Brothers Volatility Screen We update the list of stocks identified by the Lehman Brothers Volatility Screen as possibly having rich or cheap options. This screen allows investors to identify potentially rich or cheap one or three month options to efficiently express directional views on the underlying stock or identify attractive long or short volatility candidates. In Figure 5, we present the current list of stocks having relatively rich options. Figure 5: Stocks Displaying “Rich” Volatility Characteristics Std Devs from Std Devs from Std Devs from Lehman Expected 3-Month Lehman Mean (3-Month Mean (3-Month Mean (3-Month Ticker Name GICS Sector Company Price Earnings Implied Rich/Cheap Sector View Implied vs Implied vs Implied vs S&P Rating Date Volatility Realized) Sector) 500) AAPL APPLE COMPUTER INC Information Technology 2-Equal weight 2-Neutral 64.71 4/13/2006 48% 1.2 1.2 1.4 Rich ALEX ALEXANDER & BALDWIN INC Industrials 0-Unrated 0-Unrated 47.45 4/27/2006 29% 1.3 1.6 1.6 Rich ALL ALLSTATE CORP Financials 1-Overweight 1-Positive 52.64 4/20/2006 19% 1.2 1.5 1.5 Rich ASO AMSOUTH BANCORPORATION Financials 3-Underweight 2-Neutral 26.92 4/19/2006 19% 1.5 1.6 1.5 Rich AVP AVON PRODUCTS INC Consumer Staples 3-Underweight 2-Neutral 27.24 5/2/2006 29% 1.1 1.5 1.4 Rich BEC BECKMAN COULTER INC Health Care 0-Unrated 0-Unrated 58.71 2/17/2006 29% 1.8 2.0 2.0 Rich BHI BAKER HUGHES INC Energy 2-Equal weight 1-Positive 69.26 2/16/2006 39% 1.6 1.6 4.3 Rich BKH BLACK HILLS CORP Utilities RS-Rating Suspe2-Neutral 34.37 5/9/2006 23% 2.3 1.8 1.6 Rich BLI BIG LOTS INC Consumer Discretionary 0-Unrated 0-Unrated 13.22 2/23/2006 40% 1.9 1.7 1.6 Rich BTU PEABODY ENERGY CORP Energy 1-Overweight 1-Positive 85.51 4/19/2006 47% 1.6 1.5 2.0 Rich CAKE CHEESECAKE FACTORY (THE) Consumer Discretionary 2-Equal weight 2-Neutral 36.19 4/19/2006 30% 2.3 1.4 1.8 Rich CAT CATERPILLAR INC Industrials 2-Equal weight 2-Neutral 68.62 4/24/2006 27% 1.3 1.9 1.8 Rich DELL DELL INC Information Technology 1-Overweight 2-Neutral 31.57 2/16/2006 26% 1.0 1.5 1.8 Rich DLX DELUXE CORP Industrials 0-Unrated 0-Unrated 26.17 4/28/2006 26% 1.2 2.6 2.4 Rich DNR DENBURY RESOURCES INC Energy 2-Equal weight 1-Positive 26.55 2/23/2006 46% 2.8 1.4 2.1 Rich DVN DEVON ENERGY CORPORATION Energy 1-Overweight 1-Positive 58.00 5/4/2006 39% 1.2 1.9 2.1 Rich EOP EQUITY OFFICE PROPERTIES TR Financials 3-Underweight 2-Neutral 30.02 4/28/2006 22% 1.4 1.2 1.1 Rich ESRX EXPRESS SCRIPTS INC Health Care 2-Equal weight 2-Neutral 91.63 2/22/2006 37% 1.8 2.4 2.1 Rich EXC EXELON CORP Utilities 1-Overweight 3-Negative 55.59 4/25/2006 25% 2.4 1.6 1.4 Rich FLR FLUOR CORP Industrials 2-Equal weight 2-Neutral 81.12 3/1/2006 29% 2.7 1.3 1.3 Rich FPL FPL GROUP INC Utilities RS-Rating Suspe3-Negative 41.66 4/26/2006 19% 1.3 1.0 1.2 Rich GM GENERAL MOTORS CORP Consumer Discretionary 2-Equal weight 3-Negative 22.00 4/19/2006 70% 1.0 2.1 2.0 Rich GPC GENUINE PARTS CO Consumer Discretionary 2-Equal weight 3-Negative 42.14 2/21/2006 20% 2.0 1.6 1.8 Rich HNZ HJ HEINZ CO Consumer Staples 2-Equal weight 3-Negative 35.26 2/28/2006 19% 2.9 2.9 2.2 Rich HPQ HEWLETT-PACKARD CO Information Technology 1-Overweight 2-Neutral 31.74 2/15/2006 32% 1.7 2.3 2.4 Rich ISRG INTUITIVE SURGICAL INC Health Care 0-Unrated 0-Unrated 101.02 4/21/2006 60% 1.4 2.4 2.2 Rich JP JEFFERSON-PILOT CORP Financials RS-Rating Suspe2-Neutral 58.46 4/27/2006 29% 4.7 5.0 4.8 Rich KRI KNIGHT RIDDER INC Consumer Discretionary 3-Underweight 3-Negative 62.48 4/13/2006 25% 3.0 2.1 1.8 Rich KSE KEYSPAN CORP Utilities 2-Equal weight 2-Neutral 36.03 2/24/2006 17% 1.2 1.2 1.9 Rich LEA LEAR CORP Consumer Discretionary 3-Underweight 3-Negative 22.36 4/21/2006 53% 1.7 2.7 2.5 Rich LTR LOEWS CORP Financials 0-Unrated 0-Unrated 95.72 2/16/2006 21% 2.5 1.7 1.5 Rich MAS MASCO CORP Industrials 2-Equal weight 2-Neutral 29.91 2/14/2006 25% 1.8 1.8 1.8 Rich MHK MOHAWK INDUSTRIES INC Consumer Discretionary 2-Equal weight 2-Neutral 80.63 2/15/2006 25% 1.5 2.1 2.4 Rich MI MARSHALL & ILSLEY CORP Financials 2-Equal weight 2-Neutral 42.23 4/12/2006 19% 2.9 2.3 1.9 Rich MO ALTRIA GROUP INC Consumer Staples 2-Equal weight 1-Positive 71.25 4/20/2006 28% 1.4 1.4 1.4 Rich MRBK MERCANTILE BANKSHARES CORPFinancials 1-Overweight 2-Neutral 37.00 4/26/2006 22% 3.2 2.8 2.6 Rich MYG MAYTAG CORP Consumer Discretionary 0-Unrated 0-Unrated 16.61 4/21/2006 64% 1.9 2.8 2.9 Rich NAV NAVISTAR INTERNATIONAL Industrials 0-Unrated 0-Unrated 27.32 2/28/2006 39% 1.2 1.7 1.7 Rich NUE NUCOR CORP Materials 2-Equal weight 1-Positive 79.36 4/21/2006 43% 1.9 1.0 1.6 Rich OKE ONEOK INC Utilities 1-Overweight 2-Neutral 26.59 2/22/2006 24% 2.3 1.0 1.2 Rich ORI OLD REPUBLIC INTL CORP Financials 0-Unrated 0-Unrated 21.26 4/28/2006 20% 1.1 1.1 1.2 Rich REG REGENCY CENTERS CORP Financials 0-Unrated 0-Unrated 61.83 5/3/2006 22% 1.9 1.3 1.3 Rich RL POLO RALPH LAUREN CORP Consumer Discretionary 0-Unrated 0-Unrated 55.00 6/9/2006 29% 1.2 1.2 1.4 Rich RYN RAYONIER INC Financials 0-Unrated 0-Unrated 41.14 4/26/2006 21% 1.1 1.2 1.2 Rich SAFC SAFECO CORP Financials 1-Overweight 1-Positive 51.66 4/19/2006 23% 1.9 2.3 2.1 Rich SFG STANCORP FINANCIAL GROUP Financials 3-Underweight 2-Neutral 51.70 4/26/2006 27% 1.6 2.1 1.9 Rich SHW SHERWIN-WILLIAMS CO/THE Consumer Discretionary 0-Unrated 0-Unrated 53.03 4/21/2006 27% 2.3 3.5 2.8 Rich SII SMITH INTERNATIONAL INC Energy 2-Equal weight 1-Positive 38.52 4/25/2006 41% 1.3 1.3 4.3 Rich SOV SOVEREIGN BANCORP INC Financials RS-Rating Suspe1-Positive 20.64 4/19/2006 26% 1.5 1.4 1.4 Rich STR QUESTAR CORP Utilities 1-Overweight 2-Neutral 74.92 2/14/2006 31% 1.4 1.2 1.2 Rich SWN SOUTHWESTERN ENERGY CO Energy 0-Unrated 0-Unrated 32.64 2/28/2006 56% 2.1 1.2 1.5 Rich TRB TRIBUNE CO Consumer Discretionary 3-Underweight 3-Negative 30.74 4/13/2006 24% 1.6 1.5 1.4 Rich VRX VALEANT PHARMACEUTICALS INTHealth Care 0-Unrated 0-Unrated 17.08 2/24/2006 72% 2.3 2.6 2.5 Rich WHR WHIRLPOOL CORP Consumer Discretionary 0-Unrated 0-Unrated 85.83 4/21/2006 30% 1.1 1.1 1.4 Rich WMI WASTE MANAGEMENT INC Industrials 1-Overweight 1-Positive 33.04 2/14/2006 20% 1.2 1.0 1.8 Rich WTR AQUA AMERICA INC Utilities 0-Unrated 0-Unrated 27.28 2/17/2006 30% 3.6 1.9 1.8 Rich X UNITED STATES STEEL CORP Materials 2-Equal weight 1-Positive 54.28 4/26/2006 55% 2.6 3.1 4.1 Rich Source: Lehman Brothers, OptionMetrics, Bloomberg, FAME Note: This screen does not exclude stocks with illiquid options. Investors should consider liquidity before entering into an options position. Stocks that appear as unrated are either not covered by Lehman Brothers fundamental analysts or are currently subject to research restrictions. Our universe includes stocks included in either the S&P 500 or the NDX. In Figure 6, we provide the current list of stocks having relatively cheap options. Figure 6: Stocks Displaying “Cheap” Volatility Characteristics Std Devs from Std Devs from Std Devs from Lehman Expected 3-Month Lehman Mean (3-Month Mean (3-Month Mean (3-Month Ticker Name GICS Sector Company Price Earnings Implied Rich/Cheap Sector View Implied vs Implied vs Implied vs S&P Rating Date Volatility Realized) Sector) 500) ACS AFFILIATED COMPUTER SVCS-A Information Technology 0-Unrated 0-Unrated 62.49 4/21/2006 23% -2.4 -1.9 -1.2 Cheap C CITIGROUP INC Financials 1-Overweight 1-Positive 45.68 4/13/2006 15% -1.7 -1.1 -1.1 Cheap CSCO CISCO SYSTEMS INC Information Technology RS-Rating Suspe2-Neutral 19.55 5/10/2006 21% -1.3 -2.1 -1.4 Cheap DGX QUEST DIAGNOSTICS Health Care 1-Overweight 2-Neutral 51.96 4/21/2006 18% -1.1 -1.2 -1.3 Cheap EW EDWARDS LIFESCIENCES CORP Health Care 0-Unrated 0-Unrated 43.31 4/21/2006 20% -2.0 -1.2 -1.0 Cheap HC HANOVER COMPRESSOR CO Energy 2-Equal weight 1-Positive 16.16 2/15/2006 31% -1.6 -1.9 -1.1 Cheap MNST MONSTER WORLDWIDE INC Industrials 0-Unrated 0-Unrated 46.96 4/26/2006 36% -1.2 -1.3 -1.3 Cheap PLCM POLYCOM INC Information Technology 1-Overweight 2-Neutral 19.23 4/20/2006 34% -2.2 -2.3 -1.6 Cheap SMTC SEMTECH CORP Information Technology 2-Equal weight 1-Positive 19.06 3/1/2006 34% -2.4 -1.9 -1.4 Cheap UVN UNIVISION COMMUNICATIONS-A Consumer Discretionary 1-Overweight 3-Negative 34.40 3/2/2006 27% -1.1 -2.0 -1.6 Cheap Source: Lehman Brothers, OptionMetrics, Bloomberg, FAME Note: Acquisition targets with very low volatility have been removed from this list. Stocks that appear as unrated are either not covered by Lehman Brothers fundamental analysts or are currently subject to research restrictions. Our universe includes stocks included in either the S&P 500 or the NDX. February 14, 2006 4
  • 5. Equity Derivatives Strategy | Equity Volatility Snapshot Earnings Watch: Companies Reporting 2/14 – 2/24 We incorporate implied volatility information to ascertain the expected stock price reaction priced in by the options market for upcoming earnings announcements. Please see Options Strategy Monthly: th Low Volatility in the 7 Inning? (January 10, 2006) for further details. In Figure 7, we present this week’s edition of the Earnings Watch. Figure 7: Expected Absolute Stock Price Reactions to Upcoming Earnings Announcements Average Absolute Stock Price Average Stock Price Move Expected Implied 1-day Stock Ticker Name Price (1/23/06) Move Following Earnings Following Earnings Earnings Date Price Move Announcements Announcements DE DEERE & CO 14-Feb-06 73.80 2.7% 4.7% -0.2% SIAL SIGMA-ALDRICH 14-Feb-06 64.87 0.9% 2.9% 0.7% AMAT APPLIED MATERIALS INC 15-Feb-06 19.86 3.1% 1.7% 0.4% BIIB BIOGEN IDEC INC 15-Feb-06 43.71 1.1% 2.0% 1.0% DTE DTE ENERGY COMPANY 15-Feb-06 42.23 0.5% 0.9% -0.4% FE FIRSTENERGY CORP 15-Feb-06 48.84 0.8% 0.9% 0.1% GENZ GENZYME CORP 15-Feb-06 67.54 2.2% 3.6% 1.2% HPQ HEWLETT-PACKARD CO 15-Feb-06 31.74 4.8% 5.3% 1.0% JNY JONES APPAREL GROUP INC 15-Feb-06 31.64 4.4% 3.6% -0.1% NTAP NETWORK APPLIANCE INC 15-Feb-06 31.43 5.2% 8.0% 3.2% ODP OFFICE DEPOT INC 15-Feb-06 32.94 3.1% 3.4% 1.2% PGN PROGRESS ENERGY INC 15-Feb-06 44.18 1.2% 0.8% -0.3% BHI BAKER HUGHES INC 16-Feb-06 69.26 1.0% 2.3% -0.2% DELL DELL INC 16-Feb-06 31.57 3.6% 4.8% 1.2% INTU INTUIT INC 16-Feb-06 53.08 2.8% 4.9% -1.6% JCP J.C. PENNEY CO INC 16-Feb-06 55.40 1.9% 2.9% 0.6% LTR LOEWS CORP 16-Feb-06 95.72 1.3% 1.6% 0.9% NVDA NVIDIA CORP 16-Feb-06 44.05 5.6% 10.4% 0.4% PLD PROLOGIS 16-Feb-06 50.75 0.8% 1.7% -0.2% TGT TARGET CORP 16-Feb-06 54.54 1.5% 2.0% 0.9% WPI WATSON PHARMACEUTICALS INC 16-Feb-06 32.12 3.2% 5.7% 0.4% CPB CAMPBELL SOUP CO 17-Feb-06 29.45 0.7% 2.7% 0.0% PCG P G & E CORP 17-Feb-06 36.75 0.8% 0.9% -0.3% RSH RADIOSHACK CORP 17-Feb-06 21.52 3.0% 4.4% -0.7% CCU CLEAR CHANNEL COMMUNICATIONS 21-Feb-06 28.66 1.0% 1.3% -0.6% GPC GENUINE PARTS CO 21-Feb-06 42.14 0.9% 2.9% 1.7% NOVL NOVELL INC 22-Feb-06 9.07 1.5% 6.0% -2.7% RRD RR DONNELLEY & SONS CO 22-Feb-06 31.75 1.0% 1.4% 0.4% S SPRINT NEXTEL CORP 22-Feb-06 22.96 1.4% 1.9% 0.3% SRE SEMPRA ENERGY 22-Feb-06 46.70 0.9% 1.3% 0.3% BLI BIG LOTS INC 23-Feb-06 13.22 1.7% 3.9% 3.2% CMS CMS ENERGY CORP 23-Feb-06 14.15 0.9% 1.9% -0.9% DCN DANA CORP 23-Feb-06 4.08 4.7% 2.4% 0.3% GPS GAP INC/THE 23-Feb-06 18.00 0.8% 2.0% -1.1% LTD LIMITED BRANDS INC 23-Feb-06 23.84 1.0% 2.1% -1.2% SWY SAFEWAY INC 23-Feb-06 22.44 0.1% 3.3% -0.5% AIG AMERICAN INTERNATIONAL GROUP 24-Feb-06 67.94 0.7% 1.9% 1.0% CZN CITIZENS COMMUNICATIONS CO 24-Feb-06 12.26 0.7% 1.1% -0.2% KSE KEYSPAN CORP 24-Feb-06 36.03 0.7% 1.1% -0.1% Source: Source: Lehman Brothers, Bloomberg Note: This list does not exclude illiquid options. Investors should consider liquidity of options before entering a trade. For details on the methodology we use to calculate the implied stock price move, please see “Earnings Impact on Implied and Realized Volatility”, included in the Options Strategy Monthly, January 10, 2006. February 14, 2006 5
  • 6. Equity Derivatives Strategy | Equity Volatility Snapshot Volatility Screen User Interface Obtain Implied Volatility Analytics for an Individual Stock Screen Universe for Rich/Cheap Volatility, By Sector, Analyst Rating, Earnings Period Implied and Realized Volatility Implied and Realized Rich/Cheap Indicators for for Individual Stock Screened Individual Stock Screened Note: Stocks that appear as unrated are either not covered by Lehman Brothers fundamental analysts or are currently subject to research restrictions. Volatility Screen Summary Output Number of Standard Deviations Above or Below Spreads’ 2-Year Average Current 1-Month If > 1 then “Rich”. If < -1 then “Cheap” Implied Volatility Rich/Cheap Metrics: Rich/Cheap Metrics: Company Details 1-Month 3-Month Implied Volatility Implied Volatility February 14, 2006 6
  • 7. Equity Derivatives Strategy | Equity Volatility Snapshot Analyst Certification: The respective research analysts responsible for the fundamental ratings hereby certify (1) that the views expressed in this research email accurately reflect our personal views about any or all of the subject securities or issuers referred to in this email and (2) no part of our compensation was, is or will be directly or indirectly related to the specific recommendations or views expressed in this email. I, Ryan Renicker, hereby certify (1) that the views expressed in this research email accurately reflect my personal views about any or all of the subject securities or issuers referred to in this email and (2) no part of my compensation was, is or will be directly or indirectly related to the specific recommendations or views expressed in this email. To the extent that any of the conclusions are based on a quantitative model, Lehman Brothers hereby certifies (1) that the views expressed in this research email accurately reflect the firm's quantitative research model (2) no part of the firm's compensation was, is or will be directly or indirectly related to the specific recommendations or views expressed in this research report. Important Disclosures Lehman Brothers does and seeks to do business with companies covered in its research reports. As a result, investors should be aware that the firm may have a conflict of interest that could affect the objectivity of this email communication. Customers of Lehman Brothers in the United States can receive independent, third-party research on the company or companies covered in this report, at no cost to them, where such research is available. Customers can access this independent research at www.lehmanlive.com or can call 1-800-2-LEHMAN to request a copy of this research. Investors should consider this communication as only a single factor in making their investment decision. The analysts responsible for preparing this report have received compensation based upon various factors including the Firm’s total revenues, a portion of which is generated by investment banking activities. Stock price and ratings history charts along with other important disclosures are available on our disclosure website at www.lehman.com/disclosures And may also be obtained by sending a written request to: LEHMAN BROTHERS CONTROL ROOM , 745 SEVENTH AVENUE, 19TH FLOOR NEW YORK, NY 10019 Options are not suitable for all investors and the risks of option trading should be weighed against the potential rewards. Supporting documents that form the basis of the recommendations are available on request. Please note that the trade ideas within this report in no way relate to the fundamental ratings applied to European stocks by Lehman Brothers' Equity Research. Guide to Lehman Brothers Equity Research Rating System Our coverage analysts use a relative rating system in which they rate stocks as 1-Overweight, 2- Equal weight or 3-Underweight (see definitions below) relative to other companies covered by the analyst or a team of analysts that are deemed to be in the same industry sector (“the sector coverage universe”). To see a list of companies that comprise a particular sector coverage universe, please go to www.lehman.com/disclosures. In addition to the stock rating, we provide sector views which rate the outlook for the sector coverage universe as 1-Positive, 2-Neutral or 3-Negative (see definitions below). A rating system using terms such as buy, hold and sell is not the equivalent of our rating system. Investors should carefully read the entire research report including the definitions of all ratings and not infer its contents from ratings alone. Stock Rating 1-Overweight - The stock is expected to outperform the unweighted expected total return of the sector coverage universe over a 12-month investment horizon. 2-Equal weight - The stock is expected to perform in line with the unweighted expected total return of the sector coverage universe over a 12-month investment horizon. 3-Underweight - The stock is expected to underperform the unweighted expected total return of the sector coverage universe over a 12-month investment horizon. RS-Rating Suspended - The rating and target price have been suspended temporarily to comply with applicable regulations and/or firm policies in certain circumstances including when Lehman Brothers is acting in an advisory capacity on a merger or strategic transaction involving the company.Sector View 1-Positive - sector coverage universe fundamentals are improving. 2-Neutral - sector coverage universe fundamentals are steady, neither improving nor deteriorating. 3-Negative - sector coverage universe fundamentals are deteriorating. February 14, 2006 7
  • 8. Equity Derivatives Strategy | Equity Volatility Snapshot Distribution of Ratings: Lehman Brothers Equity Research has 1859 companies under coverage. 43% have been assigned a 1-Overweight rating which, for purposes of mandatory disclosures, is classified as a Buy rating, 35% of companies with this rating are investment banking clients of the Firm. 40% have been assigned a 2-Equal weight rating which, for purposes of mandatory disclosures, is classified as a Hold rating, 6% of companies with this rating are investment banking clients of the Firm. 17% have been assigned a 3-Underweight rating which, for purposes of mandatory disclosures, is classified as a Sell rating, 76% of companies with this rating are investment banking clients of the Firm. This material has been prepared and/or issued by Lehman Brothers Inc., member SIPC, and/or one of its affiliates (“Lehman Brothers”) and has been approved by Lehman Brothers International (Europe), authorized and regulated by the Financial Services Authority, in connection with its distribution in the European Economic Area. This material is distributed in Japan by Lehman Brothers Japan Inc., and in Hong Kong by Lehman Brothers Asia Limited. This material is distributed in Australia by Lehman Brothers Australia Pty Limited, and in Singapore by Lehman Brothers Inc., Singapore Branch. (“LBIS”). Where this material is distributed by LBIS, please note that it is intended for general circulation only and the recommendations contained herein does not take into account the specific investment objectives, financial situation or particular needs of any particular person. An investor should consult his Lehman Brothers’ representative regarding the suitability of the product and take into account his specific investment objectives, financial situation or particular needs before he makes a commitment to purchase the investment product. This material is distributed in Korea by Lehman Brothers International (Europe) Seoul Branch. This document is for information purposes only and it should not be regarded as an offer to sell or as a solicitation of an offer to buy the securities or other instruments mentioned in it. No part of this document may be reproduced in any manner without the written permission of Lehman Brothers. With the exception of disclosures relating to Lehman Brothers, this research report is based on current public information that Lehman Brothers considers reliable, but we make no representation that it is accurate or complete, and it should not be relied on as such. In the case of any disclosure to the effect that Lehman Brothers Inc. or its affiliates beneficially own 1% or more of any class of common equity securities of the subject company, the computation of beneficial ownership of securities is based upon the methodology used to compute ownership under Section 13(d) of the United States' Securities Exchange Act of 1934. In the case of any disclosure to the effect that Lehman Brothers Inc. and/or its affiliates hold a short position of at least 1% of the outstanding share capital of a particular company, such disclosure relates solely to the ordinary share capital of the company. Accordingly, while such calculation represents Lehman Brothers’ holdings net of any long position in the ordinary share capital of the company, such calculation excludes any rights or obligations that Lehman Brothers may otherwise have, or which may accrue in the future, with respect to such ordinary share capital. Similarly such calculation does not include any shares held or owned by Lehman Brothers where such shares are held under a wider agreement or arrangement (be it with a client or a counterparty) concerning the shares of such company (e.g. prime broking and/or stock lending activity). Any such disclosure represents the position of Lehman Brothers as of the last business day of the calendar month preceding the date of this report. This material is provided with the understanding that Lehman Brothers is not acting in a fiduciary capacity. Opinions expressed herein reflect the opinion of Lehman Brothers and are subject to change without notice. The products mentioned in this document may not be eligible for sale in some states or countries, and they may not be suitable for all types of investors. If an investor has any doubts about product suitability, he should consult his Lehman Brothers representative. The value of and the income produced by products may fluctuate, so that an investor may get back less than he invested. Value and income may be adversely affected by exchange rates, interest rates, or other factors. Past performance is not necessarily indicative of future results. If a product is income producing, part of the capital invested may be used to pay that income. © 2006 Lehman Brothers. All rights reserved. Additional information is available on request. Please contact a Lehman Brothers entity in your home jurisdiction. Lehman Brothers policy for managing conflicts of interest in connection with investment research is available at www.lehman.com/researchconflictspolicy. Ratings, earnings per share forecasts and price targets contained in the Firm's equity research reports covering U.S. companies are available at www.lehman.com/disclosures. Complete disclosure information on companies covered by Lehman Brothers Equity Research is available at www.lehman.com/disclosures. February 14, 2006 8