Spatial model of deforestation for Northeast Bolivia
•
1 gostou•782 visualizações

Workshop "Methods for biomass estimation and forest-cover mapping in the Tropics". Kigali, Rwanda. June 20, 2011.

Recomendados
Recomendados
Mais conteúdo relacionado
Semelhante a Spatial model of deforestation for Northeast Bolivia
Semelhante a Spatial model of deforestation for Northeast Bolivia (20)
Mais de Universidad Autónoma Gabriel René Moreno
Mais de Universidad Autónoma Gabriel René Moreno (15)
Último
Último (20)
Spatial model of deforestation for Northeast Bolivia
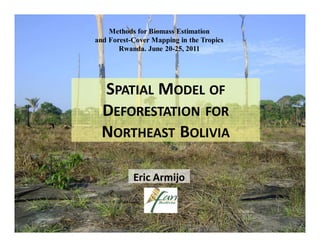
- 1. Methods for Biomass Estimation and Forest-Cover Mapping in the Tropics Rwanda. June 20-25, 2011 SPATIAL MODEL OF DEFORESTATION FOR NORTHEAST BOLIVIA Eric Armijo
- 2. WHY SPATIAL MODELING OF DEFORESTATION? • Better understanding of past land use change processes • Predictive power (future scenarios): spatial patterns • Support decision-making for natural resource managers • REDD mechanism: baseline definition (additionality)
- 3. MODELING ENVIRONMENT Dinamica EGO Universidade Federal de Minas Gerais, Brazil http://www.csr.ufmg.br/dinamica/ • Multiple land cover/use transitions at the same time • Subregion support • Many transition matrices (annual deforestation rates) • Dynamic variables • Highly customizable (w/ spatial patterns) • Robust with large datasets • Freeware, available on the web • Tutorial & technical support available (forum)
- 4. MODELING ENVIRONMENT Dinamica EGO
- 5. STUDY AREA SOUTH AMERICA AMAZON EXTENT
- 6. Indigenous REDD Program in the Bolivian Amazon Size: ~ 3.8 Million Ha. 160,000 inhabitants 4 indigenous territories Forest cover (2008): ~2.7 Million Ha. (71,9 %) Deforestation: 9,800 Ha/yr
- 7. MAIN DRIVERS AND AGENTS OF DEFORESTATION Slash-and-burn Cattle ranching (pastures) Small-scale agriculture ~ 20 - 50 Ha. ~ 1 - 5 Ha. Road improvement
- 8. REGIONALIZATION OF THE STUDY AREA 4 1 1 Riberalta - Guayaramerín 2 Riberalta - Rurrenabaque 3 El Choro - Cobija 3 2 4 Rural (outside main road) 4 4
- 9. SPATIAL MODELING OF DEFORESTATION Amount of forest conversion Lambin & Geist, 2006
- 10. DEFORESTATION RATE 250,000 200,000 Deforestation (Area in Ha.) 150,000 100,000 50,000 0 1991 0 2 4 6 8 10 2001 12 14 2005 16 18 2008 Area (Ha.) antes 1991 1991-2001 2001-2005 2005-2008 Study area 83,486 45,390 46,185 29,005 204,066 Average annual deforestation rate (Ha/year) 4,539 11,546 9,668
- 11. DEFORESTATION RATE (Transition Matrix) 0.13 % 1.54 % The transition matrix is calculated for each 0.62 % subregion based on 0.13 % observed (past) 0.10 % deforestation 0.13 % DEFORESTATION RATE 1991-2005
- 12. SPATIAL MODELING OF DEFORESTATION Location of forest conversion Lambin & Geist, 2006
- 13. PREDICTORS (VARIABLES) DEFINITION Distance to deforested areas Distance to main roads
- 14. “Deforestation risk” Deforestation predictors (variables) Spatial transition probability Land use Map of 1991 changes & 2005
- 15. SPATIAL MODELING OF DEFORESTATION Simulation Lambin & Geist, 2006
- 16. GENERATING SPATIAL PATTERNS Deforestation patch formation Expander = 20% Expander = 40% Expander = 60% Expander = 80%
- 17. MODEL VALIDATION 55% 50% 45% 40% 35% Model fitness Similarirty 30% 25% Spatial resolution (m) 20% 0 200 400 600 800 1000 Is the model capturing adequately the past dynamics ? Simulated deforestation: 2005-2008
- 18. PROJECTING FUTURE DEFORESTATION SCENARIOS 2008 2020 forest deforestation Dinamica EGO
- 19. Thanks you ! Questions Eric Armijo earmijo@fan-bo.org http://www.fan-bo.org/ http://www.reddamazonia.org/