SF Housing Snapshot Shows Declines Across Metrics
•
0 gostou•39 visualizações

San Francisco Market Report March 2023.

Recomendados
Recomendados
Mais conteúdo relacionado
Semelhante a SF Housing Snapshot Shows Declines Across Metrics
Semelhante a SF Housing Snapshot Shows Declines Across Metrics (20)
Mais de Ronny Budiutama
Último
Último (20)
SF Housing Snapshot Shows Declines Across Metrics
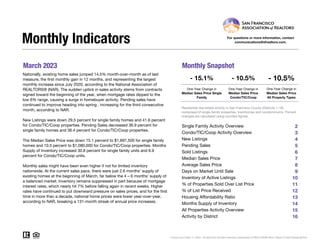
- 1. March 2023 Monthly Snapshot One-Year Change in One-Year Change in Median Sales Price Single Family Median Sales Price Condo/TIC/Coop 2 3 4 5 6 7 8 9 10 11 12 13 14 15 16 Current as of April 11, 2023. All data from the San Francisco Association of REALTORS® MLS. Report © 2023 ShowingTime. Condo/TIC/Coop Activity Overview Inventory of Active Listings % of Properties Sold Over List Price % of List Price Received Housing Affordability Ratio All Properties Activity Overview New Listings Pending Sales Sold Listings Median Sales Price Average Sales Price Days on Market Until Sale Activity by District Monthly Indicators - 15.1% - 10.5% - 10.5% One-Year Change in Nationally, existing home sales jumped 14.5% month-over-month as of last measure, the first monthly gain in 12 months, and representing the largest monthly increase since July 2020, according to the National Association of REALTORS® (NAR). The sudden uptick in sales activity stems from contracts signed toward the beginning of the year, when mortgage rates dipped to the low 6% range, causing a surge in homebuyer activity. Pending sales have continued to improve heading into spring , increasing for the third consecutive month, according to NAR. New Listings were down 29.5 percent for single family homes and 41.6 percent for Condo/TIC/Coop properties. Pending Sales decreased 36.9 percent for single family homes and 36.4 percent for Condo/TIC/Coop properties. The Median Sales Price was down 15.1 percent to $1,697,500 for single family homes and 10.5 percent to $1,080,000 for Condo/TIC/Coop properties. Months Supply of Inventory increased 30.8 percent for single family units and 6.9 percent for Condo/TIC/Coop units. Monthly sales might have been even higher if not for limited inventory nationwide. At the current sales pace, there were just 2.6 months’ supply of existing homes at the beginning of March, far below the 4 – 6 months’ supply of a balanced market. Inventory remains suppressed in part because of mortgage interest rates, which nearly hit 7% before falling again in recent weeks. Higher rates have continued to put downward pressure on sales prices, and for the first time in more than a decade, national home prices were lower year-over-year, according to NAR, breaking a 131-month streak of annual price increases. Median Sales Price All Property Types Residential real estate activity in San Francisco County (Districts 1-10) composed of single-family properties, townhomes and condominiums. Percent changes are calculated using rounded figures. Single Family Activity Overview Months Supply of Inventory For questions or more information, contact communications@sfrealtors.com.
- 2. Single Family Activity Overview Key metrics by report month and for year-to-date (YTD) starting from the first of the year. Key Metrics Historical Sparkbars 3-2022 3-2023 Percent Change YTD 2022 YTD 2023 Percent Change - 31.9% 584 350 - 35.9% $1,528,000 - 18.2% - 14.7% Pending Sales 287 181 - 36.9% - 38.5% 647 398 New Listings 342 241 - 29.5% 858 Sold Listings 257 150 - 41.6% 546 Median Sales Price $2,000,000 $1,697,500 - 15.1% $1,867,500 37 + 54.2% $2,019,143 -- -- Days on Market 16 31 + 93.8% 24 Avg. Sales Price $2,534,210 $2,280,520 - 10.0% $2,366,231 Active Listings 318 295 - 7.2% -- % of Properties Sold Over List Price 86.4% 62.7% - 27.4% 83.9% 25 54.3% - 35.3% - 12.6% 27 + 8.0% 105.4% % of List Price Received 121.9% 108.0% - 11.4% 120.6% Current as of April 11, 2023. All data from the San Francisco Association of REALTORS® MLS. Report © 2023 ShowingTime. | 2 Months Supply 1.3 1.7 + 30.8% -- -- -- Affordability Ratio 24 24 0.0% 3-2020 3-2021 3-2022 3-2023 3-2020 3-2021 3-2022 3-2023 3-2020 3-2021 3-2022 3-2023 3-2020 3-2021 3-2022 3-2023 3-2020 3-2021 3-2022 3-2023 3-2020 3-2021 3-2022 3-2023 3-2020 3-2021 3-2022 3-2023 3-2020 3-2021 3-2022 3-2023 3-2020 3-2021 3-2022 3-2023 3-2020 3-2021 3-2022 3-2023 3-2020 3-2021 3-2022 3-2023
- 3. Condo/TIC/Coop Activity Overview Key metrics by report month and for year-to-date (YTD) starting from the first of the year. Key Metrics Historical Sparkbars 3-2022 3-2023 Percent Change YTD 2022 YTD 2023 Percent Change - 37.1% Pending Sales 437 278 - 36.4% 975 585 - 40.0% New Listings 615 359 - 41.6% 1,622 1,020 Sold Listings 394 240 - 39.1% 830 485 - 41.6% Median Sales Price $1,206,750 $1,080,000 - 10.5% $1,200,000 $1,075,000 - 10.4% - 9.6% 63 + 50.0% $1,252,238 -- -- Days on Market 34 55 + 61.8% 42 Avg. Sales Price $1,411,860 $1,224,006 - 13.3% $1,385,259 Active Listings 1,048 702 - 33.0% -- % of Properties Sold Over List Price 58.1% 36.7% - 36.8% 53.9% 45 30.5% - 43.4% - 5.3% 44 - 2.2% 99.5% % of List Price Received 106.4% 100.4% - 5.6% 105.1% Current as of April 11, 2023. All data from the San Francisco Association of REALTORS® MLS. Report © 2023 ShowingTime. | 3 Months Supply 2.9 3.1 + 6.9% -- -- -- Affordability Ratio 45 43 - 4.4% 3-2020 3-2021 3-2022 3-2023 3-2020 3-2021 3-2022 3-2023 3-2020 3-2021 3-2022 3-2023 3-2020 3-2021 3-2022 3-2023 3-2020 3-2021 3-2022 3-2023 3-2020 3-2021 3-2022 3-2023 3-2020 3-2021 3-2022 3-2023 3-2020 3-2021 3-2022 3-2023 3-2020 3-2021 3-2022 3-2023 3-2020 3-2021 3-2022 3-2023 3-2020 3-2021 3-2022 3-2023
- 4. New Listings New Listings Single Family Year-Over-Year Change Condo/TIC/ Coop Year-Over-Year Change Apr-2022 329 -4.9% 540 -0.2% May-2022 301 -15.4% 516 +1.2% Jun-2022 320 -4.8% 451 -9.8% Jul-2022 241 -21.2% 381 -16.8% Aug-2022 239 -13.7% 307 -20.9% Sep-2022 367 -13.2% 574 -20.5% Oct-2022 244 -26.7% 377 -28.7% Nov-2022 152 -11.1% 154 -41.9% Dec-2022 73 -12.0% 79 -46.3% Jan-2023 169 -25.9% 341 -27.8% Feb-2023 174 -39.6% 320 -40.2% Mar-2023 241 -29.5% 359 -41.6% 12-Month Avg 238 -18.3% 367 -22.6% Historical New Listings by Month Current as of April 11, 2023. All data from the San Francisco Association of REALTORS® MLS. Report © 2023 ShowingTime. | 4 A count of the properties that have been newly listed on the market in a given month. 324 540 342 615 241 359 Single Family Condo/TIC/Coop March 0 200 400 600 800 1-2005 1-2006 1-2007 1-2008 1-2009 1-2010 1-2011 1-2012 1-2013 1-2014 1-2015 1-2016 1-2017 1-2018 1-2019 1-2020 1-2021 1-2022 1-2023 Single Family Condo/TIC/Coop 828 1,581 858 1,622 584 1,020 Single Family Condo/TIC/Coop Year to Date 2021 2022 2023 - 41.6% + 13.9% - 29.5% + 5.6% + 2.6% - 31.9% + 3.6% - 37.1% 2021 2022 2023 2021 2022 2023 2021 2022 2023 + 77.0% + 26.0% + 63.0% + 143.2%
- 5. Pending Sales Pending Sales Single Family Year-Over-Year Change Condo/TIC/ Coop Year-Over-Year Change Apr-2022 269 -5.9% 343 -28.5% May-2022 249 -18.9% 332 -28.3% Jun-2022 197 -28.1% 260 -33.0% Jul-2022 182 -29.7% 222 -39.0% Aug-2022 180 -20.4% 232 -26.6% Sep-2022 189 -42.6% 213 -36.8% Oct-2022 195 -28.6% 223 -44.9% Nov-2022 165 -36.3% 159 -55.8% Dec-2022 116 -10.1% 123 -45.6% Jan-2023 89 -38.6% 123 -51.0% Feb-2023 128 -40.5% 184 -35.9% Mar-2023 181 -36.9% 278 -36.4% 12-Month Avg 178 -28.4% 224 -37.6% Historical Pending Sales by Month Current as of April 11, 2023. All data from the San Francisco Association of REALTORS® MLS. Report © 2023 ShowingTime. | 5 A count of the properties on which offers have been accepted in a given month. 289 474 287 437 181 278 Single Family Condo/TIC/Coop March 0 100 200 300 400 500 600 1-2005 1-2006 1-2007 1-2008 1-2009 1-2010 1-2011 1-2012 1-2013 1-2014 1-2015 1-2016 1-2017 1-2018 1-2019 1-2020 1-2021 1-2022 1-2023 Single Family Condo/TIC/Coop 684 1,147 647 975 398 585 Single Family Condo/TIC/Coop Year to Date 2021 2022 2023 - 36.4% - 7.8% - 36.9% - 0.7% - 15.0% - 38.5% - 5.4% - 40.0% 2021 2022 2023 2021 2022 2023 2021 2022 2023 + 68.0% + 56.2% + 100.5% + 157.6%
- 6. Sold Listings Sold Listings Single Family Year-Over-Year Change Condo/TIC/ Coop Year-Over-Year Change Apr-2022 256 -11.4% 381 -17.5% May-2022 282 +6.0% 368 -17.1% Jun-2022 249 -23.6% 309 -34.7% Jul-2022 183 -28.2% 235 -36.3% Aug-2022 189 -26.2% 237 -31.9% Sep-2022 180 -26.5% 210 -28.1% Oct-2022 192 -38.1% 224 -38.5% Nov-2022 186 -36.5% 206 -51.5% Dec-2022 153 -29.2% 146 -55.1% Jan-2023 100 -23.1% 103 -44.6% Feb-2023 100 -37.1% 142 -43.2% Mar-2023 150 -41.6% 240 -39.1% 12-Month Avg 185 -26.0% 233 -35.3% Historical Sold Listings by Month Current as of April 11, 2023. All data from the San Francisco Association of REALTORS® MLS. Report © 2023 ShowingTime. | 6 A count of the actual sales that closed in a given month. 271 457 257 394 150 240 Single Family Condo/TIC/Coop March 0 100 200 300 400 500 1-2005 1-2006 1-2007 1-2008 1-2009 1-2010 1-2011 1-2012 1-2013 1-2014 1-2015 1-2016 1-2017 1-2018 1-2019 1-2020 1-2021 1-2022 1-2023 Single Family Condo/TIC/Coop 595 1,005 546 830 350 485 Single Family Condo/TIC/Coop Year to Date 2021 2022 2023 - 39.1% - 13.8% - 41.6% - 5.2% - 17.4% - 35.9% - 8.2% - 41.6% 2021 2022 2023 2021 2022 2023 2021 2022 2023 + 51.4% + 42.0% + 77.9% + 93.6%
- 7. Median Sales Price Median Sales Price Single Family Year-Over-Year Change Condo/TIC/ Coop Year-Over-Year Change Apr-2022 $2,050,000 +13.9% $1,365,000 +13.8% May-2022 $2,007,500 +6.4% $1,215,000 -1.1% Jun-2022 $1,880,000 -3.1% $1,240,000 -0.8% Jul-2022 $1,670,000 -9.7% $1,197,000 -1.1% Aug-2022 $1,610,000 -12.9% $1,000,000 -13.0% Sep-2022 $1,650,000 -5.7% $1,160,000 -3.3% Oct-2022 $1,670,000 -7.5% $1,200,000 -3.8% Nov-2022 $1,500,000 -20.2% $1,136,500 -9.8% Dec-2022 $1,550,000 -8.3% $950,000 -26.9% Jan-2023 $1,367,500 -16.1% $985,800 -7.9% Feb-2023 $1,465,000 -24.1% $1,162,500 -5.3% Mar-2023 $1,697,500 -15.1% $1,080,000 -10.5% 12-Month Avg* $1,701,500 -8.0% $1,180,000 -3.7% Historical Median Sales Price by Month * Median Sales Price for all properties from April 2022 through March 2023. This is not the average of the individual figures above. Current as of April 11, 2023. All data from the San Francisco Association of REALTORS® MLS. Report © 2023 ShowingTime. | 7 Point at which half of the sales sold for more and half sold for less, not accounting for seller concessions, in a given month. $1,725,000 $1,221,184 $2,000,000 $1,206,750 $1,697,500 $1,080,000 Single Family Condo/TIC/Coop March $500,000 $750,000 $1,000,000 $1,250,000 $1,500,000 $1,750,000 $2,000,000 $2,250,000 1-2005 1-2006 1-2007 1-2008 1-2009 1-2010 1-2011 1-2012 1-2013 1-2014 1-2015 1-2016 1-2017 1-2018 1-2019 1-2020 1-2021 1-2022 1-2023 Single Family Condo/TIC/Coop $1,650,000 $1,175,000 $1,867,500 $1,200,000 $1,528,000 $1,075,000 Single Family Condo/TIC/Coop Year to Date 2021 2022 2023 - 10.5% - 1.2% - 15.1% + 15.9% + 2.1% - 18.2% + 13.2% - 10.4% 2021 2022 2023 2021 2022 2023 2021 2022 2023 + 9.5% + 6.5% - 2.6% - 2.3%
- 8. Average Sales Price Average Sales Price Single Family Year-Over-Year Change Condo/TIC/ Coop Year-Over-Year Change Apr-2022 $2,506,193 +3.1% $1,473,383 +9.4% May-2022 $2,411,895 -2.7% $1,403,091 +1.7% Jun-2022 $2,355,940 -5.8% $1,366,119 -1.5% Jul-2022 $2,061,331 -10.1% $1,466,757 +8.1% Aug-2022 $1,950,088 -8.4% $1,174,880 -17.6% Sep-2022 $1,881,502 -13.1% $1,343,336 +0.8% Oct-2022 $2,211,462 -6.3% $1,418,171 -3.0% Nov-2022 $1,895,086 -19.4% $1,399,284 -9.1% Dec-2022 $1,874,472 -20.8% $1,101,263 -26.0% Jan-2023 $1,811,636 -8.1% $1,257,127 -4.1% Feb-2023 $1,834,585 -24.1% $1,296,409 -7.3% Mar-2023 $2,280,520 -10.0% $1,224,006 -13.3% 12-Month Avg* $2,145,681 -8.8% $1,349,179 -4.1% Historical Average Sales Price by Month * Avg. Sales Price for all properties from April 2022 through March 2023. This is not the average of the individual figures above. Current as of April 11, 2023. All data from the San Francisco Association of REALTORS® MLS. Report © 2023 ShowingTime. | 8 Average sales price for all closed sales, not accounting for seller concessions, in a given month. $2,210,908 $1,369,434 $2,534,210 $1,411,860 $2,280,520 $1,224,006 Single Family Condo/TIC/Coop March $500,000 $1,000,000 $1,500,000 $2,000,000 $2,500,000 $3,000,000 1-2005 1-2006 1-2007 1-2008 1-2009 1-2010 1-2011 1-2012 1-2013 1-2014 1-2015 1-2016 1-2017 1-2018 1-2019 1-2020 1-2021 1-2022 1-2023 Single Family Condo/TIC/Coop $2,151,945 $1,320,023 $2,366,231 $1,385,259 $2,019,143 $1,252,238 Single Family Condo/TIC/Coop Year to Date 2021 2022 2023 - 13.3% + 3.1% - 10.0% + 14.6% + 4.9% - 14.7% + 10.0% - 9.6% 2021 2022 2023 2021 2022 2023 2021 2022 2023 + 9.0% + 6.7% - 1.2% + 0.2%
- 9. Days on Market Until Sale Days on Market Until Sale Single Family Year-Over-Year Change Condo/TIC/ Coop Year-Over-Year Change Apr-2022 16 -20.0% 32 -31.9% May-2022 21 +5.0% 37 -5.1% Jun-2022 17 -10.5% 39 +5.4% Jul-2022 21 +10.5% 49 +16.7% Aug-2022 26 +4.0% 50 +16.3% Sep-2022 28 +21.7% 58 +45.0% Oct-2022 28 +40.0% 43 +19.4% Nov-2022 35 +66.7% 51 +24.4% Dec-2022 38 +22.6% 74 +57.4% Jan-2023 50 +22.0% 87 +27.9% Feb-2023 33 +50.0% 59 +63.9% Mar-2023 31 +93.8% 55 +61.8% 12-Month Avg* 26 +18.5% 48 +15.6% Historical Days on Market Until Sale by Month * Days on Market for all properties from April 2022 through March 2023. This is not the average of the individual figures above. Current as of April 11, 2023. All data from the San Francisco Association of REALTORS® MLS. Report © 2023 ShowingTime. | 9 Average number of days between when a property is listed and when an offer is accepted in a given month. 26 48 16 34 31 55 Single Family Condo/TIC/Coop March 0 20 40 60 80 100 120 1-2005 1-2006 1-2007 1-2008 1-2009 1-2010 1-2011 1-2012 1-2013 1-2014 1-2015 1-2016 1-2017 1-2018 1-2019 1-2020 1-2021 1-2022 1-2023 Single Family Condo/TIC/Coop 32 60 24 42 37 63 Single Family Condo/TIC/Coop Year to Date 2021 2022 2023 + 61.8% - 29.2% + 93.8% - 38.5% - 30.0% + 54.2% - 25.0% + 50.0% 2021 2022 2023 2021 2022 2023 2021 2022 2023 + 18.2% + 10.3% + 46.3% + 60.0%
- 10. Inventory of Active Listings Inventory of Active Listings Single Family Year-Over-Year Change Condo/TIC/ Coop Year-Over-Year Change Apr-2022 337 -14.2% 1,109 -0.3% May-2022 331 -18.5% 1,119 +4.6% Jun-2022 376 -9.6% 1,101 +3.9% Jul-2022 365 -14.1% 1,018 -4.1% Aug-2022 348 -19.1% 890 -13.2% Sep-2022 480 +1.5% 1,099 -15.6% Oct-2022 471 -3.5% 1,087 -16.6% Nov-2022 373 +2.8% 857 -21.6% Dec-2022 213 +3.9% 505 -25.3% Jan-2023 255 -2.7% 630 -24.2% Feb-2023 276 -8.3% 698 -29.6% Mar-2023 295 -7.2% 702 -33.0% 12-Month Avg* 343 -8.0% 901 -14.0% Historical Inventory of Active Listings by Month * Active Listings for all properties from April 2022 through March 2023. This is not the average of the individual figures above. Current as of April 11, 2023. All data from the San Francisco Association of REALTORS® MLS. Report © 2023 ShowingTime. | 10 The number of properties available for sale in active status at the end of a given month. 367 1,149 318 1,048 295 702 Single Family Condo/TIC/Coop March 0 500 1,000 1,500 2,000 2,500 1-2005 1-2006 1-2007 1-2008 1-2009 1-2010 1-2011 1-2012 1-2013 1-2014 1-2015 1-2016 1-2017 1-2018 1-2019 1-2020 1-2021 1-2022 1-2023 Single Family Condo/TIC/Coop 2021 2022 2023 - 33.0% - 8.8% - 7.2% - 13.4% 2021 2022 2023 - 0.8% + 63.9%
- 11. % of Properties Sold Over List Price % of Properties Sold Over List Price Single Family Year-Over-Year Change Condo/TIC/ Coop Year-Over-Year Change Apr-2022 88.7% +16.6% 63.0% +39.4% May-2022 86.9% +9.0% 55.3% +3.6% Jun-2022 86.3% +5.0% 57.3% +5.5% Jul-2022 78.1% -6.5% 39.6% -28.8% Aug-2022 75.7% -10.3% 37.1% -32.1% Sep-2022 67.2% -20.5% 31.0% -43.1% Oct-2022 64.1% -24.1% 37.5% -38.2% Nov-2022 57.5% -27.7% 30.6% -45.2% Dec-2022 48.4% -38.5% 15.8% -66.0% Jan-2023 44.0% -41.6% 19.4% -49.9% Feb-2023 52.0% -40.1% 28.2% -51.7% Mar-2023 62.7% -27.4% 36.7% -36.8% 12-Month Avg 71.5% -12.7% 42.3% -20.8% Historical % of Properties Sold Over List Price by Month * % of Properties Sold Over List Price for all properties from April 2022 through March 2023. This is not the average of the individual figures above. Current as of April 11, 2023. All data from the San Francisco Association of REALTORS® MLS. Report © 2023 ShowingTime. | 11 Percentage found when dividing the number of properties sold by properties sold over its original list price, not accounting for seller concessions. 73.8% 42.9% 86.4% 58.1% 62.7% 36.7% Single Family Condo/TIC/Coop March 0.0% 20.0% 40.0% 60.0% 80.0% 100.0% 1-2005 1-2006 1-2007 1-2008 1-2009 1-2010 1-2011 1-2012 1-2013 1-2014 1-2015 1-2016 1-2017 1-2018 1-2019 1-2020 1-2021 1-2022 1-2023 Single Family Condo/TIC/Coop 67.9% 35.1% 83.9% 53.9% 54.3% 30.5% Single Family Condo/TIC/Coop Year to Date 2021 2022 2023 - 36.8% + 35.4% - 27.4% + 17.1% + 53.6% - 35.3% + 23.6% - 43.4% 2021 2022 2023 2021 2022 2023 2021 2022 2023 - 5.6% - 6.6% - 34.8% - 28.7%
- 12. % of List Price Received % of List Price Received Single Family Year-Over-Year Change Condo/TIC/ Coop Year-Over-Year Change Apr-2022 123.1% +8.2% 107.2% +3.4% May-2022 119.6% +2.4% 105.9% +0.7% Jun-2022 116.8% +0.5% 105.3% 0.0% Jul-2022 110.9% -6.4% 101.5% -3.1% Aug-2022 108.4% -6.6% 100.7% -3.5% Sep-2022 108.5% -6.7% 100.6% -4.2% Oct-2022 107.1% -8.5% 100.4% -4.8% Nov-2022 104.9% -8.6% 99.2% -5.2% Dec-2022 102.8% -10.1% 98.1% -5.2% Jan-2023 103.2% -12.1% 98.0% -3.1% Feb-2023 103.8% -14.4% 99.0% -6.7% Mar-2023 108.0% -11.4% 100.4% -5.6% 12-Month Avg* 111.4% -4.6% 102.4% -2.3% Historical % of List Price Received by Month * % of List Price Received for all properties from April 2022 through March 2023. This is not the average of the individual figures above. Current as of April 11, 2023. All data from the San Francisco Association of REALTORS® MLS. Report © 2023 ShowingTime. | 12 Percentage found when dividing a property’s sales price by its most recent list price, then taking the average for all properties sold in a given month, not accounting for seller concessions. 112.1% 102.4% 121.9% 106.4% 108.0% 100.4% Single Family Condo/TIC/Coop March 109.6% 100.9% 120.6% 105.1% 105.4% 99.5% Single Family Condo/TIC/Coop Year to Date 90.0% 100.0% 110.0% 120.0% 130.0% 1-2005 1-2006 1-2007 1-2008 1-2009 1-2010 1-2011 1-2012 1-2013 1-2014 1-2015 1-2016 1-2017 1-2018 1-2019 1-2020 1-2021 1-2022 1-2023 Single Family Condo/TIC/Coop 2021 2022 2023 - 5.6% + 3.9% - 11.4% + 8.7% 2021 2022 2023 - 1.8% - 1.6% 2021 2022 2023 - 5.3% + 4.2% - 12.6% + 10.0% 2021 2022 2023 - 1.7% - 2.5%
- 13. Housing Affordability Ratio Housing Affordability Ratio Single Family Year-Over-Year Change Condo/TIC/ Coop Year-Over-Year Change Apr-2022 21 -32.3% 37 -32.7% May-2022 22 -26.7% 42 -22.2% Jun-2022 23 -17.9% 40 -23.1% Jul-2022 27 -10.0% 43 -20.4% Aug-2022 28 -6.7% 51 -10.5% Sep-2022 24 -25.0% 39 -29.1% Oct-2022 23 -25.8% 37 -30.2% Nov-2022 27 -10.0% 39 -27.8% Dec-2022 27 -15.6% 49 0.0% Jan-2023 31 -3.1% 48 -15.8% Feb-2023 28 +3.7% 40 -18.4% Mar-2023 24 0.0% 43 -4.4% 12-Month Avg* 25 -19.2% 42 -18.6% Historical Housing Affordability Ratio by Month * Affordability Ratio for all properties from April 2022 through March 2023. This is not the average of the individual figures above. Current as of April 11, 2023. All data from the San Francisco Association of REALTORS® MLS. Report © 2023 ShowingTime. | 13 This index measures housing affordability for the region. For example, an index of 120 means the median household income is 120% of what is necessary to qualify for the median-priced home under prevailing interest rates. A higher number means greater affordability. 32 52 24 45 24 43 Single Family Condo/TIC/Coop March 20 40 60 80 100 1-2005 1-2006 1-2007 1-2008 1-2009 1-2010 1-2011 1-2012 1-2013 1-2014 1-2015 1-2016 1-2017 1-2018 1-2019 1-2020 1-2021 1-2022 1-2023 Single Family Condo/TIC/Coop 2021 2022 2023 - 4.4% - 13.5% 0.0% - 25.0% 2021 2022 2023 - 3.0% + 6.1% 33 54 25 45 27 44 Single Family Condo/TIC/Coop Year to Date 2021 2022 2023 - 2.2% - 16.7% + 8.0% - 24.2% 2021 2022 2023 - 2.9% + 5.9%
- 14. Months Supply of Inventory Months Supply of Inventory Single Family Year-Over-Year Change Condo/TIC/ Coop Year-Over-Year Change Apr-2022 1.4 -12.5% 3.2 -8.6% May-2022 1.4 -12.5% 3.3 +6.5% Jun-2022 1.6 0.0% 3.4 +13.3% Jul-2022 1.6 0.0% 3.2 +10.3% Aug-2022 1.5 -6.3% 2.9 +3.6% Sep-2022 2.2 +22.2% 3.7 +5.7% Oct-2022 2.3 +21.1% 3.9 +11.4% Nov-2022 1.9 +35.7% 3.2 +10.3% Dec-2022 1.1 +37.5% 2.0 +11.1% Jan-2023 1.3 +30.0% 2.6 +18.2% Feb-2023 1.5 +25.0% 2.9 +7.4% Mar-2023 1.7 +30.8% 3.1 +6.9% 12-Month Avg* 1.6 +11.0% 3.1 +7.3% Historical Months Supply of Inventory by Month * Months Supply for all properties from April 2022 through March 2023. This is not the average of the individual figures above. Current as of April 11, 2023. All data from the San Francisco Association of REALTORS® MLS. Report © 2023 ShowingTime. | 14 The inventory of homes for sale at the end of a given month, divided by the average monthly pending sales from the last 12 months. 1.6 4.0 1.3 2.9 1.7 3.1 Single Family Condo/TIC/Coop March 0.0 2.0 4.0 6.0 8.0 10.0 12.0 1-2005 1-2006 1-2007 1-2008 1-2009 1-2010 1-2011 1-2012 1-2013 1-2014 1-2015 1-2016 1-2017 1-2018 1-2019 1-2020 1-2021 1-2022 1-2023 Single Family Condo/TIC/Coop 2021 2022 2023 + 6.9% - 27.5% + 30.8% - 18.8% 2021 2022 2023 - 15.8% + 33.3%
- 15. All Properties Activity Overview Key metrics by report month and for year-to-date (YTD) starting from the first of the year. Key Metrics Historical Sparkbars 3-2022 3-2023 Percent Change YTD 2022 YTD 2023 Percent Change - 35.1% Pending Sales 730 470 - 35.6% 1,638 999 - 39.0% New Listings 969 606 - 37.5% 2,504 1,626 Sold Listings 656 400 - 39.0% 1,390 848 - 39.0% Median Sales Price $1,502,167 $1,344,058 - 10.5% $1,453,500 $1,296,500 - 10.8% - 11.5% 52 + 48.6% $1,569,762 -- -- Days on Market 27 45 + 66.7% 35 Avg. Sales Price $1,857,652 $1,626,068 - 12.5% $1,773,010 Active Listings 1,394 1,016 - 27.1% -- % of Properties Sold Over List Price 69.1% 46.3% - 33.0% 65.6% 31 40.4% - 38.4% - 8.4% 30 - 3.2% 101.9% % of List Price Received 112.4% 103.2% - 8.2% 111.2% Current as of April 11, 2023. All data from the San Francisco Association of REALTORS® MLS. Report © 2023 ShowingTime. | 15 Months Supply 2.3 2.5 + 8.7% -- -- -- Affordability Ratio 30 29 - 3.3% 3-2020 3-2021 3-2022 3-2023 3-2020 3-2021 3-2022 3-2023 3-2020 3-2021 3-2022 3-2023 3-2020 3-2021 3-2022 3-2023 3-2020 3-2021 3-2022 3-2023 3-2020 3-2021 3-2022 3-2023 3-2020 3-2021 3-2022 3-2023 3-2020 3-2021 3-2022 3-2023 3-2020 3-2021 3-2022 3-2023 3-2020 3-2021 3-2022 3-2023 3-2020 3-2021 3-2022 3-2023
- 16. Activity by District SF District 1: Northwest (Sea Cliff, Lake, Jordan Park / Laurel Heights, Outer Richmond, Central Richmond, Inner Richmond, Lone Mountain) SF District 2: Central West (Outer Sunset, Central Sunset, Inner Sunset, Outer Parkside, Parkside, Inner Parkside, Golden Gate Heights) SF District 3: Southwest (Pine Lake Park, Lake Shore, Merced Manor, Stonestown, Lakeside, Merced Heights, Ingleside, Ingleside Heights, Oceanview) SF District 4: Twin Peaks W (Forest Hill (& Ext), W Portal, St Francis Wd, Balboa Terr, Mt Dav Manor, Ingleside Terr, Monterey Hts, Wstwd Pk & H'lnds, Shrwd Fst, Miraloma Pk, Dmnd Hts, Mdtwn Terr) SF District 5: Central (Haight Ashbury, Cole Vly / Prnssus Hts, Clarndn Hts, Corona Hts, Twin Pks, Glen Pk, Noe Vly, Eureka Vly / Dolores Hts, Mission Dolores, Duboce Trngl, Buena Vista / Ashbury Hts) SF District 6: Central North (Lower Pacific Heights, Anza Vista, Western Addition, North Panhandle, Alamo Square, Hayes Valley) SF District 7: North (Marina, Cow Hollow, Presidio Heights, Pacific Heights) SF District 8: Northeast (North Waterfront, North Beach, Russian Hill, Telegraph Hill, Nob Hill, Financial District / Barbary Coast, Downtown, Van Ness / Civic Center, Tenderloin) SF District 9: Central East (Yerba Buena, South Beach, South of Market, Mission Bay, Inner Mission, Potrero Hill, Central Waterfront / Dogpatch, Bernal Heights) SF District 10: Southeast (Outer Mission, Mission Terr, Excelsior, Portola, Bayview, Silver Terr, Hunters Pt, Candlestick Pt, Bayview Hts, Little Hollywood, Visitation Vly, Crocker Amazon) 3-2022 3-2023 + / – 3-2022 3-2023 + / – 3-2022 3-2023 + / – 3-2022 3-2023 + / – 3-2022 3-2023 + / – Single Family 1 SF District 1 23 16 -30.4% 18 15 -16.7% $2,240,000 $2,705,000 +20.8% 24 25 +4.2% 1.1 1.1 0.0% 2 SF District 2 40 36 -10.0% 44 25 -43.2% $1,792,000 $1,600,000 -10.7% 11 28 +154.5% 0.9 1.0 +11.1% 3 SF District 3 14 17 +21.4% 23 12 -47.8% $1,541,500 $1,431,500 -7.1% 19 21 +10.5% 0.8 1.4 +75.0% 4 SF District 4 28 19 -32.1% 33 23 -30.3% $2,348,000 $1,900,000 -19.1% 13 28 +115.4% 0.8 0.7 -12.5% 5 SF District 5 40 45 +12.5% 41 19 -53.7% $2,770,000 $2,600,000 -6.1% 10 30 +200.0% 1.1 1.8 +63.6% 6 SF District 6 11 7 -36.4% 5 0 -100.0% $3,600,000 $0 -100.0% 10 0 -100.0% 2.3 3.1 +34.8% 7 SF District 7 27 44 +63.0% 16 6 -62.5% $5,887,500 $4,429,000 -24.8% 31 57 +83.9% 2.1 6.9 +228.6% 8 SF District 8 18 16 -11.1% 3 2 -33.3% $2,645,000 $6,025,000 +127.8% 50 189 +278.0% 6.0 5.9 -1.7% 9 SF District 9 45 33 -26.7% 35 19 -45.7% $1,750,000 $1,625,000 -7.1% 17 29 +70.6% 1.7 1.8 +5.9% 10 SF District 10 72 62 -13.9% 39 29 -25.6% $1,280,000 $1,170,000 -8.6% 16 32 +100.0% 1.6 1.7 +6.3% Condo/TIC/Coop 1 SF District 1 30 20 -33.3% 31 16 -48.4% $1,350,000 $1,090,000 -19.3% 23 28 +21.7% 1.7 1.6 -5.9% 2 SF District 2 11 9 -18.2% 7 7 0.0% $1,300,000 $925,000 -28.8% 46 28 -39.1% 2.2 2.3 +4.5% 3 SF District 3 4 6 +50.0% 3 4 +33.3% $760,000 $577,500 -24.0% 35 35 0.0% 1.0 2.1 +110.0% 4 SF District 4 12 11 -8.3% 7 2 -71.4% $790,000 $735,000 -7.0% 14 34 +142.9% 2.1 4.0 +90.5% 5 SF District 5 70 65 -7.1% 64 42 -34.4% $1,505,500 $1,445,000 -4.0% 20 35 +75.0% 1.3 1.6 +23.1% 6 SF District 6 90 61 -32.2% 40 28 -30.0% $1,255,000 $1,470,000 +17.1% 23 42 +82.6% 2.3 2.4 +4.3% 7 SF District 7 85 59 -30.6% 31 20 -35.5% $1,860,000 $1,338,000 -28.1% 14 39 +178.6% 2.2 2.5 +13.6% 8 SF District 8 218 163 -25.2% 65 45 -30.8% $1,100,000 $979,000 -11.0% 45 71 +57.8% 3.5 4.3 +22.9% 9 SF District 9 488 282 -42.2% 136 70 -48.5% $1,137,500 $986,500 -13.3% 47 66 +40.4% 3.9 4.1 +5.1% 10 SF District 10 40 26 -35.0% 10 6 -40.0% $798,444 $659,000 -17.5% 16 165 +931.3% 5.1 4.9 -3.9% Key metrics by report month for the districts of San Francisco. Current as of April 11, 2023. All data from the San Francisco Association of REALTORS® MLS. Report © 2023 ShowingTime. | 16 Active Listings Sold Listings Median Sales Price Days on Market Months Supply