SlideShare uma empresa Scribd logo
1 de 16
Baixar para ler offline
January 2020 Monthly Snapshot
One-Year Change in One-Year Change in
Median Sales Price
Single Family
Median Sales Price
Condo/TIC/Coop
2
3
4
5
6
7
8
9
10
11
12
13
14
15
16
Monthly Indicators
+ 5.3% + 13.7% + 8.5%
One-Year Change in
For 2020, The National Association of REALTORS® Chief Economist Lawrence
Yun sees good news for home prices. “National median home price growth is in
no danger of falling due to inventory shortages and will rise by 4%,” the long-
term NAR economist predicts. He is also expecting the new-home construction
market sales to increase 10%. Yun and others would like to see home builders
bring more affordable units to market to help ease shortages and slow price
gains in that segment.
New Listings were down 33.9 percent for single family homes and 33.2 percent
for Condo/TIC/Coop properties. Pending Sales increased 14.6 percent for
single family homes and 26.4 percent for Condo/TIC/Coop properties.
The Median Sales Price was up 5.3 percent to $1,462,500 for single family
homes and 13.7 percent to $1,182,500 for Condo/TIC/Coop properties. Months
Supply of Inventory decreased 33.3 percent for single family units and 21.4
percent for Condo/TIC/Coop units.
We start off the year with continued low interest rates, low unemployment, and
rising rents nationally. These factors should encourage healthy buyer demand
and sets us up for a strong start to the 2020 housing market and a lot of
optimism for the coming spring market.
Median Sales Price
All Property Types
Residential real estate activity in San Francisco County (Districts 1-10)
composed of single-family properties, townhomes and condominiums.
Percent changes are calculated using rounded figures.
Single Family Activity Overview
Months Supply of Inventory
Current as of February 11, 2020. All data from the San Francisco MLS. Report © 2020 ShowingTime.
Condo/TIC/Coop Activity Overview
Inventory of Active Listings
% of Properties Sold Over List Price
% of List Price Received
Housing Affordability Ratio
All Properties Activity Overview
New Listings
Pending Sales
Sold Listings
Median Sales Price
Average Sales Price
Days on Market Until Sale
Activity by District
Single Family Activity Overview
Key metrics by report month and for year-to-date (YTD) starting from the first of the year.
Key Metrics Historical Sparkbars 1-2019 1-2020 Percent Change YTD 2019 YTD 2020 Percent Change
Current as of February 11, 2020. All data from the San Francisco MLS. Report © 2020 ShowingTime. | 2
Months Supply 2.4 1.6 - 33.3% -- -- --
Affordability Ratio 35 37 + 5.7%
% of List Price Received 106.0% 107.2% + 1.1% 106.0%
35
61.7% + 2.8%
+ 1.1%
37 + 5.7%
107.2%
% of Properties Sold Over List Price 60.0% 61.7% + 2.8% 60.0%
Active Listings 446 290 - 35.0% --
Avg. Sales Price $1,751,963 $2,224,366 + 27.0% $1,751,963
Days on Market 39 38 - 2.6% 39 38 - 2.6%
$2,224,366
-- --
Median Sales Price $1,389,000 $1,462,500 + 5.3% $1,389,000
Sold Listings 100 94 - 6.0% 100
New Listings 224 148 - 33.9% 224
Pending Sales 89 102 + 14.6% + 14.6%89 102
- 33.9%148
94 - 6.0%
$1,462,500 + 5.3%
+ 27.0%
1-2017 1-2018 1-2019 1-2020
1-2017 1-2018 1-2019 1-2020
1-2017 1-2018 1-2019 1-2020
1-2017 1-2018 1-2019 1-2020
1-2017 1-2018 1-2019 1-2020
1-2017 1-2018 1-2019 1-2020
1-2017 1-2018 1-2019 1-2020
1-2017 1-2018 1-2019 1-2020
1-2017 1-2018 1-2019 1-2020
1-2017 1-2018 1-2019 1-2020
1-2017 1-2018 1-2019 1-2020
Condo/TIC/Coop Activity Overview
Key metrics by report month and for year-to-date (YTD) starting from the first of the year.
Key Metrics Historical Sparkbars 1-2019 1-2020 Percent Change YTD 2019 YTD 2020 Percent Change
Current as of February 11, 2020. All data from the San Francisco MLS. Report © 2020 ShowingTime. | 3
Months Supply 2.8 2.2 - 21.4% -- -- --
Affordability Ratio 54 53 - 1.9%
% of List Price Received 101.0% 100.4% - 0.6% 101.0%
54
33.6% - 18.4%
- 0.6%
53 - 1.9%
100.4%
% of Properties Sold Over List Price 41.2% 33.6% - 18.4% 41.2%
Active Listings 688 536 - 22.1% --
Avg. Sales Price $1,177,310 $1,326,575 + 12.7% $1,177,310
Days on Market 55 62 + 12.7% 55
$1,182,500 + 13.7%
+ 12.7%
62 + 12.7%
$1,326,575
-- --
Sold Listings 114 146 + 28.1% 114 146 + 28.1%
Median Sales Price $1,040,000 $1,182,500 + 13.7% $1,040,000
- 33.2%
Pending Sales 121 153 + 26.4% 121 153 + 26.4%
New Listings 358 239 - 33.2% 358 239
1-2017 1-2018 1-2019 1-2020
1-2017 1-2018 1-2019 1-2020
1-2017 1-2018 1-2019 1-2020
1-2017 1-2018 1-2019 1-2020
1-2017 1-2018 1-2019 1-2020
1-2017 1-2018 1-2019 1-2020
1-2017 1-2018 1-2019 1-2020
1-2017 1-2018 1-2019 1-2020
1-2017 1-2018 1-2019 1-2020
1-2017 1-2018 1-2019 1-2020
1-2017 1-2018 1-2019 1-2020
New Listings
New Listings
Single
Family
Year-Over-Year
Change
Condo/TIC/
Coop
Year-Over-Year
Change
Feb-2019 189 -9.1% 306 -14.3%
Mar-2019 241 -13.3% 351 -7.4%
Apr-2019 252 -7.0% 377 -0.3%
May-2019 275 +1.5% 366 -1.1%
Jun-2019 233 -12.1% 283 -20.9%
Jul-2019 195 -18.4% 319 +22.2%
Aug-2019 241 -3.6% 325 +4.5%
Sep-2019 301 -10.9% 505 +11.2%
Oct-2019 233 -9.7% 340 -0.3%
Nov-2019 116 -27.0% 139 -29.1%
Dec-2019 66 -19.5% 107 -12.3%
Jan-2020 148 -33.9% 239 -33.2%
12-Month Avg 208 -12.4% 305 -5.9%
Historical New Listings by Month
Current as of February 11, 2020. All data from the San Francisco MLS. Report © 2020 ShowingTime. | 4
A count of the properties that have been newly listed on the market in a given month.
188
369
224
358
148
239
Single Family Condo/TIC/Coop
January
0
100
200
300
400
500
600
700
1-2005 1-2006 1-2007 1-2008 1-2009 1-2010 1-2011 1-2012 1-2013 1-2014 1-2015 1-2016 1-2017 1-2018 1-2019 1-2020
Single Family Condo/TIC/Coop
188
369
224
358
148
239
Single Family Condo/TIC/Coop
Year to Date
2018 2019 2020
- 33.2%- 3.0%- 33.9%+ 19.1% - 3.0%- 33.9%+ 19.1% - 33.2%
2018 2019 2020 2018 2019 2020 2018 2019 2020
+ 5.6% + 5.6% + 12.2%+ 12.2%
Pending Sales
Pending Sales
Single
Family
Year-Over-Year
Change
Condo/TIC/
Coop
Year-Over-Year
Change
Feb-2019 144 -8.9% 228 +1.8%
Mar-2019 210 -2.3% 299 -11.0%
Apr-2019 222 +7.2% 313 +9.1%
May-2019 248 -9.8% 336 +13.1%
Jun-2019 194 -4.9% 245 -18.9%
Jul-2019 183 +10.9% 206 -16.6%
Aug-2019 151 -11.2% 211 -9.1%
Sep-2019 195 +1.0% 229 +4.6%
Oct-2019 247 -1.6% 303 +4.1%
Nov-2019 191 +2.1% 234 +5.4%
Dec-2019 117 -3.3% 154 +4.8%
Jan-2020 102 +14.6% 153 +26.4%
12-Month Avg 184 -1.4% 243 -0.5%
Historical Pending Sales by Month
A count of the properties on which offers have been accepted in a given month.
Current as of February 11, 2020. All data from the San Francisco MLS. Report © 2020 ShowingTime. | 5
87
180
89
121
102
153
Single Family Condo/TIC/Coop
January
0
100
200
300
400
1-2005 1-2006 1-2007 1-2008 1-2009 1-2010 1-2011 1-2012 1-2013 1-2014 1-2015 1-2016 1-2017 1-2018 1-2019 1-2020
Single Family Condo/TIC/Coop
87
180
89
121
102
153
Single Family Condo/TIC/Coop
Year to Date
2018 2019 2020
+ 26.4%- 32.8%+ 14.6%+ 2.3% - 32.8%+ 14.6%+ 2.3% + 26.4%
2018 2019 2020 2018 2019 2020 2018 2019 2020
- 6.5% - 6.5% + 24.1%+ 24.1%
Sold Listings
Sold Listings
Single
Family
Year-Over-Year
Change
Condo/TIC/
Coop
Year-Over-Year
Change
Feb-2019 113 +5.6% 164 -18.8%
Mar-2019 172 -14.0% 265 -8.3%
Apr-2019 226 +18.9% 319 +7.8%
May-2019 239 -4.0% 337 +8.0%
Jun-2019 190 -17.7% 265 -12.5%
Jul-2019 213 +10.9% 243 -11.3%
Aug-2019 168 -12.0% 207 -20.4%
Sep-2019 126 -14.3% 192 +4.9%
Oct-2019 255 +2.8% 259 -11.6%
Nov-2019 199 -9.5% 272 +3.0%
Dec-2019 175 +9.4% 211 +8.8%
Jan-2020 94 -6.0% 146 +28.1%
12-Month Avg 181 -2.9% 240 -3.5%
Historical Sold Listings by Month
A count of the actual sales that closed in a given month.
Current as of February 11, 2020. All data from the San Francisco MLS. Report © 2020 ShowingTime. | 6
95
149
100
114
94
146
Single Family Condo/TIC/Coop
January
0
100
200
300
400
1-2005 1-2006 1-2007 1-2008 1-2009 1-2010 1-2011 1-2012 1-2013 1-2014 1-2015 1-2016 1-2017 1-2018 1-2019 1-2020
Single Family Condo/TIC/Coop
95
149
100
114
94
146
Single Family Condo/TIC/Coop
Year to Date
2018 2019 2020
+ 28.1%- 23.5%- 6.0%+ 5.3% - 23.5%- 6.0%+ 5.3% + 28.1%
2018 2019 2020 2018 2019 2020 2018 2019 2020
- 10.4% - 10.4% - 0.7%- 0.7%
Median Sales Price
Median Sales Price
Single
Family
Year-Over-Year
Change
Condo/TIC/
Coop
Year-Over-Year
Change
Feb-2019 $1,500,000 -11.8% $1,130,000 +4.1%
Mar-2019 $1,650,000 -2.2% $1,245,000 -0.4%
Apr-2019 $1,612,500 -2.2% $1,225,000 -2.0%
May-2019 $1,685,000 +4.1% $1,245,000 -1.0%
Jun-2019 $1,750,000 +7.7% $1,299,000 +11.0%
Jul-2019 $1,576,000 -3.1% $1,220,000 +6.1%
Aug-2019 $1,602,500 +4.2% $1,281,250 +3.8%
Sep-2019 $1,540,000 +2.7% $1,325,000 +15.2%
Oct-2019 $1,650,000 +3.1% $1,325,000 +9.1%
Nov-2019 $1,608,000 +12.6% $1,180,000 -1.1%
Dec-2019 $1,450,000 -2.8% $1,200,000 +2.6%
Jan-2020 $1,462,500 +5.3% $1,182,500 +13.7%
12-Month Avg* $1,600,000 +1.6% $1,246,750 +3.9%
Historical Median Sales Price by Month
Point at which half of the sales sold for more and half sold for less, not accounting for seller concessions, in a given month.
* Median Sales Price for all properties from February 2019 through January 2020. This is not the
average of the individual figures above.
Current as of February 11, 2020. All data from the San Francisco MLS. Report © 2020 ShowingTime. | 7
$1,330,000
$1,100,000
$1,389,000
$1,040,000
$1,462,500
$1,182,500
Single Family Condo/TIC/Coop
January
$500,000
$750,000
$1,000,000
$1,250,000
$1,500,000
$1,750,000
$2,000,000
1-2005 1-2006 1-2007 1-2008 1-2009 1-2010 1-2011 1-2012 1-2013 1-2014 1-2015 1-2016 1-2017 1-2018 1-2019 1-2020
Single Family Condo/TIC/Coop
$1,330,000
$1,100,000
$1,389,000
$1,040,000
$1,462,500
$1,182,500
Single Family Condo/TIC/Coop
Year to Date
2018 2019 2020
+ 13.7%- 5.5%+ 5.3%+ 4.4% - 5.5%+ 5.3%+ 4.4% + 13.7%
2018 2019 2020 2018 2019 2020 2018 2019 2020
+ 6.4% + 6.4% + 10.0%+ 10.0%
Average Sales Price
Avg. Sales Price
Single
Family
Year-Over-Year
Change
Condo/TIC/
Coop
Year-Over-Year
Change
Feb-2019 $1,871,058 -11.2% $1,363,140 +7.8%
Mar-2019 $2,046,399 +5.0% $1,335,673 -2.6%
Apr-2019 $2,235,456 +2.3% $1,363,254 +2.1%
May-2019 $2,141,318 +6.0% $1,335,560 -4.5%
Jun-2019 $2,148,466 +10.6% $1,431,991 +7.1%
Jul-2019 $1,959,574 -0.5% $1,309,126 +5.7%
Aug-2019 $1,872,478 +3.3% $1,386,808 +2.9%
Sep-2019 $2,075,848 +14.1% $1,449,604 +15.4%
Oct-2019 $1,912,555 -11.1% $1,447,421 +7.8%
Nov-2019 $1,989,805 +6.7% $1,322,998 +4.7%
Dec-2019 $1,948,749 +9.1% $1,270,957 -4.4%
Jan-2020 $2,224,366 +27.0% $1,326,575 +12.7%
12-Month Avg* $2,034,988 +3.9% $1,361,822 +3.5%
Historical Average Sales Price by Month
Average sales price for all closed sales, not accounting for seller concessions, in a given month.
* Avg. Sales Price for all properties from February 2019 through January 2020. This is not the
average of the individual figures above.
Current as of February 11, 2020. All data from the San Francisco MLS. Report © 2020 ShowingTime. | 8
$1,787,311
$1,321,377
$1,751,963
$1,177,310
$2,224,366
$1,326,575
Single Family Condo/TIC/Coop
January
$500,000
$1,000,000
$1,500,000
$2,000,000
$2,500,000
1-2005 1-2006 1-2007 1-2008 1-2009 1-2010 1-2011 1-2012 1-2013 1-2014 1-2015 1-2016 1-2017 1-2018 1-2019 1-2020
Single Family Condo/TIC/Coop
$1,787,311
$1,321,377
$1,751,963
$1,177,310
$2,224,366
$1,326,575
Single Family Condo/TIC/Coop
Year to Date
2018 2019 2020
+ 12.7%- 10.9%+ 27.0%- 2.0% - 10.9%+ 27.0%- 2.0% + 12.7%
2018 2019 2020 2018 2019 2020 2018 2019 2020
+ 9.4% + 9.4% + 13.7%+ 13.7%
Days on Market Until Sale
Days on Market
Single
Family
Year-Over-Year
Change
Condo/TIC/
Coop
Year-Over-Year
Change
Feb-2019 29 +31.8% 40 +8.1%
Mar-2019 26 +18.2% 35 +34.6%
Apr-2019 26 +44.4% 38 +46.2%
May-2019 22 +10.0% 29 +7.4%
Jun-2019 22 +22.2% 31 +14.8%
Jul-2019 23 +9.5% 33 +6.5%
Aug-2019 25 +13.6% 33 -8.3%
Sep-2019 28 +16.7% 34 +13.3%
Oct-2019 22 -8.3% 28 +3.7%
Nov-2019 24 -7.7% 34 -10.5%
Dec-2019 31 -6.1% 47 +6.8%
Jan-2020 38 -2.6% 62 +12.7%
12-Month Avg* 25 +8.7% 36 +11.6%
Historical Days on Market Until Sale by Month
Average number of days between when a property is listed and when an offer is accepted in a given month.
* Days on Market for all properties from February 2019 through January 2020. This is not the
average of the individual figures above.
Current as of February 11, 2020. All data from the San Francisco MLS. Report © 2020 ShowingTime. | 9
33
55
39
55
38
62
Single Family Condo/TIC/Coop
January
0
20
40
60
80
100
120
1-2005 1-2006 1-2007 1-2008 1-2009 1-2010 1-2011 1-2012 1-2013 1-2014 1-2015 1-2016 1-2017 1-2018 1-2019 1-2020
Single Family Condo/TIC/Coop
33
55
39
55
38
62
Single Family Condo/TIC/Coop
Year to Date
2018 2019 2020
+ 12.7%0.0%- 2.6%+ 18.2% 0.0%- 2.6%+ 18.2% + 12.7%
2018 2019 2020 2018 2019 2020 2018 2019 2020
- 21.4% - 21.4% - 6.8%- 6.8%
Inventory of Active Listings
Active Listings
Single
Family
Year-Over-Year
Change
Condo/TIC/
Coop
Year-Over-Year
Change
Feb-2019 459 +30.8% 718 +9.3%
Mar-2019 467 +18.2% 714 +9.0%
Apr-2019 480 +11.1% 732 +4.0%
May-2019 471 +16.3% 724 0.0%
Jun-2019 489 +14.0% 704 -1.7%
Jul-2019 459 -0.4% 721 +9.7%
Aug-2019 506 +3.1% 742 +10.7%
Sep-2019 574 -3.0% 943 +10.9%
Oct-2019 515 -4.8% 895 +7.2%
Nov-2019 394 -14.9% 711 -0.4%
Dec-2019 261 -20.4% 485 -4.3%
Jan-2020 290 -35.0% 536 -22.1%
12-Month Avg* 447 +0.6% 719 +3.0%
Historical Inventory of Active Listings by Month
The number of properties available for sale in active status at the end of a given month.
* Active Listings for all properties from February 2019 through January 2020. This is not the
average of the individual figures above.
Current as of February 11, 2020. All data from the San Francisco MLS. Report © 2020 ShowingTime. | 10
318
580
446
688
290
536
Single Family Condo/TIC/Coop
January
0
250
500
750
1,000
1,250
1,500
1-2005 1-2006 1-2007 1-2008 1-2009 1-2010 1-2011 1-2012 1-2013 1-2014 1-2015 1-2016 1-2017 1-2018 1-2019 1-2020
Single Family Condo/TIC/Coop
2018 2019 2020
- 22.1%+ 18.6%- 35.0%+ 40.3%
2018 2019 2020
+ 0.6% + 7.6%
% of Properties Sold Over List Price
% of Properties
Sold Over List Price
Single
Family
Year-Over-Year
Change
Condo/TIC/
Coop
Year-Over-Year
Change
Feb-2019 77.9% -3.1% 53.0% -10.0%
Mar-2019 73.3% -4.8% 55.8% -5.7%
Apr-2019 73.9% -5.1% 55.2% -17.1%
May-2019 79.9% -5.7% 65.0% -3.8%
Jun-2019 81.1% -8.2% 64.5% -5.6%
Jul-2019 82.6% -3.3% 70.4% +11.6%
Aug-2019 82.1% +1.9% 58.9% +2.1%
Sep-2019 74.6% -7.9% 59.4% -6.3%
Oct-2019 80.8% -2.3% 65.3% -4.4%
Nov-2019 77.4% +5.2% 64.3% +18.0%
Dec-2019 66.3% -2.6% 48.3% +5.2%
Jan-2020 61.7% +2.8% 33.6% -18.4%
12-Month Avg 76.9% -3.3% 59.1% -3.3%
Historical % of Properties Sold Over List Price by Month
Percentage found when dividing the number of properties sold by properties sold over its original list price, not accounting for seller
concessions.
* % of Properties Sold Over List Price for all properties from February 2019 through January
2020. This is not the average of the individual figures above.
Current as of February 11, 2020. All data from the San Francisco MLS. Report © 2020 ShowingTime. | 11
70.5%
33.6%
60.0%
41.2%
61.7%
33.6%
Single Family Condo/TIC/Coop
January
0.0%
20.0%
40.0%
60.0%
80.0%
100.0%
1-2005 1-2006 1-2007 1-2008 1-2009 1-2010 1-2011 1-2012 1-2013 1-2014 1-2015 1-2016 1-2017 1-2018 1-2019 1-2020
Single Family Condo/TIC/Coop
70.5%
33.6%
60.0%
41.2%
61.7%
33.6%
Single Family Condo/TIC/Coop
Year to Date
2018 2019 2020
- 18.4%+ 22.6%+ 2.8%- 14.9% + 22.6%+ 2.8%- 14.9% - 18.4%
2018 2019 2020 2018 2019 2020 2018 2019 2020
+ 13.2% + 13.2% - 13.2%- 13.2%
% of List Price Received
% of List Price
Received
Single
Family
Year-Over-Year
Change
Condo/TIC/
Coop
Year-Over-Year
Change
Feb-2019 112.6% -2.8% 104.2% -0.9%
Mar-2019 110.5% -6.0% 104.7% -2.2%
Apr-2019 112.4% -5.8% 104.9% -3.7%
May-2019 113.2% -5.3% 107.4% -0.9%
Jun-2019 115.3% -4.0% 107.2% -0.1%
Jul-2019 115.4% -1.5% 107.6% +0.5%
Aug-2019 115.3% +0.4% 105.8% +0.2%
Sep-2019 112.7% -2.3% 105.2% -1.2%
Oct-2019 114.0% 0.0% 105.9% -1.7%
Nov-2019 111.8% +0.5% 105.1% +1.0%
Dec-2019 109.7% -0.7% 103.2% +1.1%
Jan-2020 107.2% +1.1% 100.4% -0.6%
12-Month Avg* 112.8% -2.4% 105.4% -0.9%
Historical % of List Price Received by Month
Percentage found when dividing a property’s sales price by its most recent list price, then taking the average for all properties sold in a given
month, not accounting for seller concessions.
* % of List Price Received for all properties from February 2019 through January 2020. This is not
the average of the individual figures above.
Current as of February 11, 2020. All data from the San Francisco MLS. Report © 2020 ShowingTime. | 12
112.3%
101.7%
106.0%
101.0%
107.2%
100.4%
Single Family Condo/TIC/Coop
January
112.3%
101.7%
106.0%
101.0%
107.2%
100.4%
Single Family Condo/TIC/Coop
Year to Date
90.0%
100.0%
110.0%
120.0%
130.0%
1-2005 1-2006 1-2007 1-2008 1-2009 1-2010 1-2011 1-2012 1-2013 1-2014 1-2015 1-2016 1-2017 1-2018 1-2019 1-2020
Single Family Condo/TIC/Coop
2018 2019 2020
- 0.6%- 0.7%+ 1.1%- 5.6%
2018 2019 2020
+ 4.4% + 0.3%
2018 2019 2020
- 0.6%- 0.7%+ 1.1%- 5.6%
2018 2019 2020
+ 4.4% + 0.3%
Housing Affordability Ratio
Affordability Ratio
Single
Family
Year-Over-Year
Change
Condo/TIC/
Coop
Year-Over-Year
Change
Feb-2019 33 +13.8% 51 -3.8%
Mar-2019 30 +3.4% 47 +2.2%
Apr-2019 31 +6.9% 48 +6.7%
May-2019 30 0.0% 47 +6.8%
Jun-2019 29 -3.3% 45 -6.3%
Jul-2019 33 +10.0% 49 0.0%
Aug-2019 34 +9.7% 49 +8.9%
Sep-2019 34 +9.7% 47 0.0%
Oct-2019 33 +17.9% 48 +17.1%
Nov-2019 33 +3.1% 52 +20.9%
Dec-2019 36 +9.1% 51 +6.3%
Jan-2020 37 +5.7% 53 -1.9%
12-Month Avg* 33 +20.9% 31 +12.9%
Historical Housing Affordability Ratio by Month
This index measures housing affordability for the region. For example, an index of 120 means the median household income is 120% of what is
necessary to qualify for the median-priced home under prevailing interest rates. A higher number means greater affordability.
* Affordability Ratio for all properties from February 2019 through January 2020. This is not the
average of the individual figures above.
Current as of February 11, 2020. All data from the San Francisco MLS. Report © 2020 ShowingTime. | 13
37
52
35
54
37
53
Single Family Condo/TIC/Coop
January
20
40
60
80
100
1-2005 1-2006 1-2007 1-2008 1-2009 1-2010 1-2011 1-2012 1-2013 1-2014 1-2015 1-2016 1-2017 1-2018 1-2019 1-2020
Single Family Condo/TIC/Coop
2018 2019 2020
- 1.9%+ 3.8%+ 5.7%- 5.4%
2018 2019 2020
- 5.1% - 7.1%
37
52
35
54
37
53
Single Family Condo/TIC/Coop
Year to Date
2018 2019 2020
- 1.9%+ 3.8%+ 5.7%- 5.4%
2018 2019 2020
- 5.1% - 7.1%
Months Supply of Inventory
Months Supply
Single
Family
Year-Over-Year
Change
Condo/TIC/
Coop
Year-Over-Year
Change
Feb-2019 2.5 +38.9% 2.9 +7.4%
Mar-2019 2.5 +19.0% 3.0 +15.4%
Apr-2019 2.6 +13.0% 3.0 +7.1%
May-2019 2.6 +23.8% 2.9 0.0%
Jun-2019 2.7 +17.4% 2.9 +3.6%
Jul-2019 2.5 +4.2% 3.0 +15.4%
Aug-2019 2.8 +7.7% 3.1 +19.2%
Sep-2019 3.1 -3.1% 4.0 +21.2%
Oct-2019 2.8 -3.4% 3.8 +15.2%
Nov-2019 2.2 -12.0% 3.0 +7.1%
Dec-2019 1.4 -22.2% 2.0 0.0%
Jan-2020 1.6 -33.3% 2.2 -21.4%
12-Month Avg* 2.4 +3.0% 3.0 +8.0%
Historical Months Supply of Inventory by Month
The inventory of homes for sale at the end of a given month, divided by the average monthly pending sales from the last 12 months.
* Months Supply for all properties from February 2019 through January 2020. This is not the
average of the individual figures above.
Current as of February 11, 2020. All data from the San Francisco MLS. Report © 2020 ShowingTime. | 14
1.7
2.42.4
2.8
1.6
2.2
Single Family Condo/TIC/Coop
January
0.0
2.0
4.0
6.0
8.0
10.0
1-2005 1-2006 1-2007 1-2008 1-2009 1-2010 1-2011 1-2012 1-2013 1-2014 1-2015 1-2016 1-2017 1-2018 1-2019 1-2020
Single Family Condo/TIC/Coop
2018 2019 2020
- 21.4%+ 16.7%- 33.3%+ 41.2%
2018 2019 2020
0.0% + 4.3%
All Properties Activity Overview
Key metrics by report month and for year-to-date (YTD) starting from the first of the year.
Key Metrics Historical Sparkbars 1-2019 1-2020 Percent Change YTD 2019 YTD 2020 Percent Change
Current as of February 11, 2020. All data from the San Francisco MLS. Report © 2020 ShowingTime. | 15
Months Supply 2.6 1.9 - 26.9% -- -- --
Affordability Ratio 39 38 - 2.6%
% of List Price Received 103.4% 103.1% - 0.3% 103.4%
39
44.6% - 10.8%
- 0.3%
38 - 2.6%
103.1%
% of Properties Sold Over List Price 50.0% 44.6% - 10.8% 50.0%
Active Listings 1,134 826 - 27.2% --
Avg. Sales Price $1,445,839 $1,678,210 + 16.1% $1,445,839
Days on Market 48 52 + 8.3% 48
$1,301,400 + 8.5%
+ 16.1%
52 + 8.3%
$1,678,210
-- --
Sold Listings 214 240 + 12.1% 214 240 + 12.1%
Median Sales Price $1,200,000 $1,301,400 + 8.5% $1,200,000
- 33.5%
Pending Sales 210 255 + 21.4% 210 255 + 21.4%
New Listings 582 387 - 33.5% 582 387
1-2017 1-2018 1-2019 1-2020
1-2017 1-2018 1-2019 1-2020
1-2017 1-2018 1-2019 1-2020
1-2017 1-2018 1-2019 1-2020
1-2017 1-2018 1-2019 1-2020
1-2017 1-2018 1-2019 1-2020
1-2017 1-2018 1-2019 1-2020
1-2017 1-2018 1-2019 1-2020
1-2017 1-2018 1-2019 1-2020
1-2017 1-2018 1-2019 1-2020
1-2017 1-2018 1-2019 1-2020
Activity by District
SF District 1: Northwest (Sea Cliff, Lake, Jordan Park / Laurel Heights, Outer Richmond, Central Richmond, Inner Richmond, Lone Mountain)
SF District 2: Central West (Outer Sunset, Central Sunset, Inner Sunset, Outer Parkside, Parkside, Inner Parkside, Golden Gate Heights)
SF District 3: Southwest (Pine Lake Park, Lake Shore, Merced Manor, Stonestown, Lakeside, Merced Heights, Ingleside, Ingleside Heights, Oceanview)
SF District 4: Twin Peaks W (Forest Hill (& Ext), W Portal, St Francis Wd, Balboa Terr, Mt Dav Manor, Ingleside Terr, Monterey Hts, Wstwd Pk & H'lnds, Shrwd Fst, Miraloma Pk, Dmnd Hts, Mdtwn Terr)
SF District 5: Central (Haight Ashbury, Cole Vly / Prnssus Hts, Clarndn Hts, Corona Hts, Twin Pks, Glen Pk, Noe Vly, Eureka Vly / Dolores Hts, Mission Dolores, Duboce Trngl, Buena Vista / Ashbury Hts)
SF District 6: Central North (Lower Pacific Heights, Anza Vista, Western Addition, North Panhandle, Alamo Square, Hayes Valley)
SF District 7: North (Marina, Cow Hollow, Presidio Heights, Pacific Heights)
SF District 8: Northeast (North Waterfront, North Beach, Russian Hill, Telegraph Hill, Nob Hill, Financial District / Barbary Coast, Downtown, Van Ness / Civic Center, Tenderloin)
SF District 9: Central East (Yerba Buena, South Beach, South of Market, Mission Bay, Inner Mission, Potrero Hill, Central Waterfront / Dogpatch, Bernal Heights)
SF District 10: Southeast (Outer Mission, Mission Terr, Excelsior, Portola, Bayview, Silver Terr, Hunters Pt, Candlestick Pt, Bayview Hts, Little Hollywood, Visitation Vly, Crocker Amazon)
1-2019 1-2020 + / – 1-2019 1-2020 + / – 1-2019 1-2020 + / – 1-2019 1-2020 + / – 1-2019 1-2020 + / –
Single Family
1 SF District 1 39 17 -56.4% 11 7 -36.4% $1,575,000 $1,670,000 +6.0% 40 32 -20.0% 2.4 1.1 -54.2%
2 SF District 2 55 23 -58.2% 18 20 +11.1% $1,374,000 $1,445,000 +5.2% 37 47 +27.0% 1.7 0.7 -58.8%
3 SF District 3 20 20 0.0% 6 7 +16.7% $951,500 $1,250,000 +31.4% 35 44 +25.7% 1.6 1.6 0.0%
4 SF District 4 59 18 -69.5% 10 9 -10.0% $1,750,000 $1,550,000 -11.4% 42 33 -21.4% 2.2 0.7 -68.2%
5 SF District 5 69 50 -27.5% 14 17 +21.4% $2,550,000 $3,000,000 +17.6% 33 32 -3.0% 2.5 1.8 -28.0%
6 SF District 6 15 11 -26.7% 3 1 -66.7% $1,800,000 $3,550,000 +97.2% 35 14 -60.0% 3.9 3.4 -12.8%
7 SF District 7 37 29 -21.6% 4 4 0.0% $4,972,500 $4,675,000 -6.0% 44 41 -6.8% 4.6 3.4 -26.1%
8 SF District 8 14 20 +42.9% 1 2 +100.0% $2,650,000 $14,975,000 +465.1% 147 72 -51.0% 5.7 8.9 +56.1%
9 SF District 9 61 46 -24.6% 10 5 -50.0% $1,312,500 $1,460,000 +11.2% 37 35 -5.4% 3.1 2.4 -22.6%
10 SF District 10 77 56 -27.3% 23 22 -4.3% $918,000 $990,308 +7.9% 41 34 -17.1% 2.1 1.5 -28.6%
Condo/TIC/Coop
1 SF District 1 36 29 -19.4% 4 12 +200.0% $1,187,500 $1,495,000 +25.9% 68 57 -16.2% 2.6 2.2 -15.4%
2 SF District 2 5 11 +120.0% 2 2 0.0% $957,500 $765,000 -20.1% 41 99 +141.5% 1.1 2.9 +163.6%
3 SF District 3 12 1 -91.7% 0 3 -- $0 $830,000 -- 0 87 -- 4.3 0.3 -93.0%
4 SF District 4 14 6 -57.1% 5 4 -20.0% $648,000 $732,500 +13.0% 84 93 +10.7% 2.7 1.0 -63.0%
5 SF District 5 80 59 -26.3% 15 21 +40.0% $1,235,000 $1,425,000 +15.4% 21 75 +257.1% 2.2 1.6 -27.3%
6 SF District 6 56 28 -50.0% 6 12 +100.0% $777,500 $1,187,500 +52.7% 109 46 -57.8% 2.5 1.2 -52.0%
7 SF District 7 68 44 -35.3% 14 19 +35.7% $1,190,000 $1,620,000 +36.1% 53 46 -13.2% 2.8 1.6 -42.9%
8 SF District 8 154 100 -35.1% 22 29 +31.8% $900,000 $1,140,000 +26.7% 73 63 -13.7% 3.9 2.5 -35.9%
9 SF District 9 237 234 -1.3% 41 44 +7.3% $989,818 $1,145,500 +15.7% 45 61 +35.6% 2.7 2.8 +3.7%
10 SF District 10 26 24 -7.7% 5 0 -100.0% $805,000 $0 -100.0% 70 0 -100.0% 4.2 4.6 +9.5%
Key metrics by report month for the districts of San Fransisco.
Current as of February 11, 2020. All data from the San Francisco MLS. Report © 2020 ShowingTime. | 16
Active Listings Sold Listings Median Sales Price Days on Market Months Supply

Mais conteúdo relacionado

Mais procurados

San Francisco market report May 2020
San Francisco market report May 2020San Francisco market report May 2020
San Francisco market report May 2020Ronny Budiutama
 
San Francisco Market Focus Report Nov 2020
San Francisco Market Focus Report Nov 2020San Francisco Market Focus Report Nov 2020
San Francisco Market Focus Report Nov 2020Ronny Budiutama
 
San Francisco Market Report for March 2020
San Francisco Market Report for March 2020San Francisco Market Report for March 2020
San Francisco Market Report for March 2020Ronny Budiutama
 
San Francisco Market Focus Report April 2019
San Francisco Market Focus Report April 2019San Francisco Market Focus Report April 2019
San Francisco Market Focus Report April 2019Ronny Budiutama
 
San Francisco Market Focus Report May 2019
San Francisco Market Focus Report May 2019San Francisco Market Focus Report May 2019
San Francisco Market Focus Report May 2019Ronny Budiutama
 
San Francisco Market Focus Report Feb 2020
San Francisco Market Focus Report Feb 2020San Francisco Market Focus Report Feb 2020
San Francisco Market Focus Report Feb 2020Ronny Budiutama
 
San Francisco Market Focus Report Jan 2019
San Francisco Market Focus Report Jan 2019San Francisco Market Focus Report Jan 2019
San Francisco Market Focus Report Jan 2019Ronny Budiutama
 
San Fancisco Market Focus Report June 2019
San Fancisco Market Focus Report June 2019San Fancisco Market Focus Report June 2019
San Fancisco Market Focus Report June 2019Ronny Budiutama
 
San Francisco market report April 2020
San Francisco market report April 2020San Francisco market report April 2020
San Francisco market report April 2020Ronny Budiutama
 
San Francisco Market Report August 2021
San Francisco Market Report August 2021San Francisco Market Report August 2021
San Francisco Market Report August 2021Ronny Budiutama
 
San Francisco Market Report May 2021
San Francisco Market Report May 2021San Francisco Market Report May 2021
San Francisco Market Report May 2021Ronny Budiutama
 
San Francisco Market Report For July 2021
San Francisco Market Report For July 2021San Francisco Market Report For July 2021
San Francisco Market Report For July 2021Ronny Budiutama
 
San Francisco Market Report April 2021
San Francisco Market Report April 2021San Francisco Market Report April 2021
San Francisco Market Report April 2021Ronny Budiutama
 
San Francisco Market Report June 2021
San Francisco Market Report June 2021San Francisco Market Report June 2021
San Francisco Market Report June 2021Ronny Budiutama
 
San Francisco market report July 2020
San Francisco market report July 2020San Francisco market report July 2020
San Francisco market report July 2020Ronny Budiutama
 
San Francisco Market Report September 2021
San Francisco Market Report September 2021San Francisco Market Report September 2021
San Francisco Market Report September 2021Ronny Budiutama
 
San Francisco Market Report January 2021
San Francisco Market Report January 2021San Francisco Market Report January 2021
San Francisco Market Report January 2021Ronny Budiutama
 
San Francisco Market Report February 2021
San Francisco Market Report February 2021San Francisco Market Report February 2021
San Francisco Market Report February 2021Ronny Budiutama
 
San Francisco Market Focus Report March 2019
San Francisco Market Focus Report March 2019San Francisco Market Focus Report March 2019
San Francisco Market Focus Report March 2019Ronny Budiutama
 
San Francisco Market Focus Report Feb 2019
San Francisco Market Focus Report Feb 2019San Francisco Market Focus Report Feb 2019
San Francisco Market Focus Report Feb 2019Ronny Budiutama
 

Mais procurados (20)

San Francisco market report May 2020
San Francisco market report May 2020San Francisco market report May 2020
San Francisco market report May 2020
 
San Francisco Market Focus Report Nov 2020
San Francisco Market Focus Report Nov 2020San Francisco Market Focus Report Nov 2020
San Francisco Market Focus Report Nov 2020
 
San Francisco Market Report for March 2020
San Francisco Market Report for March 2020San Francisco Market Report for March 2020
San Francisco Market Report for March 2020
 
San Francisco Market Focus Report April 2019
San Francisco Market Focus Report April 2019San Francisco Market Focus Report April 2019
San Francisco Market Focus Report April 2019
 
San Francisco Market Focus Report May 2019
San Francisco Market Focus Report May 2019San Francisco Market Focus Report May 2019
San Francisco Market Focus Report May 2019
 
San Francisco Market Focus Report Feb 2020
San Francisco Market Focus Report Feb 2020San Francisco Market Focus Report Feb 2020
San Francisco Market Focus Report Feb 2020
 
San Francisco Market Focus Report Jan 2019
San Francisco Market Focus Report Jan 2019San Francisco Market Focus Report Jan 2019
San Francisco Market Focus Report Jan 2019
 
San Fancisco Market Focus Report June 2019
San Fancisco Market Focus Report June 2019San Fancisco Market Focus Report June 2019
San Fancisco Market Focus Report June 2019
 
San Francisco market report April 2020
San Francisco market report April 2020San Francisco market report April 2020
San Francisco market report April 2020
 
San Francisco Market Report August 2021
San Francisco Market Report August 2021San Francisco Market Report August 2021
San Francisco Market Report August 2021
 
San Francisco Market Report May 2021
San Francisco Market Report May 2021San Francisco Market Report May 2021
San Francisco Market Report May 2021
 
San Francisco Market Report For July 2021
San Francisco Market Report For July 2021San Francisco Market Report For July 2021
San Francisco Market Report For July 2021
 
San Francisco Market Report April 2021
San Francisco Market Report April 2021San Francisco Market Report April 2021
San Francisco Market Report April 2021
 
San Francisco Market Report June 2021
San Francisco Market Report June 2021San Francisco Market Report June 2021
San Francisco Market Report June 2021
 
San Francisco market report July 2020
San Francisco market report July 2020San Francisco market report July 2020
San Francisco market report July 2020
 
San Francisco Market Report September 2021
San Francisco Market Report September 2021San Francisco Market Report September 2021
San Francisco Market Report September 2021
 
San Francisco Market Report January 2021
San Francisco Market Report January 2021San Francisco Market Report January 2021
San Francisco Market Report January 2021
 
San Francisco Market Report February 2021
San Francisco Market Report February 2021San Francisco Market Report February 2021
San Francisco Market Report February 2021
 
San Francisco Market Focus Report March 2019
San Francisco Market Focus Report March 2019San Francisco Market Focus Report March 2019
San Francisco Market Focus Report March 2019
 
San Francisco Market Focus Report Feb 2019
San Francisco Market Focus Report Feb 2019San Francisco Market Focus Report Feb 2019
San Francisco Market Focus Report Feb 2019
 

Semelhante a San Francisco Market Focus Report Jan 2020

San Francisco Market Focus Report July 2019
San Francisco Market Focus Report July 2019San Francisco Market Focus Report July 2019
San Francisco Market Focus Report July 2019Ronny Budiutama
 
San Francisco Market Report March 2022
San Francisco Market Report March 2022San Francisco Market Report March 2022
San Francisco Market Report March 2022Ronny Budiutama
 
San Francisco Market Focus April 2017
San Francisco Market Focus April 2017San Francisco Market Focus April 2017
San Francisco Market Focus April 2017Ronny Budiutama
 
San Francisco Market Focus May 2014
San Francisco Market Focus May 2014San Francisco Market Focus May 2014
San Francisco Market Focus May 2014Ronny Budiutama
 
San Francisco Market Focus October 2014
San Francisco Market Focus October 2014San Francisco Market Focus October 2014
San Francisco Market Focus October 2014Ronny Budiutama
 
San Francisco January 2024 Market Report
San Francisco January 2024 Market ReportSan Francisco January 2024 Market Report
San Francisco January 2024 Market ReportRonny Budiutama
 
San Francisco Real Estate Housing Market December 2016
San Francisco Real Estate Housing Market December 2016San Francisco Real Estate Housing Market December 2016
San Francisco Real Estate Housing Market December 2016Ronny Budiutama
 
San Francisco Market Report October 2022.pdf
San Francisco Market Report October 2022.pdfSan Francisco Market Report October 2022.pdf
San Francisco Market Report October 2022.pdfRonny Budiutama
 
San Francisco Market Focus May 2013
San Francisco Market Focus May 2013San Francisco Market Focus May 2013
San Francisco Market Focus May 2013Ronny Budiutama
 
San Francisco Market Focus Report August 2019
San Francisco Market Focus Report August 2019San Francisco Market Focus Report August 2019
San Francisco Market Focus Report August 2019Ronny Budiutama
 
San Francisco Market Focus Report May
San Francisco Market Focus Report MaySan Francisco Market Focus Report May
San Francisco Market Focus Report MayRonny Budiutama
 

Semelhante a San Francisco Market Focus Report Jan 2020 (11)

San Francisco Market Focus Report July 2019
San Francisco Market Focus Report July 2019San Francisco Market Focus Report July 2019
San Francisco Market Focus Report July 2019
 
San Francisco Market Report March 2022
San Francisco Market Report March 2022San Francisco Market Report March 2022
San Francisco Market Report March 2022
 
San Francisco Market Focus April 2017
San Francisco Market Focus April 2017San Francisco Market Focus April 2017
San Francisco Market Focus April 2017
 
San Francisco Market Focus May 2014
San Francisco Market Focus May 2014San Francisco Market Focus May 2014
San Francisco Market Focus May 2014
 
San Francisco Market Focus October 2014
San Francisco Market Focus October 2014San Francisco Market Focus October 2014
San Francisco Market Focus October 2014
 
San Francisco January 2024 Market Report
San Francisco January 2024 Market ReportSan Francisco January 2024 Market Report
San Francisco January 2024 Market Report
 
San Francisco Real Estate Housing Market December 2016
San Francisco Real Estate Housing Market December 2016San Francisco Real Estate Housing Market December 2016
San Francisco Real Estate Housing Market December 2016
 
San Francisco Market Report October 2022.pdf
San Francisco Market Report October 2022.pdfSan Francisco Market Report October 2022.pdf
San Francisco Market Report October 2022.pdf
 
San Francisco Market Focus May 2013
San Francisco Market Focus May 2013San Francisco Market Focus May 2013
San Francisco Market Focus May 2013
 
San Francisco Market Focus Report August 2019
San Francisco Market Focus Report August 2019San Francisco Market Focus Report August 2019
San Francisco Market Focus Report August 2019
 
San Francisco Market Focus Report May
San Francisco Market Focus Report MaySan Francisco Market Focus Report May
San Francisco Market Focus Report May
 

Mais de Ronny Budiutama

San Francisco Market Update -February 2024
San Francisco Market Update -February 2024San Francisco Market Update -February 2024
San Francisco Market Update -February 2024Ronny Budiutama
 
San Francisco Market Update - March 2024
San Francisco Market Update - March 2024San Francisco Market Update - March 2024
San Francisco Market Update - March 2024Ronny Budiutama
 
San Francisco December 2023 Market Report
San Francisco December 2023 Market ReportSan Francisco December 2023 Market Report
San Francisco December 2023 Market ReportRonny Budiutama
 
San Francisco November 2023 Market Report
San Francisco November 2023 Market ReportSan Francisco November 2023 Market Report
San Francisco November 2023 Market ReportRonny Budiutama
 
2023 Annual San Francisco Housing Market
2023 Annual San Francisco Housing Market2023 Annual San Francisco Housing Market
2023 Annual San Francisco Housing MarketRonny Budiutama
 
October 2023 Report: San Francisco Real Estate Market Insights
October 2023 Report: San Francisco Real Estate Market InsightsOctober 2023 Report: San Francisco Real Estate Market Insights
October 2023 Report: San Francisco Real Estate Market InsightsRonny Budiutama
 
CA Weekly MLS Market Data Report - August 2023
CA Weekly MLS Market Data Report - August 2023CA Weekly MLS Market Data Report - August 2023
CA Weekly MLS Market Data Report - August 2023Ronny Budiutama
 
San Francisco Market Report July 2023.pdf
San Francisco Market Report July 2023.pdfSan Francisco Market Report July 2023.pdf
San Francisco Market Report July 2023.pdfRonny Budiutama
 
San Francisco May 2023 Market Report.pdf
San Francisco May 2023 Market Report.pdfSan Francisco May 2023 Market Report.pdf
San Francisco May 2023 Market Report.pdfRonny Budiutama
 
San Francisco June 2023 Market Report.pdf
San Francisco June 2023 Market Report.pdfSan Francisco June 2023 Market Report.pdf
San Francisco June 2023 Market Report.pdfRonny Budiutama
 
San Francisco Market Report March 2023.pdf
San Francisco Market Report March 2023.pdfSan Francisco Market Report March 2023.pdf
San Francisco Market Report March 2023.pdfRonny Budiutama
 
San Francisco Market Report February 2023
San Francisco Market Report February 2023San Francisco Market Report February 2023
San Francisco Market Report February 2023Ronny Budiutama
 
San Francisco Market Report January 2023.pdf
San Francisco Market Report January 2023.pdfSan Francisco Market Report January 2023.pdf
San Francisco Market Report January 2023.pdfRonny Budiutama
 
Annual Report on the San Francisco County Housing Market.pdf
Annual Report on the San Francisco County Housing Market.pdfAnnual Report on the San Francisco County Housing Market.pdf
Annual Report on the San Francisco County Housing Market.pdfRonny Budiutama
 
San Francisco Market Report December 2022.pdf
San Francisco Market Report December 2022.pdfSan Francisco Market Report December 2022.pdf
San Francisco Market Report December 2022.pdfRonny Budiutama
 
San Francisco Market Report November 2022.pdf
San Francisco Market Report November 2022.pdfSan Francisco Market Report November 2022.pdf
San Francisco Market Report November 2022.pdfRonny Budiutama
 
San Francisco Market Report September 2022.pdf
San Francisco Market Report September 2022.pdfSan Francisco Market Report September 2022.pdf
San Francisco Market Report September 2022.pdfRonny Budiutama
 
San Francisco Market Report August 2022.pdf
San Francisco Market Report August 2022.pdfSan Francisco Market Report August 2022.pdf
San Francisco Market Report August 2022.pdfRonny Budiutama
 
San Francisco Market Report July 2022.pdf
San Francisco Market Report July 2022.pdfSan Francisco Market Report July 2022.pdf
San Francisco Market Report July 2022.pdfRonny Budiutama
 
San Francisco Market Report June 2022.pdf
San Francisco Market Report June 2022.pdfSan Francisco Market Report June 2022.pdf
San Francisco Market Report June 2022.pdfRonny Budiutama
 

Mais de Ronny Budiutama (20)

San Francisco Market Update -February 2024
San Francisco Market Update -February 2024San Francisco Market Update -February 2024
San Francisco Market Update -February 2024
 
San Francisco Market Update - March 2024
San Francisco Market Update - March 2024San Francisco Market Update - March 2024
San Francisco Market Update - March 2024
 
San Francisco December 2023 Market Report
San Francisco December 2023 Market ReportSan Francisco December 2023 Market Report
San Francisco December 2023 Market Report
 
San Francisco November 2023 Market Report
San Francisco November 2023 Market ReportSan Francisco November 2023 Market Report
San Francisco November 2023 Market Report
 
2023 Annual San Francisco Housing Market
2023 Annual San Francisco Housing Market2023 Annual San Francisco Housing Market
2023 Annual San Francisco Housing Market
 
October 2023 Report: San Francisco Real Estate Market Insights
October 2023 Report: San Francisco Real Estate Market InsightsOctober 2023 Report: San Francisco Real Estate Market Insights
October 2023 Report: San Francisco Real Estate Market Insights
 
CA Weekly MLS Market Data Report - August 2023
CA Weekly MLS Market Data Report - August 2023CA Weekly MLS Market Data Report - August 2023
CA Weekly MLS Market Data Report - August 2023
 
San Francisco Market Report July 2023.pdf
San Francisco Market Report July 2023.pdfSan Francisco Market Report July 2023.pdf
San Francisco Market Report July 2023.pdf
 
San Francisco May 2023 Market Report.pdf
San Francisco May 2023 Market Report.pdfSan Francisco May 2023 Market Report.pdf
San Francisco May 2023 Market Report.pdf
 
San Francisco June 2023 Market Report.pdf
San Francisco June 2023 Market Report.pdfSan Francisco June 2023 Market Report.pdf
San Francisco June 2023 Market Report.pdf
 
San Francisco Market Report March 2023.pdf
San Francisco Market Report March 2023.pdfSan Francisco Market Report March 2023.pdf
San Francisco Market Report March 2023.pdf
 
San Francisco Market Report February 2023
San Francisco Market Report February 2023San Francisco Market Report February 2023
San Francisco Market Report February 2023
 
San Francisco Market Report January 2023.pdf
San Francisco Market Report January 2023.pdfSan Francisco Market Report January 2023.pdf
San Francisco Market Report January 2023.pdf
 
Annual Report on the San Francisco County Housing Market.pdf
Annual Report on the San Francisco County Housing Market.pdfAnnual Report on the San Francisco County Housing Market.pdf
Annual Report on the San Francisco County Housing Market.pdf
 
San Francisco Market Report December 2022.pdf
San Francisco Market Report December 2022.pdfSan Francisco Market Report December 2022.pdf
San Francisco Market Report December 2022.pdf
 
San Francisco Market Report November 2022.pdf
San Francisco Market Report November 2022.pdfSan Francisco Market Report November 2022.pdf
San Francisco Market Report November 2022.pdf
 
San Francisco Market Report September 2022.pdf
San Francisco Market Report September 2022.pdfSan Francisco Market Report September 2022.pdf
San Francisco Market Report September 2022.pdf
 
San Francisco Market Report August 2022.pdf
San Francisco Market Report August 2022.pdfSan Francisco Market Report August 2022.pdf
San Francisco Market Report August 2022.pdf
 
San Francisco Market Report July 2022.pdf
San Francisco Market Report July 2022.pdfSan Francisco Market Report July 2022.pdf
San Francisco Market Report July 2022.pdf
 
San Francisco Market Report June 2022.pdf
San Francisco Market Report June 2022.pdfSan Francisco Market Report June 2022.pdf
San Francisco Market Report June 2022.pdf
 

Último

Low Rate ✨➥9711108085▻✨Call Girls In East Of Kailash (E.K) (Delhi)
Low Rate ✨➥9711108085▻✨Call Girls In East Of Kailash (E.K) (Delhi)Low Rate ✨➥9711108085▻✨Call Girls In East Of Kailash (E.K) (Delhi)
Low Rate ✨➥9711108085▻✨Call Girls In East Of Kailash (E.K) (Delhi)delhi24hrs1
 
Nyati Elite NIBM Road Pune E Brochure.pdf
Nyati Elite NIBM Road Pune E Brochure.pdfNyati Elite NIBM Road Pune E Brochure.pdf
Nyati Elite NIBM Road Pune E Brochure.pdfabbu831446
 
Call Girls In Sarai Rohilla ☎️8447779280{Sarai Rohilla Escort Service In Delh...
Call Girls In Sarai Rohilla ☎️8447779280{Sarai Rohilla Escort Service In Delh...Call Girls In Sarai Rohilla ☎️8447779280{Sarai Rohilla Escort Service In Delh...
Call Girls In Sarai Rohilla ☎️8447779280{Sarai Rohilla Escort Service In Delh...asmaqueen5
 
Escort—>Call GiRls In Mori Gate Delhi —>8447779280—Service Escorts In South D...
Escort—>Call GiRls In Mori Gate Delhi —>8447779280—Service Escorts In South D...Escort—>Call GiRls In Mori Gate Delhi —>8447779280—Service Escorts In South D...
Escort—>Call GiRls In Mori Gate Delhi —>8447779280—Service Escorts In South D...asmaqueen5
 
Call girls In Rana Pratap Bagh {Delhi ↫8447779280↬Escort Service (Delhi)
Call girls In Rana Pratap Bagh {Delhi ↫8447779280↬Escort Service (Delhi)Call girls In Rana Pratap Bagh {Delhi ↫8447779280↬Escort Service (Delhi)
Call girls In Rana Pratap Bagh {Delhi ↫8447779280↬Escort Service (Delhi)asmaqueen5
 
Kohinoor Teiko Hinjewadi Phase 2 Pune E-Brochure.pdf
Kohinoor Teiko Hinjewadi Phase 2 Pune  E-Brochure.pdfKohinoor Teiko Hinjewadi Phase 2 Pune  E-Brochure.pdf
Kohinoor Teiko Hinjewadi Phase 2 Pune E-Brochure.pdfManishSaxena95
 
Eldeco Dwarka Project In Delhi-brochure.pdf.pdf
Eldeco Dwarka Project In Delhi-brochure.pdf.pdfEldeco Dwarka Project In Delhi-brochure.pdf.pdf
Eldeco Dwarka Project In Delhi-brochure.pdf.pdfkratirudram
 
Cheap Rate ✨➥9711108085▻✨Call Girls In Connaught Place (Delhi)
Cheap Rate ✨➥9711108085▻✨Call Girls In Connaught Place (Delhi)Cheap Rate ✨➥9711108085▻✨Call Girls In Connaught Place (Delhi)
Cheap Rate ✨➥9711108085▻✨Call Girls In Connaught Place (Delhi)delhi24hrs1
 
Kalpataru Exquisite Wakad Pune E-Brochure.pdf
Kalpataru Exquisite Wakad Pune  E-Brochure.pdfKalpataru Exquisite Wakad Pune  E-Brochure.pdf
Kalpataru Exquisite Wakad Pune E-Brochure.pdfManishSaxena95
 
Low Rate Call girls in Sant Nagar{Delhi }8447779280} Service Escorts In South...
Low Rate Call girls in Sant Nagar{Delhi }8447779280} Service Escorts In South...Low Rate Call girls in Sant Nagar{Delhi }8447779280} Service Escorts In South...
Low Rate Call girls in Sant Nagar{Delhi }8447779280} Service Escorts In South...asmaqueen5
 
Low Rate ✨➥9582086666▻✨Call Girls In Gurgaon Sector 21 (Gurgaon)
Low Rate ✨➥9582086666▻✨Call Girls In Gurgaon Sector 21 (Gurgaon)Low Rate ✨➥9582086666▻✨Call Girls In Gurgaon Sector 21 (Gurgaon)
Low Rate ✨➥9582086666▻✨Call Girls In Gurgaon Sector 21 (Gurgaon)delhi24hrs1
 
Top tourism places in Dubai - Inch & Brick Realty
Top tourism places in Dubai - Inch & Brick RealtyTop tourism places in Dubai - Inch & Brick Realty
Top tourism places in Dubai - Inch & Brick Realtypunitranainchbrick02
 
Listing Turkey - 2024 - May Featured Portfolio
Listing Turkey - 2024 - May Featured PortfolioListing Turkey - 2024 - May Featured Portfolio
Listing Turkey - 2024 - May Featured PortfolioListing Turkey
 
Retail Space for Lease - 1221 W. Main St., Sun Prairie, WI
Retail Space for Lease - 1221 W. Main St., Sun Prairie, WIRetail Space for Lease - 1221 W. Main St., Sun Prairie, WI
Retail Space for Lease - 1221 W. Main St., Sun Prairie, WILee & Associates of Madison, WI
 
Bridge & Elliot Ladner Floor Plans May 2024.pdf
Bridge & Elliot Ladner Floor Plans May 2024.pdfBridge & Elliot Ladner Floor Plans May 2024.pdf
Bridge & Elliot Ladner Floor Plans May 2024.pdfVickyAulakh1
 
Best Interior Design Services in Haldwani
Best Interior Design Services in HaldwaniBest Interior Design Services in Haldwani
Best Interior Design Services in HaldwaniGeomatrix
 
Bptp The Amaario Launch Luxury Project Sector 37D Gurgaon Dwarka Expressway...
Bptp The Amaario Launch  Luxury Project  Sector 37D Gurgaon Dwarka Expressway...Bptp The Amaario Launch  Luxury Project  Sector 37D Gurgaon Dwarka Expressway...
Bptp The Amaario Launch Luxury Project Sector 37D Gurgaon Dwarka Expressway...ApartmentWala1
 
Rohan Harita Tathawade Pune Brochure.pdf
Rohan Harita Tathawade Pune Brochure.pdfRohan Harita Tathawade Pune Brochure.pdf
Rohan Harita Tathawade Pune Brochure.pdfabbu831446
 
Ganga Platinum Kharadi Pune brochure.pdf
Ganga Platinum Kharadi Pune brochure.pdfGanga Platinum Kharadi Pune brochure.pdf
Ganga Platinum Kharadi Pune brochure.pdfsabhyara24
 
BPTP THE AMAARIO Luxury Project Invest Like Royalty in Sector 37D Gurgaon Dwa...
BPTP THE AMAARIO Luxury Project Invest Like Royalty in Sector 37D Gurgaon Dwa...BPTP THE AMAARIO Luxury Project Invest Like Royalty in Sector 37D Gurgaon Dwa...
BPTP THE AMAARIO Luxury Project Invest Like Royalty in Sector 37D Gurgaon Dwa...ApartmentWala1
 

Último (20)

Low Rate ✨➥9711108085▻✨Call Girls In East Of Kailash (E.K) (Delhi)
Low Rate ✨➥9711108085▻✨Call Girls In East Of Kailash (E.K) (Delhi)Low Rate ✨➥9711108085▻✨Call Girls In East Of Kailash (E.K) (Delhi)
Low Rate ✨➥9711108085▻✨Call Girls In East Of Kailash (E.K) (Delhi)
 
Nyati Elite NIBM Road Pune E Brochure.pdf
Nyati Elite NIBM Road Pune E Brochure.pdfNyati Elite NIBM Road Pune E Brochure.pdf
Nyati Elite NIBM Road Pune E Brochure.pdf
 
Call Girls In Sarai Rohilla ☎️8447779280{Sarai Rohilla Escort Service In Delh...
Call Girls In Sarai Rohilla ☎️8447779280{Sarai Rohilla Escort Service In Delh...Call Girls In Sarai Rohilla ☎️8447779280{Sarai Rohilla Escort Service In Delh...
Call Girls In Sarai Rohilla ☎️8447779280{Sarai Rohilla Escort Service In Delh...
 
Escort—>Call GiRls In Mori Gate Delhi —>8447779280—Service Escorts In South D...
Escort—>Call GiRls In Mori Gate Delhi —>8447779280—Service Escorts In South D...Escort—>Call GiRls In Mori Gate Delhi —>8447779280—Service Escorts In South D...
Escort—>Call GiRls In Mori Gate Delhi —>8447779280—Service Escorts In South D...
 
Call girls In Rana Pratap Bagh {Delhi ↫8447779280↬Escort Service (Delhi)
Call girls In Rana Pratap Bagh {Delhi ↫8447779280↬Escort Service (Delhi)Call girls In Rana Pratap Bagh {Delhi ↫8447779280↬Escort Service (Delhi)
Call girls In Rana Pratap Bagh {Delhi ↫8447779280↬Escort Service (Delhi)
 
Kohinoor Teiko Hinjewadi Phase 2 Pune E-Brochure.pdf
Kohinoor Teiko Hinjewadi Phase 2 Pune  E-Brochure.pdfKohinoor Teiko Hinjewadi Phase 2 Pune  E-Brochure.pdf
Kohinoor Teiko Hinjewadi Phase 2 Pune E-Brochure.pdf
 
Eldeco Dwarka Project In Delhi-brochure.pdf.pdf
Eldeco Dwarka Project In Delhi-brochure.pdf.pdfEldeco Dwarka Project In Delhi-brochure.pdf.pdf
Eldeco Dwarka Project In Delhi-brochure.pdf.pdf
 
Cheap Rate ✨➥9711108085▻✨Call Girls In Connaught Place (Delhi)
Cheap Rate ✨➥9711108085▻✨Call Girls In Connaught Place (Delhi)Cheap Rate ✨➥9711108085▻✨Call Girls In Connaught Place (Delhi)
Cheap Rate ✨➥9711108085▻✨Call Girls In Connaught Place (Delhi)
 
Kalpataru Exquisite Wakad Pune E-Brochure.pdf
Kalpataru Exquisite Wakad Pune  E-Brochure.pdfKalpataru Exquisite Wakad Pune  E-Brochure.pdf
Kalpataru Exquisite Wakad Pune E-Brochure.pdf
 
Low Rate Call girls in Sant Nagar{Delhi }8447779280} Service Escorts In South...
Low Rate Call girls in Sant Nagar{Delhi }8447779280} Service Escorts In South...Low Rate Call girls in Sant Nagar{Delhi }8447779280} Service Escorts In South...
Low Rate Call girls in Sant Nagar{Delhi }8447779280} Service Escorts In South...
 
Low Rate ✨➥9582086666▻✨Call Girls In Gurgaon Sector 21 (Gurgaon)
Low Rate ✨➥9582086666▻✨Call Girls In Gurgaon Sector 21 (Gurgaon)Low Rate ✨➥9582086666▻✨Call Girls In Gurgaon Sector 21 (Gurgaon)
Low Rate ✨➥9582086666▻✨Call Girls In Gurgaon Sector 21 (Gurgaon)
 
Top tourism places in Dubai - Inch & Brick Realty
Top tourism places in Dubai - Inch & Brick RealtyTop tourism places in Dubai - Inch & Brick Realty
Top tourism places in Dubai - Inch & Brick Realty
 
Listing Turkey - 2024 - May Featured Portfolio
Listing Turkey - 2024 - May Featured PortfolioListing Turkey - 2024 - May Featured Portfolio
Listing Turkey - 2024 - May Featured Portfolio
 
Retail Space for Lease - 1221 W. Main St., Sun Prairie, WI
Retail Space for Lease - 1221 W. Main St., Sun Prairie, WIRetail Space for Lease - 1221 W. Main St., Sun Prairie, WI
Retail Space for Lease - 1221 W. Main St., Sun Prairie, WI
 
Bridge & Elliot Ladner Floor Plans May 2024.pdf
Bridge & Elliot Ladner Floor Plans May 2024.pdfBridge & Elliot Ladner Floor Plans May 2024.pdf
Bridge & Elliot Ladner Floor Plans May 2024.pdf
 
Best Interior Design Services in Haldwani
Best Interior Design Services in HaldwaniBest Interior Design Services in Haldwani
Best Interior Design Services in Haldwani
 
Bptp The Amaario Launch Luxury Project Sector 37D Gurgaon Dwarka Expressway...
Bptp The Amaario Launch  Luxury Project  Sector 37D Gurgaon Dwarka Expressway...Bptp The Amaario Launch  Luxury Project  Sector 37D Gurgaon Dwarka Expressway...
Bptp The Amaario Launch Luxury Project Sector 37D Gurgaon Dwarka Expressway...
 
Rohan Harita Tathawade Pune Brochure.pdf
Rohan Harita Tathawade Pune Brochure.pdfRohan Harita Tathawade Pune Brochure.pdf
Rohan Harita Tathawade Pune Brochure.pdf
 
Ganga Platinum Kharadi Pune brochure.pdf
Ganga Platinum Kharadi Pune brochure.pdfGanga Platinum Kharadi Pune brochure.pdf
Ganga Platinum Kharadi Pune brochure.pdf
 
BPTP THE AMAARIO Luxury Project Invest Like Royalty in Sector 37D Gurgaon Dwa...
BPTP THE AMAARIO Luxury Project Invest Like Royalty in Sector 37D Gurgaon Dwa...BPTP THE AMAARIO Luxury Project Invest Like Royalty in Sector 37D Gurgaon Dwa...
BPTP THE AMAARIO Luxury Project Invest Like Royalty in Sector 37D Gurgaon Dwa...
 

San Francisco Market Focus Report Jan 2020

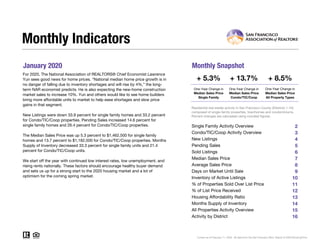
  • 1. January 2020 Monthly Snapshot One-Year Change in One-Year Change in Median Sales Price Single Family Median Sales Price Condo/TIC/Coop 2 3 4 5 6 7 8 9 10 11 12 13 14 15 16 Monthly Indicators + 5.3% + 13.7% + 8.5% One-Year Change in For 2020, The National Association of REALTORS® Chief Economist Lawrence Yun sees good news for home prices. “National median home price growth is in no danger of falling due to inventory shortages and will rise by 4%,” the long- term NAR economist predicts. He is also expecting the new-home construction market sales to increase 10%. Yun and others would like to see home builders bring more affordable units to market to help ease shortages and slow price gains in that segment. New Listings were down 33.9 percent for single family homes and 33.2 percent for Condo/TIC/Coop properties. Pending Sales increased 14.6 percent for single family homes and 26.4 percent for Condo/TIC/Coop properties. The Median Sales Price was up 5.3 percent to $1,462,500 for single family homes and 13.7 percent to $1,182,500 for Condo/TIC/Coop properties. Months Supply of Inventory decreased 33.3 percent for single family units and 21.4 percent for Condo/TIC/Coop units. We start off the year with continued low interest rates, low unemployment, and rising rents nationally. These factors should encourage healthy buyer demand and sets us up for a strong start to the 2020 housing market and a lot of optimism for the coming spring market. Median Sales Price All Property Types Residential real estate activity in San Francisco County (Districts 1-10) composed of single-family properties, townhomes and condominiums. Percent changes are calculated using rounded figures. Single Family Activity Overview Months Supply of Inventory Current as of February 11, 2020. All data from the San Francisco MLS. Report © 2020 ShowingTime. Condo/TIC/Coop Activity Overview Inventory of Active Listings % of Properties Sold Over List Price % of List Price Received Housing Affordability Ratio All Properties Activity Overview New Listings Pending Sales Sold Listings Median Sales Price Average Sales Price Days on Market Until Sale Activity by District
  • 2. Single Family Activity Overview Key metrics by report month and for year-to-date (YTD) starting from the first of the year. Key Metrics Historical Sparkbars 1-2019 1-2020 Percent Change YTD 2019 YTD 2020 Percent Change Current as of February 11, 2020. All data from the San Francisco MLS. Report © 2020 ShowingTime. | 2 Months Supply 2.4 1.6 - 33.3% -- -- -- Affordability Ratio 35 37 + 5.7% % of List Price Received 106.0% 107.2% + 1.1% 106.0% 35 61.7% + 2.8% + 1.1% 37 + 5.7% 107.2% % of Properties Sold Over List Price 60.0% 61.7% + 2.8% 60.0% Active Listings 446 290 - 35.0% -- Avg. Sales Price $1,751,963 $2,224,366 + 27.0% $1,751,963 Days on Market 39 38 - 2.6% 39 38 - 2.6% $2,224,366 -- -- Median Sales Price $1,389,000 $1,462,500 + 5.3% $1,389,000 Sold Listings 100 94 - 6.0% 100 New Listings 224 148 - 33.9% 224 Pending Sales 89 102 + 14.6% + 14.6%89 102 - 33.9%148 94 - 6.0% $1,462,500 + 5.3% + 27.0% 1-2017 1-2018 1-2019 1-2020 1-2017 1-2018 1-2019 1-2020 1-2017 1-2018 1-2019 1-2020 1-2017 1-2018 1-2019 1-2020 1-2017 1-2018 1-2019 1-2020 1-2017 1-2018 1-2019 1-2020 1-2017 1-2018 1-2019 1-2020 1-2017 1-2018 1-2019 1-2020 1-2017 1-2018 1-2019 1-2020 1-2017 1-2018 1-2019 1-2020 1-2017 1-2018 1-2019 1-2020
  • 3. Condo/TIC/Coop Activity Overview Key metrics by report month and for year-to-date (YTD) starting from the first of the year. Key Metrics Historical Sparkbars 1-2019 1-2020 Percent Change YTD 2019 YTD 2020 Percent Change Current as of February 11, 2020. All data from the San Francisco MLS. Report © 2020 ShowingTime. | 3 Months Supply 2.8 2.2 - 21.4% -- -- -- Affordability Ratio 54 53 - 1.9% % of List Price Received 101.0% 100.4% - 0.6% 101.0% 54 33.6% - 18.4% - 0.6% 53 - 1.9% 100.4% % of Properties Sold Over List Price 41.2% 33.6% - 18.4% 41.2% Active Listings 688 536 - 22.1% -- Avg. Sales Price $1,177,310 $1,326,575 + 12.7% $1,177,310 Days on Market 55 62 + 12.7% 55 $1,182,500 + 13.7% + 12.7% 62 + 12.7% $1,326,575 -- -- Sold Listings 114 146 + 28.1% 114 146 + 28.1% Median Sales Price $1,040,000 $1,182,500 + 13.7% $1,040,000 - 33.2% Pending Sales 121 153 + 26.4% 121 153 + 26.4% New Listings 358 239 - 33.2% 358 239 1-2017 1-2018 1-2019 1-2020 1-2017 1-2018 1-2019 1-2020 1-2017 1-2018 1-2019 1-2020 1-2017 1-2018 1-2019 1-2020 1-2017 1-2018 1-2019 1-2020 1-2017 1-2018 1-2019 1-2020 1-2017 1-2018 1-2019 1-2020 1-2017 1-2018 1-2019 1-2020 1-2017 1-2018 1-2019 1-2020 1-2017 1-2018 1-2019 1-2020 1-2017 1-2018 1-2019 1-2020
  • 4. New Listings New Listings Single Family Year-Over-Year Change Condo/TIC/ Coop Year-Over-Year Change Feb-2019 189 -9.1% 306 -14.3% Mar-2019 241 -13.3% 351 -7.4% Apr-2019 252 -7.0% 377 -0.3% May-2019 275 +1.5% 366 -1.1% Jun-2019 233 -12.1% 283 -20.9% Jul-2019 195 -18.4% 319 +22.2% Aug-2019 241 -3.6% 325 +4.5% Sep-2019 301 -10.9% 505 +11.2% Oct-2019 233 -9.7% 340 -0.3% Nov-2019 116 -27.0% 139 -29.1% Dec-2019 66 -19.5% 107 -12.3% Jan-2020 148 -33.9% 239 -33.2% 12-Month Avg 208 -12.4% 305 -5.9% Historical New Listings by Month Current as of February 11, 2020. All data from the San Francisco MLS. Report © 2020 ShowingTime. | 4 A count of the properties that have been newly listed on the market in a given month. 188 369 224 358 148 239 Single Family Condo/TIC/Coop January 0 100 200 300 400 500 600 700 1-2005 1-2006 1-2007 1-2008 1-2009 1-2010 1-2011 1-2012 1-2013 1-2014 1-2015 1-2016 1-2017 1-2018 1-2019 1-2020 Single Family Condo/TIC/Coop 188 369 224 358 148 239 Single Family Condo/TIC/Coop Year to Date 2018 2019 2020 - 33.2%- 3.0%- 33.9%+ 19.1% - 3.0%- 33.9%+ 19.1% - 33.2% 2018 2019 2020 2018 2019 2020 2018 2019 2020 + 5.6% + 5.6% + 12.2%+ 12.2%
  • 5. Pending Sales Pending Sales Single Family Year-Over-Year Change Condo/TIC/ Coop Year-Over-Year Change Feb-2019 144 -8.9% 228 +1.8% Mar-2019 210 -2.3% 299 -11.0% Apr-2019 222 +7.2% 313 +9.1% May-2019 248 -9.8% 336 +13.1% Jun-2019 194 -4.9% 245 -18.9% Jul-2019 183 +10.9% 206 -16.6% Aug-2019 151 -11.2% 211 -9.1% Sep-2019 195 +1.0% 229 +4.6% Oct-2019 247 -1.6% 303 +4.1% Nov-2019 191 +2.1% 234 +5.4% Dec-2019 117 -3.3% 154 +4.8% Jan-2020 102 +14.6% 153 +26.4% 12-Month Avg 184 -1.4% 243 -0.5% Historical Pending Sales by Month A count of the properties on which offers have been accepted in a given month. Current as of February 11, 2020. All data from the San Francisco MLS. Report © 2020 ShowingTime. | 5 87 180 89 121 102 153 Single Family Condo/TIC/Coop January 0 100 200 300 400 1-2005 1-2006 1-2007 1-2008 1-2009 1-2010 1-2011 1-2012 1-2013 1-2014 1-2015 1-2016 1-2017 1-2018 1-2019 1-2020 Single Family Condo/TIC/Coop 87 180 89 121 102 153 Single Family Condo/TIC/Coop Year to Date 2018 2019 2020 + 26.4%- 32.8%+ 14.6%+ 2.3% - 32.8%+ 14.6%+ 2.3% + 26.4% 2018 2019 2020 2018 2019 2020 2018 2019 2020 - 6.5% - 6.5% + 24.1%+ 24.1%
  • 6. Sold Listings Sold Listings Single Family Year-Over-Year Change Condo/TIC/ Coop Year-Over-Year Change Feb-2019 113 +5.6% 164 -18.8% Mar-2019 172 -14.0% 265 -8.3% Apr-2019 226 +18.9% 319 +7.8% May-2019 239 -4.0% 337 +8.0% Jun-2019 190 -17.7% 265 -12.5% Jul-2019 213 +10.9% 243 -11.3% Aug-2019 168 -12.0% 207 -20.4% Sep-2019 126 -14.3% 192 +4.9% Oct-2019 255 +2.8% 259 -11.6% Nov-2019 199 -9.5% 272 +3.0% Dec-2019 175 +9.4% 211 +8.8% Jan-2020 94 -6.0% 146 +28.1% 12-Month Avg 181 -2.9% 240 -3.5% Historical Sold Listings by Month A count of the actual sales that closed in a given month. Current as of February 11, 2020. All data from the San Francisco MLS. Report © 2020 ShowingTime. | 6 95 149 100 114 94 146 Single Family Condo/TIC/Coop January 0 100 200 300 400 1-2005 1-2006 1-2007 1-2008 1-2009 1-2010 1-2011 1-2012 1-2013 1-2014 1-2015 1-2016 1-2017 1-2018 1-2019 1-2020 Single Family Condo/TIC/Coop 95 149 100 114 94 146 Single Family Condo/TIC/Coop Year to Date 2018 2019 2020 + 28.1%- 23.5%- 6.0%+ 5.3% - 23.5%- 6.0%+ 5.3% + 28.1% 2018 2019 2020 2018 2019 2020 2018 2019 2020 - 10.4% - 10.4% - 0.7%- 0.7%
  • 7. Median Sales Price Median Sales Price Single Family Year-Over-Year Change Condo/TIC/ Coop Year-Over-Year Change Feb-2019 $1,500,000 -11.8% $1,130,000 +4.1% Mar-2019 $1,650,000 -2.2% $1,245,000 -0.4% Apr-2019 $1,612,500 -2.2% $1,225,000 -2.0% May-2019 $1,685,000 +4.1% $1,245,000 -1.0% Jun-2019 $1,750,000 +7.7% $1,299,000 +11.0% Jul-2019 $1,576,000 -3.1% $1,220,000 +6.1% Aug-2019 $1,602,500 +4.2% $1,281,250 +3.8% Sep-2019 $1,540,000 +2.7% $1,325,000 +15.2% Oct-2019 $1,650,000 +3.1% $1,325,000 +9.1% Nov-2019 $1,608,000 +12.6% $1,180,000 -1.1% Dec-2019 $1,450,000 -2.8% $1,200,000 +2.6% Jan-2020 $1,462,500 +5.3% $1,182,500 +13.7% 12-Month Avg* $1,600,000 +1.6% $1,246,750 +3.9% Historical Median Sales Price by Month Point at which half of the sales sold for more and half sold for less, not accounting for seller concessions, in a given month. * Median Sales Price for all properties from February 2019 through January 2020. This is not the average of the individual figures above. Current as of February 11, 2020. All data from the San Francisco MLS. Report © 2020 ShowingTime. | 7 $1,330,000 $1,100,000 $1,389,000 $1,040,000 $1,462,500 $1,182,500 Single Family Condo/TIC/Coop January $500,000 $750,000 $1,000,000 $1,250,000 $1,500,000 $1,750,000 $2,000,000 1-2005 1-2006 1-2007 1-2008 1-2009 1-2010 1-2011 1-2012 1-2013 1-2014 1-2015 1-2016 1-2017 1-2018 1-2019 1-2020 Single Family Condo/TIC/Coop $1,330,000 $1,100,000 $1,389,000 $1,040,000 $1,462,500 $1,182,500 Single Family Condo/TIC/Coop Year to Date 2018 2019 2020 + 13.7%- 5.5%+ 5.3%+ 4.4% - 5.5%+ 5.3%+ 4.4% + 13.7% 2018 2019 2020 2018 2019 2020 2018 2019 2020 + 6.4% + 6.4% + 10.0%+ 10.0%
  • 8. Average Sales Price Avg. Sales Price Single Family Year-Over-Year Change Condo/TIC/ Coop Year-Over-Year Change Feb-2019 $1,871,058 -11.2% $1,363,140 +7.8% Mar-2019 $2,046,399 +5.0% $1,335,673 -2.6% Apr-2019 $2,235,456 +2.3% $1,363,254 +2.1% May-2019 $2,141,318 +6.0% $1,335,560 -4.5% Jun-2019 $2,148,466 +10.6% $1,431,991 +7.1% Jul-2019 $1,959,574 -0.5% $1,309,126 +5.7% Aug-2019 $1,872,478 +3.3% $1,386,808 +2.9% Sep-2019 $2,075,848 +14.1% $1,449,604 +15.4% Oct-2019 $1,912,555 -11.1% $1,447,421 +7.8% Nov-2019 $1,989,805 +6.7% $1,322,998 +4.7% Dec-2019 $1,948,749 +9.1% $1,270,957 -4.4% Jan-2020 $2,224,366 +27.0% $1,326,575 +12.7% 12-Month Avg* $2,034,988 +3.9% $1,361,822 +3.5% Historical Average Sales Price by Month Average sales price for all closed sales, not accounting for seller concessions, in a given month. * Avg. Sales Price for all properties from February 2019 through January 2020. This is not the average of the individual figures above. Current as of February 11, 2020. All data from the San Francisco MLS. Report © 2020 ShowingTime. | 8 $1,787,311 $1,321,377 $1,751,963 $1,177,310 $2,224,366 $1,326,575 Single Family Condo/TIC/Coop January $500,000 $1,000,000 $1,500,000 $2,000,000 $2,500,000 1-2005 1-2006 1-2007 1-2008 1-2009 1-2010 1-2011 1-2012 1-2013 1-2014 1-2015 1-2016 1-2017 1-2018 1-2019 1-2020 Single Family Condo/TIC/Coop $1,787,311 $1,321,377 $1,751,963 $1,177,310 $2,224,366 $1,326,575 Single Family Condo/TIC/Coop Year to Date 2018 2019 2020 + 12.7%- 10.9%+ 27.0%- 2.0% - 10.9%+ 27.0%- 2.0% + 12.7% 2018 2019 2020 2018 2019 2020 2018 2019 2020 + 9.4% + 9.4% + 13.7%+ 13.7%
  • 9. Days on Market Until Sale Days on Market Single Family Year-Over-Year Change Condo/TIC/ Coop Year-Over-Year Change Feb-2019 29 +31.8% 40 +8.1% Mar-2019 26 +18.2% 35 +34.6% Apr-2019 26 +44.4% 38 +46.2% May-2019 22 +10.0% 29 +7.4% Jun-2019 22 +22.2% 31 +14.8% Jul-2019 23 +9.5% 33 +6.5% Aug-2019 25 +13.6% 33 -8.3% Sep-2019 28 +16.7% 34 +13.3% Oct-2019 22 -8.3% 28 +3.7% Nov-2019 24 -7.7% 34 -10.5% Dec-2019 31 -6.1% 47 +6.8% Jan-2020 38 -2.6% 62 +12.7% 12-Month Avg* 25 +8.7% 36 +11.6% Historical Days on Market Until Sale by Month Average number of days between when a property is listed and when an offer is accepted in a given month. * Days on Market for all properties from February 2019 through January 2020. This is not the average of the individual figures above. Current as of February 11, 2020. All data from the San Francisco MLS. Report © 2020 ShowingTime. | 9 33 55 39 55 38 62 Single Family Condo/TIC/Coop January 0 20 40 60 80 100 120 1-2005 1-2006 1-2007 1-2008 1-2009 1-2010 1-2011 1-2012 1-2013 1-2014 1-2015 1-2016 1-2017 1-2018 1-2019 1-2020 Single Family Condo/TIC/Coop 33 55 39 55 38 62 Single Family Condo/TIC/Coop Year to Date 2018 2019 2020 + 12.7%0.0%- 2.6%+ 18.2% 0.0%- 2.6%+ 18.2% + 12.7% 2018 2019 2020 2018 2019 2020 2018 2019 2020 - 21.4% - 21.4% - 6.8%- 6.8%
  • 10. Inventory of Active Listings Active Listings Single Family Year-Over-Year Change Condo/TIC/ Coop Year-Over-Year Change Feb-2019 459 +30.8% 718 +9.3% Mar-2019 467 +18.2% 714 +9.0% Apr-2019 480 +11.1% 732 +4.0% May-2019 471 +16.3% 724 0.0% Jun-2019 489 +14.0% 704 -1.7% Jul-2019 459 -0.4% 721 +9.7% Aug-2019 506 +3.1% 742 +10.7% Sep-2019 574 -3.0% 943 +10.9% Oct-2019 515 -4.8% 895 +7.2% Nov-2019 394 -14.9% 711 -0.4% Dec-2019 261 -20.4% 485 -4.3% Jan-2020 290 -35.0% 536 -22.1% 12-Month Avg* 447 +0.6% 719 +3.0% Historical Inventory of Active Listings by Month The number of properties available for sale in active status at the end of a given month. * Active Listings for all properties from February 2019 through January 2020. This is not the average of the individual figures above. Current as of February 11, 2020. All data from the San Francisco MLS. Report © 2020 ShowingTime. | 10 318 580 446 688 290 536 Single Family Condo/TIC/Coop January 0 250 500 750 1,000 1,250 1,500 1-2005 1-2006 1-2007 1-2008 1-2009 1-2010 1-2011 1-2012 1-2013 1-2014 1-2015 1-2016 1-2017 1-2018 1-2019 1-2020 Single Family Condo/TIC/Coop 2018 2019 2020 - 22.1%+ 18.6%- 35.0%+ 40.3% 2018 2019 2020 + 0.6% + 7.6%
  • 11. % of Properties Sold Over List Price % of Properties Sold Over List Price Single Family Year-Over-Year Change Condo/TIC/ Coop Year-Over-Year Change Feb-2019 77.9% -3.1% 53.0% -10.0% Mar-2019 73.3% -4.8% 55.8% -5.7% Apr-2019 73.9% -5.1% 55.2% -17.1% May-2019 79.9% -5.7% 65.0% -3.8% Jun-2019 81.1% -8.2% 64.5% -5.6% Jul-2019 82.6% -3.3% 70.4% +11.6% Aug-2019 82.1% +1.9% 58.9% +2.1% Sep-2019 74.6% -7.9% 59.4% -6.3% Oct-2019 80.8% -2.3% 65.3% -4.4% Nov-2019 77.4% +5.2% 64.3% +18.0% Dec-2019 66.3% -2.6% 48.3% +5.2% Jan-2020 61.7% +2.8% 33.6% -18.4% 12-Month Avg 76.9% -3.3% 59.1% -3.3% Historical % of Properties Sold Over List Price by Month Percentage found when dividing the number of properties sold by properties sold over its original list price, not accounting for seller concessions. * % of Properties Sold Over List Price for all properties from February 2019 through January 2020. This is not the average of the individual figures above. Current as of February 11, 2020. All data from the San Francisco MLS. Report © 2020 ShowingTime. | 11 70.5% 33.6% 60.0% 41.2% 61.7% 33.6% Single Family Condo/TIC/Coop January 0.0% 20.0% 40.0% 60.0% 80.0% 100.0% 1-2005 1-2006 1-2007 1-2008 1-2009 1-2010 1-2011 1-2012 1-2013 1-2014 1-2015 1-2016 1-2017 1-2018 1-2019 1-2020 Single Family Condo/TIC/Coop 70.5% 33.6% 60.0% 41.2% 61.7% 33.6% Single Family Condo/TIC/Coop Year to Date 2018 2019 2020 - 18.4%+ 22.6%+ 2.8%- 14.9% + 22.6%+ 2.8%- 14.9% - 18.4% 2018 2019 2020 2018 2019 2020 2018 2019 2020 + 13.2% + 13.2% - 13.2%- 13.2%
  • 12. % of List Price Received % of List Price Received Single Family Year-Over-Year Change Condo/TIC/ Coop Year-Over-Year Change Feb-2019 112.6% -2.8% 104.2% -0.9% Mar-2019 110.5% -6.0% 104.7% -2.2% Apr-2019 112.4% -5.8% 104.9% -3.7% May-2019 113.2% -5.3% 107.4% -0.9% Jun-2019 115.3% -4.0% 107.2% -0.1% Jul-2019 115.4% -1.5% 107.6% +0.5% Aug-2019 115.3% +0.4% 105.8% +0.2% Sep-2019 112.7% -2.3% 105.2% -1.2% Oct-2019 114.0% 0.0% 105.9% -1.7% Nov-2019 111.8% +0.5% 105.1% +1.0% Dec-2019 109.7% -0.7% 103.2% +1.1% Jan-2020 107.2% +1.1% 100.4% -0.6% 12-Month Avg* 112.8% -2.4% 105.4% -0.9% Historical % of List Price Received by Month Percentage found when dividing a property’s sales price by its most recent list price, then taking the average for all properties sold in a given month, not accounting for seller concessions. * % of List Price Received for all properties from February 2019 through January 2020. This is not the average of the individual figures above. Current as of February 11, 2020. All data from the San Francisco MLS. Report © 2020 ShowingTime. | 12 112.3% 101.7% 106.0% 101.0% 107.2% 100.4% Single Family Condo/TIC/Coop January 112.3% 101.7% 106.0% 101.0% 107.2% 100.4% Single Family Condo/TIC/Coop Year to Date 90.0% 100.0% 110.0% 120.0% 130.0% 1-2005 1-2006 1-2007 1-2008 1-2009 1-2010 1-2011 1-2012 1-2013 1-2014 1-2015 1-2016 1-2017 1-2018 1-2019 1-2020 Single Family Condo/TIC/Coop 2018 2019 2020 - 0.6%- 0.7%+ 1.1%- 5.6% 2018 2019 2020 + 4.4% + 0.3% 2018 2019 2020 - 0.6%- 0.7%+ 1.1%- 5.6% 2018 2019 2020 + 4.4% + 0.3%
  • 13. Housing Affordability Ratio Affordability Ratio Single Family Year-Over-Year Change Condo/TIC/ Coop Year-Over-Year Change Feb-2019 33 +13.8% 51 -3.8% Mar-2019 30 +3.4% 47 +2.2% Apr-2019 31 +6.9% 48 +6.7% May-2019 30 0.0% 47 +6.8% Jun-2019 29 -3.3% 45 -6.3% Jul-2019 33 +10.0% 49 0.0% Aug-2019 34 +9.7% 49 +8.9% Sep-2019 34 +9.7% 47 0.0% Oct-2019 33 +17.9% 48 +17.1% Nov-2019 33 +3.1% 52 +20.9% Dec-2019 36 +9.1% 51 +6.3% Jan-2020 37 +5.7% 53 -1.9% 12-Month Avg* 33 +20.9% 31 +12.9% Historical Housing Affordability Ratio by Month This index measures housing affordability for the region. For example, an index of 120 means the median household income is 120% of what is necessary to qualify for the median-priced home under prevailing interest rates. A higher number means greater affordability. * Affordability Ratio for all properties from February 2019 through January 2020. This is not the average of the individual figures above. Current as of February 11, 2020. All data from the San Francisco MLS. Report © 2020 ShowingTime. | 13 37 52 35 54 37 53 Single Family Condo/TIC/Coop January 20 40 60 80 100 1-2005 1-2006 1-2007 1-2008 1-2009 1-2010 1-2011 1-2012 1-2013 1-2014 1-2015 1-2016 1-2017 1-2018 1-2019 1-2020 Single Family Condo/TIC/Coop 2018 2019 2020 - 1.9%+ 3.8%+ 5.7%- 5.4% 2018 2019 2020 - 5.1% - 7.1% 37 52 35 54 37 53 Single Family Condo/TIC/Coop Year to Date 2018 2019 2020 - 1.9%+ 3.8%+ 5.7%- 5.4% 2018 2019 2020 - 5.1% - 7.1%
  • 14. Months Supply of Inventory Months Supply Single Family Year-Over-Year Change Condo/TIC/ Coop Year-Over-Year Change Feb-2019 2.5 +38.9% 2.9 +7.4% Mar-2019 2.5 +19.0% 3.0 +15.4% Apr-2019 2.6 +13.0% 3.0 +7.1% May-2019 2.6 +23.8% 2.9 0.0% Jun-2019 2.7 +17.4% 2.9 +3.6% Jul-2019 2.5 +4.2% 3.0 +15.4% Aug-2019 2.8 +7.7% 3.1 +19.2% Sep-2019 3.1 -3.1% 4.0 +21.2% Oct-2019 2.8 -3.4% 3.8 +15.2% Nov-2019 2.2 -12.0% 3.0 +7.1% Dec-2019 1.4 -22.2% 2.0 0.0% Jan-2020 1.6 -33.3% 2.2 -21.4% 12-Month Avg* 2.4 +3.0% 3.0 +8.0% Historical Months Supply of Inventory by Month The inventory of homes for sale at the end of a given month, divided by the average monthly pending sales from the last 12 months. * Months Supply for all properties from February 2019 through January 2020. This is not the average of the individual figures above. Current as of February 11, 2020. All data from the San Francisco MLS. Report © 2020 ShowingTime. | 14 1.7 2.42.4 2.8 1.6 2.2 Single Family Condo/TIC/Coop January 0.0 2.0 4.0 6.0 8.0 10.0 1-2005 1-2006 1-2007 1-2008 1-2009 1-2010 1-2011 1-2012 1-2013 1-2014 1-2015 1-2016 1-2017 1-2018 1-2019 1-2020 Single Family Condo/TIC/Coop 2018 2019 2020 - 21.4%+ 16.7%- 33.3%+ 41.2% 2018 2019 2020 0.0% + 4.3%
  • 15. All Properties Activity Overview Key metrics by report month and for year-to-date (YTD) starting from the first of the year. Key Metrics Historical Sparkbars 1-2019 1-2020 Percent Change YTD 2019 YTD 2020 Percent Change Current as of February 11, 2020. All data from the San Francisco MLS. Report © 2020 ShowingTime. | 15 Months Supply 2.6 1.9 - 26.9% -- -- -- Affordability Ratio 39 38 - 2.6% % of List Price Received 103.4% 103.1% - 0.3% 103.4% 39 44.6% - 10.8% - 0.3% 38 - 2.6% 103.1% % of Properties Sold Over List Price 50.0% 44.6% - 10.8% 50.0% Active Listings 1,134 826 - 27.2% -- Avg. Sales Price $1,445,839 $1,678,210 + 16.1% $1,445,839 Days on Market 48 52 + 8.3% 48 $1,301,400 + 8.5% + 16.1% 52 + 8.3% $1,678,210 -- -- Sold Listings 214 240 + 12.1% 214 240 + 12.1% Median Sales Price $1,200,000 $1,301,400 + 8.5% $1,200,000 - 33.5% Pending Sales 210 255 + 21.4% 210 255 + 21.4% New Listings 582 387 - 33.5% 582 387 1-2017 1-2018 1-2019 1-2020 1-2017 1-2018 1-2019 1-2020 1-2017 1-2018 1-2019 1-2020 1-2017 1-2018 1-2019 1-2020 1-2017 1-2018 1-2019 1-2020 1-2017 1-2018 1-2019 1-2020 1-2017 1-2018 1-2019 1-2020 1-2017 1-2018 1-2019 1-2020 1-2017 1-2018 1-2019 1-2020 1-2017 1-2018 1-2019 1-2020 1-2017 1-2018 1-2019 1-2020
  • 16. Activity by District SF District 1: Northwest (Sea Cliff, Lake, Jordan Park / Laurel Heights, Outer Richmond, Central Richmond, Inner Richmond, Lone Mountain) SF District 2: Central West (Outer Sunset, Central Sunset, Inner Sunset, Outer Parkside, Parkside, Inner Parkside, Golden Gate Heights) SF District 3: Southwest (Pine Lake Park, Lake Shore, Merced Manor, Stonestown, Lakeside, Merced Heights, Ingleside, Ingleside Heights, Oceanview) SF District 4: Twin Peaks W (Forest Hill (& Ext), W Portal, St Francis Wd, Balboa Terr, Mt Dav Manor, Ingleside Terr, Monterey Hts, Wstwd Pk & H'lnds, Shrwd Fst, Miraloma Pk, Dmnd Hts, Mdtwn Terr) SF District 5: Central (Haight Ashbury, Cole Vly / Prnssus Hts, Clarndn Hts, Corona Hts, Twin Pks, Glen Pk, Noe Vly, Eureka Vly / Dolores Hts, Mission Dolores, Duboce Trngl, Buena Vista / Ashbury Hts) SF District 6: Central North (Lower Pacific Heights, Anza Vista, Western Addition, North Panhandle, Alamo Square, Hayes Valley) SF District 7: North (Marina, Cow Hollow, Presidio Heights, Pacific Heights) SF District 8: Northeast (North Waterfront, North Beach, Russian Hill, Telegraph Hill, Nob Hill, Financial District / Barbary Coast, Downtown, Van Ness / Civic Center, Tenderloin) SF District 9: Central East (Yerba Buena, South Beach, South of Market, Mission Bay, Inner Mission, Potrero Hill, Central Waterfront / Dogpatch, Bernal Heights) SF District 10: Southeast (Outer Mission, Mission Terr, Excelsior, Portola, Bayview, Silver Terr, Hunters Pt, Candlestick Pt, Bayview Hts, Little Hollywood, Visitation Vly, Crocker Amazon) 1-2019 1-2020 + / – 1-2019 1-2020 + / – 1-2019 1-2020 + / – 1-2019 1-2020 + / – 1-2019 1-2020 + / – Single Family 1 SF District 1 39 17 -56.4% 11 7 -36.4% $1,575,000 $1,670,000 +6.0% 40 32 -20.0% 2.4 1.1 -54.2% 2 SF District 2 55 23 -58.2% 18 20 +11.1% $1,374,000 $1,445,000 +5.2% 37 47 +27.0% 1.7 0.7 -58.8% 3 SF District 3 20 20 0.0% 6 7 +16.7% $951,500 $1,250,000 +31.4% 35 44 +25.7% 1.6 1.6 0.0% 4 SF District 4 59 18 -69.5% 10 9 -10.0% $1,750,000 $1,550,000 -11.4% 42 33 -21.4% 2.2 0.7 -68.2% 5 SF District 5 69 50 -27.5% 14 17 +21.4% $2,550,000 $3,000,000 +17.6% 33 32 -3.0% 2.5 1.8 -28.0% 6 SF District 6 15 11 -26.7% 3 1 -66.7% $1,800,000 $3,550,000 +97.2% 35 14 -60.0% 3.9 3.4 -12.8% 7 SF District 7 37 29 -21.6% 4 4 0.0% $4,972,500 $4,675,000 -6.0% 44 41 -6.8% 4.6 3.4 -26.1% 8 SF District 8 14 20 +42.9% 1 2 +100.0% $2,650,000 $14,975,000 +465.1% 147 72 -51.0% 5.7 8.9 +56.1% 9 SF District 9 61 46 -24.6% 10 5 -50.0% $1,312,500 $1,460,000 +11.2% 37 35 -5.4% 3.1 2.4 -22.6% 10 SF District 10 77 56 -27.3% 23 22 -4.3% $918,000 $990,308 +7.9% 41 34 -17.1% 2.1 1.5 -28.6% Condo/TIC/Coop 1 SF District 1 36 29 -19.4% 4 12 +200.0% $1,187,500 $1,495,000 +25.9% 68 57 -16.2% 2.6 2.2 -15.4% 2 SF District 2 5 11 +120.0% 2 2 0.0% $957,500 $765,000 -20.1% 41 99 +141.5% 1.1 2.9 +163.6% 3 SF District 3 12 1 -91.7% 0 3 -- $0 $830,000 -- 0 87 -- 4.3 0.3 -93.0% 4 SF District 4 14 6 -57.1% 5 4 -20.0% $648,000 $732,500 +13.0% 84 93 +10.7% 2.7 1.0 -63.0% 5 SF District 5 80 59 -26.3% 15 21 +40.0% $1,235,000 $1,425,000 +15.4% 21 75 +257.1% 2.2 1.6 -27.3% 6 SF District 6 56 28 -50.0% 6 12 +100.0% $777,500 $1,187,500 +52.7% 109 46 -57.8% 2.5 1.2 -52.0% 7 SF District 7 68 44 -35.3% 14 19 +35.7% $1,190,000 $1,620,000 +36.1% 53 46 -13.2% 2.8 1.6 -42.9% 8 SF District 8 154 100 -35.1% 22 29 +31.8% $900,000 $1,140,000 +26.7% 73 63 -13.7% 3.9 2.5 -35.9% 9 SF District 9 237 234 -1.3% 41 44 +7.3% $989,818 $1,145,500 +15.7% 45 61 +35.6% 2.7 2.8 +3.7% 10 SF District 10 26 24 -7.7% 5 0 -100.0% $805,000 $0 -100.0% 70 0 -100.0% 4.2 4.6 +9.5% Key metrics by report month for the districts of San Fransisco. Current as of February 11, 2020. All data from the San Francisco MLS. Report © 2020 ShowingTime. | 16 Active Listings Sold Listings Median Sales Price Days on Market Months Supply