SlideShare uma empresa Scribd logo
1 de 8
Baixar para ler offline
Research
Development of a WHO growth reference for school-aged
children and adolescents
Mercedes de Onis,a Adelheid W Onyango,a Elaine Borghi,a Amani Siyam,a Chizuru Nishida a & Jonathan Siekmann a


    Objective To construct growth curves for school-aged children and adolescents that accord with the WHO Child Growth Standards
    for preschool children and the body mass index (BMI) cut-offs for adults.
    Methods Data from the 1977 National Center for Health Statistics (NCHS)/WHO growth reference (1–24 years) were merged
    with data from the under-fives growth standards’ cross-sectional sample (18–71 months) to smooth the transition between the
    two samples. State-of-the-art statistical methods used to construct the WHO Child Growth Standards (0–5 years), i.e. the Box-Cox
    power exponential (BCPE) method with appropriate diagnostic tools for the selection of best models, were applied to this combined
    sample.
    Findings The merged data sets resulted in a smooth transition at 5 years for height-for-age, weight-for-age and BMI-for-age.
    For BMI-for-age across all centiles the magnitude of the difference between the two curves at age 5 years is mostly 0.0 kg/m² to
    0.1 kg/m². At 19 years, the new BMI values at +1 standard deviation (SD) are 25.4 kg/m² for boys and 25.0 kg/m² for girls. These
    values are equivalent to the overweight cut-off for adults (> 25.0 kg/m²). Similarly, the +2 SD value (29.7 kg/m² for both sexes)
    compares closely with the cut-off for obesity (> 30.0 kg/m²).
    Conclusion The new curves are closely aligned with the WHO Child Growth Standards at 5 years, and the recommended adult
    cut-offs for overweight and obesity at 19 years. They fill the gap in growth curves and provide an appropriate reference for the 5
    to 19 years age group.

    Bulletin of the World Health Organization 2007;85:660–667.


Une traduction en français de ce résumé figure à la fin de l’article. Al final del artículo se facilita una traducción al español. .‫الرتجمة العربية لهذه الخالصة يف نهاية النص الكامل لهذه املقالة‬


Introduction                                                      upward skewness leading to an underes-                             national growth reference for school-
                                                                  timation of overweight and obesity, and                            aged children and adolescents.7,8 The
The need to develop an appropriate sin-
                                                                  an overestimation of undernutrition.3                              experts agreed that appropriate growth
gle growth reference for the screening,
                                                                       The reference previously recom-                               references for these age groups should
surveillance and monitoring of school-
                                                                  mended by WHO for children above 5                                 be developed for clinical and public
aged children and adolescents has been
                                                                  years of age, i.e. the National Center for                         health applications. They also agreed
stirred by two contemporary events: the                           Health Statistics (NCHS)/WHO inter-                                that a multicentre study, similar to the
increasing public health concern over                             national growth reference,4 has several                            one that led to the development of the
childhood obesity 1 and the April 2006                            drawbacks.5 In particular, the body mass                           WHO Child Growth Standards for 0 to
release of the WHO Child Growth                                   index-for-age reference, developed in                              5 years, would not be feasible for older
Standards for preschool children based                            1991,6 only starts at 9 years of age,                              children, as it would not be possible to
on a prescriptive approach.2 As countries                         groups data annually and covers a lim-                             control the dynamics of their environ-
proceed with the implementation of                                ited percentile range. Many countries                              ment. Therefore, as an alternative, the ex-
growth standards for children under 5                             pointed to the need to have body mass                              perts suggested that a growth reference
years of age, the gap across all centiles                         index (BMI) curves that start at 5 years                           be constructed for this age group using
between these standards and existing                              and permit unrestricted calculation of                             existing historical data and discussed the
growth references for older children has                          percentile and z-score curves on a con-                            criteria for selecting the data sets.
become a matter of great concern. It is                           tinuous age scale from 5 to 19 years.                                   WHO subsequently initiated a pro-
now widely accepted that using descrip-                                The need to harmonize growth as-                              cess to identify existing data sets from
tive samples of populations that reflect                          sessment tools conceptually and prag-                              various countries. This process resulted
a secular trend towards overweight and                            matically prompted an expert group                                 in an initial identification of 115 candi-
obesity to construct growth references                            meeting in January 2006 to evaluate the                            date data sets from 45 countries, which
results inadvertently in an undesirable                           feasibility of developing a single inter-                          were narrowed down to 34 data sets


a
  Department of Nutrition, World Health Organization, 20 Avenue Appia, 1211 Geneva 27, Switzerland. Correspondence to Mercedes de Onis
  (e-mail: deonism@who.int).
doi: 10.2471/BLT.07.043497
(Submitted: 25 April 2007 – Final revised version received: 12 July 2007 – Accepted: 15 July 2007 )


660                                                                                                                Bulletin of the World Health Organization | September 2007, 85 (9)
Research
Mercedes de Onis et al.                                                                       Growth curves for school-aged children and adolescents

from 22 countries that met the inclusion
                                                              Fig. 1. Comparison between the 1977 and 2007 height-for-age z-score curves
criteria developed by the expert group.                               – boys
However, after further review, even these
most promising studies showed great
                                                                     200
heterogeneity in methods and data qual-                                            2007
                                                                                                                                                              3

                                                                                   1977                                                                       2
ity, sample size, age categories, socioeco-                          190
                                                                                                                                                              1
nomic status of participating children                               180
                                                                                                                                                              0
and various other factors critical to                                170                                                                                  -1
growth curve construction. Therefore,                                                                                                                     -2
                                                                     160
it was unlikely that a growth reference


                                                       Height (cm)
                                                                                                                                                          -3
constructed from these heterogeneous                                 150

data sets would agree with the WHO                                   140
Child Growth Standards at 5 years of
                                                                     130
age for the different anthropometric
indicators needed (i.e. height-for-age,                              120

weight-for-age and BMI-for-age).                                     110
      In consequence, WHO proceeded                                  100
to reconstruct the 1977 NCHS/WHO
growth reference from 5 to 19 years,                                       5   6   7      8      9   10   11      12      13   14   15   16   17    18   19
                                                                                                               Age (years)
using the original sample (a non-obese
sample with expected heights), supple-
mented with data from the WHO Child
Growth Standards (to facilitate a smooth                    The total sample size was 22 917                     adolescents that accord with the WHO
transition at 5 years), and applying the               (11 410 boys, 11 507 girls). For the in-                  Child Growth Standards for preschool
state-of-the-art statistical methods 9,10              dicator height-for-age, 8 boys (0.07%),                   children, we reapplied the state-of-the-
used to develop standards for preschool                including an 18 month-old with length                     art statistical methods used to construct
                                                       51.6 cm, and 14 girls (0.12%) had                         the growth standards for children under
children, that is, the Box-Cox power
                                                       outlier height measurements that were                     5 years of age.10 The development of
exponential (BCPE) method with ap-
                                                       set to missing in the data set. For the                   the standards for under-fives followed
propriate diagnostic tools for the selec-
                                                       weight-based indicators (i.e. weight-                     a methodical process that involved: (a)
tion of best models.
                                                       for-age and BMI-for-age), the same                        detailed examination of existing meth-
      The purposes of this paper are to re-            cleaning approach used for the con-                       ods, including types of distributions and
port the methods used to reconstruct the               struction of the WHO Child Growth                         smoothing techniques; (b) selection of
1977 NCHS/WHO growth reference,                        Standards (cross-sectional component)                     a software package flexible enough to
to compare the resulting new curves (the               was applied to avoid the influence of                     allow comparative testing of alternative
2007 WHO reference) with the 1977                      unhealthy weights-for-height. 10 As a                     methods and the actual generation of the
NCHS/WHO charts, and to describe                       result, 321 observations for boys (2.8%)                  curves; and (c) systematic application of
the transition at 5 years of age from the              and 356 observations for girls (3.0%)                     the selected approach to the data to gen-
WHO standards for under-fives to these                 were excluded.                                            erate models that best fitted the data.9
new curves for school-aged children and                     A smooth transition from the                              The BCPE method,12 with curve
adolescents.                                           WHO Child Growth Standards (0–5                           smoothing by cubic splines, was used
                                                       years) to the reference curves beyond 5                   to construct the curves. This method
Methods                                                years was provided by merging data from                   accommodates various kinds of dis-
                                                       the growth standards’ cross-sectional                     tributions, from normal to skewed or
Sample description                                     sample (18–71 months) with the NCHS                       kurtotic. After the model was fitted us-
The core sample used for the reconstruc-
                                                       final sample before fitting the new                       ing the whole age range (18 months to
tion of the reference for school-aged                  growth curves. The growth curves for                      24 years), the curves were truncated to
children and adolescents (5–19 years)                  ages 5 to 19 years were thus constructed                  cover the required age range (i.e. 5–19
was the same as that used for the con-                 using data from 18 months to 24 years.                    years for height-for-age and BMI-for-
struction of the original NCHS charts,                 The final sample used for fitting the                     age, and 5–10 years for weight-for-age),
pooling three data sets.11 The first and               growth curves included 30 907 observa-                    thus avoiding the right- and left-edge
second data sets were from the Health                  tions (15 537 boys, 15 370 girls) for the                 effects.9
Examination Survey (HES) Cycle II                      height-for-age curves, 30 100 observa-                         The specifications of the BCPE
(6–11 years) and Cycle III (12–17 years).              tions (15 136 boys, 14 964 girls) for                     models that provided the best fit to gen-
The third data set was from the Health                 the weight-for-age curves, and 30 018                     erate the growth curves were:
and Nutrition Examination Survey                       observations (15 103 boys, 14 915 girls)
(HANES) Cycle I (birth to 74 years),                   for the BMI-for-age curves.                               For height-for-age:
from which only data from the 1 to 24                                                                            BCPE(l = 1, df(m) = 12, df(s) = 4, n = 1,
years age range were used. Given the                   Statistical methods                                       t = 2) for boys
similarity of the three data sets,11 the data          As the goal was to develop growth                         BCPE(l = 0.85, df(m) = 10, df(s) = 4,
were merged without adjustments.                       curves for school-aged children and                       n = 1, t = 2) for girls.


Bulletin of the World Health Organization | September 2007, 85 (9)                                                                                        661
Research
       Growth curves for school-aged children and adolescents                                                                          Mercedes de Onis et al.

For weight-for-age:
                                                       Fig. 2. Comparison between the 1977 and 2007 height-for-age z-score curves
BCPE(l = 1.4, df(m) = 10, df(s) = 8,                           – girls
df(n) = 5, t = 2) for boys
BCPE(l = 1.3, df(m) = 10, df(s) = 3,                                                                                                                            3
df(n) = 3, t = 2) for girls.                                 180               2007
                                                                               1977                                                                             2

                                                             170                                                                                                1
For BMI-for-age:                                                                                                                                                0
BCPE(l = 0.8, df(m) = 8, df(s) = 4,                          160
                                                                                                                                                             -1
df(n) = 4, t = 2) for boys
                                                             150                                                                                             -2
BCPE(l = 1, df(m) = 8, df(s) = 3,


                                               Height (cm)
df(n) = 4, t = 2) for girls.
                                                                                                                                                             -3
                                                             140


Where l is the power of the transfor-                        130

mation applied to age before fitting the                     120
model; df(m) is the degrees of freedom
for the cubic splines fitting the median                     110
(m); df(s) the degrees of freedom for
                                                             100
the cubic splines fitting the coefficient
of variation (s); df(n) the degrees of
                                                                       5   6   7       8   9     10         11      12      13   14   15   16   17   18    19
freedom for the cubic splines fitting the                                                                        Age (years)
Box-Cox transformation power (n) (for
height-for-age fixed n = 1); and t is the       the +3 standard deviation (SD). The full                            for boys (Fig. 1) than it is for girls (Fig.
parameter related to the kurtosis (in all       set of clinical charts and tables displayed                         2), especially at the upper end of the
three cases fixed t = 2).                       by sex and age (years and months), per-                             age range (15–18 years; 18 years is the
     The selected models for boys and           centile and z-score values and related in-                          maximum age limit of the 1977 curves).
girls ultimately simplify to the LMS            formation (e.g. LMS values) are provided                            Differences in boys’ attained height
method,13 since it was not necessary to         on the WHO web site (http://www.who.                                z-scores (1977 versus 2007 curves) at 5
model the parameter related to kurtosis.        int/growthref/).                                                    years are negligible, ranging from 0.1 cm
For height-for-age, the data follow the
                                                     Sex-specific comparisons of the                                in the curves below the median to 0.3 cm
standard normal distribution, so it was
                                                1977 NCHS/WHO reference and the                                     at +2 and +3 SD (Fig. 1). The two sets
not necessary to model either the param-
                                                newly reconstructed curves are presented                            of curves follow more variable patterns
eter related to skewness or to kurtosis.
                                                in the figures for height-for-age, weight-                          in both shape and the spread of attained
                                                for-age and BMI-for-age, respectively.                              heights as they advance from age 10 years
Results                                                                                                             to the end of the age range. For example,
Percentile and z-score curves and tables        Height-for-age                                                      at 18 years, the distribution of heights
were generated ranging from the 1st to          The difference in shape between the                                 from –3 to +3 SD is tighter by 5 cm in
the 99th percentile and from the –3 to          1977 and 2007 curves is more evident                                the 1977 curves compared with those
                                                                                                                    for 2007. Between –3 SD and the me-
                                                                                                                    dian, the 1977 curves are higher by 3.3
       Fig. 3. Comparison between the 1977 and 2007 weight-for-age z-score curves                                   cm, 2.4 cm, 1.5 cm and 0.7 cm, respec-
               – boys
                                                                                                                    tively. Conversely, the 1977 curves above
                                                                                                                    the median are lower than corresponding
                                                                                                       3
                        2007                                                                                        2007 curves by 0.2 cm (+1 SD), 1.1 cm
                        1977
                                                                                                                    (+2 SD) and 2.0 cm (+3 SD).
              50
                                                                                                                         Although the disparity at 5 years
                                                                                                       2            between the two sets of girls’ curves
                                                                                                                    (Fig. 2) is greater than that observed for
              40
                                                                                                                    boys, ranging between 0.2 cm (–3 SD)
Weight (kg)


                                                                                                       1
                                                                                                                    and 1.7 cm (+3 SD), the curve shapes in
                                                                                                       0
                                                                                                                    later years follow more comparable pat-
              30
                                                                                                                    terns and culminate in a more similar
                                                                                                       -1
                                                                                                                    distribution of attained height z-scores
                                                                                                       -2
                                                                                                                    between 15 and 18 years of age. As ob-
              20                                                                                       -3
                                                                                                                    served for boys, the negative SDs and
                                                                                                                    median of the 1977 set at 18 years are
                                                                                                                    higher than their equivalent 2007 curves
                   5        6            7                         8               9              10                by 2.6 cm (–3 SD), 2.0 cm (–2 SD), 1.2
                                             Age (years)                                                            cm (–1 SD) and 0.6 cm (median). The


662                                                                                            Bulletin of the World Health Organization | September 2007, 85 (9)
Research
Mercedes de Onis et al.                                                                 Growth curves for school-aged children and adolescents

+1 SD curves overlap at 18 years, and
                                                               Fig. 4. Comparison between the 1977 and 2007 weight-for-age z-score curves
in reverse pattern to the negative SDs,                                – girls
the 1977 curves are lower by 0.7 cm (+2
SD) and 1.3 cm (+3 SD).                                              60                                                                             3
                                                                                2007
                                                                                1977
Weight-for-age
In the lower half of the weight-for-age                              50
distribution, the largest difference be-                                                                                                            2

tween the 1977 and 2007 boys’ curves
(Fig. 3) is at 10 years of age, where the                            40


                                                       Weight (kg)
                                                                                                                                                    1
2007 curves are higher by 2.9 kg (–3
SD) and 1.1 kg (–2 SD). In the upper                                                                                                                0
half of the distribution, the largest dis-                           30
                                                                                                                                                    -1
parities between the +1 SD and +2 SD
                                                                                                                                                    -2
curves are also at age 10 years, but in this
                                                                     20                                                                             -3
case the 1977 curves are higher by 1.7 kg
and 1.0 kg. The +3 SD curves present
sizeable differences, with the 1977 curve                            10
being consistently lower throughout the                                   5         6             7                 8           9              10
                                                                                                      Age (years)
age range (from 1.6 kg at 5 years to 3.1
kg at 10 years). Girls present similar pat-
terns to those observed for boys (Fig. 4).             the 2007 curve at 19 years. The patterns          For weight-for-age, differences between
At the lower bound, disparities are larger             observed in the boys’ curves are also             the 1977 reference and the WHO stan-
for girls than they are for boys. For girls            evident among girls (Fig. 6), except that         dards at +3 SD were 2.0 kg for boys and
at 10 years, the 2007 curves are higher                the crossover of the 5th, 15th and 50th           3.5 kg for girls. Since no NCHS-based
by 3.7 kg (–3 SD) and 1.4 kg (–2 SD).                  percentiles occurs at 13 years, and differ-       reference values for BMI were available
At the upper bound, the largest disparity              ences in the 50th and 95th percentiles            for ages below 9 years, the table presents
for the +3 SD curves is at 5 years, where              are slightly larger than corresponding            comparative values only for the 2007
the 2007 curve is 3.1 kg above the 1977                differences in the boys’ percentiles. A           reconstructed reference and the WHO
curve, but the difference decreases to                 wiggly pattern is noticeable in the 1991          standards at 5 years of age.
1.7 kg at 10 years. The +2 SD curves                   reference values, particularly in the 50th,            The reconstruction resulted in
cross between 8 and 9 years. At 5 years,               85th and 95th percentiles.                        curves that are closely aligned to cor-
the 2007 curve is higher by 1.3 kg and,                     At 19 years of age, the 2007 BMI             responding WHO standards at the
at 10 years, it is lower than the 1977                 values at +1 SD are 25.4 kg/m² for boys           junction (5 years). For height-for-age
curve by 2.3 kg.                                       and 25.0 kg/m² for girls, while the               boys, the three negative SDs are only
                                                       +2 SD values are 29.7 kg/m² for both              0.1 cm apart, the median and +1 SD
BMI-for-age                                            sexes.                                            curves differ by 0.3 cm, and disparities
Fig. 5 (boys) and Fig. 6 (girls) show the                                                                at +2 SD and +3 SD are 0.4 cm and
reference data for BMI-for-age devel-                  Transition to the 2007 WHO                        0.5 cm, respectively. For girls, the differ-
                                                                                                         ences between the two sets of curves are
oped in 1991 that WHO has to date rec-                 reference at 5 years
                                                                                                         0.3 cm or 0.4 cm through the full range
ommended for ages 9 to 24 years 6 and                  A main objective for reconstructing the
                                                                                                         of z-scores. For weight-for-age, where
how they compare with corresponding                    1977 NCHS/WHO reference was to
                                                                                                         differences between the 1977 reference
centiles of the newly constructed curves               provide a smooth transition from the
                                                                                                         and the WHO standards at 5 years were
in the age period where the two sets                   WHO standard curves for under-fives               considerable, the reconstruction sub-
overlap (9–19 years). The 5th, 15th and                to the reference curves for older children.       stantially reduced differences in the final
50th percentiles for boys (Fig. 5) start at            Table 1 presents values at 5 years for the        curves. The boys’ medians are equal,
9 years with small differences (0.1 kg/m²              various indicators by sex of the 1977             while their negative z-scores differ by 0.1
and 0.2 kg/m²) between the 1991 refer-                 and 2007 references for school-aged               kg or 0.2 kg, and the positive z-scores
ence values and the 2007 curves. The                   children and adolescents, and the WHO             by 0.1 kg (+1 SD), 0.3 kg (+2 SD) and
two sets then track closely and cross over             standards for under-fives.                        0.4 kg (+3 SD). Residual differences in
at about 17 years, so that by 19 years the                  Disparities between the 1977 refer-          the two sets of curves for girls are in a
2007 percentiles are 0.3 kg/m² or 0.4                  ence and the WHO height-for-age and               range similar to those in the boys’ curves,
kg/m² higher than the 1991 reference                   weight-for-age standards for girls at 5           which is between 0.0 kg and 0.4 kg.
values. The 85th percentile of the 1991                years were larger than those observed                  The merger of the under-fives
reference originates at 0.9 kg/m² above                in corresponding boys’ curves. For                growth standards’ data (18–71 months)
its 2007 equivalent and tracks above it                example, the differences in the boys’             with the NCHS core sample to fit the
to end at 0.8 kg/m² higher at 19 years.                height-for-age curves were at most 0.2            2007 curves for school-aged children
For the 95th percentile, the 1991 refer-               cm, in contrast to the girls’ curves that         and adolescents resulted in a very
ence starts at 2.0 kg/m² higher and veers              were disparate by as much as 1.7 cm and           smooth transition between the WHO
upwards, terminating 2.6 units above                   2.1 cm at +2 and +3 SD, respectively.             Child Growth Standards and the newly


Bulletin of the World Health Organization | September 2007, 85 (9)                                                                               663
Research
 Growth curves for school-aged children and adolescents                                                         Mercedes de Onis et al.

constructed references for BMI-for-age.
                                             Fig. 5. Comparison between the 1991 and 2007 body mass index-for-age
For both boys and girls, differences be-             percentile curves – boys
tween the two curve sets at 5 years are
mostly 0.0 kg/m² or 0.1 kg/m², and
never more than 0.2 kg/m².

Discussion
The need for a widely applicable growth
reference for older children and ado-
lescents was increasingly recognized
by countries attempting to assess the
magnitude of the growing public health
problem of childhood obesity. This
need was reaffirmed by the release of
the under-five growth standards. The
reconstruction presented in this paper
has resulted in growth curves that are
closely aligned to the WHO Child
Growth Standards at 5 years and as such
are a suitable complementary reference
for use in school-aged child and adoles-
cent health programmes. The various
clinical charts and tables provided on
the Internet will allow for the practical   sion of six percentile curves (5th, 10th,      limit of the reference compared with the
application of the reference.               25th, 75th, 90th and 95th) and then            2007 curves.
      The approach used in constructing     smoothed by a combination of polyno-                 When compared to the 1977
the 2007 WHO reference addressed the        mial regression and cubic splining tech-       NCHS/WHO curves, the differences in
limitations of the 1977 NCHS curves         niques.14 In the 2007 reconstruction, age      the newly reconstructed weight-for-age
recognized by the 1993 expert commit-       was modelled as a continuous variable,         curves are significant in all centiles apart
tee 4 that recommended their provisional    and the curves were fitted simultane-          from the median and the –1 SD curves,
use for older children. The height-for-     ously and smoothed throughout the age          reflecting the important difference in
age median curves of the 1977 and 2007      range using cubic splines. Furthermore,        curve construction methodology. The
references overlap almost completely        edge effects were avoided by construct-        fact that the median curves of the two
with only a slight difference in shape,     ing the 2007 curves with data that             references overlap almost completely is
which is probably due to the different      extended beyond the lower and upper            reassuring in that the two samples used
modelling techniques used. For the          age bounds of the final reference curves.      for fitting the models are the same within
1977 NCHS/WHO curves, age-specific          The latter may explain why the 1977            the healthy range (i.e. middle range of
standard deviations from the median         NCHS/WHO curves have pronounced                the distribution). The methodology
were derived from the observed disper-      wiggly shapes towards the upper age            available at the time of constructing the
                                                                                           1977 curves was limited in its ability to
                                                                                           model skewed data.14 Fixing a higher
 Fig. 6. Comparison between the 1991 and 2007 body mass index-for-age                      standard deviation distance between the
         percentile curves – girls
                                                                                           curves above the median and a lower
                                                                                           one for the curves below, as was done,
                                                                                           partially accounted for the skewness
                                                                                           in the weight data but failed to model
                                                                                           the progressively increasing distances
                                                                                           between the SD curves from the lower
                                                                                           to the upper tails of the weight-for-age
                                                                                           distribution. To fit the skewed data
                                                                                           adequately, the LMS method (used in
                                                                                           the construction of the 2007 curves and
                                                                                           other recently developed weight-based
                                                                                           references) fits a Box-Cox normal dis-
                                                                                           tribution, which follows the empirical
                                                                                           data closely.15–17
                                                                                                 The reference data for BMI-for-age
                                                                                           recommended by WHO are limited in
                                                                                           that they begin only at 9 years of age
                                                                                           and cover a restricted distribution range
                                                                                           (5th–95th percentiles). The empirical

664                                                                         Bulletin of the World Health Organization | September 2007, 85 (9)
Research
Mercedes de Onis et al.                                                                Growth curves for school-aged children and adolescents

 Table 1. Reference values for height-for-age, weight-for-age and body mass index-for-age at 5 years by sex for the 1977 and
          2007 references, and the WHO Child Growth Standards

                       1977 reference          2007 reference        WHO standards a      1977 reference     2007 reference     WHO standards a
 Z-scores                                             Boys                                                         Girls
                                                                             Height-for-age (cm)
 – 3 SD                       96.1                     96.0                96.1                 95.1               94.9               95.2
 – 2 SD                      100.7                    100.6               100.7                 99.5               99.6               99.9
 – 1 SD                      105.3                    105.2               105.3                104.0              104.3              104.7
 Median                      109.9                    109.7               110.0                108.4              109.1              109.4
 +1 SD                       114.5                    114.3               114.6                112.8              113.8              114.2
 +2 SD                       119.1                    118.8               119.2                117.2              118.6              118.9
 +3 SD                       123.7                    123.4               123.9                121.6              123.3              123.7
                                                                             Weight-for-age (kg)
 – 3 SD                        12.3                    12.6                12.4                  11.9               12.2               12.1
 – 2 SD                        14.4                    14.2                14.1                  13.8               13.8               13.7
 – 1 SD                        16.6                    16.1                16.0                  15.7               15.8               15.8
 Median                        18.7                    18.3                18.3                  17.7               18.1               18.2
 +1 SD                         21.1                    20.9                21.0                  20.4               21.0               21.2
 +2 SD                         23.5                    23.9                24.2                  23.2               24.5               24.9
 +3 SD                         25.9                    27.5                27.9                  26.0               29.1               29.5
                                                                      Body mass index-for-age (kg/m²) b
 – 3 SD                         –                      12.1                12.0                    –                11.8               11.6
 – 2 SD                         –                      13.0                12.9                    –                12.8               12.7
 – 1 SD                         –                      14.1                14.0                    –                13.9               13.9
 Median                         –                      15.3                15.2                    –                15.2               15.3
 +1 SD                          –                      16.6                16.6                    –                16.9               16.9
 +2 SD                          –                      18.2                18.3                    –                18.8               18.8
 +3 SD                          –                      20.1                20.3                    –                21.3               21.1
 a
     WHO Child Growth Standards for 0–5 years of age.2,10
 b
     For BMI, the 1991 reference data start at 9 years of age.4


reference values were estimated us-                       used for adults (> 25.0 kg/m²), while         for-age is inadequate for monitoring
ing data that were grouped by age in                      the +2 SD value (29.7 kg/m² for both          growth beyond childhood due to its
years, and then smoothed using locally                    sexes) compares closely with the cut-off      inability to distinguish between relative
weighted regression.6 The 2007 recon-                     for obesity (> 30.0 kg/m²).18                 height and body mass, hence the provi-
struction permits the extension of the                         The 2007 height-for-age and BMI-         sion here of BMI-for-age to complement
BMI reference to 5 years, where the                       for-age charts extend to 19 years, which      height-for-age in the assessment of thin-
curves match WHO under-five curves                        is the upper age limit of adolescence as      ness (low BMI-for-age), overweight and
almost perfectly. Furthermore, at 19                      defined by WHO.19 The weight-for-age          obesity (high BMI-for-age) and stunting
years of age, the 2007 BMI values for                     charts extend to 10 years for the ben-        (low height-for-age) in school-aged chil-
both sexes at +1 SD (25.4 kg/m² for                       efit of countries that routinely measure      dren and adolescents. O
boys and 25.0 kg/m² for girls) are                        only weight and would like to monitor
equivalent to the overweight cut-off                      growth throughout childhood. Weight-          Competing interests: None declared.


Résumé
Mise au point d’une référence de croissance pour les enfants d’âge scolaire et les adolescents
Objectif Construire des courbes de croissance pour les enfants                    Méthodes Les données de référence NCHS/OMS pour la
d’âge scolaire et les adolescents concordant avec la Norme OMS                    croissance (de 1 à 24 ans) de 1977 ont été regroupées avec
de croissance de l’enfant pour les enfants d’âge préscolaire et                   celles de l’échantillon transversal d’enfants de moins de 5 ans
avec les points de coupure pour l’indice de masse corporelle (IMC)                (18 à 71 mois) utilisé pour la norme de croissance de manière
s’appliquant aux adultes.                                                         à lisser la transition entre les deux échantillons. Les méthodes


Bulletin of the World Health Organization | September 2007, 85 (9)                                                                            665
Research
 Growth curves for school-aged children and adolescents                                                                       Mercedes de Onis et al.

statistiques correspondant à l’état de la technique [méthode                   de 25,4 kg/m² pour les garçons et de 25,0 kg/m² pour les filles. Ces
Box-Cox-power-exponential (BCPE), complétée par des outils                     valeurs concordent avec le point de coupure pour l’excès pondéral
permettant de sélectionner les meilleurs modèles], ayant servi à               chez l’adulte (> 25,0 kg/m²). De même, les valeurs correspondant
construire la norme OMS de croissance de l’enfant (0 à 5 ans),                 à plus de 2 écarts types (29,7 kg/m² pour les deux sexes) sont très
ont été appliquées à cet échantillon combiné.                                  proches du point de coupure pour l’obésité (> 30,0 kg/m²).
Résultats La fusion des jeux de données a permis d’obtenir                     Conclusion Les nouvelles courbes coïncident étroitement à 5 ans
une transition plus douce au niveau de 5 ans pour les courbes                  avec la norme OMS de croissance de l’enfant et à 19 ans avec
de taille, de poids et d’IMC en fonction de l’âge. S’agissant de               les points de coupure recommandés chez l’adulte pour l’excès
l’IMC en fonction de l’âge, sur l’ensemble des centiles, l’ampleur             pondéral et l’obésité. Elles comblent les lacunes en matière de
de la différence entre les deux courbes à l’âge de 5 ans se situe              courbes de croissance et fournissent une référence appropriée
principalement entre 0,0 kg/m² et 0,1 kg/m². A 19 ans, les                     pour la tranche d’âges 5 -19 ans.
nouvelles valeurs d’IMC correspondant à un écart type de +1 sont


Resumen
Elaboración de valores de referencia de la OMS para el crecimiento de escolares y adolescentes
Objetivo Elaborar curvas de crecimiento para escolares y                       una transición suave de la talla para la edad, el peso para la edad
adolescentes que concuerden con los Patrones de Crecimiento                    y el IMC para la edad a los 5 años. Con respecto al IMC para la
Infantil de la OMS para preescolares y los valores de corte del                edad, la magnitud de la diferencia entre ambas curvas a los 5 años
índice de masa corporal (IMC) para adultos.                                    fue generalmente de 0,0 kg/m² a 0,1 kg/m² en todos los centiles.
Métodos Se fusionaron los datos del patrón internacional de                    A los 19 años, los nuevos valores del IMC para +1 desviación
crecimiento del National Center for Health Statistics/OMS de                   estándar (DE) fueron de 25,4 kg/m² para el sexo masculino y de
1977 (1–24 años) con los datos de la muestra transversal de los                25,0 kg/m² para el sexo femenino, es decir, equivalentes al valor de
patrones de crecimiento para menores de 5 años (18–71 meses),                  corte del sobrepeso en adultos (> 25,0 kg/m²). A su vez, el valor
con el fin de suavizar la transición entre ambas muestras. A esta              correspondiente a +2 DE (29,7 kg/m² en ambos sexos) fue muy
muestra combinada se le aplicaron los métodos estadísticos                     similar al valor de corte de la obesidad (> 30,0 kg/m²).
de vanguardia utilizados en la elaboración de los Patrones                     Conclusión Las nuevas curvas se ajustan bien a los Patrones
de Crecimiento Infantil de la OMS (0–5 años), es decir, la                     de Crecimiento Infantil de la OMS a los 5 años y a los valores
transformación de potencia de Box-Cox exponencial, junto con                   de corte del sobrepeso y de la obesidad recomendados para los
instrumentos diagnósticos apropiados para seleccionar los mejores              adultos a los 19 años, colman la laguna existente en las curvas de
modelos.                                                                       crecimiento y constituyen una referencia apropiada para el grupo
Resultados La fusión de los dos conjuntos de datos proporcionó                 de 5 a 19 años de edad.


                                                                                                                                                  ‫ملخص‬
                                                                               ‫إعداد مؤرش منو مرجعي ملنظمة الصحة العاملية للمراهقني واألطفال‬
                                                                                                                      ‫الذين هم يف سن الدراسة‬
‫مبنسب كتلة الجسم نسبة إىل السن، تراوح مقدار الفرق بني املنحنيني عند‬            ،‫الهدف: وضع منحنيات منو للمراهقني واألطفال الذين هم يف سن الدراسة‬
‫سن الخامسة، يف أغلب األحوال، بني 0.0 كغم/م2 و1.0 كغم/م2 وذلك لجميع‬             ‫تتوافق مع معايـري منظمة الصحة العاملية لنمو الطفل الخاصة باألطفال دون‬
‫الرشائح املئوية. ويف سن التاسعة عرشة، كانت القيم الجديدة ملنسب كتلة‬                          .‫سن املدرسة، وحدود الفصل الخاصة مبنسب كتلة الجسم للكبار‬
/‫الجسم عند االنحراف املعياري +1 هي 4.52 كغم/م2 للفتيان، و0.52 كغم‬              ‫الطريقة: أُدمجت بيانات مقياس النمو املرجعي للمركز الوطني لإلحصاءات‬
‫م2 للفتيات. وهذه القيم مكافئة لحدود الفصل الخاصة بفرط الوزن لدى‬                ‫الصحية يف منظمة الصحة العاملية لعام 7791 (1 – 42 عاماً)، مع بيانات‬
+ ‫الكبار (≥ 0.52 كغم/م2). وعىل نحو مشابه، فإن قيمة االنحراف املعياري‬           –18( ‫عينة املسح املستعرض الخاص مبعايـري منو األطفال دون سن الخامسة‬
‫2 (7.92 كغم/م2 لكال الجنسني) تضاهئ، إىل حد كبري، الحد الفاصل للسمنة‬            ‫17 شهراً)، لتحقيق االنتقال السلس بني العينتني. وطبِّقت عىل هذه العينة‬
                                                         .)2‫(≥ 0.03 كغم/م‬      ‫املشرتكة أحدث الطرق اإلحصائية التي استخدمت إلعداد معايـري منظمة‬
‫االستنتاج: ترتاصف املنحنيات الجديدة تراصفاً كبرياً مع معايري منظمة‬             ‫الصحة العاملية لنمو الطفل (صفر – 5 سنوات)، مثل طريقة القوة األُسِّ ية‬
‫الصحة العاملية لنمو الطفل، عند سن الخامسة، ومع حدود الفصل املوىص‬               ،‫)، مع االستعانة باألدوات التشخيصية املالمئة‬BCPE( )) ‫(( بوكس- كوكس‬
‫بها الخاصة بفرط الوزن والسمنة للكبار عند سن التاسعة عرشة. وهي تسد‬                                                                .‫الختيار أفضل النامذج‬
‫الفجوة القامئة يف منحنيات النمو، وتوفر مقياساً مرجعياً مالمئاً للفئة العمرية‬   ‫املوجودات: أدت مجموعات البيانات املدمجة إىل تحقيق انتقال سلس عند‬
                                    .‫الواقعة بني سن الخامسة والتاسعة عرشة‬      ،‫سن الخامسة، وذلك يف منحنيات الطول (يف وضعية القيام) نسبة إىل السن‬
                                                                               ‫والوزن نسبة إىل السن، ومنسب كتلة الجسم نسبة إىل السن. ويف ما يتعلق‬


666                                                                                       Bulletin of the World Health Organization | September 2007, 85 (9)
Research
Mercedes de Onis et al.                                                                  Growth curves for school-aged children and adolescents

References
 1. Lobstein T, Baur L, Uauy R. IASO International Obesity Task Force. Obesity in   11. Hamill PV, Drizd TA, Johnson CL, Reed RB, Roche AF. NCHS growth curves for
    children and young people: a crisis in public health. Obes Rev 2004;5:4-104.        children birth-18 years: United States. Vital Health Stat 11 1977;165:i-iv,
 2. WHO Multicentre Growth Reference Study Group. WHO Child Growth                      1-74.
    Standards based on length/height, weight and age. Acta Paediatr Suppl           12. Rigby RA, Stasinopoulos DM. Smooth centile curves for skew and kurtotic
    2006;450:76-85.                                                                     data modelled using the Box-Cox power exponential distribution. Stat Med
 3. De Onis M. The use of anthropometry in the prevention of childhood                  2004;23:3053-76.
    overweight and obesity. Int J Obes Relat Metab Disord 2004;28:S81-5.            13. Cole TJ, Green PJ. Smoothing reference centile curves: the LMS method and
 4. Physical status: the use and interpretation of anthropometry. Report of a           penalized likelihood. Stat Med 1992;11:1305-19.
    WHO Expert Committee. World Health Organ Tech Rep Ser 1995;                     14. Dibley MJ, Goldsby JB, Staehling NW, Trowbridge FL. Development of
    854:161-262.                                                                        normalized curves for the international growth reference: historical and
 5. Wang Y, Moreno LA, Caballero B, Cole TJ. Limitations of the current World           technical considerations. Am J Clin Nutr 1987;46:736-48.
    Health Organization growth references for children and adolescents. Food        15. Kuczmarski RJ, Ogden CL, Guo SS, Grummer-Strawn LM, Flegal KM, Mei Z,
    Nutr Bull 2006;27:S175-88.                                                          et al. 2000 CDC growth charts for the United States: methods and
 6. Must A, Dallal GE, Dietz WH. Reference data for obesity: 85th and 95th              development. Vital Health Stat 11 2002;246:1-190.
    percentiles of body mass index (wt/ht²) and triceps skinfold thickness. Am J    16. Cole TJ, Freeman JV, Preece MA. British 1990 growth reference centiles for
    Clin Nutr 1991;53:839-46.                                                           weight, height, body mass index and head circumference fitted by maximum
 7. Butte NF, Garza C, editors. Development of an international growth                  penalized likelihood. Stat Med 1998;17:407-29.
    standard for preadolescent and adolescent children. Food Nutr Bull 2006;        17. Fredriks AM, van Buuren S, Burgmeijer RJ, Meulmeester JF, Beuker RJ,
    27:S169-326.                                                                        Brugman E, et al. Continuing positive secular growth change in the
 8. Butte NF, Garza C, de Onis M. Evaluation of the feasibility of international        Netherlands 1955-1997. Pediatr Res 2000;47:316-23.
    growth standards for school-aged children and adolescents. J Nutr 2007;         18. Obesity: preventing and managing the global epidemic. Report of a WHO
    137:153-57.                                                                         consultation. World Health Organ Tech Rep Ser 2000;894:1-253.
 9. Borghi E, de Onis M, Garza C, Van den Broeck J, Frongillo EA, Grummer-          19. Young people’s health — a challenge for society. Report of a WHO Study
    Strawn L, et al., for the WHO Multicentre Growth Reference Study Group.             Group on young people and Health for All by the Year 2000. World Health
    Construction of the World Health Organization child growth standards:               Organ Tech Rep Ser 1986;731:1-117.
    selection of methods for attained growth curves. Stat Med 2006;25:247-65.
10. WHO Multicentre Growth Reference Study Group. WHO Child Growth
    Standards: length/height-for-age, weight-for-age, weight-for-length, weight-
    for-height and body mass index-for-age: methods and development. Geneva:
    WHO; 2006.


Bulletin of the World Health Organization | September 2007, 85 (9)                                                                                            667

Mais conteúdo relacionado

Destaque

Rod Johnson Cathedral
Rod Johnson CathedralRod Johnson Cathedral
Rod Johnson Cathedral
deimos
 
Rethinking Design Research
Rethinking Design ResearchRethinking Design Research
Rethinking Design Research
Marco Ferruzca
 
Sketches for Book
Sketches for BookSketches for Book
Sketches for Book
caterwauler
 

Destaque (20)

The new framework
The new frameworkThe new framework
The new framework
 
Usagility
UsagilityUsagility
Usagility
 
Great marketing can save the world
Great marketing can save the worldGreat marketing can save the world
Great marketing can save the world
 
Webinar: Bring Web Content into the Modern Era with Ephox's EditLive! 9 Rich ...
Webinar: Bring Web Content into the Modern Era with Ephox's EditLive! 9 Rich ...Webinar: Bring Web Content into the Modern Era with Ephox's EditLive! 9 Rich ...
Webinar: Bring Web Content into the Modern Era with Ephox's EditLive! 9 Rich ...
 
SXSW How Companies Created Buzz
SXSW How Companies Created Buzz SXSW How Companies Created Buzz
SXSW How Companies Created Buzz
 
Luis Felipe Pacheco LLanes, Senior OCM
Luis Felipe Pacheco LLanes, Senior OCMLuis Felipe Pacheco LLanes, Senior OCM
Luis Felipe Pacheco LLanes, Senior OCM
 
Video Games and Reader's Advisory
Video Games and Reader's AdvisoryVideo Games and Reader's Advisory
Video Games and Reader's Advisory
 
Future of web development
Future of web developmentFuture of web development
Future of web development
 
Simulating Production with Clocker
Simulating Production with ClockerSimulating Production with Clocker
Simulating Production with Clocker
 
Rod Johnson Cathedral
Rod Johnson CathedralRod Johnson Cathedral
Rod Johnson Cathedral
 
Community keynote
Community keynoteCommunity keynote
Community keynote
 
Intervention
InterventionIntervention
Intervention
 
Rethinking Design Research
Rethinking Design ResearchRethinking Design Research
Rethinking Design Research
 
Riddles
RiddlesRiddles
Riddles
 
Reaching Your Patrons in the Brave New World of the Social Web
Reaching Your Patrons in the Brave New World of the Social WebReaching Your Patrons in the Brave New World of the Social Web
Reaching Your Patrons in the Brave New World of the Social Web
 
What's A CMS?
What's A CMS?What's A CMS?
What's A CMS?
 
Anxa.com english version - corporate Presentation
Anxa.com english version - corporate PresentationAnxa.com english version - corporate Presentation
Anxa.com english version - corporate Presentation
 
Kory's Project: Marshes
 Kory's Project: Marshes Kory's Project: Marshes
Kory's Project: Marshes
 
Sketches for Book
Sketches for BookSketches for Book
Sketches for Book
 
O voo dos líderes invencíveis
O voo dos líderes invencíveisO voo dos líderes invencíveis
O voo dos líderes invencíveis
 

Semelhante a 2007 development of a who growth reference for school aged children and adolescents. bwho

Trends in Body Mass Index and Prevalence of Extreme HighObes.docx
Trends in Body Mass Index and Prevalence of Extreme HighObes.docxTrends in Body Mass Index and Prevalence of Extreme HighObes.docx
Trends in Body Mass Index and Prevalence of Extreme HighObes.docx
willcoxjanay
 
IAP Growth Monitoring Guidelines for Children from Birth to 18 Years
IAP Growth Monitoring Guidelines for Children from Birth to 18 YearsIAP Growth Monitoring Guidelines for Children from Birth to 18 Years
IAP Growth Monitoring Guidelines for Children from Birth to 18 Years
mandar haval
 

Semelhante a 2007 development of a who growth reference for school aged children and adolescents. bwho (20)

Growthcharts
GrowthchartsGrowthcharts
Growthcharts
 
Review article by me
Review article by meReview article by me
Review article by me
 
Indicators for assessing infant and young child feeding practices Part 1 Defi...
Indicators for assessing infant and young child feeding practices Part 1 Defi...Indicators for assessing infant and young child feeding practices Part 1 Defi...
Indicators for assessing infant and young child feeding practices Part 1 Defi...
 
Trends in Body Mass Index and Prevalence of Extreme HighObes.docx
Trends in Body Mass Index and Prevalence of Extreme HighObes.docxTrends in Body Mass Index and Prevalence of Extreme HighObes.docx
Trends in Body Mass Index and Prevalence of Extreme HighObes.docx
 
Growth monitoring, screening and survillence
Growth monitoring, screening and survillenceGrowth monitoring, screening and survillence
Growth monitoring, screening and survillence
 
Journal critique: Child Health Surveillance
Journal critique: Child Health SurveillanceJournal critique: Child Health Surveillance
Journal critique: Child Health Surveillance
 
Anthropometry as a tool for measuring malnutrition
Anthropometry as a tool for measuring malnutritionAnthropometry as a tool for measuring malnutrition
Anthropometry as a tool for measuring malnutrition
 
Kids And Old Age: Taking the long view of children's health and well-being
Kids And Old Age: Taking the long view of children's health and well-beingKids And Old Age: Taking the long view of children's health and well-being
Kids And Old Age: Taking the long view of children's health and well-being
 
Who growth chart
Who growth chartWho growth chart
Who growth chart
 
IAP Growth Monitoring Guidelines for Children from Birth to 18 Years
IAP Growth Monitoring Guidelines for Children from Birth to 18 YearsIAP Growth Monitoring Guidelines for Children from Birth to 18 Years
IAP Growth Monitoring Guidelines for Children from Birth to 18 Years
 
Prof Louis Baur - Obesity Epidemic in a pandemic era.pdf
Prof Louis Baur - Obesity Epidemic in a pandemic era.pdfProf Louis Baur - Obesity Epidemic in a pandemic era.pdf
Prof Louis Baur - Obesity Epidemic in a pandemic era.pdf
 
Indian j endocrmetab157166-2333933_062859
Indian j endocrmetab157166-2333933_062859Indian j endocrmetab157166-2333933_062859
Indian j endocrmetab157166-2333933_062859
 
Bmi
BmiBmi
Bmi
 
Aene project a medium city public students obesity study
Aene project   a medium city public students obesity studyAene project   a medium city public students obesity study
Aene project a medium city public students obesity study
 
Definiciones sepsis. pccm 2005
Definiciones sepsis. pccm 2005Definiciones sepsis. pccm 2005
Definiciones sepsis. pccm 2005
 
Growth monitor
Growth monitorGrowth monitor
Growth monitor
 
Module 1: Pediatric Growth Assessment Part 1: The Principles
Module 1: Pediatric Growth Assessment Part 1: The PrinciplesModule 1: Pediatric Growth Assessment Part 1: The Principles
Module 1: Pediatric Growth Assessment Part 1: The Principles
 
1. perspectives of PN.pptx
1. perspectives of PN.pptx1. perspectives of PN.pptx
1. perspectives of PN.pptx
 
Growh charts by praman
Growh charts by pramanGrowh charts by praman
Growh charts by praman
 
Growth charts in Neonates- Preterm and term
Growth charts in Neonates- Preterm and termGrowth charts in Neonates- Preterm and term
Growth charts in Neonates- Preterm and term
 

Mais de Raul Rojas

2006 diabetes mellitus tipo 1 y lactancia artificial antes del sexto mes de v...
2006 diabetes mellitus tipo 1 y lactancia artificial antes del sexto mes de v...2006 diabetes mellitus tipo 1 y lactancia artificial antes del sexto mes de v...
2006 diabetes mellitus tipo 1 y lactancia artificial antes del sexto mes de v...
Raul Rojas
 
Imc para edad boys z 5_19years
Imc para edad boys z 5_19yearsImc para edad boys z 5_19years
Imc para edad boys z 5_19years
Raul Rojas
 
Imc para edad girls z 5_19years
Imc para edad  girls z 5_19yearsImc para edad  girls z 5_19years
Imc para edad girls z 5_19years
Raul Rojas
 
2007 elaboración de un patrón oms de crecimiento de escolares y adolescentes....
2007 elaboración de un patrón oms de crecimiento de escolares y adolescentes....2007 elaboración de un patrón oms de crecimiento de escolares y adolescentes....
2007 elaboración de un patrón oms de crecimiento de escolares y adolescentes....
Raul Rojas
 
Docum de Trabajo. Flu
Docum de Trabajo. FluDocum de Trabajo. Flu
Docum de Trabajo. Flu
Raul Rojas
 
Avances quirúrgicos en cardiopatías cianóticas
Avances quirúrgicos en cardiopatías cianóticasAvances quirúrgicos en cardiopatías cianóticas
Avances quirúrgicos en cardiopatías cianóticas
Raul Rojas
 
Drug Resistant Tuberculosis. A Survival Guide For Clinicians. Ntc.08
Drug Resistant Tuberculosis. A Survival Guide For Clinicians. Ntc.08Drug Resistant Tuberculosis. A Survival Guide For Clinicians. Ntc.08
Drug Resistant Tuberculosis. A Survival Guide For Clinicians. Ntc.08
Raul Rojas
 

Mais de Raul Rojas (15)

Mib 3
Mib 3Mib 3
Mib 3
 
2012 anaphylaxis from bee pollen supplement. cmaj
2012 anaphylaxis from bee pollen supplement. cmaj2012 anaphylaxis from bee pollen supplement. cmaj
2012 anaphylaxis from bee pollen supplement. cmaj
 
Xx curso internaciona de avances en pediatría
Xx curso internaciona de avances en pediatríaXx curso internaciona de avances en pediatría
Xx curso internaciona de avances en pediatría
 
2006 diabetes mellitus tipo 1 y lactancia artificial antes del sexto mes de v...
2006 diabetes mellitus tipo 1 y lactancia artificial antes del sexto mes de v...2006 diabetes mellitus tipo 1 y lactancia artificial antes del sexto mes de v...
2006 diabetes mellitus tipo 1 y lactancia artificial antes del sexto mes de v...
 
Imc para edad boys z 5_19years
Imc para edad boys z 5_19yearsImc para edad boys z 5_19years
Imc para edad boys z 5_19years
 
Imc para edad girls z 5_19years
Imc para edad  girls z 5_19yearsImc para edad  girls z 5_19years
Imc para edad girls z 5_19years
 
2007 elaboración de un patrón oms de crecimiento de escolares y adolescentes....
2007 elaboración de un patrón oms de crecimiento de escolares y adolescentes....2007 elaboración de un patrón oms de crecimiento de escolares y adolescentes....
2007 elaboración de un patrón oms de crecimiento de escolares y adolescentes....
 
Docum de Trabajo. Flu
Docum de Trabajo. FluDocum de Trabajo. Flu
Docum de Trabajo. Flu
 
Avances quirúrgicos en cardiopatías cianóticas
Avances quirúrgicos en cardiopatías cianóticasAvances quirúrgicos en cardiopatías cianóticas
Avances quirúrgicos en cardiopatías cianóticas
 
Estrenimiento
EstrenimientoEstrenimiento
Estrenimiento
 
Abordaje de la cefalea en niños
Abordaje de la cefalea en niñosAbordaje de la cefalea en niños
Abordaje de la cefalea en niños
 
Drug Resistant Tuberculosis. A Survival Guide For Clinicians. Ntc.08
Drug Resistant Tuberculosis. A Survival Guide For Clinicians. Ntc.08Drug Resistant Tuberculosis. A Survival Guide For Clinicians. Ntc.08
Drug Resistant Tuberculosis. A Survival Guide For Clinicians. Ntc.08
 
Informe Tecnico Gripe
Informe Tecnico GripeInforme Tecnico Gripe
Informe Tecnico Gripe
 
Busqueda Bibliografica. Clinical Evidence Y Tripdatabase
Busqueda Bibliografica. Clinical Evidence Y  TripdatabaseBusqueda Bibliografica. Clinical Evidence Y  Tripdatabase
Busqueda Bibliografica. Clinical Evidence Y Tripdatabase
 
Rutina
RutinaRutina
Rutina
 

Último

Call Girls Bhubaneswar Just Call 9907093804 Top Class Call Girl Service Avail...
Call Girls Bhubaneswar Just Call 9907093804 Top Class Call Girl Service Avail...Call Girls Bhubaneswar Just Call 9907093804 Top Class Call Girl Service Avail...
Call Girls Bhubaneswar Just Call 9907093804 Top Class Call Girl Service Avail...
Dipal Arora
 
Call Girls Aurangabad Just Call 8250077686 Top Class Call Girl Service Available
Call Girls Aurangabad Just Call 8250077686 Top Class Call Girl Service AvailableCall Girls Aurangabad Just Call 8250077686 Top Class Call Girl Service Available
Call Girls Aurangabad Just Call 8250077686 Top Class Call Girl Service Available
Dipal Arora
 
College Call Girls in Haridwar 9667172968 Short 4000 Night 10000 Best call gi...
College Call Girls in Haridwar 9667172968 Short 4000 Night 10000 Best call gi...College Call Girls in Haridwar 9667172968 Short 4000 Night 10000 Best call gi...
College Call Girls in Haridwar 9667172968 Short 4000 Night 10000 Best call gi...
perfect solution
 

Último (20)

Call Girls Bhubaneswar Just Call 9907093804 Top Class Call Girl Service Avail...
Call Girls Bhubaneswar Just Call 9907093804 Top Class Call Girl Service Avail...Call Girls Bhubaneswar Just Call 9907093804 Top Class Call Girl Service Avail...
Call Girls Bhubaneswar Just Call 9907093804 Top Class Call Girl Service Avail...
 
Top Rated Bangalore Call Girls Ramamurthy Nagar ⟟ 9332606886 ⟟ Call Me For G...
Top Rated Bangalore Call Girls Ramamurthy Nagar ⟟  9332606886 ⟟ Call Me For G...Top Rated Bangalore Call Girls Ramamurthy Nagar ⟟  9332606886 ⟟ Call Me For G...
Top Rated Bangalore Call Girls Ramamurthy Nagar ⟟ 9332606886 ⟟ Call Me For G...
 
Call Girls Gwalior Just Call 8617370543 Top Class Call Girl Service Available
Call Girls Gwalior Just Call 8617370543 Top Class Call Girl Service AvailableCall Girls Gwalior Just Call 8617370543 Top Class Call Girl Service Available
Call Girls Gwalior Just Call 8617370543 Top Class Call Girl Service Available
 
Call Girls Nagpur Just Call 9907093804 Top Class Call Girl Service Available
Call Girls Nagpur Just Call 9907093804 Top Class Call Girl Service AvailableCall Girls Nagpur Just Call 9907093804 Top Class Call Girl Service Available
Call Girls Nagpur Just Call 9907093804 Top Class Call Girl Service Available
 
The Most Attractive Hyderabad Call Girls Kothapet 𖠋 9332606886 𖠋 Will You Mis...
The Most Attractive Hyderabad Call Girls Kothapet 𖠋 9332606886 𖠋 Will You Mis...The Most Attractive Hyderabad Call Girls Kothapet 𖠋 9332606886 𖠋 Will You Mis...
The Most Attractive Hyderabad Call Girls Kothapet 𖠋 9332606886 𖠋 Will You Mis...
 
Premium Call Girls In Jaipur {8445551418} ❤️VVIP SEEMA Call Girl in Jaipur Ra...
Premium Call Girls In Jaipur {8445551418} ❤️VVIP SEEMA Call Girl in Jaipur Ra...Premium Call Girls In Jaipur {8445551418} ❤️VVIP SEEMA Call Girl in Jaipur Ra...
Premium Call Girls In Jaipur {8445551418} ❤️VVIP SEEMA Call Girl in Jaipur Ra...
 
Call Girls Aurangabad Just Call 8250077686 Top Class Call Girl Service Available
Call Girls Aurangabad Just Call 8250077686 Top Class Call Girl Service AvailableCall Girls Aurangabad Just Call 8250077686 Top Class Call Girl Service Available
Call Girls Aurangabad Just Call 8250077686 Top Class Call Girl Service Available
 
Call Girls Coimbatore Just Call 9907093804 Top Class Call Girl Service Available
Call Girls Coimbatore Just Call 9907093804 Top Class Call Girl Service AvailableCall Girls Coimbatore Just Call 9907093804 Top Class Call Girl Service Available
Call Girls Coimbatore Just Call 9907093804 Top Class Call Girl Service Available
 
Premium Bangalore Call Girls Jigani Dail 6378878445 Escort Service For Hot Ma...
Premium Bangalore Call Girls Jigani Dail 6378878445 Escort Service For Hot Ma...Premium Bangalore Call Girls Jigani Dail 6378878445 Escort Service For Hot Ma...
Premium Bangalore Call Girls Jigani Dail 6378878445 Escort Service For Hot Ma...
 
Call Girls Kochi Just Call 8250077686 Top Class Call Girl Service Available
Call Girls Kochi Just Call 8250077686 Top Class Call Girl Service AvailableCall Girls Kochi Just Call 8250077686 Top Class Call Girl Service Available
Call Girls Kochi Just Call 8250077686 Top Class Call Girl Service Available
 
VIP Service Call Girls Sindhi Colony 📳 7877925207 For 18+ VIP Call Girl At Th...
VIP Service Call Girls Sindhi Colony 📳 7877925207 For 18+ VIP Call Girl At Th...VIP Service Call Girls Sindhi Colony 📳 7877925207 For 18+ VIP Call Girl At Th...
VIP Service Call Girls Sindhi Colony 📳 7877925207 For 18+ VIP Call Girl At Th...
 
College Call Girls in Haridwar 9667172968 Short 4000 Night 10000 Best call gi...
College Call Girls in Haridwar 9667172968 Short 4000 Night 10000 Best call gi...College Call Girls in Haridwar 9667172968 Short 4000 Night 10000 Best call gi...
College Call Girls in Haridwar 9667172968 Short 4000 Night 10000 Best call gi...
 
Call Girls Service Jaipur {9521753030} ❤️VVIP RIDDHI Call Girl in Jaipur Raja...
Call Girls Service Jaipur {9521753030} ❤️VVIP RIDDHI Call Girl in Jaipur Raja...Call Girls Service Jaipur {9521753030} ❤️VVIP RIDDHI Call Girl in Jaipur Raja...
Call Girls Service Jaipur {9521753030} ❤️VVIP RIDDHI Call Girl in Jaipur Raja...
 
Call Girls Bangalore Just Call 8250077686 Top Class Call Girl Service Available
Call Girls Bangalore Just Call 8250077686 Top Class Call Girl Service AvailableCall Girls Bangalore Just Call 8250077686 Top Class Call Girl Service Available
Call Girls Bangalore Just Call 8250077686 Top Class Call Girl Service Available
 
(Low Rate RASHMI ) Rate Of Call Girls Jaipur ❣ 8445551418 ❣ Elite Models & Ce...
(Low Rate RASHMI ) Rate Of Call Girls Jaipur ❣ 8445551418 ❣ Elite Models & Ce...(Low Rate RASHMI ) Rate Of Call Girls Jaipur ❣ 8445551418 ❣ Elite Models & Ce...
(Low Rate RASHMI ) Rate Of Call Girls Jaipur ❣ 8445551418 ❣ Elite Models & Ce...
 
Top Rated Bangalore Call Girls Mg Road ⟟ 9332606886 ⟟ Call Me For Genuine S...
Top Rated Bangalore Call Girls Mg Road ⟟   9332606886 ⟟ Call Me For Genuine S...Top Rated Bangalore Call Girls Mg Road ⟟   9332606886 ⟟ Call Me For Genuine S...
Top Rated Bangalore Call Girls Mg Road ⟟ 9332606886 ⟟ Call Me For Genuine S...
 
Russian Call Girls Service Jaipur {8445551418} ❤️PALLAVI VIP Jaipur Call Gir...
Russian Call Girls Service  Jaipur {8445551418} ❤️PALLAVI VIP Jaipur Call Gir...Russian Call Girls Service  Jaipur {8445551418} ❤️PALLAVI VIP Jaipur Call Gir...
Russian Call Girls Service Jaipur {8445551418} ❤️PALLAVI VIP Jaipur Call Gir...
 
Call Girls Bareilly Just Call 8250077686 Top Class Call Girl Service Available
Call Girls Bareilly Just Call 8250077686 Top Class Call Girl Service AvailableCall Girls Bareilly Just Call 8250077686 Top Class Call Girl Service Available
Call Girls Bareilly Just Call 8250077686 Top Class Call Girl Service Available
 
Premium Call Girls Cottonpet Whatsapp 7001035870 Independent Escort Service
Premium Call Girls Cottonpet Whatsapp 7001035870 Independent Escort ServicePremium Call Girls Cottonpet Whatsapp 7001035870 Independent Escort Service
Premium Call Girls Cottonpet Whatsapp 7001035870 Independent Escort Service
 
Top Rated Bangalore Call Girls Richmond Circle ⟟ 9332606886 ⟟ Call Me For Ge...
Top Rated Bangalore Call Girls Richmond Circle ⟟  9332606886 ⟟ Call Me For Ge...Top Rated Bangalore Call Girls Richmond Circle ⟟  9332606886 ⟟ Call Me For Ge...
Top Rated Bangalore Call Girls Richmond Circle ⟟ 9332606886 ⟟ Call Me For Ge...
 

2007 development of a who growth reference for school aged children and adolescents. bwho

  • 1. Research Development of a WHO growth reference for school-aged children and adolescents Mercedes de Onis,a Adelheid W Onyango,a Elaine Borghi,a Amani Siyam,a Chizuru Nishida a & Jonathan Siekmann a Objective To construct growth curves for school-aged children and adolescents that accord with the WHO Child Growth Standards for preschool children and the body mass index (BMI) cut-offs for adults. Methods Data from the 1977 National Center for Health Statistics (NCHS)/WHO growth reference (1–24 years) were merged with data from the under-fives growth standards’ cross-sectional sample (18–71 months) to smooth the transition between the two samples. State-of-the-art statistical methods used to construct the WHO Child Growth Standards (0–5 years), i.e. the Box-Cox power exponential (BCPE) method with appropriate diagnostic tools for the selection of best models, were applied to this combined sample. Findings The merged data sets resulted in a smooth transition at 5 years for height-for-age, weight-for-age and BMI-for-age. For BMI-for-age across all centiles the magnitude of the difference between the two curves at age 5 years is mostly 0.0 kg/m² to 0.1 kg/m². At 19 years, the new BMI values at +1 standard deviation (SD) are 25.4 kg/m² for boys and 25.0 kg/m² for girls. These values are equivalent to the overweight cut-off for adults (> 25.0 kg/m²). Similarly, the +2 SD value (29.7 kg/m² for both sexes) compares closely with the cut-off for obesity (> 30.0 kg/m²). Conclusion The new curves are closely aligned with the WHO Child Growth Standards at 5 years, and the recommended adult cut-offs for overweight and obesity at 19 years. They fill the gap in growth curves and provide an appropriate reference for the 5 to 19 years age group. Bulletin of the World Health Organization 2007;85:660–667. Une traduction en français de ce résumé figure à la fin de l’article. Al final del artículo se facilita una traducción al español. .‫الرتجمة العربية لهذه الخالصة يف نهاية النص الكامل لهذه املقالة‬ Introduction upward skewness leading to an underes- national growth reference for school- timation of overweight and obesity, and aged children and adolescents.7,8 The The need to develop an appropriate sin- an overestimation of undernutrition.3 experts agreed that appropriate growth gle growth reference for the screening, The reference previously recom- references for these age groups should surveillance and monitoring of school- mended by WHO for children above 5 be developed for clinical and public aged children and adolescents has been years of age, i.e. the National Center for health applications. They also agreed stirred by two contemporary events: the Health Statistics (NCHS)/WHO inter- that a multicentre study, similar to the increasing public health concern over national growth reference,4 has several one that led to the development of the childhood obesity 1 and the April 2006 drawbacks.5 In particular, the body mass WHO Child Growth Standards for 0 to release of the WHO Child Growth index-for-age reference, developed in 5 years, would not be feasible for older Standards for preschool children based 1991,6 only starts at 9 years of age, children, as it would not be possible to on a prescriptive approach.2 As countries groups data annually and covers a lim- control the dynamics of their environ- proceed with the implementation of ited percentile range. Many countries ment. Therefore, as an alternative, the ex- growth standards for children under 5 pointed to the need to have body mass perts suggested that a growth reference years of age, the gap across all centiles index (BMI) curves that start at 5 years be constructed for this age group using between these standards and existing and permit unrestricted calculation of existing historical data and discussed the growth references for older children has percentile and z-score curves on a con- criteria for selecting the data sets. become a matter of great concern. It is tinuous age scale from 5 to 19 years. WHO subsequently initiated a pro- now widely accepted that using descrip- The need to harmonize growth as- cess to identify existing data sets from tive samples of populations that reflect sessment tools conceptually and prag- various countries. This process resulted a secular trend towards overweight and matically prompted an expert group in an initial identification of 115 candi- obesity to construct growth references meeting in January 2006 to evaluate the date data sets from 45 countries, which results inadvertently in an undesirable feasibility of developing a single inter- were narrowed down to 34 data sets a Department of Nutrition, World Health Organization, 20 Avenue Appia, 1211 Geneva 27, Switzerland. Correspondence to Mercedes de Onis (e-mail: deonism@who.int). doi: 10.2471/BLT.07.043497 (Submitted: 25 April 2007 – Final revised version received: 12 July 2007 – Accepted: 15 July 2007 ) 660 Bulletin of the World Health Organization | September 2007, 85 (9)
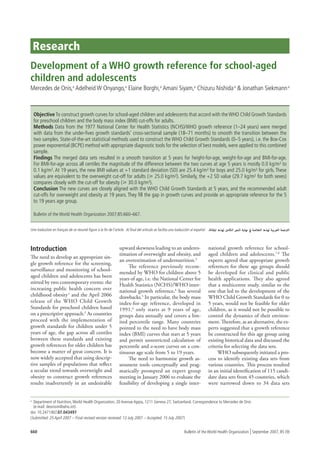
  • 2. Research Mercedes de Onis et al. Growth curves for school-aged children and adolescents from 22 countries that met the inclusion Fig. 1. Comparison between the 1977 and 2007 height-for-age z-score curves criteria developed by the expert group. – boys However, after further review, even these most promising studies showed great 200 heterogeneity in methods and data qual- 2007 3 1977 2 ity, sample size, age categories, socioeco- 190 1 nomic status of participating children 180 0 and various other factors critical to 170 -1 growth curve construction. Therefore, -2 160 it was unlikely that a growth reference Height (cm) -3 constructed from these heterogeneous 150 data sets would agree with the WHO 140 Child Growth Standards at 5 years of 130 age for the different anthropometric indicators needed (i.e. height-for-age, 120 weight-for-age and BMI-for-age). 110 In consequence, WHO proceeded 100 to reconstruct the 1977 NCHS/WHO growth reference from 5 to 19 years, 5 6 7 8 9 10 11 12 13 14 15 16 17 18 19 Age (years) using the original sample (a non-obese sample with expected heights), supple- mented with data from the WHO Child Growth Standards (to facilitate a smooth The total sample size was 22 917 adolescents that accord with the WHO transition at 5 years), and applying the (11 410 boys, 11 507 girls). For the in- Child Growth Standards for preschool state-of-the-art statistical methods 9,10 dicator height-for-age, 8 boys (0.07%), children, we reapplied the state-of-the- used to develop standards for preschool including an 18 month-old with length art statistical methods used to construct 51.6 cm, and 14 girls (0.12%) had the growth standards for children under children, that is, the Box-Cox power outlier height measurements that were 5 years of age.10 The development of exponential (BCPE) method with ap- set to missing in the data set. For the the standards for under-fives followed propriate diagnostic tools for the selec- weight-based indicators (i.e. weight- a methodical process that involved: (a) tion of best models. for-age and BMI-for-age), the same detailed examination of existing meth- The purposes of this paper are to re- cleaning approach used for the con- ods, including types of distributions and port the methods used to reconstruct the struction of the WHO Child Growth smoothing techniques; (b) selection of 1977 NCHS/WHO growth reference, Standards (cross-sectional component) a software package flexible enough to to compare the resulting new curves (the was applied to avoid the influence of allow comparative testing of alternative 2007 WHO reference) with the 1977 unhealthy weights-for-height. 10 As a methods and the actual generation of the NCHS/WHO charts, and to describe result, 321 observations for boys (2.8%) curves; and (c) systematic application of the transition at 5 years of age from the and 356 observations for girls (3.0%) the selected approach to the data to gen- WHO standards for under-fives to these were excluded. erate models that best fitted the data.9 new curves for school-aged children and A smooth transition from the The BCPE method,12 with curve adolescents. WHO Child Growth Standards (0–5 smoothing by cubic splines, was used years) to the reference curves beyond 5 to construct the curves. This method Methods years was provided by merging data from accommodates various kinds of dis- the growth standards’ cross-sectional tributions, from normal to skewed or Sample description sample (18–71 months) with the NCHS kurtotic. After the model was fitted us- The core sample used for the reconstruc- final sample before fitting the new ing the whole age range (18 months to tion of the reference for school-aged growth curves. The growth curves for 24 years), the curves were truncated to children and adolescents (5–19 years) ages 5 to 19 years were thus constructed cover the required age range (i.e. 5–19 was the same as that used for the con- using data from 18 months to 24 years. years for height-for-age and BMI-for- struction of the original NCHS charts, The final sample used for fitting the age, and 5–10 years for weight-for-age), pooling three data sets.11 The first and growth curves included 30 907 observa- thus avoiding the right- and left-edge second data sets were from the Health tions (15 537 boys, 15 370 girls) for the effects.9 Examination Survey (HES) Cycle II height-for-age curves, 30 100 observa- The specifications of the BCPE (6–11 years) and Cycle III (12–17 years). tions (15 136 boys, 14 964 girls) for models that provided the best fit to gen- The third data set was from the Health the weight-for-age curves, and 30 018 erate the growth curves were: and Nutrition Examination Survey observations (15 103 boys, 14 915 girls) (HANES) Cycle I (birth to 74 years), for the BMI-for-age curves. For height-for-age: from which only data from the 1 to 24 BCPE(l = 1, df(m) = 12, df(s) = 4, n = 1, years age range were used. Given the Statistical methods t = 2) for boys similarity of the three data sets,11 the data As the goal was to develop growth BCPE(l = 0.85, df(m) = 10, df(s) = 4, were merged without adjustments. curves for school-aged children and n = 1, t = 2) for girls. Bulletin of the World Health Organization | September 2007, 85 (9) 661
  • 3. Research Growth curves for school-aged children and adolescents Mercedes de Onis et al. For weight-for-age: Fig. 2. Comparison between the 1977 and 2007 height-for-age z-score curves BCPE(l = 1.4, df(m) = 10, df(s) = 8, – girls df(n) = 5, t = 2) for boys BCPE(l = 1.3, df(m) = 10, df(s) = 3, 3 df(n) = 3, t = 2) for girls. 180 2007 1977 2 170 1 For BMI-for-age: 0 BCPE(l = 0.8, df(m) = 8, df(s) = 4, 160 -1 df(n) = 4, t = 2) for boys 150 -2 BCPE(l = 1, df(m) = 8, df(s) = 3, Height (cm) df(n) = 4, t = 2) for girls. -3 140 Where l is the power of the transfor- 130 mation applied to age before fitting the 120 model; df(m) is the degrees of freedom for the cubic splines fitting the median 110 (m); df(s) the degrees of freedom for 100 the cubic splines fitting the coefficient of variation (s); df(n) the degrees of 5 6 7 8 9 10 11 12 13 14 15 16 17 18 19 freedom for the cubic splines fitting the Age (years) Box-Cox transformation power (n) (for height-for-age fixed n = 1); and t is the the +3 standard deviation (SD). The full for boys (Fig. 1) than it is for girls (Fig. parameter related to the kurtosis (in all set of clinical charts and tables displayed 2), especially at the upper end of the three cases fixed t = 2). by sex and age (years and months), per- age range (15–18 years; 18 years is the The selected models for boys and centile and z-score values and related in- maximum age limit of the 1977 curves). girls ultimately simplify to the LMS formation (e.g. LMS values) are provided Differences in boys’ attained height method,13 since it was not necessary to on the WHO web site (http://www.who. z-scores (1977 versus 2007 curves) at 5 model the parameter related to kurtosis. int/growthref/). years are negligible, ranging from 0.1 cm For height-for-age, the data follow the Sex-specific comparisons of the in the curves below the median to 0.3 cm standard normal distribution, so it was 1977 NCHS/WHO reference and the at +2 and +3 SD (Fig. 1). The two sets not necessary to model either the param- newly reconstructed curves are presented of curves follow more variable patterns eter related to skewness or to kurtosis. in the figures for height-for-age, weight- in both shape and the spread of attained for-age and BMI-for-age, respectively. heights as they advance from age 10 years Results to the end of the age range. For example, Percentile and z-score curves and tables Height-for-age at 18 years, the distribution of heights were generated ranging from the 1st to The difference in shape between the from –3 to +3 SD is tighter by 5 cm in the 99th percentile and from the –3 to 1977 and 2007 curves is more evident the 1977 curves compared with those for 2007. Between –3 SD and the me- dian, the 1977 curves are higher by 3.3 Fig. 3. Comparison between the 1977 and 2007 weight-for-age z-score curves cm, 2.4 cm, 1.5 cm and 0.7 cm, respec- – boys tively. Conversely, the 1977 curves above the median are lower than corresponding 3 2007 2007 curves by 0.2 cm (+1 SD), 1.1 cm 1977 (+2 SD) and 2.0 cm (+3 SD). 50 Although the disparity at 5 years 2 between the two sets of girls’ curves (Fig. 2) is greater than that observed for 40 boys, ranging between 0.2 cm (–3 SD) Weight (kg) 1 and 1.7 cm (+3 SD), the curve shapes in 0 later years follow more comparable pat- 30 terns and culminate in a more similar -1 distribution of attained height z-scores -2 between 15 and 18 years of age. As ob- 20 -3 served for boys, the negative SDs and median of the 1977 set at 18 years are higher than their equivalent 2007 curves 5 6 7 8 9 10 by 2.6 cm (–3 SD), 2.0 cm (–2 SD), 1.2 Age (years) cm (–1 SD) and 0.6 cm (median). The 662 Bulletin of the World Health Organization | September 2007, 85 (9)
  • 4. Research Mercedes de Onis et al. Growth curves for school-aged children and adolescents +1 SD curves overlap at 18 years, and Fig. 4. Comparison between the 1977 and 2007 weight-for-age z-score curves in reverse pattern to the negative SDs, – girls the 1977 curves are lower by 0.7 cm (+2 SD) and 1.3 cm (+3 SD). 60 3 2007 1977 Weight-for-age In the lower half of the weight-for-age 50 distribution, the largest difference be- 2 tween the 1977 and 2007 boys’ curves (Fig. 3) is at 10 years of age, where the 40 Weight (kg) 1 2007 curves are higher by 2.9 kg (–3 SD) and 1.1 kg (–2 SD). In the upper 0 half of the distribution, the largest dis- 30 -1 parities between the +1 SD and +2 SD -2 curves are also at age 10 years, but in this 20 -3 case the 1977 curves are higher by 1.7 kg and 1.0 kg. The +3 SD curves present sizeable differences, with the 1977 curve 10 being consistently lower throughout the 5 6 7 8 9 10 Age (years) age range (from 1.6 kg at 5 years to 3.1 kg at 10 years). Girls present similar pat- terns to those observed for boys (Fig. 4). the 2007 curve at 19 years. The patterns For weight-for-age, differences between At the lower bound, disparities are larger observed in the boys’ curves are also the 1977 reference and the WHO stan- for girls than they are for boys. For girls evident among girls (Fig. 6), except that dards at +3 SD were 2.0 kg for boys and at 10 years, the 2007 curves are higher the crossover of the 5th, 15th and 50th 3.5 kg for girls. Since no NCHS-based by 3.7 kg (–3 SD) and 1.4 kg (–2 SD). percentiles occurs at 13 years, and differ- reference values for BMI were available At the upper bound, the largest disparity ences in the 50th and 95th percentiles for ages below 9 years, the table presents for the +3 SD curves is at 5 years, where are slightly larger than corresponding comparative values only for the 2007 the 2007 curve is 3.1 kg above the 1977 differences in the boys’ percentiles. A reconstructed reference and the WHO curve, but the difference decreases to wiggly pattern is noticeable in the 1991 standards at 5 years of age. 1.7 kg at 10 years. The +2 SD curves reference values, particularly in the 50th, The reconstruction resulted in cross between 8 and 9 years. At 5 years, 85th and 95th percentiles. curves that are closely aligned to cor- the 2007 curve is higher by 1.3 kg and, At 19 years of age, the 2007 BMI responding WHO standards at the at 10 years, it is lower than the 1977 values at +1 SD are 25.4 kg/m² for boys junction (5 years). For height-for-age curve by 2.3 kg. and 25.0 kg/m² for girls, while the boys, the three negative SDs are only +2 SD values are 29.7 kg/m² for both 0.1 cm apart, the median and +1 SD BMI-for-age sexes. curves differ by 0.3 cm, and disparities Fig. 5 (boys) and Fig. 6 (girls) show the at +2 SD and +3 SD are 0.4 cm and reference data for BMI-for-age devel- Transition to the 2007 WHO 0.5 cm, respectively. For girls, the differ- ences between the two sets of curves are oped in 1991 that WHO has to date rec- reference at 5 years 0.3 cm or 0.4 cm through the full range ommended for ages 9 to 24 years 6 and A main objective for reconstructing the of z-scores. For weight-for-age, where how they compare with corresponding 1977 NCHS/WHO reference was to differences between the 1977 reference centiles of the newly constructed curves provide a smooth transition from the and the WHO standards at 5 years were in the age period where the two sets WHO standard curves for under-fives considerable, the reconstruction sub- overlap (9–19 years). The 5th, 15th and to the reference curves for older children. stantially reduced differences in the final 50th percentiles for boys (Fig. 5) start at Table 1 presents values at 5 years for the curves. The boys’ medians are equal, 9 years with small differences (0.1 kg/m² various indicators by sex of the 1977 while their negative z-scores differ by 0.1 and 0.2 kg/m²) between the 1991 refer- and 2007 references for school-aged kg or 0.2 kg, and the positive z-scores ence values and the 2007 curves. The children and adolescents, and the WHO by 0.1 kg (+1 SD), 0.3 kg (+2 SD) and two sets then track closely and cross over standards for under-fives. 0.4 kg (+3 SD). Residual differences in at about 17 years, so that by 19 years the Disparities between the 1977 refer- the two sets of curves for girls are in a 2007 percentiles are 0.3 kg/m² or 0.4 ence and the WHO height-for-age and range similar to those in the boys’ curves, kg/m² higher than the 1991 reference weight-for-age standards for girls at 5 which is between 0.0 kg and 0.4 kg. values. The 85th percentile of the 1991 years were larger than those observed The merger of the under-fives reference originates at 0.9 kg/m² above in corresponding boys’ curves. For growth standards’ data (18–71 months) its 2007 equivalent and tracks above it example, the differences in the boys’ with the NCHS core sample to fit the to end at 0.8 kg/m² higher at 19 years. height-for-age curves were at most 0.2 2007 curves for school-aged children For the 95th percentile, the 1991 refer- cm, in contrast to the girls’ curves that and adolescents resulted in a very ence starts at 2.0 kg/m² higher and veers were disparate by as much as 1.7 cm and smooth transition between the WHO upwards, terminating 2.6 units above 2.1 cm at +2 and +3 SD, respectively. Child Growth Standards and the newly Bulletin of the World Health Organization | September 2007, 85 (9) 663
  • 5. Research Growth curves for school-aged children and adolescents Mercedes de Onis et al. constructed references for BMI-for-age. Fig. 5. Comparison between the 1991 and 2007 body mass index-for-age For both boys and girls, differences be- percentile curves – boys tween the two curve sets at 5 years are mostly 0.0 kg/m² or 0.1 kg/m², and never more than 0.2 kg/m². Discussion The need for a widely applicable growth reference for older children and ado- lescents was increasingly recognized by countries attempting to assess the magnitude of the growing public health problem of childhood obesity. This need was reaffirmed by the release of the under-five growth standards. The reconstruction presented in this paper has resulted in growth curves that are closely aligned to the WHO Child Growth Standards at 5 years and as such are a suitable complementary reference for use in school-aged child and adoles- cent health programmes. The various clinical charts and tables provided on the Internet will allow for the practical sion of six percentile curves (5th, 10th, limit of the reference compared with the application of the reference. 25th, 75th, 90th and 95th) and then 2007 curves. The approach used in constructing smoothed by a combination of polyno- When compared to the 1977 the 2007 WHO reference addressed the mial regression and cubic splining tech- NCHS/WHO curves, the differences in limitations of the 1977 NCHS curves niques.14 In the 2007 reconstruction, age the newly reconstructed weight-for-age recognized by the 1993 expert commit- was modelled as a continuous variable, curves are significant in all centiles apart tee 4 that recommended their provisional and the curves were fitted simultane- from the median and the –1 SD curves, use for older children. The height-for- ously and smoothed throughout the age reflecting the important difference in age median curves of the 1977 and 2007 range using cubic splines. Furthermore, curve construction methodology. The references overlap almost completely edge effects were avoided by construct- fact that the median curves of the two with only a slight difference in shape, ing the 2007 curves with data that references overlap almost completely is which is probably due to the different extended beyond the lower and upper reassuring in that the two samples used modelling techniques used. For the age bounds of the final reference curves. for fitting the models are the same within 1977 NCHS/WHO curves, age-specific The latter may explain why the 1977 the healthy range (i.e. middle range of standard deviations from the median NCHS/WHO curves have pronounced the distribution). The methodology were derived from the observed disper- wiggly shapes towards the upper age available at the time of constructing the 1977 curves was limited in its ability to model skewed data.14 Fixing a higher Fig. 6. Comparison between the 1991 and 2007 body mass index-for-age standard deviation distance between the percentile curves – girls curves above the median and a lower one for the curves below, as was done, partially accounted for the skewness in the weight data but failed to model the progressively increasing distances between the SD curves from the lower to the upper tails of the weight-for-age distribution. To fit the skewed data adequately, the LMS method (used in the construction of the 2007 curves and other recently developed weight-based references) fits a Box-Cox normal dis- tribution, which follows the empirical data closely.15–17 The reference data for BMI-for-age recommended by WHO are limited in that they begin only at 9 years of age and cover a restricted distribution range (5th–95th percentiles). The empirical 664 Bulletin of the World Health Organization | September 2007, 85 (9)
  • 6. Research Mercedes de Onis et al. Growth curves for school-aged children and adolescents Table 1. Reference values for height-for-age, weight-for-age and body mass index-for-age at 5 years by sex for the 1977 and 2007 references, and the WHO Child Growth Standards 1977 reference 2007 reference WHO standards a 1977 reference 2007 reference WHO standards a Z-scores Boys Girls Height-for-age (cm) – 3 SD 96.1 96.0 96.1 95.1 94.9 95.2 – 2 SD 100.7 100.6 100.7 99.5 99.6 99.9 – 1 SD 105.3 105.2 105.3 104.0 104.3 104.7 Median 109.9 109.7 110.0 108.4 109.1 109.4 +1 SD 114.5 114.3 114.6 112.8 113.8 114.2 +2 SD 119.1 118.8 119.2 117.2 118.6 118.9 +3 SD 123.7 123.4 123.9 121.6 123.3 123.7 Weight-for-age (kg) – 3 SD 12.3 12.6 12.4 11.9 12.2 12.1 – 2 SD 14.4 14.2 14.1 13.8 13.8 13.7 – 1 SD 16.6 16.1 16.0 15.7 15.8 15.8 Median 18.7 18.3 18.3 17.7 18.1 18.2 +1 SD 21.1 20.9 21.0 20.4 21.0 21.2 +2 SD 23.5 23.9 24.2 23.2 24.5 24.9 +3 SD 25.9 27.5 27.9 26.0 29.1 29.5 Body mass index-for-age (kg/m²) b – 3 SD – 12.1 12.0 – 11.8 11.6 – 2 SD – 13.0 12.9 – 12.8 12.7 – 1 SD – 14.1 14.0 – 13.9 13.9 Median – 15.3 15.2 – 15.2 15.3 +1 SD – 16.6 16.6 – 16.9 16.9 +2 SD – 18.2 18.3 – 18.8 18.8 +3 SD – 20.1 20.3 – 21.3 21.1 a WHO Child Growth Standards for 0–5 years of age.2,10 b For BMI, the 1991 reference data start at 9 years of age.4 reference values were estimated us- used for adults (> 25.0 kg/m²), while for-age is inadequate for monitoring ing data that were grouped by age in the +2 SD value (29.7 kg/m² for both growth beyond childhood due to its years, and then smoothed using locally sexes) compares closely with the cut-off inability to distinguish between relative weighted regression.6 The 2007 recon- for obesity (> 30.0 kg/m²).18 height and body mass, hence the provi- struction permits the extension of the The 2007 height-for-age and BMI- sion here of BMI-for-age to complement BMI reference to 5 years, where the for-age charts extend to 19 years, which height-for-age in the assessment of thin- curves match WHO under-five curves is the upper age limit of adolescence as ness (low BMI-for-age), overweight and almost perfectly. Furthermore, at 19 defined by WHO.19 The weight-for-age obesity (high BMI-for-age) and stunting years of age, the 2007 BMI values for charts extend to 10 years for the ben- (low height-for-age) in school-aged chil- both sexes at +1 SD (25.4 kg/m² for efit of countries that routinely measure dren and adolescents. O boys and 25.0 kg/m² for girls) are only weight and would like to monitor equivalent to the overweight cut-off growth throughout childhood. Weight- Competing interests: None declared. Résumé Mise au point d’une référence de croissance pour les enfants d’âge scolaire et les adolescents Objectif Construire des courbes de croissance pour les enfants Méthodes Les données de référence NCHS/OMS pour la d’âge scolaire et les adolescents concordant avec la Norme OMS croissance (de 1 à 24 ans) de 1977 ont été regroupées avec de croissance de l’enfant pour les enfants d’âge préscolaire et celles de l’échantillon transversal d’enfants de moins de 5 ans avec les points de coupure pour l’indice de masse corporelle (IMC) (18 à 71 mois) utilisé pour la norme de croissance de manière s’appliquant aux adultes. à lisser la transition entre les deux échantillons. Les méthodes Bulletin of the World Health Organization | September 2007, 85 (9) 665
  • 7. Research Growth curves for school-aged children and adolescents Mercedes de Onis et al. statistiques correspondant à l’état de la technique [méthode de 25,4 kg/m² pour les garçons et de 25,0 kg/m² pour les filles. Ces Box-Cox-power-exponential (BCPE), complétée par des outils valeurs concordent avec le point de coupure pour l’excès pondéral permettant de sélectionner les meilleurs modèles], ayant servi à chez l’adulte (> 25,0 kg/m²). De même, les valeurs correspondant construire la norme OMS de croissance de l’enfant (0 à 5 ans), à plus de 2 écarts types (29,7 kg/m² pour les deux sexes) sont très ont été appliquées à cet échantillon combiné. proches du point de coupure pour l’obésité (> 30,0 kg/m²). Résultats La fusion des jeux de données a permis d’obtenir Conclusion Les nouvelles courbes coïncident étroitement à 5 ans une transition plus douce au niveau de 5 ans pour les courbes avec la norme OMS de croissance de l’enfant et à 19 ans avec de taille, de poids et d’IMC en fonction de l’âge. S’agissant de les points de coupure recommandés chez l’adulte pour l’excès l’IMC en fonction de l’âge, sur l’ensemble des centiles, l’ampleur pondéral et l’obésité. Elles comblent les lacunes en matière de de la différence entre les deux courbes à l’âge de 5 ans se situe courbes de croissance et fournissent une référence appropriée principalement entre 0,0 kg/m² et 0,1 kg/m². A 19 ans, les pour la tranche d’âges 5 -19 ans. nouvelles valeurs d’IMC correspondant à un écart type de +1 sont Resumen Elaboración de valores de referencia de la OMS para el crecimiento de escolares y adolescentes Objetivo Elaborar curvas de crecimiento para escolares y una transición suave de la talla para la edad, el peso para la edad adolescentes que concuerden con los Patrones de Crecimiento y el IMC para la edad a los 5 años. Con respecto al IMC para la Infantil de la OMS para preescolares y los valores de corte del edad, la magnitud de la diferencia entre ambas curvas a los 5 años índice de masa corporal (IMC) para adultos. fue generalmente de 0,0 kg/m² a 0,1 kg/m² en todos los centiles. Métodos Se fusionaron los datos del patrón internacional de A los 19 años, los nuevos valores del IMC para +1 desviación crecimiento del National Center for Health Statistics/OMS de estándar (DE) fueron de 25,4 kg/m² para el sexo masculino y de 1977 (1–24 años) con los datos de la muestra transversal de los 25,0 kg/m² para el sexo femenino, es decir, equivalentes al valor de patrones de crecimiento para menores de 5 años (18–71 meses), corte del sobrepeso en adultos (> 25,0 kg/m²). A su vez, el valor con el fin de suavizar la transición entre ambas muestras. A esta correspondiente a +2 DE (29,7 kg/m² en ambos sexos) fue muy muestra combinada se le aplicaron los métodos estadísticos similar al valor de corte de la obesidad (> 30,0 kg/m²). de vanguardia utilizados en la elaboración de los Patrones Conclusión Las nuevas curvas se ajustan bien a los Patrones de Crecimiento Infantil de la OMS (0–5 años), es decir, la de Crecimiento Infantil de la OMS a los 5 años y a los valores transformación de potencia de Box-Cox exponencial, junto con de corte del sobrepeso y de la obesidad recomendados para los instrumentos diagnósticos apropiados para seleccionar los mejores adultos a los 19 años, colman la laguna existente en las curvas de modelos. crecimiento y constituyen una referencia apropiada para el grupo Resultados La fusión de los dos conjuntos de datos proporcionó de 5 a 19 años de edad. ‫ملخص‬ ‫إعداد مؤرش منو مرجعي ملنظمة الصحة العاملية للمراهقني واألطفال‬ ‫الذين هم يف سن الدراسة‬ ‫مبنسب كتلة الجسم نسبة إىل السن، تراوح مقدار الفرق بني املنحنيني عند‬ ،‫الهدف: وضع منحنيات منو للمراهقني واألطفال الذين هم يف سن الدراسة‬ ‫سن الخامسة، يف أغلب األحوال، بني 0.0 كغم/م2 و1.0 كغم/م2 وذلك لجميع‬ ‫تتوافق مع معايـري منظمة الصحة العاملية لنمو الطفل الخاصة باألطفال دون‬ ‫الرشائح املئوية. ويف سن التاسعة عرشة، كانت القيم الجديدة ملنسب كتلة‬ .‫سن املدرسة، وحدود الفصل الخاصة مبنسب كتلة الجسم للكبار‬ /‫الجسم عند االنحراف املعياري +1 هي 4.52 كغم/م2 للفتيان، و0.52 كغم‬ ‫الطريقة: أُدمجت بيانات مقياس النمو املرجعي للمركز الوطني لإلحصاءات‬ ‫م2 للفتيات. وهذه القيم مكافئة لحدود الفصل الخاصة بفرط الوزن لدى‬ ‫الصحية يف منظمة الصحة العاملية لعام 7791 (1 – 42 عاماً)، مع بيانات‬ + ‫الكبار (≥ 0.52 كغم/م2). وعىل نحو مشابه، فإن قيمة االنحراف املعياري‬ –18( ‫عينة املسح املستعرض الخاص مبعايـري منو األطفال دون سن الخامسة‬ ‫2 (7.92 كغم/م2 لكال الجنسني) تضاهئ، إىل حد كبري، الحد الفاصل للسمنة‬ ‫17 شهراً)، لتحقيق االنتقال السلس بني العينتني. وطبِّقت عىل هذه العينة‬ .)2‫(≥ 0.03 كغم/م‬ ‫املشرتكة أحدث الطرق اإلحصائية التي استخدمت إلعداد معايـري منظمة‬ ‫االستنتاج: ترتاصف املنحنيات الجديدة تراصفاً كبرياً مع معايري منظمة‬ ‫الصحة العاملية لنمو الطفل (صفر – 5 سنوات)، مثل طريقة القوة األُسِّ ية‬ ‫الصحة العاملية لنمو الطفل، عند سن الخامسة، ومع حدود الفصل املوىص‬ ،‫)، مع االستعانة باألدوات التشخيصية املالمئة‬BCPE( )) ‫(( بوكس- كوكس‬ ‫بها الخاصة بفرط الوزن والسمنة للكبار عند سن التاسعة عرشة. وهي تسد‬ .‫الختيار أفضل النامذج‬ ‫الفجوة القامئة يف منحنيات النمو، وتوفر مقياساً مرجعياً مالمئاً للفئة العمرية‬ ‫املوجودات: أدت مجموعات البيانات املدمجة إىل تحقيق انتقال سلس عند‬ .‫الواقعة بني سن الخامسة والتاسعة عرشة‬ ،‫سن الخامسة، وذلك يف منحنيات الطول (يف وضعية القيام) نسبة إىل السن‬ ‫والوزن نسبة إىل السن، ومنسب كتلة الجسم نسبة إىل السن. ويف ما يتعلق‬ 666 Bulletin of the World Health Organization | September 2007, 85 (9)
  • 8. Research Mercedes de Onis et al. Growth curves for school-aged children and adolescents References 1. Lobstein T, Baur L, Uauy R. IASO International Obesity Task Force. Obesity in 11. Hamill PV, Drizd TA, Johnson CL, Reed RB, Roche AF. NCHS growth curves for children and young people: a crisis in public health. Obes Rev 2004;5:4-104. children birth-18 years: United States. Vital Health Stat 11 1977;165:i-iv, 2. WHO Multicentre Growth Reference Study Group. WHO Child Growth 1-74. Standards based on length/height, weight and age. Acta Paediatr Suppl 12. Rigby RA, Stasinopoulos DM. Smooth centile curves for skew and kurtotic 2006;450:76-85. data modelled using the Box-Cox power exponential distribution. Stat Med 3. De Onis M. The use of anthropometry in the prevention of childhood 2004;23:3053-76. overweight and obesity. Int J Obes Relat Metab Disord 2004;28:S81-5. 13. Cole TJ, Green PJ. Smoothing reference centile curves: the LMS method and 4. Physical status: the use and interpretation of anthropometry. Report of a penalized likelihood. Stat Med 1992;11:1305-19. WHO Expert Committee. World Health Organ Tech Rep Ser 1995; 14. Dibley MJ, Goldsby JB, Staehling NW, Trowbridge FL. Development of 854:161-262. normalized curves for the international growth reference: historical and 5. Wang Y, Moreno LA, Caballero B, Cole TJ. Limitations of the current World technical considerations. Am J Clin Nutr 1987;46:736-48. Health Organization growth references for children and adolescents. Food 15. Kuczmarski RJ, Ogden CL, Guo SS, Grummer-Strawn LM, Flegal KM, Mei Z, Nutr Bull 2006;27:S175-88. et al. 2000 CDC growth charts for the United States: methods and 6. Must A, Dallal GE, Dietz WH. Reference data for obesity: 85th and 95th development. Vital Health Stat 11 2002;246:1-190. percentiles of body mass index (wt/ht²) and triceps skinfold thickness. Am J 16. Cole TJ, Freeman JV, Preece MA. British 1990 growth reference centiles for Clin Nutr 1991;53:839-46. weight, height, body mass index and head circumference fitted by maximum 7. Butte NF, Garza C, editors. Development of an international growth penalized likelihood. Stat Med 1998;17:407-29. standard for preadolescent and adolescent children. Food Nutr Bull 2006; 17. Fredriks AM, van Buuren S, Burgmeijer RJ, Meulmeester JF, Beuker RJ, 27:S169-326. Brugman E, et al. Continuing positive secular growth change in the 8. Butte NF, Garza C, de Onis M. Evaluation of the feasibility of international Netherlands 1955-1997. Pediatr Res 2000;47:316-23. growth standards for school-aged children and adolescents. J Nutr 2007; 18. Obesity: preventing and managing the global epidemic. Report of a WHO 137:153-57. consultation. World Health Organ Tech Rep Ser 2000;894:1-253. 9. Borghi E, de Onis M, Garza C, Van den Broeck J, Frongillo EA, Grummer- 19. Young people’s health — a challenge for society. Report of a WHO Study Strawn L, et al., for the WHO Multicentre Growth Reference Study Group. Group on young people and Health for All by the Year 2000. World Health Construction of the World Health Organization child growth standards: Organ Tech Rep Ser 1986;731:1-117. selection of methods for attained growth curves. Stat Med 2006;25:247-65. 10. WHO Multicentre Growth Reference Study Group. WHO Child Growth Standards: length/height-for-age, weight-for-age, weight-for-length, weight- for-height and body mass index-for-age: methods and development. Geneva: WHO; 2006. Bulletin of the World Health Organization | September 2007, 85 (9) 667