1. About this ‘Information Reference Book-Volume II’
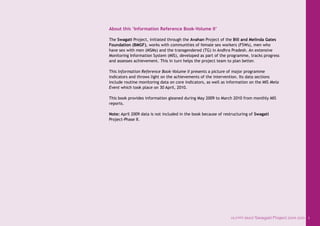
The Swagati Project, initiated through the Avahan Project of the Bill and Melinda Gates
Foundation (BMGF), works with communities of female sex workers (FSWs), men who
have sex with men (MSMs) and the transgendered (TG) in Andhra Pradesh. An extensive
Monitoring Information System (MIS), developed as part of the programme, tracks progress
and assesses achievement. This in turn helps the project team to plan better.
This Information Reference Book-Volume II presents a picture of major programme
indicators and throws light on the achievements of the intervention. Its data sections
include routine monitoring data on core indicators, as well as information on the MIS Mela
Event which took place on 30 April, 2010.
This book provides information gleaned during May 2009 to March 2010 from monthly MIS
reports.
Note: April 2009 data is not included in the book because of restructuring of Swagati
Project-Phase II.
HLFPPT-BMGF Swagati Project2009-2010 1
2. HLFPPT-BMGF Swagati Project2009-2010
Acknowledgements
We would like to thank our district implementing partners in coastal Andhra Pradesh:
Youth Club of Bejjipuram (YCB) and Gunna Udatayya Eternal Service Team (GUEST) in Srikakulam; Resource Education Society (RES) and
Youth for Development of People Organization (YDO) in Vizianagaram; Sravanti Association, Action for Development (AFD) and People’s
Action for Rural Development (PARD) in West Godavari; Integrated for Rural and Urban Development Society (GUIDE) and Ravicherla
Integrated Development and Education Society (RIDES) in Krishna; Society for Integrated Rural Development (SFIRD) Gramasiri, Social
Education and Economic Development Society (SEEDS) and Hands of Compassion (HOC) in Guntur; A Society for the Development of
Agriculture and Youth (EFFORT), Society for Help Entire Lower & Rural People (HELP), Society for Progress, Applied Research and
Education (SPARE) in Prakasam; Navajeevan and Social Activities for Rural Development Society (SARDS) in Nellore; Environment Centre
(EC) and HLFPPT Rajahmundry in East Godavari for providing their monthly data on a regular basis.
We would like to thank the entire HLFPPT team for providing this opportunity and the BMGF Avahan team for their continuous support
and encouragement.
We would also like to thank the entire team of Family Health International (FHI), Andhra Pradesh State AIDS Control Society (APSACS) and
Mukund Soft Pvt. Ltd, Delhi for providing technical support for implementing the Computerized Management Information System (CMIS) in
the programme.
Any Feedback: HLFPPT Swagati M&E Team
Mr.Rajesh Kumar Patra, M&E Specialist
E-mail id: rkpatra@hlfppt.org, rajeshkumarpatra@gmail.com
Team Members
1. Ms.P.Shailaja, Team Leader
2. Mr.Shaju V Joseph, Programme Manager
3. Dr.Laxminarayana, Technical Manager (STI)
4. Mr.J.B.R.Chakravarthy, Capacity Building
Specialist
5. Ms.R.Meher Leela, Finance & Admin Manager
6. Ms.Vijayalakshmi, Advocacy Specialist
7. Mr.N.S.Rao, BCC Specialist
8. Mr.Rajesh Kumar Patra, M&E Specialist
9. Mr.Madhusudhan Rao, Transition Manager
2
10. Mr.Vinay Kumar, Project Officer
11. Mr.Ch.Arjun, Project Officer
12. Mr.R.Manish, Project Officer
13. Mr.Subba Rao, Project Officer
14. Mr.Chiranjeevi Rao, Project Officer
15. Ms.Priyanka Singh, Project Officer
16. Mr.Krishna Madhav, Project Associate
(Documentation)
17. Mr.N.Srinivas, Project Associate (CBO)
18. Ms.Nain Kumari, Project Associate (M&E)
19. Dr.Sri Priya, Technical Officer (Clinic Management)
20. Dr.Rajan Manguesh, Technical Officer (Clinic
Management)
21. Mr.Md.Faheem, Project Associate (M&E)
22. Mr.Arif Hussain, Finance Officer
23. Mr.K.S.R Murthy, Finance Officer
24. Mr.G.Vaneeswara Reddy, Finance Officer
25. Ms.P.Pavani, Admin. Officer
26. Mr.Hema Rao, Project Associate (Advocacy)
3. HLFPPT-BMGF Swagati Project2009-2010 3
Abbreviations
AIDS Acquired Immunodeficiency Syndrome
ANC Antenatal Care
ARD Ano-rectal Discharge
ART Anti-retroviral Therapy
CBO Community-based Organization
FSW Female Sex Worker
GUD Genital Ulcer Disease Hepatic
HIV Human Immunodeficiency Virus
HRG High-risk Group
HSS HIV Sentinel Surveillance
IB Inguinal Bubo
ICTC Integrated Counselling and Testing Centre
IDU Injecting Drug User
LAP Lower Abdominal Pain
M&E Monitoring and Evaluation
MSM Men who have Sex with Men
NACO National Aids Control Organization
NACP National Aids Control Programme
NGO Non-government Organization
ORW Outreach Worker
PE Peer Educator
RMC Regular Medical Check-up
SACS State Aids Control Society
STD Sexually Transmitted Disease
STI Sexually Transmitted Infection
TB Tuberculosis
TI Targeted Intervention
UD Urethral Discharge
VCD Vaginal/Cervical Discharge
5. HLFPPT-BMGF Swagati Project2009-2010
Index Page
Table 1: Estimated and Registered HRG by Interventions 12
Table 1.1: HRG Coverage Range 13
Table 2: HRG-Peer Educator Ratio 14
Table 3: Condom Distribution 15
Table 4: Outreach Work (One-to-one Contact Individuals by Intervention) 24
Table 5: Intensity of One-to-one Contacts 27
Table 6: Clinic Attendees 36
Table 7: Sexually Transmitted Infection Symptomatic Visits 40
Table 8: Regular Medical Check-up 44
Table 9: At least Once Clinic Attendees 50
Table 10: Internal Examination vs. Clinic Attendees 55
Table 11: HIV Testing through ICTC 58
Table 12: Crisis Management 63
Table 13: Project-wise Syphilis Test 71
Table 13.1: Individuals Tested for Syphilis 73
Table 14: STI Syndromes Distribution among FSW/MSM HRGs : May 2009 to March 2010 75
5
6.
7. 7HLFPPT-BMGF Swagati Project2009-2010
HIV Situation in Andhra Pradesh (AP)
The south Indian state of Andhra Pradesh
has a population of over 76 million. Sentinel
Surveillance in various districts of the state
reports Human Immunodeficiency Virus (HIV)
prevalence is around 11.43% among the samples
from Sexually Transmitted Disease (STD) clinic
patients (a potentially high-risk population),
and around 1.21% among those who attend
Antenatal Clinics (ANC) (potentially representing
the currently low-risk general population). Of
the 23 districts in the state, 14 have reported
a generalized HIV epidemic [HIV prevalence
of more than 1% among ANC (APSACS SIMU
Published Report) patients]. Around 91% of
the HIV transmission among ANC cases occurs
through the sexual mode.
It is estimated that more than 1,25,000 FSWs
currently operate in the state. The coastal
region is commercially developed with agro-
based and fishery industries, industrial centres
and ports which dock international vessels.
Eight of the nine coastal districts are reported
to have a generalized HIV epidemic and the
prevalence of STD and HIV among sex workers
in the coastal districts of the state is reported
to be very high. While paid sex is known to
be the key behavioural indicator of high-risk
infection in Andhra Pradesh; the major clients
of sex workers in the state are frequent
travellers, petty businessmen, auto/taxi/bus
drivers, truckers, students and colliery workers.
Swagati Project
Background and Rationale
Swagati project is being implemented by the
Hindustan Latex Family Planning Promotion
Trust (HLFPPT) with the support of the Bill
and Melinda Gates Foundation (BMGF) in
eight districts of coastal Andhra Pradesh.
The project reaches 32,168 members of two
HRGs: FSWs (23,671) and MSMs (8,497).
Project Goal
To reduce the incidence of HIV and STI
among FSWs, MSMs, TGs and their clients in
coastal Andhra Pradesh and thus, reduce the
risk of transmissibility of HIV to the general
population in Andhra Pradesh.
The overall objective is to prevent
transmission of HIV/AIDS and STI among the
target population and its clients. The essential
Swagati programme elements are a peer-led
and risk-based outreach for awareness and
motivation; community-friendly clinics for
Regular Medical Check-up and STI services,
condom distribution, advocacy; a crisis
management system for building confidence;
and mobilization and collectivization of
community.
Swagati Phase I commenced in 2004 and
continued up to April 2009, with separate
interventions and separate administrative
units for FSWs and MSMs with one NGO. The
The agro-based and
fishery industries are also
established in coastal AP.
Eight of the nine coastal
districts are reported to
have a generalized HIV
epidemic.
7HLFPPT-BMGF Swagati Project2009-2010
Graph 1: Estimated HRG
(FSWs and MSMs)
8. 8 HLFPPT-BMGF Swagati Project2009-2010
second phase started in 2009 which is when
the project also got more or less streamlined
with the availability of HRG data in the form
of a Computerized Management Information
System (CMIS). CMIS was stabilized during
Phase II and the quality of outputs also
increased. Monthly data generated through
CMIS proved useful in guiding project
implementation. This book attempts to bring
all relevant data together and draws critical
inferences on project progress.
Clinics are crucial to not just the project’s
success but also toward meeting crucial
National Aids Control Programme (NACP-III)
goals. To this end the project has catered for
four types of clinics.
1. Static Clinic: A regular well-equipped
clinic situated at the project office with
one Medical Officer (MO) and an Auxiliary
Nurse Midwife (ANM) and/or Health
Assistant (HA) to manage the clinic.
2. Outreach Clinic: Ad hoc clinics to cater to
those members of the HRG who live out of
reach of static clinic coverage.
3. Drop-in-Centre Clinic: These clinics
are conducted just like outreach clinics
except they run from Drop-in-Centres.
4. Provider Referral Clinic: It has been
made possible for the HRG at some
locations to choose a local medical
practitioner for STI care. These
practitioners are given an honorarium,
based on the number of cases they see.
An ANM facilitates the running of these
clinics and maintains necessary records.
9. 9HLFPPT-BMGF Swagati Project2009-2010
HIV/AIDS Intervention Coverage in Andhra Pradesh
Adilabad
Nizamabad Karimnagar
Medak
Warangal
Khammam
West
Godavari
East
Godavari
Vishakhapatnam
Vizianagaram
Srikakulam
Krishna
Guntur
Prakasam
Kurnool
Anantapur
Cuddapah
Chittoor
Nellore
Nalgonda
Mahbubnagar
HYDERABAD
Rangareddy
APSACS + AVAHAN-SWAGATI
APSACS + AVAHAN-ALLIANCE
AVAHAN-ALLIANCE
AVAHAN-SWAGATI
8
8
6
1
Note: Vishakhapatnam interventions were transitioned to APSACS during July 2009.
Project Inception by Districts–Phase II
All interventions of Phase II started in April 2009 but these were fully streamlined in May 2009.
10. 10 HLFPPT-BMGF Swagati Project2009-2010
Abstract of Geographical Coverage and Infrastructure
District NGO Town Mandals Village Hotspot
Staff (excluding
the Peer
Educator)
Static Clinics
Drop-in-Centres
(DIC)
Provider Referral
Clinics
West Godavari
Sravanti 4 17 37 52 16 1 1 5
AFD 3 11 13 51 17 2 4 5
PARD 1 16 28 74 14 1 1 11
East Godavari
EC 10 28 124 42 13 1 6 9
HLFPPT-
Rajahmundry
3 9 26 64 11 1 4 5
Krishna
GUIDE 2 17 27 60 15 1 3 13
RIDE 3 17 20 71 22 2 2 13
Guntur
Gramasiri 3 9 27 67 16 2 1 6
SFIRD 4 17 2 72 17 1 2 6
HOC 3 8 7 71 19 2 2 5
SeedS 2 13 1 90 18 2 4 7
Prakasam
Spare 1 7 5 29 14 1 3 6
HELP 1 4 1 21 12 1 3 1
Effort 1 8 1 30 12 1 4 6
Nellore
Navajeevan 2 11 10 50 19 2 4 1
Sards 2 14 130 61 20 2 2 4
Srikakulum
YCB 3 15 16 41 12 1 3 14
Guest 2 22 30 50 16 1 4 7
Vizianagaram
Res 3 22 73 50 14 1 1 3
YDO 3 12 6 69 12 1 1 6
Total 56 277 584 1115 309 27 55 133
This table shows the number of interventions, hotspots (mandals and locally identified locations) covered in each district.
It also provides information on Static Clinics, Drop-in-Centres (DIC) and Provider Referral Clinics.
Clinics in the intervention districts are established for providing care and treatment for STIs.
11. 11HLFPPT-BMGF Swagati Project2009-2010
Analysis of Project Performance
Indicators:May 2009 to March 2010
General Objectives of the Book
The primary overall objective of bringing
out this volume is to critically examine the
programme performance during May 2009 to
March 2010 and analyse various aspects of the
project specific to the indicators.
Specific Objectives of this Information
Reference Book Volume II
1. To understand Peer Educator (PE) - High
Risk Group (HRG) ratio
2. To assess the trend in HRG outreached by
PE
3. To understand the distribution of clinic
attendees by clinic types
4. To see the pattern of STI diagnosis by type
of clinic attendees
5. To assess the trend of Regular Medical
Check-up
6. To plot condom distribution achievement
Methodology
The CMIS has a provision for recording
project operations data on a monthly basis.
MIS Assistants from the project were trained
to do this job in a timely fashion and day-to-
day guidance was provided to them whenever
necessary. Several difficulties were faced
mainly in the form of data inconsistencies
and report formats. Many problems were
sorted out through discussion and corrections
by both HLFPPT and intervention team
members. The following major steps were
involved in compiling MIS and bringing out
reports.
1. Data consolidation by the State Lead
Partner (SLP) team (11 months x 21
projects)
2. Selection of indicators and preparation of
data analysis plan, based on objectives
3. Preparation of simple and necessary tables
4. Generation of necessary important graphs
5. Report preparation
Data Source
The existing CMIS structure evolved over a
period of time. The vision of BMGF-Avahan
and their support to the project through
Family Health International (FHI), along with
technical guidance from Mukund Soft Pvt.
Ltd., helped in realizing Swagati’s dream
of having a database with the facility to
track individual HRG-level performance. The
Monitoring and Evaluation (ME) team has
been in constant communication with Avahan,
FHI and Mukund Soft Pvt. Ltd., in maintaining
and improving the CMIS. The CMIS made it
possible to quickly extract data in various
permutations and combinations. This proved
to be of great value.
We hope the readers of this document will
be able to gather a comprehensive picture of
Swagati.
12. 12 HLFPPT-BMGF Swagati Project2009-2010
Table 1: Estimated and Registered HRG by Interventions
Estimated and Registered HRG (Source: Community-led Social Network Analysis Internal Mapping Study) in April 2009
District Intervention May 09-Oct 09 Oct 09-Dec 09 Jan-10 Feb 10-Mar 10
FSW MSM Total FSW MSM Total FSW MSM Total FSW MSM Total
Srikakulum
YCB 689 500 1189 689 500 1189 689 500 1189 689 500 1189
GUEST 801 408 1209 801 408 1209 801 408 1209 801 408 1209
Vizianagaram
RES 863 555 1418 863 555 1418 863 555 1418 863 555 1418
YDO 874 518 1392 874 518 1392 874 518 1392 874 518 1392
West Godavari
Sravanti 924 479 1403 924 479 1403 924 479 1403 924 479 1403
AFD 1171 469 1640 1171 469 1640 1171 469 1640 1171 469 1640
PARD 886 372 1258 886 372 1258 968 385 1353 968 385 1353
East Godavari
EC 0 1618 1618 0 1618 1618 0 1618 1618 0 1618 1618
HLFPPT-Rajahmundry Implemented from Jan 2010 1269 0 1269 1382 0 1382
Krishna
GUIDE 908 747 1655 908 747 1655 945 747 1692 945 747 1692
RIDES 1300 610 1910 1300 610 1910 1300 610 1910 1300 610 1910
Guntur
Gramasiri 1806 384 2190 1806 384 2190 1806 384 2190 1806 384 2190
SFIRD 1271 731 2002 1271 731 2002 1271 731 2002 1271 731 2002
HOC 1435 553 1988 1435 553 1988 1435 553 1988 1435 553 1988
SEEDS 1543 540 2083 1543 540 2083 1543 540 2083 1543 540 2083
Prakasam
SPARE 930 0 930 930 0 930 930 0 930 930 0 930
HELP 830 0 830 830 0 830 830 0 830 830 0 830
EFFORT 1020 0 1020 1020 0 1020 1020 0 1020 1020 0 1020
Swagati Phase II HRG Coverage
Table 1 below shows that in May 2009, 22
Targeted Intervention (TI) projects were
underway during Swagati Phase II, covering a
population of 33,183 members of HRGs. The
coverage decreased to 30,628 in October
2009 because two TIs of Visakhapatnam
district (with 2,555 HRGs) were transitioned
to APSACS. In January 2010, HLFPPT-
Rajahmundry intervention (1,269 HRG
members) of East Godavari were added on to
the project, increasing the total population.
Consequently, when the year ended, Swagati
had 20 TIs with 32,168 members of HRGs
(23,671 FSWs and 8,497 MSMs) within its fold.
13. 13HLFPPT-BMGF Swagati Project2009-2010
Estimated and Registered HRG (Source: Community-led Social Network Analysis Internal Mapping Study) in April 2009
District Intervention May 09-Oct 09 Oct 09-Dec 09 Jan-10 Feb 10-Mar 10
FSW MSM Total FSW MSM Total FSW MSM Total FSW MSM Total
Nellore
Navajeevan 2092 0 2092 2092 0 2092 2118 0 2118 2118 0 2118
SARDS 2801 0 2801 2801 0 2801 2801 0 2801 2801 0 2801
Vishakhapatnam
SVDS 752 410 1162
Transitioned to APSACS
GSS 560 833 1393
Total 23456 9727 33183 22144 8484 30628 23558 8497 32055 23671 8497 32168
As seen in the above table, there was a cumulative increase in HRG coverage due to the addition of HRGs covered by PARD in West Godavari (the TI
coverage of HRGs increased from 1,258 to 1,353), GUIDE in Krishna (1,655 to 1,692 HRGs) and Navajeevan in Nellore (2,092 to 2,118 HRGs).
Table 1.1: HRG Coverage Range
HRG Range Project
1000 SPARE, HELP
1000-1500 EFFORT, HLFPPT-Rajahmundry, PARD, YCP, GUEST, RES, YDO, Sravanti
1600-2000 AFD, EC, GUIDE, RIDES, HOC
2000 SARDS, Navajeevan, SEEDS, SFIRD, Gramasiri.
Table 1.1 shows that 40% of the target interventions have 1,000 to 1,500 HRG coverage range. While five target interventions have reached out to
more than 2,000 HRGs.
Table 1: Estimated and Registered HRG by Interventions
14. 14 HLFPPT-BMGF Swagati Project2009-2010
Table 2: HRG-Peer Educator Ratio
District NGO May-09 Jun-09 Jul-09 Aug-09 Sep-09 Oct-09 Nov-09 Dec-09 Jan-10 Feb-10 Mar-10 AVG MIN MAX
Srikakulum
YCB 0 44 44 44 44 44 44 44 44 44 44 44 44 44
GUEST 35 35 45 48 48 48 50 50 50 53 50 47 35 53
Vizianagaram
YDO 43 43 43 43 43 49 51 51 51 51 55 48 43 55
RES 57 57 57 57 62 57 57 57 62 62 62 59 57 62
West Godavari
AFD 68 33 33 33 36 36 36 36 36 37 37 39 33 68
Sravanti 0 41 41 61 38 38 38 41 41 41 41 42 38 61
PARD 31 32 36 43 48 50 50 57 47 55 52 46 31 57
East Godavari
HLFPPT-Rajahmundry 0 0 0 0 0 0 0 0 38 41 63 47 38 63
EC 48 48 46 58 54 54 52 54 51 51 56 52 46 58
Krishna
RIDES 52 52 52 52 52 52 50 52 52 52 52 51 50 52
GUIDE 29 38 42 59 47 49 49 49 52 49 50 47 29 59
Guntur
SEEDS 39 39 41 40 48 43 43 43 43 43 43 43 39 48
Gramasiri 48 45 45 44 45 45 45 45 45 45 45 45 44 48
SFIRD 46 46 46 46 46 46 46 46 46 46 46 46 46 46
HOC 45 45 45 45 45 45 45 45 45 45 45 45 45 45
Prakasam
EFFORT 35 35 34 38 39 39 39 39 38 38 38 37 34 39
SPARE 32 32 32 32 32 32 32 32 32 32 32 32 32 32
HELP 42 40 40 46 46 52 52 40 40 40 46 44 40 52
Nellore
SARDS 38 37 36 36 36 37 37 37 37 37 37 37 36 38
Navajeevan 35 35 35 35 30 30 30 30 30 30 30 32 30 35
• Table 2 shows that the average HRG-PE ratio was highest in RES (59) of Vizianagaram, followed by EC (52) of East Godavari and RIDES (51) of
Krishna district.
• The lowest ratio was reported by SPARE (32) of Prakasam district and Navajeevan (32) of Nellore district.
• HELP, SFIRD, SEEDS, Gramasiri, HOC, YDO, GUEST, YCB, Sravanti, PARD, GUIDE and HLFPPT-Rajahmundry had a HRG-PE ratio in the range of 44 to
48; while AFD, EFFORT and SARDS had the ratio in the range of 37 to 39 HRGs.
15. 15HLFPPT-BMGF Swagati Project2009-2010
Table 3: Condom Distribution
District NGO Core Indicators May-09 Jun-09 Jul-09 Aug-09 Sep-09 Oct-09 Nov-09 Dec-09 Jan-10 Feb-10 Mar-10 AVG MIN MAX
Srikakulam
YCB
Estimated HRG 1189 1189 1189 1189 1189 1189 1189 1189 1189 1189 1189 1189 1189 1189
One-one contacted (individuals) 460 963 1011 1182 1176 1186 1185 1183 1187 1184 1182 1082 460 1187
Condom distribution required ideal (estimated HRG) 89175 89175 89175 89175 89175 89175 89175 89175 89175 89175 89175 89175 89175 89175
Condom distribution required minimum (outreach) 34500 72225 75825 88650 88200 88950 88950 88725 89025 88800 88650 81136 34500 89025
Condom distributed 11177 53328 59026 69429 67581 70129 66432 62651 61862 64810 72133 59869 11177 72133
% of condom distributed (against ideal) 13 60 66 78 76 79 74 70 69 73 81 67 13 81
% of condom distributed (against minimum) 32 74 78 78 77 79 75 71 69 73 81 72 32 81
Condom distributed per HRG 9 45 50 58 57 59 56 53 52 55 61 50 9 61
Condom distributed per HRG through clinic visit 4 4 5 7 5 3 3 3 5 5 5 4 3 7
GUEST
Estimated HRG 1209 1209 1209 1209 1209 1209 1209 1209 1209 1209 1209 1209 1209 1209
One-one contacted (individuals) 969 1164 1192 1203 1206 1201 1206 1205 1205 1206 1203 1178 969 1206
Condom distribution required ideal (estimated HRG) 90675 90675 90675 90675 90675 90675 90675 90675 90675 90675 90675 90675 90675 90675
Condom distribution required minimum (outreach) 72675 87300 89400 90225 90450 90075 90450 90375 90375 90450 90225 88364 72675 90450
Condom distributed 16611 88407 71981 75620 77290 95109 99752 100703 100211 103004 101754 84586 16611 103004
% of condom distributed (against ideal) 18 97 79 83 85 105 110 111 111 114 112 93 18 114
% of condom distributed (against minimum) 23 101 81 84 85 106 110 111 111 114 113 94 23 114
Condom distributed per HRG 14 73 60 63 64 79 83 83 83 85 84 70 14 85
Condom distributed per HRG through clinic visit 0 0 0 0 0 0 0 0 0 0 0 0 0 0
Why Condom Promotion is an Essential
Component
Condom-use is critical to a comprehensive,
effective and sustainable approach to HIV
prevention. Hence condom promotion must
be extensive. Condom-use is more likely
when people can access condoms at no cost
or at greatly subsidized prices. Therefore
condoms are expected to meet 100% demand
as a means to ensure the success of the HIV
prevention strategy and to reduce STI among
HRGs.
21. 21HLFPPT-BMGF Swagati Project2009-2010
Table 3 gives information on condom distribution to HRGs
• This table provides information on condom distribution based on the average number of individual sexual acts.
• The highest number of condoms per HRG was distributed in SARDS (91) of Nellore followed by PARD, EFFORT, HOC, SFIRD, GUEST, AFD, Sravanti
interventions where per HRG condom distribution was in the range of 66 to 83 pieces.
• Navajeevan, SPARE, HLFPPT-Rajahmundry, YDO, RES, SEEDS, RIDES, Gramasiri, YCB and HELP reported condom distribution per HRG in the range
of 49 to 63 pieces.
• The lowest number distributed (43) was in GUIDE of Krishna district.
District NGO Core Indicators May-09 Jun-09 Jul-09 Aug-09 Sep-09 Oct-09 Nov-09 Dec-09 Jan-10 Feb-10 Mar-10 AVG MIN MAX
Nellore
Navajeevan
Estimated HRG 2092 2092 2092 2092 2092 2092 2092 2092 2118 2118 2118 2099 2092 2118
One-one contacted (individuals) 0 1743 1821 1699 1968 2048 2029 1965 1974 1982 2008 1749 0 2048
Condom distribution required ideal (estimated HRG) 156900 156900 156900 156900 156900 156900 156900 156900 156900 156900 156900 156900 156900 156900
Condom distribution required minimum (outreach) 0 130725 136575 127425 147600 153600 152175 147375 148050 148650 150600 131161 0 153600
Condom distributed 0 139437 134542 119046 157476 150081 166569 147111 132257 151728 157895 132377 0 166569
% of condom distributed (against ideal) 0 89 86 76 100 96 106 94 84 97 101 84 0 106
% of condom distributed (against minimum) 0 106.664 98.511 93.424 106.691 97.708 109.458 99.820 89.332 102.070 104.843 101 89 109
Condom distributed per HRG 0 66.652 64.312 56.905 75.275 71.740 79.621 70.320 63.220 72.527 75.475 63 0 80
Condom distributed per HRG through clinic visit 0 2.226 3.031 11.168 16.113 16.085 15.959 12.229 7.030 7.891 10.233 9 0 16
SARDS
Estimated HRG 2801 2801 2801 2801 2801 2801 2801 2801 2801 2801 2801 2801 2801 2801
One-one contacted (individuals) 2364 2564 2364 2552 2691 2703 2694 2742 2752 2793 2782 2636 2364 2793
Condom distribution required ideal (estimated HRG) 210075 210075 210075 210075 210075 210075 210075 210075 210075 210075 210075 210075 210075 210075
Condom distribution required minimum (outreach) 177300 192300 177300 191400 201825 202725 202050 205650 206400 209475 208650 197734 177300 209475
Condom distributed 224050 229495 214575 201949 235897 249173 252752 330763 293491 284562 294285 255545 201949 330763
% of condom distributed (against ideal) 106.652 109.244 102.142 96.131 112.291 118.611 120.315 157.449 139.707 135.457 140.085 122 96 157
% of condom distributed (against minimum) 126.367 119.342 121.023 105.511 116.881 122.911 125.093 160.837 142.195 135.845 141.042 129 106 161
Condom distributed per HRG 79.989 81.933 76.606 72.098 84.218 88.958 90.236 118.087 104.780 101.593 105.064 91 72 118
Condom distributed per HRG through clinic visit 3.959 7.789 7.763 4.826 8.470 5.471 5.234 12.728 9.343 11.387 11.414 8 4 13
HLFPPT- SWAGATI
Estimated HRG 30628 30628 30628 30628 30628 30628 30628 30628 32055 32168 32168 31038 30628 32168
One-one contacted (individuals) 14514 24849 27252 27656 28997 29280 29288 29657 30986 30933 31004 27674 14514 31004
Condom distribution required ideal (estimated HRG) 2297100 2297100 2297100 2297100 2297100 2297100 2297100 2297100 2400750 2400750 2400750 2325368 2297100 2400750
Condom distribution required minimum (outreach) 1088550 1863675 2043900 2074200 2174775 2196000 2196750 2224275 2323950 2319975 2325300 2075577 1088550 2325300
Condom distributed 733331 1655849 1860410 1801750 2024639 2155009 2116165 2286088 2246671 2324049 2458135 1969281 733331 2458135
% of condom distributed (against ideal) 32 72 81 79 89 94 93 100 94 97 102 85 32 102
% of condom distributed (against minimum) 67 89 91 87 93 98 96 103 97 100 106 93 67 106
Condom distributed per HRG 24 54 61 59 66 70 69 75 70 73 77 63 24 77
Condom distributed per HRG through clinic visit 2.964 2.654 2.624 2.534 4.441 3.703 3.433 4.127 3.406 4.343 5 4 3 5
Table 3: Condom Distribution
22. 22 HLFPPT-BMGF Swagati Project2009-2010
Month
Estimated
HRG
Ideal Target Minimum Target Distributed
% of Ideal
Target
% of Minimum
Target
Per HRG Distributed
May 2009 30628 2297100 1088550 733331 32 67 24
June 2009 30628 2297100 1863675 1655849 72 89 54
July 2009 30628 2297100 2043900 1860410 81 91 61
Aug 2009 30628 2297100 2074200 1801750 78 87 59
Sep 2009 30628 2297100 2174775 2024639 88 93 66
Oct 2009 30628 2297100 2196000 2155009 94 98 70
Nov 2009 30628 2297100 2196750 2116165 92 96 69
Dec 2009 30628 2297100 2224275 2286088 100 103 75
Jan 2010 32055 2400750 2323950 2246671 94 97 70
Feb 2010 32168 2400750 2319975 2324049 97 100 72
Mar 2010 32168 2400750 2325300 2458135 102 106 76
This table provides information on condom distribution performance against ideal and minimum target of the project during the period May 2009 to
March 2010.
Condoms distributed per HRG, through clinic visits
• The highest number of condoms distributed per HRG through clinic visits was 10 pieces by RES and YDO of Vizianagaram. While Navajeevan of
Nellore distributed nine condoms per HRG through clinic visits.
• SARDS, GUIDE, YCB, SPARE, RIDES, AFD, SEEDS, EFFORT and PARD distributed one to eight condoms through clinics.
• No condom distribution was done through clinics by HLFPPT-Rajahmundry (East Godavari), Sravanti (West Godavari), Gramasiri, SFIRD, HOC
(Guntur), GUEST (Srikakulam) and HELP (Prakasam).
Condom Distribution
23. 23HLFPPT-BMGF Swagati Project2009-2010
The graph shows that the level of condom distribution through clinics is low, probably due the easy access to and availability of condom through outreach.
• The graph also reveals that condom distribution against both ideal and minimum target and per HRG distribution, were steadily in upward trend.
• Per HRG distribution was lowest (24 pieces) in May 2009 and highest (76 pieces) in March 2010.
Graph 2: Condom Promotion
Data reveals that condom distribution
against ideal, minimum and per HRG
distribution targets, displayed a steady
upward trend. 100% distribution was
achieved in the months of December 2009
and March 2010. The lowest percentage
(32%) was recorded in May 2009. This is
due to the restructuring of TIs undertaken
in the beginning of Phase II.
No.ofCondomPieces
Percentage(%)
24. 24 HLFPPT-BMGF Swagati Project2009-2010
Table 4: Outreach Work (One-to-one Contact Individuals by Intervention)
District NGO Core Indicator May-09 Jun-09 Jul-09 Aug-09 Sep-09 Oct-09 Nov-09 Dec-09 Jan-10 Feb-10 Mar-10 AVG MIN MAX
Srikakulam
YCB
Estimated HRG 1189 1189 1189 1189 1189 1189 1189 1189 1189 1189 1189 1189 1189 1189
Outreach 460 963 1011 1182 1176 1186 1185 1183 1187 1184 1182 1082 460 1187
% 39 81 85 99 99 100 100 99 100 100 99 91 39 100
GUEST
Estimated HRG 1209 1209 1209 1209 1209 1209 1209 1209 1209 1209 1209 1209 1209 1209
Outreach 969 1164 1192 1203 1206 1201 1206 1205 1205 1206 1203 1178 969 1206
% 80 96 99 100 100 99 100 100 100 100 100 97 80 100
Vizianagaram
RES
Estimated HRG 1418 1418 1418 1418 1418 1418 1418 1418 1418 1418 1418 1418 1418 1418
Outreach 835 1298 1356 1387 1390 1373 1348 1368 1358 1362 1313 1308 835 1390
% 59 92 96 98 98 97 95 96 96 96 93 92 59 98
YDO
Estimated HRG 1392 1392 1392 1392 1392 1392 1392 1392 1392 1392 1392 1392 1392 1392
Outreach 614 1226 1258 1281 1352 1345 1343 1367 1352 1356 1355 1259 614 1367
% 44 88 90 92 97 97 96 98 97 97 97 90 44 98
West Godavari
AFD
Estimated HRG 1640 1640 1640 1640 1640 1640 1640 1640 1640 1640 1640 1640 1640 1640
Outreach 978 1433 1491 1512 1520 1546 1548 1572 1568 1591 1596 1487 978 1596
% 60 87 91 92 93 94 94 96 96 97 97 91 60 97
Sravanti
Estimated HRG 1403 1403 1403 1403 1403 1403 1403 1403 1403 1403 1403 1403 1403 1403
Outreach 46 1109 1127 1111 1210 1291 1273 1305 1293 1237 1290 1117 46 1305
% 3 79 80 79 86 92 91 93 92 88 92 80 3 93
PARD
Estimated HRG 1258 1258 1258 1258 1258 1258 1258 1258 1353 1353 1353 1284 1258 1353
Outreach 0 437 1122 1290 1231 1343 1266 1306 1206 1256 1232 1063 0 1343
% 0 35 89 103 98 107 101 104 89 93 91 83 0 107
Why Outreach is Important
The objective of outreach is to be in direct
touch with HRG for regular behaviour change
communication and risk appraisal. The service
requirements of the HRG are reassessed
based on such appraisals. This in turn, has a
definite impact on HIV prevention. Outreach
activity by PEs is also a process for their own
empowerment and increases community
and peer group ownership of the project.
According to SACS norms, all HRGs are
expected to be contacted by outreach staff
twice a month. But the Avahan project sets a
much higher target, which is four contacts in a
month i.e., one per week for covering the all
HRGs.
26. 26 HLFPPT-BMGF Swagati Project2009-2010
District NGO Core Indicator May-09 Jun-09 Jul-09 Aug-09 Sep-09 Oct-09 Nov-09 Dec-09 Jan-10 Feb-10 Mar-10 AVG MIN MAX
Prakasam
EFFORT
Estimated HRG 1020 1020 1020 1020 1020 1020 1020 1020 1020 1020 1020 1020 1020 1020
Outreach 17 882 957 974 988 1009 1018 1013 1020 1017 1013 901 17 1020
% 2 86 94 95 97 99 100 99 100 100 99 88 2 100
HELP
Estimated HRG 830 830 830 830 830 830 830 830 830 830 830 830 830 830
Outreach 759 777 774 785 811 813 783 816 793 799 806 792 759 816
% 91 94 93 95 98 98 94 98 96 96 97 95 91 98
SPARE
Estimated HRG 930 930 930 930 930 930 930 930 930 930 930 930 930 930
Outreach 863 919 914 914 923 923 924 930 929 930 930 918 863 930
% 93 99 98 98 99 99 99 100 100 100 100 99 93 100
Nellore
Navajeevan
Estimated HRG 2092 2092 2092 2092 2092 2092 2092 2092 2118 2118 2118 2099 2092 2118
Outreach 0 1743 1821 1699 1968 2048 2029 1965 1974 1982 2008 1749 0 2048
% 0 83 87 81 94 98 97 94 93 94 95 83 0 98
SARDS
Estimated HRG 2801 2801 2801 2801 2801 2801 2801 2801 2801 2801 2801 2801 2801 2801
Outreach 2364 2564 2364 2552 2691 2703 2694 2742 2752 2793 2782 2636 2364 2793
% 84 92 84 91 96 97 96 98 98 100 99 94 84 100
HLFPPT- SWAGATI
Estimated HRG 30628 30628 30628 30628 30628 30628 30628 30628 32055 32168 32168 31038 30628 32168
Outreach 14514 24849 27252 27656 28997 29280 29288 29657 30986 30933 31004 27674 14514 31004
% 47 81 89 90 95 96 96 97 97 96 96 89 47 97
Percentage of outreach against ideal target
• The above table provides information on percentage of outreach against the registered/estimated HRGs. Outreach here stands for the HRG
contacted through one-to-one communication.
• Tracking helps to know the HRG reached with any project service. Such persons are considered as active.
• Outreach rate is the highest in SPARE (99%) of Prakasam.
• EC, GUEST, HELP, HOC, SARDS, Gramasiri, RES, YDO, YCB, AFD and HLFPPT-Rajahmundry had outreach rates in the range of 90% to 97%.
• SFIRD, EFFORT, PARD, RIDES, Navajeevan and Sravanthi were in the range of 80% to 89%.
• Lowest outreach rate was reported by SEEDS and GUIDE (79%) of Guntur and Krishna respectively.
Table 4: Outreach Work (One-to-one Contact Individuals by Intervention)
27. 27HLFPPT-BMGF Swagati Project2009-2010
District NGO Core Indicator May-09 Jun-09 Jul-09 Aug-09 Sep-09 Oct-09 Nov-09 Dec-09 Jan-10 Feb-10 Mar-10 AVG MIN MAX
Srikakulam
YCB
Estimated HRG 1189 1189 1189 1189 1189 1189 1189 1189 1189 1189 1189 1189 1189 1189
Number of HRGs outreach for one time 409 71 31 22 4 7 4 1 2 4 2 51 1 409
Number of HRGs outreach for two times 49 79 65 26 28 19 23 42 31 7 13 35 7 79
Number of HRGs outreach for three times 2 214 261 168 154 138 132 227 172 195 168 166 2 261
Number of HRGs outreach for more than thrice 0 599 654 966 990 1022 1027 913 982 978 999 830 0 1027
% Outreach for one time 34 6 3 2 0 1 0 0 0 0 0 4 0 34
% Outreach for two times 4 7 5 2 2 2 2 4 3 1 1 3 1 7
% Outreach for three times 0 18 22 14 13 12 11 19 14 16 14 14 0 22
% Outreach for more than thrice 0 50 55 81 83 86 86 77 83 82 84 70 0 86
GUEST
Estimated HRG 1209 1209 1209 1209 1209 1209 1209 1209 1209 1209 1209 1209 1209 1209
Number of HRGs outreach for one time 895 19 26 4 18 6 2 2 6 3 5 90 2 895
Number of HRGs outreach for two times 72 51 19 24 42 9 8 3 9 38 6 26 3 72
Number of HRGs outreach for three times 2 160 142 93 173 84 58 66 82 98 83 95 2 173
Number of HRGs outreach for more than thrice 0 934 975 1082 973 1104 1141 1134 1108 1067 1109 966 0 1141
% Outreach for one time 74 2 2 0 1 0 0 0 0 0 0 7 0 74
% Outreach for two times 6 4 2 2 3 1 1 0 1 3 0 2 0 6
% Outreach for three times 0 13 12 8 14 7 5 5 7 8 7 8 0 14
% Outreach for more than thrice 0 77 81 89 80 91 94 94 92 88 92 80 0 94
Vizianagaram
RES
Estimated HRG 1418 1418 1418 1418 1418 1418 1418 1418 1418 1418 1418 1418 1418 1418
Number of HRGs outreach for one time 74 36 39 16 72 38 229 39 36 58 71 64 16 229
Number of HRGs outreach for two times 78 59 85 60 67 73 67 71 64 107 127 78 59 127
Number of HRGs outreach for three times 157 161 172 197 335 384 125 259 254 251 229 229 125 384
Number of HRGs outreach for more than thrice 526 1042 1060 1114 916 878 927 999 1004 946 886 936 526 1114
% Outreach for one time 5 3 3 1 5 3 16 3 3 4 5 5 1 16
% Outreach for two times 6 4 6 4 5 5 5 5 5 8 9 6 4 9
% Outreach for three times 11 11 12 14 24 27 9 18 18 18 16 16 9 27
% Outreach for more than thrice 37 73 75 79 65 62 65 70 71 67 62 66 37 79
YDO
Estimated HRG 1392 1392 1392 1392 1392 1392 1392 1392 1392 1392 1392 1392 1392 1392
Number of HRGs outreach for one time 84 91 118 197 38 31 22 20 89 19 33 67 19 197
Number of HRGs outreach for two times 13 249 133 85 101 57 89 25 61 112 183 101 13 249
Number of HRGs outreach for three times 189 747 294 90 425 260 313 108 89 203 106 257 89 747
Number of HRGs outreach for more than thrice 328 139 713 909 788 997 920 1214 1113 1022 1033 834 139 1214
% Outreach for one time 6 7 8 14 3 2 2 1 6 1 2 5 1 14
% Outreach for two times 1 18 10 6 7 4 6 2 4 8 13 7 1 18
% Outreach for three times 14 54 21 6 31 19 22 8 6 15 8 18 6 54
% Outreach for more than thrice 24 10 51 65 57 72 66 87 80 73 74 60 10 87
Table 5: Intensity of One-to-one Contacts
28. 28 HLFPPT-BMGF Swagati Project2009-201028
District NGO Core Indicator May-09 Jun-09 Jul-09 Aug-09 Sep-09 Oct-09 Nov-09 Dec-09 Jan-10 Feb-10 Mar-10 AVG MIN MAX
West Godavari
AFD
Estimated HRG 1640 1640 1640 1640 1640 1640 1640 1640 1640 1640 1640 1640 1640 1640
Number of HRGs outreach for one time 0 0 170 117 73 78 137 92 72 67 48 78 0 170
Number of HRGs outreach for two times 0 0 373 205 185 144 221 406 214 100 140 181 0 406
Number of HRGs outreach for three times 0 0 458 327 326 329 311 372 299 273 284 271 0 458
Number of HRGs outreach for more than thrice 978 1433 490 863 936 995 879 702 983 1151 1124 958 490 1433
% Outreach for one time 0 0 10 7 4 5 8 6 4 4 3 5 0 10
% Outreach for two times 0 0 23 13 11 9 13 25 13 6 9 11 0 25
% Outreach for three times 0 0 28 20 20 20 19 23 18 17 17 17 0 28
% Outreach for more than thrice 60 87 30 53 57 61 54 43 60 70 69 58 30 87
Sravanti
Estimated HRG 1403 1403 1403 1403 1403 1403 1403 1403 1403 1403 1403 1403 1403 1403
Number of HRGs outreach for one time 44 191 270 198 269 200 128 125 123 173 154 170 44 270
Number of HRGs outreach for two times 2 477 377 372 300 330 246 185 240 190 278 272 2 477
Number of HRGs outreach for three times 0 243 275 359 278 395 329 298 257 311 347 281 0 395
Number of HRGs outreach for more than thrice 0 198 205 182 363 366 570 697 673 563 511 393 0 697
% Outreach for one time 3 14 19 14 19 14 9 9 9 12 11 12 3 19
% Outreach for two times 0 34 27 27 21 24 18 13 17 14 20 19 0 34
% Outreach for three times 0 17 20 26 20 28 23 21 18 22 25 20 0 28
% Outreach for more than thrice 0 14 15 13 26 26 41 50 48 40 36 28 0 50
PARD
Estimated HRG 1258 1258 1258 1258 1258 1258 1258 1258 1353 1353 1353 1284 1258 1353
Number of HRGs outreach for one time 0 163 172 121 45 57 106 66 80 118 81 101 45 172
Number of HRGs outreach for two times 0 101 205 224 154 199 183 216 177 159 156 177 101 224
Number of HRGs outreach for three times 0 97 193 323 306 277 305 307 334 261 350 275 97 350
Number of HRGs outreach for more than thrice 0 76 552 622 726 810 672 717 615 718 645 615 76 810
% Outreach for one time 0 6 44 49 58 64 53 57 45 53 48 48 6 64
% Outreach for two times 0 8 16 18 12 16 15 17 13 12 12 14 8 18
% Outreach for three times 0 8 15 26 24 22 24 24 25 19 26 21 8 26
% Outreach for more than thrice 0 6 44 49 58 64 53 57 45 53 48 48 6 64
Table 5: Intensity of One-to-one Contacts
29. 29HLFPPT-BMGF Swagati Project2009-2010 29
District NGO Core Indicator May-09 Jun-09 Jul-09 Aug-09 Sep-09 Oct-09 Nov-09 Dec-09 Jan-10 Feb-10 Mar-10 AVG MIN MAX
East Godavari
EC
Estimated HRG 1618 1618 1618 1618 1618 1618 1618 1618 1618 1618 1618 1618 1618 1618
Number of HRGs outreach for one time 81 22 9 15 4 13 26 20 41 33 28 27 4 81
Number of HRGs outreach for two times 29 38 66 39 32 47 73 34 92 138 93 62 29 138
Number of HRGs outreach for three times 178 184 205 161 216 196 231 174 333 278 211 215 161 333
Number of HRGs outreach for more than thrice 1126 1274 1304 1395 1365 1353 1278 1363 1148 1141 1262 1274 1126 1395
% Outreach for one time 5 1 1 1 0 1 2 1 3 2 2 2 0 5
% Outreach for two times 2 2 4 2 2 3 5 2 6 9 6 4 2 9
% Outreach for three times 11 11 13 10 13 12 14 11 21 17 13 13 10 21
% Outreach for more than thrice 70 79 81 86 84 84 79 84 71 71 78 79 70 86
HLFPPT-
Rajahmundry
Estimated HRG 1269 1382 1382 1344 1269 1382
Number of HRGs outreach for one time 315 263 319 299 263 319
Number of HRGs outreach for two times 302 287 280 290 280 302
Number of HRGs outreach for three times 255 272 231 253 231 272
Number of HRGs outreach for more than thrice 314 435 385 378 314 435
% Outreach for one time 25 19 23 22 19 25
% Outreach for two times 24 21 20 22 20 24
% Outreach for three times 20 20 17 19 17 20
% Outreach for more than thrice 25 31 28 28 25 31
Krishna
GUIDE
Estimated HRG 1655 1655 1655 1655 1655 1655 1655 1655 1692 1692 1692 1665 1655 1692
Number of HRGs outreach for one time 159 206 124 151 26 90 44 21 40 15 7 80 7 206
Number of HRGs outreach for two times 131 270 224 225 64 62 77 19 40 71 12 109 12 270
Number of HRGs outreach for three times 153 172 250 376 273 171 164 103 177 154 46 185 46 376
Number of HRGs outreach for more than thrice 170 464 685 644 1143 1108 1087 1254 1187 1196 1364 937 170 1364
% Outreach for one time 10 12 7 9 2 5 3 1 2 1 0 5 0 12
% Outreach for two times 8 16 14 14 4 4 5 1 2 4 1 7 1 16
% Outreach for three times 9 10 15 23 16 10 10 6 10 9 3 11 3 23
% Outreach for more than thrice 10 28 41 39 69 67 66 76 70 71 81 56 10 81
RIDES
Estimated HRG 1910 1910 1910 1910 1910 1910 1910 1910 1910 1910 1910 1910 1910 1910
Number of HRGs outreach for one time 461 403 516 492 330 333 253 229 241 341 196 345 196 516
Number of HRGs outreach for two times 387 402 369 429 449 387 353 382 413 441 405 402 353 449
Number of HRGs outreach for three times 267 315 274 306 390 415 492 425 481 425 496 390 267 496
Number of HRGs outreach for more than thrice 98 243 340 338 465 491 562 717 654 531 701 467 98 717
% Outreach for one time 24 21 27 26 17 17 13 12 13 18 10 18 10 27
% Outreach for two times 20 21 19 22 24 20 18 20 22 23 21 21 18 24
% Outreach for three times 14 16 14 16 20 22 26 22 25 22 26 20 14 26
% Outreach for more than thrice 5 13 18 18 24 26 29 38 34 28 37 24 5 38
Table 5: Intensity of One-to-one Contacts
30. 30 HLFPPT-BMGF Swagati Project2009-201030
District NGO Core Indicator May-09 Jun-09 Jul-09 Aug-09 Sep-09 Oct-09 Nov-09 Dec-09 Jan-10 Feb-10 Mar-10 AVG MIN MAX
Guntur
Gramasiri
Estimated HRG 2190 2190 2190 2190 2190 2190 2190 2190 2190 2190 2190 2190 2190 2190
Number of HRGs outreach for one time 302 321 204 109 49 81 67 69 35 53 36 121 35 321
Number of HRGs outreach for two times 624 525 484 375 180 228 232 260 201 241 193 322 180 624
Number of HRGs outreach for three times 481 745 644 739 596 663 882 653 968 541 840 705 481 968
Number of HRGs outreach for more than thrice 55 197 697 860 1283 1166 967 1165 981 1326 1109 891 55 1326
% Outreach for one time 14 15 9 5 2 4 3 3 2 2 2 6 2 15
% Outreach for two times 28 24 22 17 8 10 11 12 9 11 9 15 8 28
% Outreach for three times 22 34 29 34 27 30 40 30 44 25 38 32 22 44
% Outreach for more than thrice 3 9 32 39 59 53 44 53 45 61 51 41 3 61
HOC
Estimated HRG 1988 1988 1988 1988 1988 1988 1988 1988 1988 1988 1988 1988 1988 1988
Number of HRGs outreach for one time 547 185 248 90 124 51 16 4 1 4 0 115 0 547
Number of HRGs outreach for two times 1003 266 395 238 307 153 40 56 24 13 14 228 13 1003
Number of HRGs outreach for three times 0 370 465 410 324 361 286 117 238 166 106 284 106 465
Number of HRGs outreach for more than thrice 0 989 775 988 1164 1382 758 1803 1720 1798 1859 1324 758 1859
% Outreach for one time 28 9 12 5 6 3 1 0 0 0 0 6 0 28
% Outreach for two times 50 13 20 12 15 8 2 3 1 1 1 11 1 50
% Outreach for three times 0 19 23 21 16 18 14 6 12 8 5 13 0 23
% Outreach for more than thrice 0 50 39 50 59 70 38 91 87 90 94 61 0 94
SFIRD
Estimated HRG 2002 2002 2002 2002 2002 2002 2002 2002 2002 2002 2002 2002 2002 2002
Number of HRGs outreach for one time 30 0 0 28 0 0 47 8 24 98 11 22 0 98
Number of HRGs outreach for two times 1780 0 0 123 0 244 120 19 71 9 38 219 0 1780
Number of HRGs outreach for three times 0 0 0 17 0 0 380 105 170 93 177 86 0 380
Number of HRGs outreach for more than thrice 0 1958 2002 1779 2002 1645 1431 1822 1717 1781 1762 1627 0 2002
% Outreach for one time 1 0 0 1 0 0 2 0 1 5 1 1 0 5
% Outreach for two times 89 0 0 6 0 12 6 1 4 0 2 11 0 89
% Outreach for three times 0 0 0 1 0 0 19 5 8 5 9 4 0 19
% Outreach for more than thrice 0 98 100 89 100 82 71 91 86 89 88 81 0 100
SEEDS
Estimated HRG 2083 2083 2083 2083 2083 2083 2083 2083 2083 2083 2083 2083 2083 2083
Number of HRGs outreach for one time 244 154 230 236 183 322 98 20 39 9 52 144 9 322
Number of HRGs outreach for two times 76 161 413 471 345 535 246 95 98 32 27 227 27 535
Number of HRGs outreach for three times 25 220 381 317 504 449 563 449 500 243 68 338 25 563
Number of HRGs outreach for more than thrice 15 274 529 582 704 569 1062 1489 1446 1792 1966 948 15 1966
% Outreach for one time 12 7 11 11 9 15 5 1 2 0 2 7 0 15
% Outreach for two times 4 8 20 23 17 26 12 5 5 2 1 11 1 26
% Outreach for three times 1 11 18 15 24 22 27 22 24 12 3 16 1 27
% Outreach for more than thrice 1 13 25 28 34 27 51 71 69 86 94 46 1 94
Table 5: Intensity of One-to-one Contacts
31. 31HLFPPT-BMGF Swagati Project2009-2010
District NGO Core Indicator May-09 Jun-09 Jul-09 Aug-09 Sep-09 Oct-09 Nov-09 Dec-09 Jan-10 Feb-10 Mar-10 AVG MIN MAX
Prakasam
EFFORT
Estimated HRG 1020 1020 1020 1020 1020 1020 1020 1020 1020 1020 1020 1020 1020 1020
Number of HRGs outreach for one time 0 67 63 89 87 38 39 34 20 23 22 44 0 89
Number of HRGs outreach for two times 0 152 186 146 166 74 113 138 142 69 67 114 0 186
Number of HRGs outreach for three times 0 379 257 273 266 174 132 255 380 148 276 231 0 380
Number of HRGs outreach for more than thrice 0 284 451 466 469 723 734 616 478 777 648 513 0 777
% Outreach for one time 0 7 6 9 9 4 4 3 2 2 2 4 0 9
% Outreach for two times 0 15 18 14 16 7 11 14 14 7 7 11 0 18
% Outreach for three times 0 37 25 27 26 17 13 25 37 15 27 23 0 37
% Outreach for more than thrice 0 28 44 46 46 71 72 60 47 76 64 50 0 76
HELP
Estimated HRG 830 830 830 830 830 830 830 830 830 830 830 830 830 830
Number of HRGs outreach for one time 508 525 507 604 89 60 29 56 76 83 110 241 29 604
Number of HRGs outreach for two times 140 138 150 60 152 168 233 131 136 164 156 148 60 233
Number of HRGs outreach for three times 52 63 62 77 230 222 148 134 241 245 133 146 52 245
Number of HRGs outreach for more than thrice 59 51 55 44 340 363 373 495 341 307 407 258 44 495
% Outreach for one time 61 63 61 73 11 7 3 7 9 10 13 29 3 73
% Outreach for two times 17 17 18 7 18 20 28 16 16 20 19 18 7 28
% Outreach for three times 6 8 7 9 28 27 18 16 29 30 16 18 6 30
% Outreach for more than thrice 7 6 7 5 41 44 45 60 41 37 49 31 5 60
SPARE
Estimated HRG 930 930 930 930 930 930 930 930 930 930 930 930 930 930
Number of HRGs outreach for one time 552 20 19 81 2 1 2 1 0 0 1 62 0 552
Number of HRGs outreach for two times 302 115 74 125 27 6 8 4 21 7 10 64 4 302
Number of HRGs outreach for three times 8 355 238 288 89 41 93 69 122 58 64 130 8 355
Number of HRGs outreach for more than thrice 1 429 583 420 805 875 821 856 786 865 855 663 1 875
% Outreach for one time 59 2 2 9 0 0 0 0 0 0 0 7 0 59
% Outreach for two times 32 12 8 13 3 1 1 0 2 1 1 7 0 32
% Outreach for three times 1 38 26 31 10 4 10 7 13 6 7 14 1 38
% Outreach for more than thrice 0 46 63 45 87 94 88 92 85 93 92 71 0 94
Table 5: Intensity of One-to-one Contacts
32. 32 HLFPPT-BMGF Swagati Project2009-2010
District NGO Core Indicator May-09 Jun-09 Jul-09 Aug-09 Sep-09 Oct-09 Nov-09 Dec-09 Jan-10 Feb-10 Mar-10 AVG MIN MAX
Nellore
Navajeevan
Estimated HRG 2092 2092 2092 2092 2092 2092 2092 2092 2118 2118 2118 2099 2092 2118
Number of HRGs outreach for one time 0 337 450 483 393 361 154 132 102 100 44 232 0 483
Number of HRGs outreach for two times 0 719 686 736 690 701 442 273 428 342 236 478 0 736
Number of HRGs outreach for three times 0 445 485 357 584 698 703 462 903 561 536 521 0 903
Number of HRGs outreach for more than thrice 0 242 200 123 301 288 730 1162 541 979 1192 523 0 1192
% Outreach for one time 0 16 22 23 19 17 7 6 5 5 2 11 0 23
% Outreach for two times 0 34 33 35 33 34 21 13 20 16 11 23 0 35
% Outreach for three times 0 21 23 17 28 33 34 22 43 26 25 25 0 43
% Outreach for more than thrice 0 12 10 6 14 14 35 56 26 46 56 25 0 56
SARDS
Estimated HRG 2801 2801 2801 2801 2801 2801 2801 2801 2801 2801 2801 2801 2801 2801
Number of HRGs outreach for one time 314 326 314 352 286 273 264 159 117 134 44 235 44 352
Number of HRGs outreach for two times 566 446 565 550 649 437 541 326 363 255 252 450 252 649
Number of HRGs outreach for three times 514 627 512 781 766 625 672 441 912 509 587 631 441 912
Number of HRGs outreach for more than thrice 970 1165 973 869 990 1368 1217 1816 1360 1895 1899 1320 869 1899
% Outreach for one time 11 12 11 13 10 10 9 6 4 5 2 8 2 13
% Outreach for two times 20 16 20 20 23 16 19 12 13 9 9 16 9 23
% Outreach for three times 18 22 18 28 27 22 24 16 33 18 21 23 16 33
% Outreach for more than thrice 35 42 35 31 35 49 43 65 49 68 68 47 31 68
HLFPPT-SWAGATI
Estimated HRG 30628 30628 30628 30628 30628 30628 30628 30628 32055 32168 32168 31038 30628 32168
Number of HRGs outreach for one time 4704 3137 3510 3405 2092 2040 1667 1098 1459 1598 1264 2361 1098 4704
Number of HRGs outreach for two times 5252 4248 4869 4513 3938 3873 3315 2685 3127 2782 2686 3753 2685 5252
Number of HRGs outreach for three times 2028 5497 5568 5659 6235 5882 6319 5024 7167 5285 5338 5455 2028 7167
Number of HRGs outreach for more than thrice 4326 11991 13243 14246 16723 17503 17156 20934 19151 21268 21716 16205 4326 21716
% Outreach for one time 15 10 11 11 7 7 5 4 5 5 4 8 4 15
% Outreach for two times 17 14 16 15 13 13 11 9 10 9 8 12 8 17
% Outreach for three times 7 18 18 18 20 19 21 16 22 16 17 18 7 22
% Outreach for more than thrice 14 39 43 47 55 57 56 68 60 66 68 52 14 68
Table 5: Intensity of One-to-one Contacts
33. 33HLFPPT-BMGF Swagati Project2009-2010
Percentage of individuals outreached only once
The table furnishes information on the percentage of HRG met only once through one-to-one
communication, during the year under report. Low percentages across all interventions indicate
that the project met HRGs more than once. This implies robust outreach, since the percentage is
above ten only in six TIs. This is a very good indication of the intensity of outreach coverage.
Percentage of individuals met twice
The table gives the percentage of HRGs contacted only twice. Here too, the percentage is low.
This means that most HRGs were covered more than twice. In other words, the project met the
NACO norm, in this regard.
Percentage of individuals met more than thrice
Here the average percentage is much higher than those met only once, twice and thrice. Five TIs
(SPARE, YCB, EC, SFIRD and GUEST) achieved at least 70%. While it is less than 50% for nine TIs
(Sravanti, PARD, HLFPPT-Rajahmundry, RIDES, Gramasiri, SEEDS, HELP, Navajeevan and SARDS.
The overall picture is impressive because all the TIs report a high percentage of members of the
HRGs met more than thrice in the entire year.
34. 34 HLFPPT-BMGF Swagati Project2009-2010
Graph 4: HRGs and Contact Intensity
Graph 3: Estimated HRG vs. Outreach
The bar graph 3 provides information on
the percentage of outreach against the
registered/estimated HRG.
Swagati data reveal that 81% of HRG, were
covered through one-to-one communication
in June 2009. This soared to 97% in Decem-
ber 2009 and Jan 2010, seeing a marginal
decrease by 1% in February and March 2010.
In fact, from September 2009 onward the
rate consistently stayed in the range of 95%
to 97%.
No.ofHRGs
No.ofHRGs
Percentage(%)
35. 35HLFPPT-BMGF Swagati Project2009-2010
The lowest rate (47%) in May 2009 is attrib-
uted to the restructuring of TIs undertaken in
the beginning of Phase II.
Maximum number of HRGs were reached out
to more than thrice in December 2009, Febru-
ary 2010 and March 2010.
Overall, an average of 52% of HRGs were
contacted more than thrice; 18% contracted
thrice; 12% twice; and 8% contacted only
once.
Graph 5: Percentage of HRGs One-to-one Contact Intensity
120
100
80
60
40
20
0
May-09 Jun-09 Jul-09 Aug-09 Sep-09 Oct-09 Nov-09 Dec-09 Jan-10 Feb-10 Mar-10
% more than three
contacts
% only three
contacts
% only one time
contact
% only two
contacts
14
39
43
47
55 57 56
68 60 66 68
7
18
18 18
20 19 21
16
22
16 1717
14
16
15
13 13
11
9 10
9 8
15
10
11 11
7 7
5 4 5 5 4
36. 36 HLFPPT-BMGF Swagati Project2009-2010
Table 6: Clinic Attendees
District NGO Core Indicator May-09 Jun-09 Jul-09 Aug-09 Sep-09 Oct-09 Nov-09 Dec-09 Jan-10 Feb-10 Mar-10 AVG MIN MAX
Srikakulam
YCB
Estimated HRG 1189 1189 1189 1189 1189 1189 1189 1189 1189 1189 1189 1189 1189 1189
Clinic attendees 65 409 339 280 370 361 374 379 400 333 326 331 65 409
% 5 34 29 24 31 30 31 32 34 28 27 28 5 34
GUEST
Estimated HRG 1209 1209 1209 1209 1209 1209 1209 1209 1209 1209 1209 1209 1209 1209
Clinic attendees 369 348 448 312 366 470 420 391 447 486 431 408 312 486
% 31 29 37 26 30 39 35 32 37 40 36 34 26 40
Vizianagaram
RES
Estimated HRG 1418 1418 1418 1418 1418 1418 1418 1418 1418 1418 1418 1418 1418 1418
Clinic attendees 650 576 519 254 382 427 414 577 433 451 518 473 254 650
% 46 41 37 18 27 30 29 41 31 32 37 33 18 46
YDO
Estimated HRG 1392 1392 1392 1392 1392 1392 1392 1392 1392 1392 1392 1392 1392 1392
Clinic attendees 411 147 269 303 433 471 332 567 387 429 477 384 147 567
% 30 11 19 22 31 34 24 41 28 31 34 28 11 41
West Godavari
AFD
Estimated HRG 1640 1640 1640 1640 1640 1640 1640 1640 1640 1640 1640 1640 1640 1640
Clinic attendees 0 458 440 382 394 533 404 395 444 541 632 420 0 632
% 0 28 27 23 24 33 25 24 27 33 39 26 0 39
Sravanti
Estimated HRG 1403 1403 1403 1403 1403 1403 1403 1403 1403 1403 1403 1403 1403 1403
Clinic attendees 158 214 373 350 377 451 458 365 316 406 496 360 158 496
% 11 15 27 25 27 32 33 26 23 29 35 26 11 35
Why Clinic Attendees are Important
Regular screening of HRGs for STI, followed up with treatment is one of the HIV prevention strategies according to the NACP-III. This indicator
provides information on the number of individuals attending STI clinic by various types of visits. At least 35% HRGs are expected to visit the STI
clinic every month.
Clinical Indicators
Clinical indicator tables display the treatment-seeking behaviour of the community. Regular Medical Check-up (RMC) is an indicator of health-
seeking behaviour and is measured through the number of visits. The ideal frequency is once in three months, even in the absence of STI
symptoms. That Swagati had a consistently high RMC rate is an indication of steady health-seeking behaviour among the HRGs members. It also
affirms that the HRG is empowered with the knowledge of STI symptoms and is aware of the need of an internal examination. The fluctuating trend
in symptomatic visits cannot be ignored, but reasons for these visits have to be further explored.
39. 39HLFPPT-BMGF Swagati Project2009-2010
Graph 6: Clinic Attendees
Bar graph 6 provides information on the
percentage of average clinic attendees.
Swagati data reveal that the percentage
of clinic attendees steadily increased from
May to September 2009 and thereafter, it
remained more or less steady in the range
of 30% to 33% till the end of the year. The
overall increase was by 18% from 15% to 33%
for the year.
The highest rate (33%) of clinic attendees
was found in two months, viz. December
2009 and March 2010, of the year under
report.
There was a marginal decrease in the
percentage of clinic attendees from July to
August 2009.
No.ofHRGs
Percentage(%)
40. 40 HLFPPT-BMGF Swagati Project2009-2010
Table 7: Sexually Transmitted Infection Symptomatic Visits
District NGO Core Indicator May-09 Jun-09 Jul-09 Aug-09 Sep-09 Oct-09 Nov-09 Dec-09 Jan-10 Feb-10 Mar-10 AVG MIN MAX
Srikakulam
YCB
Estimated HRG 1189 1189 1189 1189 1189 1189 1189 1189 1189 1189 1189 1189 1189 1189
STI symptomatic visits 13 53 47 78 27 48 30 22 9 7 12 31 7 78
% 1 4 4 7 2 4 3 2 1 1 1 3 1 7
GUEST
Estimated HRG 1209 1209 1209 1209 1209 1209 1209 1209 1209 1209 1209 1209 1209 1209
STI symptomatic visits 20 77 37 31 8 17 25 11 30 47 27 30 8 77
% 2 6 3 3 1 1 2 1 2 4 2 2 1 6
Vizianagaram
RES
Estimated HRG 1418 1418 1418 1418 1418 1418 1418 1418 1418 1418 1418 1418 1418 1418
STI symptomatic visits 115 101 66 37 35 37 30 44 31 32 34 51 30 115
% 8 7 5 3 2 3 2 3 2 2 2 4 2 8
YDO
Estimated HRG 1392 1392 1392 1392 1392 1392 1392 1392 1392 1392 1392 1392 1392 1392
STI symptomatic visits 22 11 26 30 50 63 36 46 38 46 49 38 11 63
% 2 1 2 2 4 5 3 3 3 3 4 3 1 5
West Godavari
AFD
Estimated HRG 1640 1640 1640 1640 1640 1640 1640 1640 1640 1640 1640 1640 1640 1640
STI symptomatic visits 0 106 94 108 105 119 57 55 77 177 93 90 0 177
% 0 6 6 7 6 7 3 3 5 11 6 5 0 11
Sravanti
Estimated HRG 1403 1403 1403 1403 1403 1403 1403 1403 1403 1403 1403 1403 1403 1403
STI symptomatic visits 56 123 149 131 92 128 83 17 14 20 20 76 14 149
% 4 9 11 9 7 9 6 1 1 1 1 5 1 11
PARD
Estimated HRG 1258 1258 1258 1258 1258 1258 1258 1258 1353 1353 1353 1284 1258 1353
STI symptomatic visits 0 56 102 202 150 68 132 54 31 37 13 77 0 202
% 0 4 8 16 12 5 10 4 2 3 1 6 0 16
East Godavari
EC
Estimated HRG 1618 1618 1618 1618 1618 1618 1618 1618 1618 1618 1618 1618 1618 1618
STI symptomatic visits 17 31 44 42 45 9 20 25 21 23 33 28 9 45
% 1 2 3 3 3 1 1 2 1 1 2 2 1 3
HLFPPT-
Rajahmundry
Estimated HRG 1269 1382 1382 1344 1269 1382
STI symptomatic visits 5 3 20 9 3 20
% 0 0 1 1 0 1
Why Visits to the Clinic are Important
When STI Symptoms Occur
Sex workers constitute one of the most at-risk
groups for transmission of STIs and HIV through
a ‘bridge group’ to the general population.
Therefore, the highest priority is to be given
to this group in targeted interventions for
the prevention of HIV/AIDS. They need to be
put under STI treatment and that helps in
reducing infections and disease-transmission
among the HRGs.
42. 42 HLFPPT-BMGF Swagati Project2009-2010
Table 7 furnishes percentage of STI symptomatic visits
• A decline in the rate of STI symptomatic visits have been reported in all interventions.
• HLFPPT-Rajahmundry of East Godavari had the lowest rate (1%) of STI symptomatic visits.
• The rate was in the range of 2% to 6% for SFIRD (Guntur), Sravanti (West Godavari), SEEDS (Guntur), SARDS (Nellore), GUIDE (Krishna),
Navajeevan (Nellore), AFD (West Godavari), HOC (Guntur), YDO (Vizianagaram) SPARE (Prakasam), PARD (West Godavari), HELP (Prakasam), YCB
(Srikakulam), EC (East Godavari), RES (Vizianagaram), GUEST (Srikakulam) and Gramasiri (Guntur).
• The highest rate (8%) was reported by RIDES of Krishna district.
District NGO Core Indicator May-09 Jun-09 Jul-09 Aug-09 Sep-09 Oct-09 Nov-09 Dec-09 Jan-10 Feb-10 Mar-10 AVG MIN MAX
Nellore
Navajeevan
Estimated HRG 2092 2092 2092 2092 2092 2092 2092 2092 2118 2118 2118 2099 2092 2118
STI symptomatic visits 25 45 41 37 81 60 38 41 71 42 44 48 25 81
% 1 2 2 2 4 3 2 2 3 2 2 2 1 4
SARDS
Estimated HRG 2801 2801 2801 2801 2801 2801 2801 2801 2801 2801 2801 2801 2801 2801
STI symptomatic visits 83 58 111 28 48 37 47 37 38 66 26 53 26 111
% 3 2 4 1 2 1 2 1 1 2 1 2 1 4
HLFPPT- SWAGATI
Estimated HRG 30628 30628 30628 30628 30628 30628 30628 30628 32055 32168 32168 31038 30628 32168
STI symptomatic visits 547 1403 1706 1534 1458 1318 1053 830 759 857 625 1099 547 1706
% 2 5 6 5 5 4 3 3 2 3 2 4 2 6
Table 7: Sexually Transmitted Infection Symptomatic Visits
43. 43HLFPPT-BMGF Swagati Project2009-2010
Graph 7: Treated STI Symptomatic Visits
STI Symptomatic Visits Percentage (%)
547
1403
1706
1534
1458
1318
1053
830
759
857
625
2
5
6
5
5
4
3
3
2
3
2
100
300
500
700
900
1100
1300
1500
1700
1900
May-09 Jun-09 Jul-09 Aug-09 Sep-09 Oct-09 Nov-09 Dec-09 Jan-10 Feb-10 Mar-10
0
1
2
3
4
5
6
Bar graph 7 furnishes the percentage of STI symptomatic visits.
Swagati data reveal that the highest percentage (6%) of symptomatic visits was reported in the month of July 2009.
The percentage of symptomatic visits showed a significantly decreasing trend reaching 2% towards the end of the year. The trend implies the
following:
• the TIs successfully disseminated information on HIV and other STIs; and
• there is steady treatment availability in the clinic.
No.ofSTISymptomaticVisits
Percentage(%)
44. 44 HLFPPT-BMGF Swagati Project2009-2010
Table 8: Regular Medical Check-up
District NGO Core Indicators May-09 Jun-09 Jul-09 Aug-09 Sep-09 Oct-09 Nov-09 Dec-09 Jan-10 Feb-10 Mar-10 AVG MIN MAX
Srikakulam
YCB
RMC visits per month (ideal target) 396 396 396 396 396 396 396 396 396 396 396 396 396 396
RMC visits per month (minimum target) 153 321 337 394 392 395 395 394 396 395 394 361 153 396
RMC visits made 52 354 292 202 339 297 293 306 352 295 303 280 52 354
% RMC visits per month (ideal target) 13 89 74 51 86 75 74 77 89 74 76 71 13 89
% RMC visits per month (minimum target) 34 110 87 51 86 75 74 78 89 75 77 76 34 110
GUEST
RMC visits per month (ideal target) 403 403 403 403 403 403 403 403 403 403 403 403 403 403
RMC visits per month (minimum target) 323 388 397 401 402 400 402 402 402 402 401 393 323 402
RMC visits made 286 263 404 274 348 435 354 360 399 376 347 350 263 435
% RMC visits per month (ideal target) 71 65 100 68 86 108 88 89 99 93 86 87 65 108
% RMC visits per month (minimum target) 89 68 102 68 87 109 88 90 99 94 87 89 68 109
Vizianagaram
RES
RMC visits per month (ideal target) 473 473 473 473 473 473 473 473 473 473 473 473 473 473
RMC visits per month (minimum target) 278 433 452 462 463 458 449 456 453 454 438 436 278 463
RMC visits made 533 474 453 199 343 386 348 490 373 402 446 404 199 533
% RMC visits per month (ideal target) 113 100 96 42 73 82 74 104 79 85 94 86 42 113
% RMC visits per month (minimum target) 191 110 100 43 74 84 77 107 82 89 102 96 43 191
YDO
RMC visits per month (ideal target) 460 460 460 460 460 460 460 460 460 460 460 460 460 460
RMC visits per month (minimum target) 205 409 419 427 451 448 448 456 451 452 452 420 205 456
RMC visits made 385 136 240 262 364 372 277 431 337 356 396 323 136 431
% RMC visits per month (ideal target) 84 30 52 57 79 81 60 94 73 77 86 70 30 94
% RMC visits per month (minimum target) 188 33 57 61 81 83 62 95 75 79 88 82 33 188
Why a Regular Medical Check-up is
Important
Regular Medical Check-up (RMC) helps to
detect problems early and improve the
chances for a proper treatment and cure.
Getting the right screening tests done
gives HRGs the chance of living longer and
healthier life. The RMC decides how often
the HRG needs services based on other high-
risk aspects of their lifestyle. The targeted
interventions are expected to achieve at least
25% RMC in a month and 70% in a quarter.
48. 48 HLFPPT-BMGF Swagati Project2009-2010
Percentage of RMC visits made (against the ideal)
Table 8 provides information on RMC visits by HRGs
• The highest RMC visit rate was reported by GUEST (Srikakulam) with 87%.
• RES (Vizianagaram), SARDS (Nellore), Gramasiri (Guntur), SPARE (Prakasam), HOC (Guntur),
HELP (Prakasam), EC (East Godavari), YCB (Srikakulam), YDO (Vizianagaram) and Guide
(Krishna) had the rate in the range of 70% to 86%.
• RIDES (Krishna), Navajeevan (Nellore), SFIRD (Guntur), EFFORT (Prakasam), SEEDS (Guntur),
Sravanti, PARD and AFD (West Godavari) reported RMC visits in the range of 51% to 68%.
• The lowest rate was reported by HLFPPT-Rajahmundry at 27%.
Percentage of RMC visits made (against minimum)
Table 8 gives the percentage of RMC visits against minimum requirement by HRGs
• Sravanti (West Godavari) with 111% had the highest rate of RMC visits.
• RES (Vizianagaram), GUIDE (Krishna), GUEST (Srikakulam), Gramasiri (Guntur), SARDS (Nellore),
HOC (Guntur), YDO (Vizianagaram), SPARE (Prakasam) and RIDES (Krishna) had it in the range of
81% to 96%.
• Navajeevan (Nellore), SEEDS (Guntur), HELP (Prakasam), YCB (Srikakulam), SFIRD (Guntur),
EC (East Godavari) and EFFORT (Prakasam) reported the RMC visit rate in the range of 66% to
77%.
• The rest had it below 66% but above 30%. The lowest was reported by HLFPPT-Rajahmundry
(East Godavari).
49. 49HLFPPT-BMGF Swagati Project2009-2010
Graph 8: Regular Medical Check-up
3941 6004 6056 5470 7143 7574 8323 8605 8598 8801 9622
39
59 59 54
70 74
82 84 81 83
90
81
72
67
59
74
78
85 87
83 85
93
13
20
20
18
23
25
27 28
27 27
30
0
2000
4000
6000
8000
10000
12000
May-09 Jun-09 Jul-09 Aug-09 Sep-09 Oct-09 Nov-09 Dec-09 Jan-10 Feb-10 Mar-10
0
50
100
150
200
250
RMC visits (ideal) RMC visits (minimum) RMC visits made
% RMC (of ideal) % RMC (of minimum) %RMC (of Estimated pop)
Data reveal that achievement exceeded targets for both month and quarter. In the first quarter, which includes data from the months of May
2009 and June 2009 only, Swagati had an RMC rate of 33%. In the second quarter this went up to 61%. In the third and fourth quarters, the
corresponding rates were 80% and 84% respectively. The percentage of RMC out of the total estimated population was highest in the month of
March 2010 (30%) and was lowest in the month of May 2009 (13%).
The percentage of RMC was found fluctuating against the minimum expected target. The highest (93%) was reported in March 2010, followed by
December 2009 (87%), November 2009 and February 2010 (85%) and less than 80% in the remaining months of the year.
No.ofRMCVisits
Percentage(%)
50. 50 HLFPPT-BMGF Swagati Project2009-2010
Table 9: At-least Once Clinic Attendees
District NGO Core Indicator May-09 Jun-09 Jul-09 Aug-09 Sep-09 Oct-09 Nov-09 Dec-09 Jan-10 Feb-10 Mar-10 AVG MIN MAX
Srikakulam
YCB
Estimated HRG 1189 1189 1189 1189 1189 1189 1189 1189 1189 1189 1189 1189 1189 1189
At least once 65 459 782 1007 1074 1117 1163 1179 1192 1201 1202 949 65 1202
% 5 39 66 85 90 94 98 99 100 101 101 80 5 101
GUEST
Estimated HRG 1209 1209 1209 1209 1209 1209 1209 1209 1209 1209 1209 1209 1209 1209
At least once 304 582 947 1097 1149 1200 1212 1212 1212 1213 1213 1031 304 1213
% 25 48 78 91 95 99 100 100 100 100 100 85 25 100
Vizianagaram
RES
Estimated HRG 1418 1418 1418 1418 1418 1418 1418 1418 1418 1418 1418 1418 1418 1418
At least once 646 1073 1259 1360 1405 1412 1414 1418 1418 1418 1417 1295 646 1418
% 46 76 89 96 99 100 100 100 100 100 100 91 46 100
YDO
Estimated HRG 1392 1392 1392 1392 1392 1392 1392 1392 1392 1392 1392 1392 1392 1392
At least once 398 523 762 973 1141 1285 1314 1328 1330 1332 1333 1065 398 1333
% 29 38 55 70 82 92 94 95 96 96 96 77 29 96
West Godavari
AFD
Estimated HRG 1640 1640 1640 1640 1640 1640 1640 1640 1640 1640 1640 1640 1640 1640
At least once 0 443 816 960 1089 1239 1295 1330 1386 1435 1490 1044 0 1490
% 0 27 50 59 66 76 79 81 85 88 91 64 0 91
Sravanti
Estimated HRG 1403 1403 1403 1403 1403 1403 1403 1403 1403 1403 1403 1403 1403 1403
At least once 138 336 643 892 1022 1187 1307 1381 1391 1404 1402 1009 138 1404
% 10 24 46 64 73 85 93 98 99 100 100 72 10 100
PARD
Estimated HRG 1258 1258 1258 1258 1258 1258 1258 1258 1353 1353 1353 1284 1258 1353
At least once 2 79 226 495 692 812 1088 1157 1199 1212 1244 746 2 1244
% 0 6 18 39 55 65 86 92 89 90 92 57 0 92
East Godavari
EC
Estimated HRG 1618 1618 1618 1618 1618 1618 1618 1618 1618 1618 1618 1618 1618 1618
At least once 279 582 867 1060 1169 1238 1362 1530 1557 1573 1576 1163 279 1576
% 17 36 54 66 72 77 84 95 96 97 97 72 17 97
HLFPPT-
Rajahmundry
Estimated HRG 1269 1382 1382 1344 1269 1382
At least once 99 177 364 213 99 364
% 8 13 26 16 8 26
‘At-least Once’ Clinic Attendees:
An Important Indicator!
The intervention targets for clinical
assessment of HRG’s sexual health in every
quarter is a very important indicator. Most
HRGs infected with STDs did not attend clinics
despite the low-cost and effective treatment
availability.