SlideShare uma empresa Scribd logo
1 de 7
Baixar para ler offline
Philadelphia Housing Market: Should I Buy?

                                                               Kevin C. Gillen, PhD
Fact #1: Since the bursting of the national housing bubble, house prices in Philadelphia have
fallen by much less than most other major U.S. cities1.

                                                House Price Appreciation 1987-2008:
                                                 Philadelphia v. 10-City Composite
    390.0


    340.0
                                         10-City Composite*

                                         Philadelphia
    290.0


    240.0
                    % Change                     10-City                     Philadelphia
                    1998 to Peak:                +174%                       +154%
    190.0           From Peak:                   -24.4%                      -10.1%


    140.0


      90.0
             1987
                    1988
                           1989
                                  1990
                                         1991
                                                 1992
                                                        1993
                                                               1994
                                                                      1995
                                                                             1996
                                                                                    1997
                                                                                           1998
                                                                                                  1999
                                                                                                         2000
                                                                                                                2001
                                                                                                                       2002
                                                                                                                              2003
                                                                                                                                     2004
                                                                                                                                            2005
                                                                                                                                                   2006
                                                                                                                                                          2007
                                                                                                                                                                 2008
    *The 10-City Composite Index includes Boston, Chicago, Denver, Las Vegas, Los Angeles, Miami, New York, San Diego, San
    Francisco and Washington DC. It does not include Philadelphia.


          This chart shows how house prices have changed in Philadelphia since 1987, compared to the
     •
          top ten largest U.S. cities.

          The red line represents the path of house price appreciation for the average Philadelphia
     •
          dwelling, while the black line represents the path of house price appreciation for the ten-city
          average.

          Since the peak of the bubble, house prices in the other ten cities have fallen by nearly 25%,
     •
          while house values in Philadelphia have declined by only 10%.

1
 Sources: Philadelphia House Price Index: Kevin C. Gillen PhD; 10-City Composite Index: Case-Shiller MacrMarkets
LLC.

                                                                                    1
Fact #2: Compared to most other U.S. cities, Philadelphia is near the bottom of the range of
house price declines2.

                 Cumulative %Decline in House Prices from Peak


     0.0%

     -5.0%
           -4.6%
                -5.8%
                     -8.0%
    -10.0%
                          -10.1%
                               -10.8%
                                    -11.4%
                                         -11.9%
                                              -11.9%
                                                   -12.2%
                                                        -12.8%
    -15.0%                                                   -13.7%

    -20.0%
                                                                  -20.7%
    -25.0%
                                                                       -26.3%
    -30.0%
                                                                            -30.5%
                                                                                 -32.2%
    -35.0%
                                                                                      -34.4%
                                                                                           -36.1%
                                                                                                -36.4%
    -40.0%                                                                                           -38.3%
                                                                                                          -39.3%
                                                                                                               -40.6%
    -45.0%


             This chart shows how much house prices have fallen in large U.S. cities from their peak, since
      •
             the bursting of the housing bubble.

             House prices in Philadelphia have declined by an average of 10.1% since their peak in 2006.
      •

             Compared to Philadelphia, seventeen cities have had larger cumulative price declines, while only
      •
             three cities have had smaller cumulative price declines.

             At the most extreme, house prices in the sunbelt cities of Phoenix, Las Vegas, Miami and San
      •
             Diego have fallen by over 30%. This is more than three times greater than house prices in
             Philadelphia have declined.

2
 Sources: Philadelphia: empirically estimated by Kevin C. Gillen PhD; All other cities courtesy Case-Shiller
MacroMarkets LLC.


                                                          2
Fact #3: House prices in Philadelphia are not expected to decline much further3.


                  Housing: Percent Over/Under-valued, by Mid-
                                  Atlantic City
                  Atlantic City NJ                                                                 43%
                      Vineland NJ                                                30%
                   Ocean City NJ                                       23%
                           York PA                             18%
                         Dover DE                              18%
                       Camden NJ                    10%
                       Reading PA                  9%
                    Allentown PA                   9%
                     Lancaster PA                 9%
                         Baltimore                9%
                 Washington, D.C.                 8%
                   Harrisburg PA                7%
                      Scranton PA              6%
                      Lebanon PA              5%
                  Philadelphia PA          2%
                  Wilmington DE            2%
                        Newark NJ         1%
                    -2% York NY
                     New
                       -5%
                        Trenton NJ
                -10%
                   Pittsburgh PA

     -20%           -10%             0%              10%       20%           30%           40%           50%


            This chart ranks cities in the Mid-Atlantic by the degree to which their housing stock is currently
       •
            considered over- or under-valued. The ranking is obtained by comparing local house prices in
            each city to their fundamental drivers, such as rents, population growth and incomes.

            Currently, Philadelphia’s housing is considered over-valued by just 2%.
       •

            By contrast, homes in the South Jersey markets of Atlantic City, Ocean City and Vineland are
       •
            considered over-valued by more than 20%.

            This suggests that house prices in Philadelphia are not expected to decline by much further, if at
       •
            all.


3
    Source: NationalCity/GlobalInsight, Dec. 2008.


                                                           3
Fact #4: Philadelphia has experienced significantly less foreclosure activity than other large
U.S. cities4.

                     Foreclosure Rates by U.S. Metro Area as of 2008Q4
                                STOCKTON
                      LAS VEGAS/PARADISE
               RIVERSIDE/SAN BERNARDINO
                           PHOENIX/MESA
                                    MIAMI
              DETROIT/LIVONIA/DEARBORN
                                SAN DIEGO
        ATLANTA/SANDY SPRINGS/MARIETTA
                         DENVER/AURORA
                          WASHINGTON DC
                 LOS ANGELES/LONG BEACH
                                 CHICAGO
                                  NEWARK
                                  CAMDEN
                                  ST LOUIS
                          BOSTON/QUINCY
                                   DALLAS
                      BALTIMORE/TOWSON
                           SAN FRANCISCO
                            PHILADELPHIA
                              PITTSBURGH
                          WILMINGTON DE
                                  BUFFALO
          NEW YORK/WAYNE/WHITE PLAINS
       SCRANTON/WILKES/BARRE/HAZLETON
          ALLENTOWN/BETHLEHEM/EASTON

                                         0.00%   2.00%      4.00%       6.00%       8.00%      10.00%


           This chart ranks major U.S. cities by their current foreclosure rate. The foreclosure rate
      •
           is computed as the percent of all households in a metropolitan which are in the process
           of foreclosure.

           As of 2008Q4, less than one percent of all households in the Philadelphia region were in
      •
           foreclosure.

           This is a fraction of what the foreclosure rate is in cities that have experienced severe
      •
           house price declines, such as Las Vegas (9%), Phoenix (6%), Miami (5%) and Detroit
           (4.5%).

           This suggests a relatively stable outlook for house prices in Philadelphia.
      •

4
    Source: www.realtrytrac.com

                                                    4
Fact #5: The decline in Philadelphia’s house prices has actually made homes more
affordable—and hence more accessible5.


                    Philadelphia Housing Affordability* Index: 1980-2008
    2.75

    2.50

    2.25

    2.00

    1.75

    1.50

    1.25

    1.00

    0.75

    0.50
            1980
            1981
            1982
            1983
            1984
            1985
            1986
            1987
            1988
            1989
            1990
            1991
            1992
            1993
            1994
            1995
            1996
            1997
            1998
            1999
            2000
            2001
            2002
            2003
            2004
            2005
            2006
            2007
            2008
           This chart plots the affordability of the average Philadelphia home to the average Philadelphia
       •
           households. Affordability is measured as the ratio of the average Philadelphia house price to
           the to the average Philadelphia family income. High values of the index mean that housing has
           become less affordable to the average Philadelphian.

           At the peak of the bubble in 2006, the typical Philadelphia home had a price that was more than
       •
           2.5 times the typical Philadelphia household income. Currently, the typical Philadelphia home
           has a price that is only 2.25 times the typical Philadelphia household’s income.

           Since local house prices have fallen by more than local incomes in recent years, more homes
       •
           have moved into the range of affordability for more Philadelphia households.


5
    Sources: Kevin C. Gillen PhD, U.S. Bureau of Labor Statistics.

                                                             5
Fact #6: There is still an above-average supply of homes for Philadelphia homebuyers to
choose from6.


                                                Philadelphia Houses Listed For Sale: Inventory v. Sales Rate
    14,000                                                                                                                      30.0%
                                                                                                  # Houses Listed For Sale
                                                                                                  % Sold
    12,000
                                                                                                                                25.0%
    # Homes Listed quot;For Salequot;


                                                                                                                                     %Sold = (#Sales/#Listings)
    10,000
                                                                                                                                20.0%


            8,000

                                                                                                                                15.0%

            6,000


                                                                                                                                10.0%
            4,000


                                                                                                                                5.0%
            2,000


                                0                                                                                               0.0%


                                    This chart shows the number of homes in Philadelphia listed “For Sale” in every month since
                          •
                                    2001, as represented by the red bars. The blue line represents the percent of homes listed for
                                    sale that actually sold in each month.
                                    Since 2005, inventories of listed homes have doubled from their historical average. As the
                          •
                                    supply of homes has risen faster than the number of buyers, the rate at which homes have sold
                                    has plummeted from their pre-bubble peak.
                                    Although there remain more homes for sale than buyers, the supply of listed homes has begun
                          •
                                    to fall in recent months.
                                    This suggests that, while there still remains an above-average supply of homes for buyers to
                          •
                                    choose from, this has begun to change in favor of sellers.


6
    Source: TrendMLS, courtesy of www.developphilly.com


                                                                               6
Summary:

        House price declines have been very modest in Philadelphia compared to other U.S. cities.
    •

        Most other U.S. cities have experienced house price declines of a significantly larger magnitude
    •
        than Philadelphia has.

        Independent analysis suggests that the typical Philadelphia house is fairly valued, with no
    •
        expectation of large future declines.

        Philadelphia’s foreclosure rate remains well below that of other large U.S. cities.
    •

        The modest decline in Philadelphia house prices that has occurred has actually made more
    •
        homes more affordable to more households.

         While the above-average number of homes listed for sale still gives buyers plenty to choose
    •
        from, this has begun to recently change direction.


Taken collectively, the facts suggest that Philadelphia’s housing market is much more stable than many
other U.S. cities. There is little evidence to suggest that Philadelphia has or will experience the dramatic
price declines that many other markets have. While the current supply of homes does exceed the
current number of willing and able buyers, supply is currently declining. This suggests that probability of
dramatic future price declines is relatively small, while the probability of fewer homes to choose from is
growing.

Combined with the fact that mortgage rates are at historic lows, there is little evidence to indicate
that there are any significant advantages to waiting to buy a home in Philadelphia in the current
market.


                                                     7

Mais conteúdo relacionado

Mais procurados

Credit Suisse Chemical and Ag Science Conference
	 Credit Suisse Chemical and Ag Science Conference	 Credit Suisse Chemical and Ag Science Conference
Credit Suisse Chemical and Ag Science Conferencefinance5
 
Developing a Native Advertising Product
Developing a Native Advertising ProductDeveloping a Native Advertising Product
Developing a Native Advertising ProductJack Krawczyk
 
From Oecd To SNR
From Oecd To SNRFrom Oecd To SNR
From Oecd To SNR30088
 
Innovation and economic wellbeing
Innovation and economic wellbeingInnovation and economic wellbeing
Innovation and economic wellbeingStavros A. Zenios
 
Semicon Greater China Presentation Complete Eng (2)
Semicon Greater China   Presentation Complete Eng (2)Semicon Greater China   Presentation Complete Eng (2)
Semicon Greater China Presentation Complete Eng (2)MarcVanWonterghem
 
Leslie Appleton Young 2012 Forecast
Leslie Appleton Young 2012 ForecastLeslie Appleton Young 2012 Forecast
Leslie Appleton Young 2012 Forecastrllifestyles
 
2012 Real Estate Market Update
2012 Real Estate Market Update2012 Real Estate Market Update
2012 Real Estate Market UpdateSDM: Music Venture
 
PowerPoint Slide Makeover #75: Transforming Data Dump Slides
PowerPoint Slide Makeover #75: Transforming Data Dump SlidesPowerPoint Slide Makeover #75: Transforming Data Dump Slides
PowerPoint Slide Makeover #75: Transforming Data Dump SlidesDave Paradi
 
BRAR-The Economy and Housing Market - Nov 3
BRAR-The Economy and Housing Market - Nov 3BRAR-The Economy and Housing Market - Nov 3
BRAR-The Economy and Housing Market - Nov 3kfisher181
 
Prof. Gino Van Ossel: Simplicity or the shopper in control?
Prof. Gino Van Ossel: Simplicity or the shopper in control?Prof. Gino Van Ossel: Simplicity or the shopper in control?
Prof. Gino Van Ossel: Simplicity or the shopper in control?Vlerick_Alumni
 
Lawrence Casalino: what GP consortia might learn from the US
Lawrence Casalino: what GP consortia might learn from the USLawrence Casalino: what GP consortia might learn from the US
Lawrence Casalino: what GP consortia might learn from the USNuffield Trust
 
capital oneSanford C. Bernstein & Co. Strategic Decisions Conference Presenta...
capital oneSanford C. Bernstein & Co. Strategic Decisions Conference Presenta...capital oneSanford C. Bernstein & Co. Strategic Decisions Conference Presenta...
capital oneSanford C. Bernstein & Co. Strategic Decisions Conference Presenta...finance13
 
Lesson 8 presentation
Lesson 8 presentationLesson 8 presentation
Lesson 8 presentationrhernande128
 
Medicon Valley and Life science cluster in Denmark
Medicon Valley and Life science cluster in DenmarkMedicon Valley and Life science cluster in Denmark
Medicon Valley and Life science cluster in DenmarkPramila Das
 
environmental protection in Shanghai(上海环保)
environmental protection in  Shanghai(上海环保)environmental protection in  Shanghai(上海环保)
environmental protection in Shanghai(上海环保)hong749
 
Housing Market Outlook and Affordable Housing in the Twin Cities Metro
Housing Market Outlook and Affordable Housing in the Twin Cities MetroHousing Market Outlook and Affordable Housing in the Twin Cities Metro
Housing Market Outlook and Affordable Housing in the Twin Cities Metrosotatodd
 
Housing And Labor Market Trends:Nevada
Housing And Labor Market Trends:NevadaHousing And Labor Market Trends:Nevada
Housing And Labor Market Trends:NevadaTodd A. Yankov
 

Mais procurados (20)

Credit Suisse Chemical and Ag Science Conference
	 Credit Suisse Chemical and Ag Science Conference	 Credit Suisse Chemical and Ag Science Conference
Credit Suisse Chemical and Ag Science Conference
 
The Race for Global Innovation Advantage and U.S. Economic Prospects
The Race for Global Innovation Advantage and U.S. Economic ProspectsThe Race for Global Innovation Advantage and U.S. Economic Prospects
The Race for Global Innovation Advantage and U.S. Economic Prospects
 
Developing a Native Advertising Product
Developing a Native Advertising ProductDeveloping a Native Advertising Product
Developing a Native Advertising Product
 
From Oecd To SNR
From Oecd To SNRFrom Oecd To SNR
From Oecd To SNR
 
Innovation and economic wellbeing
Innovation and economic wellbeingInnovation and economic wellbeing
Innovation and economic wellbeing
 
Semicon Greater China Presentation Complete Eng (2)
Semicon Greater China   Presentation Complete Eng (2)Semicon Greater China   Presentation Complete Eng (2)
Semicon Greater China Presentation Complete Eng (2)
 
Leslie Appleton Young 2012 Forecast
Leslie Appleton Young 2012 ForecastLeslie Appleton Young 2012 Forecast
Leslie Appleton Young 2012 Forecast
 
2012 Real Estate Market Update
2012 Real Estate Market Update2012 Real Estate Market Update
2012 Real Estate Market Update
 
PowerPoint Slide Makeover #75: Transforming Data Dump Slides
PowerPoint Slide Makeover #75: Transforming Data Dump SlidesPowerPoint Slide Makeover #75: Transforming Data Dump Slides
PowerPoint Slide Makeover #75: Transforming Data Dump Slides
 
BRAR-The Economy and Housing Market - Nov 3
BRAR-The Economy and Housing Market - Nov 3BRAR-The Economy and Housing Market - Nov 3
BRAR-The Economy and Housing Market - Nov 3
 
Prof. Gino Van Ossel: Simplicity or the shopper in control?
Prof. Gino Van Ossel: Simplicity or the shopper in control?Prof. Gino Van Ossel: Simplicity or the shopper in control?
Prof. Gino Van Ossel: Simplicity or the shopper in control?
 
Lawrence Casalino: what GP consortia might learn from the US
Lawrence Casalino: what GP consortia might learn from the USLawrence Casalino: what GP consortia might learn from the US
Lawrence Casalino: what GP consortia might learn from the US
 
Local Foods Strengthen Your Local Economy
Local Foods Strengthen Your Local EconomyLocal Foods Strengthen Your Local Economy
Local Foods Strengthen Your Local Economy
 
capital oneSanford C. Bernstein & Co. Strategic Decisions Conference Presenta...
capital oneSanford C. Bernstein & Co. Strategic Decisions Conference Presenta...capital oneSanford C. Bernstein & Co. Strategic Decisions Conference Presenta...
capital oneSanford C. Bernstein & Co. Strategic Decisions Conference Presenta...
 
Lesson 8 presentation
Lesson 8 presentationLesson 8 presentation
Lesson 8 presentation
 
Sales instit pres
Sales instit presSales instit pres
Sales instit pres
 
Medicon Valley and Life science cluster in Denmark
Medicon Valley and Life science cluster in DenmarkMedicon Valley and Life science cluster in Denmark
Medicon Valley and Life science cluster in Denmark
 
environmental protection in Shanghai(上海环保)
environmental protection in  Shanghai(上海环保)environmental protection in  Shanghai(上海环保)
environmental protection in Shanghai(上海环保)
 
Housing Market Outlook and Affordable Housing in the Twin Cities Metro
Housing Market Outlook and Affordable Housing in the Twin Cities MetroHousing Market Outlook and Affordable Housing in the Twin Cities Metro
Housing Market Outlook and Affordable Housing in the Twin Cities Metro
 
Housing And Labor Market Trends:Nevada
Housing And Labor Market Trends:NevadaHousing And Labor Market Trends:Nevada
Housing And Labor Market Trends:Nevada
 

Semelhante a April 2009 Philadelphia Housing Market

Comparative economicanalysis
Comparative economicanalysisComparative economicanalysis
Comparative economicanalysisSamaye Jamaica
 
2003 Soa.Washington.Low Rate
2003 Soa.Washington.Low Rate2003 Soa.Washington.Low Rate
2003 Soa.Washington.Low Ratepinchung
 
Heesen san diego venture group - 2012-01-24
Heesen   san diego venture group - 2012-01-24Heesen   san diego venture group - 2012-01-24
Heesen san diego venture group - 2012-01-24San Diego Venture Group
 
MyTownCryer Mid Year 2010 Analysis
MyTownCryer Mid Year 2010 AnalysisMyTownCryer Mid Year 2010 Analysis
MyTownCryer Mid Year 2010 AnalysisTom Cryer
 
Navigating the Storm: The Impact of the Economic Crisis and Strategic Respons...
Navigating the Storm: The Impact of the Economic Crisis and Strategic Respons...Navigating the Storm: The Impact of the Economic Crisis and Strategic Respons...
Navigating the Storm: The Impact of the Economic Crisis and Strategic Respons...Ga S
 
Case-Shiller November 2012
Case-Shiller November 2012Case-Shiller November 2012
Case-Shiller November 2012Harriet Stopher
 
Everyone Needs A Good Place to Call Home
Everyone Needs A Good Place to Call HomeEveryone Needs A Good Place to Call Home
Everyone Needs A Good Place to Call HomeWellesley Institute
 
2007 - 7th Annual U.S. Analyst Airline Market Overview Commecial Aviation
2007 - 7th Annual U.S. Analyst   Airline Market Overview   Commecial Aviation2007 - 7th Annual U.S. Analyst   Airline Market Overview   Commecial Aviation
2007 - 7th Annual U.S. Analyst Airline Market Overview Commecial AviationEmbraer RI
 
State of Regional Development in Thailand
State  of Regional Development in ThailandState  of Regional Development in Thailand
State of Regional Development in ThailandDr.Choen Krainara
 
From Recession to Recovery to... What?
From Recession to Recovery to... What?From Recession to Recovery to... What?
From Recession to Recovery to... What?Brent Reid
 
Experience Exchange Meeting of Thailand
Experience Exchange Meeting of ThailandExperience Exchange Meeting of Thailand
Experience Exchange Meeting of ThailandDr.Choen Krainara
 
Energy Statistic : Global and Thailand Outlook
Energy Statistic : Global and Thailand OutlookEnergy Statistic : Global and Thailand Outlook
Energy Statistic : Global and Thailand OutlookDenpong Soodphakdee
 
Sustainable Organisations: Can businesses solve social and environmental issu...
Sustainable Organisations: Can businesses solve social and environmental issu...Sustainable Organisations: Can businesses solve social and environmental issu...
Sustainable Organisations: Can businesses solve social and environmental issu...London Business School
 

Semelhante a April 2009 Philadelphia Housing Market (20)

Philadelphia House Price Indices, 2011 Q1
Philadelphia House Price Indices, 2011 Q1 Philadelphia House Price Indices, 2011 Q1
Philadelphia House Price Indices, 2011 Q1
 
Seminar 13 Mar 2013 - Session 4 - Smallholders oil palm production in Indones...
Seminar 13 Mar 2013 - Session 4 - Smallholders oil palm production in Indones...Seminar 13 Mar 2013 - Session 4 - Smallholders oil palm production in Indones...
Seminar 13 Mar 2013 - Session 4 - Smallholders oil palm production in Indones...
 
Comparative economicanalysis
Comparative economicanalysisComparative economicanalysis
Comparative economicanalysis
 
Ag slides
Ag slidesAg slides
Ag slides
 
Strengthening pensions: the economic context
Strengthening pensions: the economic contextStrengthening pensions: the economic context
Strengthening pensions: the economic context
 
2003 Soa.Washington.Low Rate
2003 Soa.Washington.Low Rate2003 Soa.Washington.Low Rate
2003 Soa.Washington.Low Rate
 
Heesen san diego venture group - 2012-01-24
Heesen   san diego venture group - 2012-01-24Heesen   san diego venture group - 2012-01-24
Heesen san diego venture group - 2012-01-24
 
MyTownCryer Mid Year 2010 Analysis
MyTownCryer Mid Year 2010 AnalysisMyTownCryer Mid Year 2010 Analysis
MyTownCryer Mid Year 2010 Analysis
 
Navigating the Storm: The Impact of the Economic Crisis and Strategic Respons...
Navigating the Storm: The Impact of the Economic Crisis and Strategic Respons...Navigating the Storm: The Impact of the Economic Crisis and Strategic Respons...
Navigating the Storm: The Impact of the Economic Crisis and Strategic Respons...
 
CAR_EconomicForcast_April_20_2012
CAR_EconomicForcast_April_20_2012CAR_EconomicForcast_April_20_2012
CAR_EconomicForcast_April_20_2012
 
Case-Shiller November 2012
Case-Shiller November 2012Case-Shiller November 2012
Case-Shiller November 2012
 
Everyone Needs A Good Place to Call Home
Everyone Needs A Good Place to Call HomeEveryone Needs A Good Place to Call Home
Everyone Needs A Good Place to Call Home
 
Local Food as Economic Recovery
Local Food as Economic RecoveryLocal Food as Economic Recovery
Local Food as Economic Recovery
 
2007 - 7th Annual U.S. Analyst Airline Market Overview Commecial Aviation
2007 - 7th Annual U.S. Analyst   Airline Market Overview   Commecial Aviation2007 - 7th Annual U.S. Analyst   Airline Market Overview   Commecial Aviation
2007 - 7th Annual U.S. Analyst Airline Market Overview Commecial Aviation
 
It Transformation
It TransformationIt Transformation
It Transformation
 
State of Regional Development in Thailand
State  of Regional Development in ThailandState  of Regional Development in Thailand
State of Regional Development in Thailand
 
From Recession to Recovery to... What?
From Recession to Recovery to... What?From Recession to Recovery to... What?
From Recession to Recovery to... What?
 
Experience Exchange Meeting of Thailand
Experience Exchange Meeting of ThailandExperience Exchange Meeting of Thailand
Experience Exchange Meeting of Thailand
 
Energy Statistic : Global and Thailand Outlook
Energy Statistic : Global and Thailand OutlookEnergy Statistic : Global and Thailand Outlook
Energy Statistic : Global and Thailand Outlook
 
Sustainable Organisations: Can businesses solve social and environmental issu...
Sustainable Organisations: Can businesses solve social and environmental issu...Sustainable Organisations: Can businesses solve social and environmental issu...
Sustainable Organisations: Can businesses solve social and environmental issu...
 

Último

Organizational Transformation Lead with Culture
Organizational Transformation Lead with CultureOrganizational Transformation Lead with Culture
Organizational Transformation Lead with CultureSeta Wicaksana
 
MONA 98765-12871 CALL GIRLS IN LUDHIANA LUDHIANA CALL GIRL
MONA 98765-12871 CALL GIRLS IN LUDHIANA LUDHIANA CALL GIRLMONA 98765-12871 CALL GIRLS IN LUDHIANA LUDHIANA CALL GIRL
MONA 98765-12871 CALL GIRLS IN LUDHIANA LUDHIANA CALL GIRLSeo
 
B.COM Unit – 4 ( CORPORATE SOCIAL RESPONSIBILITY ( CSR ).pptx
B.COM Unit – 4 ( CORPORATE SOCIAL RESPONSIBILITY ( CSR ).pptxB.COM Unit – 4 ( CORPORATE SOCIAL RESPONSIBILITY ( CSR ).pptx
B.COM Unit – 4 ( CORPORATE SOCIAL RESPONSIBILITY ( CSR ).pptxpriyanshujha201
 
Famous Olympic Siblings from the 21st Century
Famous Olympic Siblings from the 21st CenturyFamous Olympic Siblings from the 21st Century
Famous Olympic Siblings from the 21st Centuryrwgiffor
 
RSA Conference Exhibitor List 2024 - Exhibitors Data
RSA Conference Exhibitor List 2024 - Exhibitors DataRSA Conference Exhibitor List 2024 - Exhibitors Data
RSA Conference Exhibitor List 2024 - Exhibitors DataExhibitors Data
 
FULL ENJOY Call Girls In Mahipalpur Delhi Contact Us 8377877756
FULL ENJOY Call Girls In Mahipalpur Delhi Contact Us 8377877756FULL ENJOY Call Girls In Mahipalpur Delhi Contact Us 8377877756
FULL ENJOY Call Girls In Mahipalpur Delhi Contact Us 8377877756dollysharma2066
 
Call Girls Jp Nagar Just Call 👗 7737669865 👗 Top Class Call Girl Service Bang...
Call Girls Jp Nagar Just Call 👗 7737669865 👗 Top Class Call Girl Service Bang...Call Girls Jp Nagar Just Call 👗 7737669865 👗 Top Class Call Girl Service Bang...
Call Girls Jp Nagar Just Call 👗 7737669865 👗 Top Class Call Girl Service Bang...amitlee9823
 
Business Model Canvas (BMC)- A new venture concept
Business Model Canvas (BMC)-  A new venture conceptBusiness Model Canvas (BMC)-  A new venture concept
Business Model Canvas (BMC)- A new venture conceptP&CO
 
Mysore Call Girls 8617370543 WhatsApp Number 24x7 Best Services
Mysore Call Girls 8617370543 WhatsApp Number 24x7 Best ServicesMysore Call Girls 8617370543 WhatsApp Number 24x7 Best Services
Mysore Call Girls 8617370543 WhatsApp Number 24x7 Best ServicesDipal Arora
 
Quick Doctor In Kuwait +2773`7758`557 Kuwait Doha Qatar Dubai Abu Dhabi Sharj...
Quick Doctor In Kuwait +2773`7758`557 Kuwait Doha Qatar Dubai Abu Dhabi Sharj...Quick Doctor In Kuwait +2773`7758`557 Kuwait Doha Qatar Dubai Abu Dhabi Sharj...
Quick Doctor In Kuwait +2773`7758`557 Kuwait Doha Qatar Dubai Abu Dhabi Sharj...daisycvs
 
Call Girls Kengeri Satellite Town Just Call 👗 7737669865 👗 Top Class Call Gir...
Call Girls Kengeri Satellite Town Just Call 👗 7737669865 👗 Top Class Call Gir...Call Girls Kengeri Satellite Town Just Call 👗 7737669865 👗 Top Class Call Gir...
Call Girls Kengeri Satellite Town Just Call 👗 7737669865 👗 Top Class Call Gir...amitlee9823
 
Call Girls Electronic City Just Call 👗 7737669865 👗 Top Class Call Girl Servi...
Call Girls Electronic City Just Call 👗 7737669865 👗 Top Class Call Girl Servi...Call Girls Electronic City Just Call 👗 7737669865 👗 Top Class Call Girl Servi...
Call Girls Electronic City Just Call 👗 7737669865 👗 Top Class Call Girl Servi...amitlee9823
 
Mondelez State of Snacking and Future Trends 2023
Mondelez State of Snacking and Future Trends 2023Mondelez State of Snacking and Future Trends 2023
Mondelez State of Snacking and Future Trends 2023Neil Kimberley
 
Call Girls Service In Old Town Dubai ((0551707352)) Old Town Dubai Call Girl ...
Call Girls Service In Old Town Dubai ((0551707352)) Old Town Dubai Call Girl ...Call Girls Service In Old Town Dubai ((0551707352)) Old Town Dubai Call Girl ...
Call Girls Service In Old Town Dubai ((0551707352)) Old Town Dubai Call Girl ...allensay1
 
Enhancing and Restoring Safety & Quality Cultures - Dave Litwiller - May 2024...
Enhancing and Restoring Safety & Quality Cultures - Dave Litwiller - May 2024...Enhancing and Restoring Safety & Quality Cultures - Dave Litwiller - May 2024...
Enhancing and Restoring Safety & Quality Cultures - Dave Litwiller - May 2024...Dave Litwiller
 
Chandigarh Escorts Service 📞8868886958📞 Just📲 Call Nihal Chandigarh Call Girl...
Chandigarh Escorts Service 📞8868886958📞 Just📲 Call Nihal Chandigarh Call Girl...Chandigarh Escorts Service 📞8868886958📞 Just📲 Call Nihal Chandigarh Call Girl...
Chandigarh Escorts Service 📞8868886958📞 Just📲 Call Nihal Chandigarh Call Girl...Sheetaleventcompany
 
BAGALUR CALL GIRL IN 98274*61493 ❤CALL GIRLS IN ESCORT SERVICE❤CALL GIRL
BAGALUR CALL GIRL IN 98274*61493 ❤CALL GIRLS IN ESCORT SERVICE❤CALL GIRLBAGALUR CALL GIRL IN 98274*61493 ❤CALL GIRLS IN ESCORT SERVICE❤CALL GIRL
BAGALUR CALL GIRL IN 98274*61493 ❤CALL GIRLS IN ESCORT SERVICE❤CALL GIRLkapoorjyoti4444
 
Call Girls in Delhi, Escort Service Available 24x7 in Delhi 959961-/-3876
Call Girls in Delhi, Escort Service Available 24x7 in Delhi 959961-/-3876Call Girls in Delhi, Escort Service Available 24x7 in Delhi 959961-/-3876
Call Girls in Delhi, Escort Service Available 24x7 in Delhi 959961-/-3876dlhescort
 

Último (20)

Organizational Transformation Lead with Culture
Organizational Transformation Lead with CultureOrganizational Transformation Lead with Culture
Organizational Transformation Lead with Culture
 
MONA 98765-12871 CALL GIRLS IN LUDHIANA LUDHIANA CALL GIRL
MONA 98765-12871 CALL GIRLS IN LUDHIANA LUDHIANA CALL GIRLMONA 98765-12871 CALL GIRLS IN LUDHIANA LUDHIANA CALL GIRL
MONA 98765-12871 CALL GIRLS IN LUDHIANA LUDHIANA CALL GIRL
 
B.COM Unit – 4 ( CORPORATE SOCIAL RESPONSIBILITY ( CSR ).pptx
B.COM Unit – 4 ( CORPORATE SOCIAL RESPONSIBILITY ( CSR ).pptxB.COM Unit – 4 ( CORPORATE SOCIAL RESPONSIBILITY ( CSR ).pptx
B.COM Unit – 4 ( CORPORATE SOCIAL RESPONSIBILITY ( CSR ).pptx
 
Famous Olympic Siblings from the 21st Century
Famous Olympic Siblings from the 21st CenturyFamous Olympic Siblings from the 21st Century
Famous Olympic Siblings from the 21st Century
 
(Anamika) VIP Call Girls Napur Call Now 8617697112 Napur Escorts 24x7
(Anamika) VIP Call Girls Napur Call Now 8617697112 Napur Escorts 24x7(Anamika) VIP Call Girls Napur Call Now 8617697112 Napur Escorts 24x7
(Anamika) VIP Call Girls Napur Call Now 8617697112 Napur Escorts 24x7
 
RSA Conference Exhibitor List 2024 - Exhibitors Data
RSA Conference Exhibitor List 2024 - Exhibitors DataRSA Conference Exhibitor List 2024 - Exhibitors Data
RSA Conference Exhibitor List 2024 - Exhibitors Data
 
FULL ENJOY Call Girls In Mahipalpur Delhi Contact Us 8377877756
FULL ENJOY Call Girls In Mahipalpur Delhi Contact Us 8377877756FULL ENJOY Call Girls In Mahipalpur Delhi Contact Us 8377877756
FULL ENJOY Call Girls In Mahipalpur Delhi Contact Us 8377877756
 
Call Girls Jp Nagar Just Call 👗 7737669865 👗 Top Class Call Girl Service Bang...
Call Girls Jp Nagar Just Call 👗 7737669865 👗 Top Class Call Girl Service Bang...Call Girls Jp Nagar Just Call 👗 7737669865 👗 Top Class Call Girl Service Bang...
Call Girls Jp Nagar Just Call 👗 7737669865 👗 Top Class Call Girl Service Bang...
 
Business Model Canvas (BMC)- A new venture concept
Business Model Canvas (BMC)-  A new venture conceptBusiness Model Canvas (BMC)-  A new venture concept
Business Model Canvas (BMC)- A new venture concept
 
Mysore Call Girls 8617370543 WhatsApp Number 24x7 Best Services
Mysore Call Girls 8617370543 WhatsApp Number 24x7 Best ServicesMysore Call Girls 8617370543 WhatsApp Number 24x7 Best Services
Mysore Call Girls 8617370543 WhatsApp Number 24x7 Best Services
 
Quick Doctor In Kuwait +2773`7758`557 Kuwait Doha Qatar Dubai Abu Dhabi Sharj...
Quick Doctor In Kuwait +2773`7758`557 Kuwait Doha Qatar Dubai Abu Dhabi Sharj...Quick Doctor In Kuwait +2773`7758`557 Kuwait Doha Qatar Dubai Abu Dhabi Sharj...
Quick Doctor In Kuwait +2773`7758`557 Kuwait Doha Qatar Dubai Abu Dhabi Sharj...
 
Call Girls Kengeri Satellite Town Just Call 👗 7737669865 👗 Top Class Call Gir...
Call Girls Kengeri Satellite Town Just Call 👗 7737669865 👗 Top Class Call Gir...Call Girls Kengeri Satellite Town Just Call 👗 7737669865 👗 Top Class Call Gir...
Call Girls Kengeri Satellite Town Just Call 👗 7737669865 👗 Top Class Call Gir...
 
Call Girls Electronic City Just Call 👗 7737669865 👗 Top Class Call Girl Servi...
Call Girls Electronic City Just Call 👗 7737669865 👗 Top Class Call Girl Servi...Call Girls Electronic City Just Call 👗 7737669865 👗 Top Class Call Girl Servi...
Call Girls Electronic City Just Call 👗 7737669865 👗 Top Class Call Girl Servi...
 
Falcon Invoice Discounting platform in india
Falcon Invoice Discounting platform in indiaFalcon Invoice Discounting platform in india
Falcon Invoice Discounting platform in india
 
Mondelez State of Snacking and Future Trends 2023
Mondelez State of Snacking and Future Trends 2023Mondelez State of Snacking and Future Trends 2023
Mondelez State of Snacking and Future Trends 2023
 
Call Girls Service In Old Town Dubai ((0551707352)) Old Town Dubai Call Girl ...
Call Girls Service In Old Town Dubai ((0551707352)) Old Town Dubai Call Girl ...Call Girls Service In Old Town Dubai ((0551707352)) Old Town Dubai Call Girl ...
Call Girls Service In Old Town Dubai ((0551707352)) Old Town Dubai Call Girl ...
 
Enhancing and Restoring Safety & Quality Cultures - Dave Litwiller - May 2024...
Enhancing and Restoring Safety & Quality Cultures - Dave Litwiller - May 2024...Enhancing and Restoring Safety & Quality Cultures - Dave Litwiller - May 2024...
Enhancing and Restoring Safety & Quality Cultures - Dave Litwiller - May 2024...
 
Chandigarh Escorts Service 📞8868886958📞 Just📲 Call Nihal Chandigarh Call Girl...
Chandigarh Escorts Service 📞8868886958📞 Just📲 Call Nihal Chandigarh Call Girl...Chandigarh Escorts Service 📞8868886958📞 Just📲 Call Nihal Chandigarh Call Girl...
Chandigarh Escorts Service 📞8868886958📞 Just📲 Call Nihal Chandigarh Call Girl...
 
BAGALUR CALL GIRL IN 98274*61493 ❤CALL GIRLS IN ESCORT SERVICE❤CALL GIRL
BAGALUR CALL GIRL IN 98274*61493 ❤CALL GIRLS IN ESCORT SERVICE❤CALL GIRLBAGALUR CALL GIRL IN 98274*61493 ❤CALL GIRLS IN ESCORT SERVICE❤CALL GIRL
BAGALUR CALL GIRL IN 98274*61493 ❤CALL GIRLS IN ESCORT SERVICE❤CALL GIRL
 
Call Girls in Delhi, Escort Service Available 24x7 in Delhi 959961-/-3876
Call Girls in Delhi, Escort Service Available 24x7 in Delhi 959961-/-3876Call Girls in Delhi, Escort Service Available 24x7 in Delhi 959961-/-3876
Call Girls in Delhi, Escort Service Available 24x7 in Delhi 959961-/-3876
 

April 2009 Philadelphia Housing Market

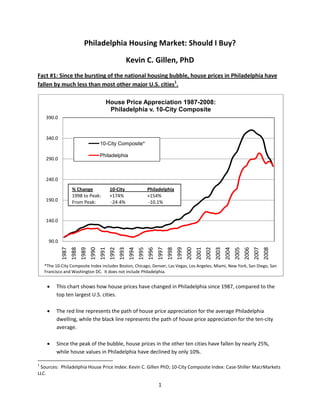
  • 1. Philadelphia Housing Market: Should I Buy? Kevin C. Gillen, PhD Fact #1: Since the bursting of the national housing bubble, house prices in Philadelphia have fallen by much less than most other major U.S. cities1. House Price Appreciation 1987-2008: Philadelphia v. 10-City Composite 390.0 340.0 10-City Composite* Philadelphia 290.0 240.0 % Change 10-City Philadelphia 1998 to Peak: +174% +154% 190.0 From Peak: -24.4% -10.1% 140.0 90.0 1987 1988 1989 1990 1991 1992 1993 1994 1995 1996 1997 1998 1999 2000 2001 2002 2003 2004 2005 2006 2007 2008 *The 10-City Composite Index includes Boston, Chicago, Denver, Las Vegas, Los Angeles, Miami, New York, San Diego, San Francisco and Washington DC. It does not include Philadelphia. This chart shows how house prices have changed in Philadelphia since 1987, compared to the • top ten largest U.S. cities. The red line represents the path of house price appreciation for the average Philadelphia • dwelling, while the black line represents the path of house price appreciation for the ten-city average. Since the peak of the bubble, house prices in the other ten cities have fallen by nearly 25%, • while house values in Philadelphia have declined by only 10%. 1 Sources: Philadelphia House Price Index: Kevin C. Gillen PhD; 10-City Composite Index: Case-Shiller MacrMarkets LLC. 1
  • 2. Fact #2: Compared to most other U.S. cities, Philadelphia is near the bottom of the range of house price declines2. Cumulative %Decline in House Prices from Peak 0.0% -5.0% -4.6% -5.8% -8.0% -10.0% -10.1% -10.8% -11.4% -11.9% -11.9% -12.2% -12.8% -15.0% -13.7% -20.0% -20.7% -25.0% -26.3% -30.0% -30.5% -32.2% -35.0% -34.4% -36.1% -36.4% -40.0% -38.3% -39.3% -40.6% -45.0% This chart shows how much house prices have fallen in large U.S. cities from their peak, since • the bursting of the housing bubble. House prices in Philadelphia have declined by an average of 10.1% since their peak in 2006. • Compared to Philadelphia, seventeen cities have had larger cumulative price declines, while only • three cities have had smaller cumulative price declines. At the most extreme, house prices in the sunbelt cities of Phoenix, Las Vegas, Miami and San • Diego have fallen by over 30%. This is more than three times greater than house prices in Philadelphia have declined. 2 Sources: Philadelphia: empirically estimated by Kevin C. Gillen PhD; All other cities courtesy Case-Shiller MacroMarkets LLC. 2
  • 3. Fact #3: House prices in Philadelphia are not expected to decline much further3. Housing: Percent Over/Under-valued, by Mid- Atlantic City Atlantic City NJ 43% Vineland NJ 30% Ocean City NJ 23% York PA 18% Dover DE 18% Camden NJ 10% Reading PA 9% Allentown PA 9% Lancaster PA 9% Baltimore 9% Washington, D.C. 8% Harrisburg PA 7% Scranton PA 6% Lebanon PA 5% Philadelphia PA 2% Wilmington DE 2% Newark NJ 1% -2% York NY New -5% Trenton NJ -10% Pittsburgh PA -20% -10% 0% 10% 20% 30% 40% 50% This chart ranks cities in the Mid-Atlantic by the degree to which their housing stock is currently • considered over- or under-valued. The ranking is obtained by comparing local house prices in each city to their fundamental drivers, such as rents, population growth and incomes. Currently, Philadelphia’s housing is considered over-valued by just 2%. • By contrast, homes in the South Jersey markets of Atlantic City, Ocean City and Vineland are • considered over-valued by more than 20%. This suggests that house prices in Philadelphia are not expected to decline by much further, if at • all. 3 Source: NationalCity/GlobalInsight, Dec. 2008. 3
  • 4. Fact #4: Philadelphia has experienced significantly less foreclosure activity than other large U.S. cities4. Foreclosure Rates by U.S. Metro Area as of 2008Q4 STOCKTON LAS VEGAS/PARADISE RIVERSIDE/SAN BERNARDINO PHOENIX/MESA MIAMI DETROIT/LIVONIA/DEARBORN SAN DIEGO ATLANTA/SANDY SPRINGS/MARIETTA DENVER/AURORA WASHINGTON DC LOS ANGELES/LONG BEACH CHICAGO NEWARK CAMDEN ST LOUIS BOSTON/QUINCY DALLAS BALTIMORE/TOWSON SAN FRANCISCO PHILADELPHIA PITTSBURGH WILMINGTON DE BUFFALO NEW YORK/WAYNE/WHITE PLAINS SCRANTON/WILKES/BARRE/HAZLETON ALLENTOWN/BETHLEHEM/EASTON 0.00% 2.00% 4.00% 6.00% 8.00% 10.00% This chart ranks major U.S. cities by their current foreclosure rate. The foreclosure rate • is computed as the percent of all households in a metropolitan which are in the process of foreclosure. As of 2008Q4, less than one percent of all households in the Philadelphia region were in • foreclosure. This is a fraction of what the foreclosure rate is in cities that have experienced severe • house price declines, such as Las Vegas (9%), Phoenix (6%), Miami (5%) and Detroit (4.5%). This suggests a relatively stable outlook for house prices in Philadelphia. • 4 Source: www.realtrytrac.com 4
  • 5. Fact #5: The decline in Philadelphia’s house prices has actually made homes more affordable—and hence more accessible5. Philadelphia Housing Affordability* Index: 1980-2008 2.75 2.50 2.25 2.00 1.75 1.50 1.25 1.00 0.75 0.50 1980 1981 1982 1983 1984 1985 1986 1987 1988 1989 1990 1991 1992 1993 1994 1995 1996 1997 1998 1999 2000 2001 2002 2003 2004 2005 2006 2007 2008 This chart plots the affordability of the average Philadelphia home to the average Philadelphia • households. Affordability is measured as the ratio of the average Philadelphia house price to the to the average Philadelphia family income. High values of the index mean that housing has become less affordable to the average Philadelphian. At the peak of the bubble in 2006, the typical Philadelphia home had a price that was more than • 2.5 times the typical Philadelphia household income. Currently, the typical Philadelphia home has a price that is only 2.25 times the typical Philadelphia household’s income. Since local house prices have fallen by more than local incomes in recent years, more homes • have moved into the range of affordability for more Philadelphia households. 5 Sources: Kevin C. Gillen PhD, U.S. Bureau of Labor Statistics. 5
  • 6. Fact #6: There is still an above-average supply of homes for Philadelphia homebuyers to choose from6. Philadelphia Houses Listed For Sale: Inventory v. Sales Rate 14,000 30.0% # Houses Listed For Sale % Sold 12,000 25.0% # Homes Listed quot;For Salequot; %Sold = (#Sales/#Listings) 10,000 20.0% 8,000 15.0% 6,000 10.0% 4,000 5.0% 2,000 0 0.0% This chart shows the number of homes in Philadelphia listed “For Sale” in every month since • 2001, as represented by the red bars. The blue line represents the percent of homes listed for sale that actually sold in each month. Since 2005, inventories of listed homes have doubled from their historical average. As the • supply of homes has risen faster than the number of buyers, the rate at which homes have sold has plummeted from their pre-bubble peak. Although there remain more homes for sale than buyers, the supply of listed homes has begun • to fall in recent months. This suggests that, while there still remains an above-average supply of homes for buyers to • choose from, this has begun to change in favor of sellers. 6 Source: TrendMLS, courtesy of www.developphilly.com 6
  • 7. Summary: House price declines have been very modest in Philadelphia compared to other U.S. cities. • Most other U.S. cities have experienced house price declines of a significantly larger magnitude • than Philadelphia has. Independent analysis suggests that the typical Philadelphia house is fairly valued, with no • expectation of large future declines. Philadelphia’s foreclosure rate remains well below that of other large U.S. cities. • The modest decline in Philadelphia house prices that has occurred has actually made more • homes more affordable to more households. While the above-average number of homes listed for sale still gives buyers plenty to choose • from, this has begun to recently change direction. Taken collectively, the facts suggest that Philadelphia’s housing market is much more stable than many other U.S. cities. There is little evidence to suggest that Philadelphia has or will experience the dramatic price declines that many other markets have. While the current supply of homes does exceed the current number of willing and able buyers, supply is currently declining. This suggests that probability of dramatic future price declines is relatively small, while the probability of fewer homes to choose from is growing. Combined with the fact that mortgage rates are at historic lows, there is little evidence to indicate that there are any significant advantages to waiting to buy a home in Philadelphia in the current market. 7