RV 2014: Beyond Mobility: Corridor Planning for the Bigger Picture by Katherine Idziorek

Beyond Mobility: Corridor Planning for the Bigger Picture AICP CM 1.5 Transit can do more than move people and generate revenue. More and more, cities are investing in transit to transform their communities and deliver on more expansive city-building objectives. Traditional transit goals are expanding to address the promise of livable communities, environmental stewardship, economic development and improved public health. Hear how two cities -- Seattle and Portland -- are shaping development scale and character with transit investment. Both cities are using parcel-based, pro forma-based tools to quantify the potential impact of transit projects. Join us for an interactive discussion about the capabilities and limitations of these tools. Hear their stories and learn how to evaluate your own projects against a broader set of goals using technical and market-based analysis. Moderator: Catherine Ciarlo, AICP, Senior Project Manager, CH2M Hill, Portland, Oregon Katherine Idziorek, AICP, LEED AP ND, Urban Designer, VIA Architecture, Seattle, Washington Antonio Gomez-Palacio, Principal, DIALOG, Toronto, Ontario Eric Engstrom, Principal Planner, City of Portland, Bureau of Planning & Sustainability, Portland, Oregon

Recomendados
Recomendados
Mais conteúdo relacionado
Semelhante a RV 2014: Beyond Mobility: Corridor Planning for the Bigger Picture by Katherine Idziorek
Semelhante a RV 2014: Beyond Mobility: Corridor Planning for the Bigger Picture by Katherine Idziorek (20)
Mais de Rail~Volution
Mais de Rail~Volution (20)
Último
Último (20)
RV 2014: Beyond Mobility: Corridor Planning for the Bigger Picture by Katherine Idziorek
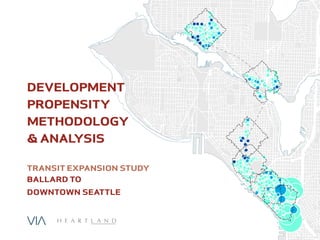
- 1. DEVELOPMENT PROPENSITY METHODOLOGY & ANALYSIS TRANSIT EXPANSION STUDY BALLARD TO DOWNTOWN SEATTLE
- 2. DEVELOPMENT PROPENSITY ANALYSIS PROJECT BACKGROUND Elliott Bay Downtown Seattle *Ballard * Project Study Area »» Level 2 analysis »» Partnership between Sound Transit (ST) and the Seattle Department of Transportation (SDOT) »» Outcomes: ͧͧ Support Seattle Transit Master Plan ͧͧ Inform Sound Transit Board decisions
- 3. DEVELOPMENT PROPENSITY ANALYSIS LAND USE + TRANSIT INTEGRATION ANALYSIS GOALS »» Support sustainable urban growth by: ͧͧ Supporting economic and transit-oriented development in the corridor ͧͧ Supporting the development of compact and sustainable communities A B CA CB D E
- 4. DEVELOPMENT PROPENSITY ANALYSIS »» “4Ds” + P ͧͧ Density ͧͧ Design ͧͧ Diversity ͧͧ Destinations MEASURE: OPPORTUNITY FOR DEVELOPMENT jobs and people. jobs and people. jobs and people. jobs and people. jobs and people. jobs and people. jobs and people. jobs and people. jobs and people. jobs and people. jobs and people. jobs and people. jobs and people. jobs and people. jobs and people. jobs and people. jobs and people. jobs and people. jobs and people. jobs and people. jobs and people. jobs and people. jobs and people. jobs and people. jobs and people. jobs and people. jobs and people. jobs and people. + ͧͧ Development Propensity: the art and science of anticipating future development
- 5. DEVELOPMENT PROPENSITY ANALYSIS METHODOLOGY OVERVIEW DISCOVERY Develop scenarios and apply filters Test outcomes OUTPUT
- 6. DEVELOPMENT PROPENSITY ANALYSIS DISCOVERY Understand land use within walksheds Gather readily-available King County Assessor’s data at the parcel level 1
- 7. DEVELOPMENT PROPENSITY ANALYSIS APPLY FILTERS Understand land use within walksheds Gather readily-available King County Assessor’s data at the parcel level 1 Create key filters to identify which parcels are likely to redevelop in the future 2
- 8. DEVELOPMENT PROPENSITY ANALYSIS ESTIMATE POTENTIAL IMPACT TO LAND VALUES jobs and people. jobs and people. jobs and people. jobs and people. SCENARIO 2: HCT investment SCENARIO 3: HCT investment + Station-area upzone SCENARIO 1: Existing conditions Estimate the impact on land value that HCT service and a 3 potential rezone may have on parcels within the walksheds
- 9. DEVELOPMENT PROPENSITY ANALYSIS SCENARIO 1 »» Scenario 1: Existing conditions - no transit investment, no upzonejobs and people. jobs and people. jobs and people. jobs and people.
- 10. Corridor ID: A B CA CB D E HCT Tech-nology: Tunnel/ Elevated Light Rail Elevated Light Rail At-Grade Light Rail or Street-car At-Grade Light Rail or Street-car Tunnel Light Rail At-Grade Streetcar Quality of Transit: % Impact on Land Value 45% 36% 29% 29% 45% 24% Criteria Char-acteristics Criteria Maximum Weight Corridor Scoring Potential Travel Time Savings 4 4 4 3 3 4 2 Reliability/On- Time Perfor-mance 3 3 3 2 2 3 1.5 Passenger Comfort/ Safety 2 2 1 1 1 2 1 Perception of Permanence 2 2 2 1 1 2 1 Station Type Elevated Sta-tions 1 1 Surface Sta-tions 2 2 2 2 Tunnel Stations 3 3 3 Potential for Rezone 1 1 1 0.5 0.5 1 0.5 Total Score 15 12 9.5 9.5 15 8 DEVELOPMENT PROPENSITY ANALYSIS SCENARIO 2: TRANSIT INVESTMENT »» Adjusted to reflect land value lift as a result of transit investment »» Increase in rents translated into land value increase TRANSIT QUALITY INFLUENCE ON LAND VALUES Weighting range: Tunnel/elevated LRT = 45% (high) to At-grade streetcar = 24% (low) jobs and people. jobs and people. jobs and people. jobs and people.
- 11. DEVELOPMENT PROPENSITY ANALYSIS jobs and people. jobs and people. jobs and people. jobs and people. SCENARIO 3: TRANSIT INVESTMENT + UPZONE »» Five geographies reflect differences in land value across neighborhoods »» “One-step” zoning modification »» Increased potential for density has positive impact on land value »» Additional FAR allows for larger buildings that support more jobs and house more people
- 12. DEVELOPMENT PROPENSITY ANALYSIS ESTIMATE POPULATION & EMPLOYMENT GROWTH development capacity (FAR) #potential residents #potential employees % res x sf/ resident + % emp x sf/ employee x( )= Estimate the growth of population and employment 4 for each alternative
- 13. DEVELOPMENT PROPENSITY ANALYSIS OUTPUT EMPLOYMENT D D POPULATION Potential employment capacity increase on parcels likely to redevelop (# jobs) 4-500 501 - 1000 1001 - 1500 1501 - 2000 2001 - 2500 2501 - 3000 Potential residential capacity increase on parcels likely to redevelop (# residents) 3-200 201 - 400 401 - 600 601- 800 801 - 1000 1001 - 1016 Transit investment & upzone Transit investment Current conditions Transit investment & upzone Transit investment Current conditions
- 14. DEVELOPMENT PROPENSITY ANALYSIS OUTPUT A B CA CB D E A B CA CB D E Scenarios 2 & 3: Residential growth beyond baseline HCT investment & upzone HCT investment +3,300 +1,900 +3,100 +1,600 +2,400 +800 +3,000 +800 +3,300 +1,900 +2,900 +1,300
- 15. DEVELOPMENT PROPENSITY ANALYSIS A B CA CB D E OUTPUT A B CA CB D E Scenarios 2 & 3: Employment growth beyond baseline HCT investment & upzone +2,500 HCT investment +10,900 +2,300 +6,900 +2,100 +5,400 +2,200 +5,400 +3,000 +4,600 +1,600 +8,200