RV 2014: Beyond Mobility: Corridor Planning for the Bigger Picture by Antonio Gomez-Palacio

Beyond Mobility: Corridor Planning for the Bigger Picture AICP CM 1.5 Transit can do more than move people and generate revenue. More and more, cities are investing in transit to transform their communities and deliver on more expansive city-building objectives. Traditional transit goals are expanding to address the promise of livable communities, environmental stewardship, economic development and improved public health. Hear how two cities -- Seattle and Portland -- are shaping development scale and character with transit investment. Both cities are using parcel-based, pro forma-based tools to quantify the potential impact of transit projects. Join us for an interactive discussion about the capabilities and limitations of these tools. Hear their stories and learn how to evaluate your own projects against a broader set of goals using technical and market-based analysis. Moderator: Catherine Ciarlo, AICP, Senior Project Manager, CH2M Hill, Portland, Oregon Katherine Idziorek, AICP, LEED AP ND, Urban Designer, VIA Architecture, Seattle, Washington Antonio Gomez-Palacio, Principal, DIALOG, Toronto, Ontario Eric Engstrom, Principal Planner, City of Portland, Bureau of Planning & Sustainability, Portland, Oregon

Recomendados
Recomendados
Mais conteúdo relacionado
Mais procurados
Mais procurados (19)
Semelhante a RV 2014: Beyond Mobility: Corridor Planning for the Bigger Picture by Antonio Gomez-Palacio
Semelhante a RV 2014: Beyond Mobility: Corridor Planning for the Bigger Picture by Antonio Gomez-Palacio (20)
Mais de Rail~Volution
Mais de Rail~Volution (20)
Último
Último (20)
RV 2014: Beyond Mobility: Corridor Planning for the Bigger Picture by Antonio Gomez-Palacio
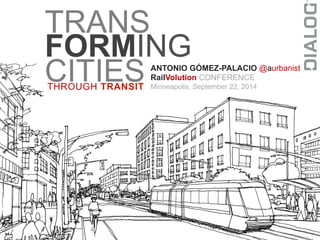
- 1. TRANS FORMING CITIES THROUGH TRANSIT ANTONIO GÓMEZ-PALACIO @aurbanist RailVolution CONFERENCE Minneapolis, September 22, 2014
- 6. PEDESTRIANS WORTH TEN POINTS
- 11. WHO, HAS ABSOLUTELY NO INTEREST IN EVER USING TRANSIT?
- 12. WHO, HAS NO OPTION TO MOVE AROUND EXCEPT TRANSIT?
- 13. WHO, CHOOSES TRANSIT EVER SO OFTEN?
- 15. 3 % OF PEOPLE IN COPENHAGEN RIDE BIKES FOR MORAL REASONS 97 % OF PEOPLE DO IT FOR QUALITY OF LIFE CYCLE STATISTICS, WWW.KK.DK 57% IT’S EASY AND FAST 22% IT’S GOOD EXERCISE 13% IT’S CHEAP 5% IT’S CONVENIENT
- 16. presentation outline: 4 WHYS? 4 HOWS? 3 EPIPHANIES
- 17. TRANSIT URBANISM DEFINITION: a recognition of the synergies between where we live and how we move, and their influence on delivering liveable communities, environmental and public health, economic and social development, and quality living.
- 18. epiphany # 1 !
- 19. “INSANITY: DOING THE SAME THING OVER AND OVER AGAIN AND EXPECTING DIFFERENT RESULTS” Albert Einstein
- 20. PART: WHY?
- 21. TOD + ROI BFFs TRANSIT ORIENTED DEVELOPMENT RETURN ON INVESTMENT BEST FRIENDS FOREVER
- 22. ROI = BENEFIT COST
- 23. BENEFIT ECONOMY ENVIRONMENT SOCIETY COST INDIVIDUALS
- 24. SOCIETY ECONOMY INDIVIDUALS BENEFIT ENVIRONMENT COST
- 25. SOCIETY ECONOMY INDIVIDUALS HYPOTHESIS: our travel choices have a direct (negative) impact on the sustenance of natural systems and to climate change ENVIRONMENT
- 26. 0.32 average car, single occupant 0.44 GHG emissions by mode... large 4WD, single occupant 0.0 0.003 walking + cycling for every extra passenger Kg of greenhouse gas per person per kilometer Source: h2p://sydney.edu.au/facili:es/sustainable_campus/transport/index.shtml
- 28. ECONOMY ENVIRONMENT SOCIETY BENEFIT COST INDIVIDUALS
- 29. ECONOMY ENVIRONMENT SOCIETY HYPOTHESIS: our travel choices have a direct (often unaccounted) cost to individuals’ livelihood and INDIVIDUALS quality of life
- 32. Average total expenditure, 2008 average household spending food shelter clothing transpor-‐ ta*on personal taxes $ shares of spending (%) Canada 71,360 10.4 19.9 4.0 13.6 20.5 Newfoundland and Labrador 57,710 11.7 16.5 4.7 15.6 18.0 Prince Edward Island 58,710 11.5 19.0 3.6 15.2 16.2 Nova Sco:a 60,330 11.3 18.6 3.7 14.7 17.9 New Brunswick 58,440 11.2 17.2 3.5 17.0 17.8 Quebec 60,480 12.2 18.5 3.9 13.2 20.5 Ontario 77,310 9.7 21.2 4.2 13.1 21.2 Manitoba 63,510 10.2 18.2 3.9 14.3 18.8 Saskatchewan 68,280 9.2 17.2 3.8 16.0 19.1 Alberta 86,910 8.9 19.0 3.8 14.0 21.9 Bri:sh Columbia 73,120 10.9 20.8 4.0 13.8 18.7 Source: Sta:s:cs Canada AVERAGE TOTAL EXPENDITURE, 2008
- 33. GTA $10,152 $1,077 $11,229 AVERAGE HOUSEHOLD EXPENDITURES ON TRANSPORTATION 2011 Source: Sta:s:cs Canada PRIVATE [cars, trucks, vans + their opera:ng costs] PUBLIC TRANSPORTATION TRANSPORTATION [public transit, taxis, air fares, inter-‐city buses + trains]
- 34. AVERAGE HOUSEHOLD EXPENDITURES ON TRANSPORTATION HIGHEST IN NEIGHBOURHOODS POORLY SERVED BY TRANSIT $10,152 $1,077 $11,229 $15,005 $6,803 in: LOW DENSITY RESIDENTIAL, LOW TRANSIT CONNECTIVITY in: JOB DENSE AREAS, HIGH TRANSIT CONNECTIVITY + -‐ SOURCE: TransForm, 2009
- 35. CANADA RESIDENTIAL AVERAGE PRICE, March 2013 $378,532 Source: CREA Canadian Real Estate Associa:on
- 36. GTA $10,152 $1,077 $11,229 AVERAGE HOUSEHOLD EXPENDITURES ON TRANSPORTATION 2011 PRIVATE TRANSPORTATION [cars, trucks, vans + their opera:ng costs] Source: Sta:s:cs Canada
- 37. applied to MONTHLY MORTGAGE PAYMENTS monthly payments increased by $846 $10,152
- 38. Mortgage amount: $523,975 Mortgage amount: $378,532
- 39. $145,443 difference 38% more Mortgage amount: $523,975 Mortgage amount: $378,532
- 40. $10,152 applied to MORTGAGE’S TOTAL INTEREST COSTS $10,152 X 25 years = $253,800
- 41. Mortgage amount: $719,288 Mortgage amount: $378,532
- 42. $340,756 difference 90% more Mortgage amount: $719,288 Mortgage amount: $378,532
- 43. ENVIRONMENT ECONOMY INDIVIDUALS BENEFIT SOCIETY COST
- 44. ENVIRONMENT ECONOMY INDIVIDUALS HYPOTHESIS: our travel choices are subsidized by us as a society, and have an impact on our municipal finances SOCIETY and public health
- 45. $ COST PER PASSENGER TRIP Infrastructure (capital & operating, private operating) and social costs (congestion, accidents, and environmental) $ 6.64 $ 3.33 SOURCE: TRANSPORT CANADA, 2010
- 46. iTn nYeigPhbEou r2ho oDds cIoAnduBciveE toT waElkinSg a nRd cAycTlinEg SOURCE: INSTITUTE FOR CLINICAL EVALUATIVE SCIENCES
- 47. OBESITY pedestrian-‐oriented neighbourhoods car-‐oriented neighbourhoods RATE 50% 10%
- 48. 1O2B.2%E SloIwTeYr / each 25% increase in mixed use single use mixed use Source: Frank, et al. 2004
- 49. Source: Canadian Institute for Health Information 40% of several Provincial budgets is health related
- 50. ENVIRONMENT SOCIETY INDIVIDUALS BENEFIT COST ECONOMY
- 51. ENVIRONMENT SOCIETY INDIVIDUALS HYPOTHESIS: access to travel choices increases the competitive advantage of cities and neighbourhoods and has an impact on economic development ECONOMY
- 52. YOUTH RETENTION... agree disagree 16-34 year-olds
- 53. AVERAGE ANNUAL VEHICLE km TRAVELED 16-34 year-olds 23% drop YOUTH RETENTION... 12,700km 16,500km 2009 2001 SOURCE: FRONTIER GROUP, 2012
- 54. YOUTH RETENTION... 16-34 year-olds 16% walk more frequently 24% bike more trips 40% transit more passenger km 2001-2009 SOURCE: FRONTIER GROUP, 2012
- 55. PART: HOW?
- 56. TRANSIT SYSTEMS DENSITY OF USE MODAL INTEGRATION URBAN DESIGN
- 57. MODAL INTEGRATION URBAN DESIGN DENSITY OF USE TRANSIT SYSTEMS
- 59. TRANSIT SYSTEMS DENSITY OF USE MODAL INTEGRATION URBAN DESIGN
- 60. MOVING PEOPLE NOT CARS SOURCE: QUINO (JOAQUÍN SALVADOR LAVADO)
- 62. 900 900 900 900 900 900 5,400 PERSONS / HOUR per direction (PPHPD) PASSENGERS PER HOUR 19,600 PERSONS / HOUR 900 900 8,000 STREETCAR 8,000 900 900
- 63. COMPLETE STREETS
- 64. TRANSIT SYSTEMS MODAL INTEGRATION URBAN DESIGN DENSITY OF USE
- 68. [PERSON / HA] AVERAGE TRACT DENSITY 200 180 160 140 120 100 80 60 40 20 0 0 200 400 600 800 1000 1200 1400 1600 1800 2000 source: A Study of Population Density of Ancient, Medieval, and Modern Cities (Ilano, 1961)
- 69. [PERSON / HA] AVERAGE TRACT DENSITY 100 90 80 70 60 50 40 30 20 10 0 New York, Boston, Chicago, Pittsburgh, Baltimore, St. Louis, Cleveland, Milwaukee, Washington, Los Angeles, Philadelphia, Detroit, Buffalo, Columbus, Minneapolis, Syracuse, Cincinnati, St. Paul, Nashville, Indianapolis 1910 1920 1930 1940 1950 1960 1970 1980 1990 2000 source: Lincoln Institute of Land Policy : https://www.lincolninst.edu/pubs/dl/1834_1085_Angel%20Final%201.pdf
- 72. POPULATION DENSITY OF THE TORONTO CMA 0 – 793 Persons/km2 33,380 – 63,770
- 73. % OF PEOPLE WHO WALK TO WORK 0 – 2% 38 -‐ 58%
- 74. % OF PEOPLE WHO DRIVE TO WORK 0 – 27% 85 – 95%
- 75. 0 – 5% Persons/km2 49 – 66% % OF PEOPLE WHO TAKE TRANSIT TO WORK
- 76. TRANSIT TRANSIT ORIENTED AUTO DEPENDANT AUTO RELIANT MULTI-MODAL SUPPORTIVE
- 77. TRANSIT SYSTEMS DENSITY OF USE MODAL INTEGRATION URBAN DESIGN
- 78. epiphany # 2 !
- 79. “IF YOU SCREW UP THE URBAN DESIGN, YOU MIGHT AS WELL PACK YOUR BAGS AND GO HOME”
- 81. vehicle-oriented multi-modal (insert image) 2/13/2012 81
- 82. CRITICAL MASS of PEOPLE and ACTIVITIES BUILDINGS face the street with ACTIVE USES at GRADE LEVEL DISTINCT STREET-SCAPING PEDESTRIAN CROSSINGS at REGULAR INTERVALS INTEGRATED TRANSIT SYSTEM DIVERSITY IN HOUSING TYPOLOGIES CONSISTENT BUILDING MIXED-USE PODIUM ANIMATED + MIXED-USE GROUND LEVEL URBAN TREE CANOPY and INTEGRATED STORMWATER SYSTEMS SUNLIGHT ACCESS and SKYVIEWS DIVERSITY IN RETAIL and EMPLOYMENT TYPOLOGIES
- 83. CRITICAL MASS OF POPULATION SAFE, ACTIVE-TRANSPORTATION PLACES FOR SOCIAL GATHERING PEDESTRIANS PRIORATIZED INTEGRATED TRANSIT FACILITIES INTEGRATED NATURAL SYSTEMS ROOFTOP GARDENING + AMENITIES MODAL OPTIONS ADAPTABLE ARCHITECTURE MIXED-USE POLICIES ON-SITE STORMWATER TREATMENT INTEGRATED TREE CANOPY SUNLIGHT PENETRATION DIVERSITY of HOUSING TYPES
- 84. 1901, JASPER AVENUE, EDMONTON
- 86. 10-‐20 metres
- 87. HERITAGE CONSERVATION PEDESTRIAN PRIORITY ZONES SAFE CYCLING FACILITIES PLACES FOR SOCIAL GATHERING ACCESS TO EMPLOYMENT QUALITY, DURABLE MATERIALS CRIME PREVENTION THROUGH DESIGN UNCLUTTERED URBAN DESIGN INTEGRATED TRANSIT SYSTEMS
- 88. epiphany # 3 !
- 89. “CITIES ARE NOT THE PROBLEM, THEY ARE THE SOLUTION” Jaime Lerner Architect, Major for the City of Curi:ba, Brazil
- 90. thank you ANTONIO GÓMEZ-PALACIO @aurbanist