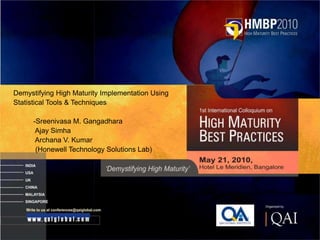
CMMI High Maturity Best Practices HMBP 2010: Demystifying High Maturity Implementation Using Statistical Tools & Techniques by Sreenivasa M. Gangadhara,Ajay Simha and Archana V. Kumar
•
4 gostaram•1,692 visualizações

Demystifying High Maturity Implementation Using Statistical Tools & Techniques -Sreenivasa M. Gangadhara Ajay Simha Archana V. Kumar (Honewell Technology Solutions Lab) . presented at 1st International Colloquium on CMMI High Maturity Best Practices held on May 21, 2010, organized by QAI

Recomendados
Mais conteúdo relacionado
Mais procurados
Mais procurados (20)
Semelhante a CMMI High Maturity Best Practices HMBP 2010: Demystifying High Maturity Implementation Using Statistical Tools & Techniques by Sreenivasa M. Gangadhara,Ajay Simha and Archana V. Kumar
Semelhante a CMMI High Maturity Best Practices HMBP 2010: Demystifying High Maturity Implementation Using Statistical Tools & Techniques by Sreenivasa M. Gangadhara,Ajay Simha and Archana V. Kumar (20)
Mais de QAI
Mais de QAI (9)
Último
Último (20)
CMMI High Maturity Best Practices HMBP 2010: Demystifying High Maturity Implementation Using Statistical Tools & Techniques by Sreenivasa M. Gangadhara,Ajay Simha and Archana V. Kumar
- 1. Demystifying High Maturity Implementation Using Statistical Tools & Techniques -Sreenivasa M. Gangadhara Ajay Simha Archana V. Kumar (Honewell Technology Solutions Lab) . 1 File Number
- 2. Demystifying High Maturity Implementation Using Statistical Tools & Techniques 1st International Colloquium on High Maturity Best Practices 2010 21st May, 2010
- 3. Introduction • Interpretation & implementation of High Maturity practices in projects is a challenge • This paper attempts to “Demystify” the High Maturity Implementation by using simple Statistical & Simulation Tools & Techniques • The analytical approach presented in this paper is one of the many best practices used in the organization • Project’s specific dynamics needs to be factored when applied to projects 3 File Number
- 4. Key Takeaways… At the end of this presentation, we will see one of the ways of… • Assessing the confidence of project in meeting the project’s multiple goals • Identifying the Critical Sub-Process with Quantitative justification • Setting Quantitative project improvement goal • Defining Sub-Process level Model and arriving at Critical & Controllable factors • Arriving at “Probabilistic” Model from a “Deterministic” Model • Doing “What-if” analysis for a proposed process improvement • Demonstrating whether the proposed solution will meet the project’s objective (end process result), before deploying the solution • Demonstrating the usage of models at different stages of the project lifecycle • Demonstrating that the improved process is statistically significant 4 File Number
- 5. Multi Goal Simulation Model (Getting the confidence at the beginning of the project) 5 File Number
- 6. Problem Statement • We have a new product release, in a similar product line • Estimated Size of project is 195 Requirements • Estimated Effort of project is 140 Person Months • Goal is to complete the project - Within 5% effort variance even in the worst scenario - With a Quality goal of NOT more than 0.1 defects / requirement after release What is the confidence that the team has in meeting this project Goal…??? 6 File Number
- 7. Prediction Model Note: Model is designed by using Crystal Ball Simulation Tool Input factor distributions are arrived from the performance baseline 7 File Number
- 8. Certainty Levels Prediction: • 94.45% certain project will complete in 140 person months • 98.71% certain project will complete with 5% more effort • 82.83% certain project will complete with 5% less effort • Project can deliver the product with a Quality Goal of 0.1 Defects / Req with a certainty of 78.51% 8 File Number
- 9. Model Representation Effort Component Defect Component Req Analysis & Dev Defect Injection Rate - + Req Review Defect Removal Efficiency Defect Detection Rate (DRE) + = Req Rework Defect Fix Rate X Defect Leakage Rate + + Design Defect Injection Rate - + Design Review Defect Removal Efficiency Defect Detection Rate (DRE) + = Design Rework Defect Leakage Rate + + Input Assumptions Historical Performance Baseline Measures: • Effort / Req for each of the Development, Review, Test execution phases Calculations • Defect Injection Rate for each of development phases • Defect Removal Efficiency (DRE) Rate for each of Review & Test phases Detected Detected • Defect Fix Rate of defects for each of the phases DRE = -------------------- = ----------------------- Total Present (Injected + Leaked) 9 File Number
- 10. Control Factors… • Control Injection Rate (Reduce Injection Rate) - Adopt the best Development Process from the existing Process Composition which takes less effort and injects less defects • Control Detection Rate (Increase Detection Rate) - Adopt the best Review Process from the existing Process Composition which takes less effort and uncover more defects Next step is to find the control factors at sub-process level 10 File Number
- 11. Critical Sub-Process Identification (Finding the area of concern from Historical Data) 11 File Number
- 12. Historical Project Data Set Defects Detected – Phase-wise Design Req Review Code Review Post Release Module / Feature # of Req Review DIT Defects SIT Defects Defects Defects Defects Defects Exception Service 22 18 9 22 17 42 4 External Interface 21 12 10 18 13 48 1 DL Scheduler 28 25 11 24 19 70 1 Alert registry module 24 8 5 22 19 43 2 Rendering 19 15 5 17 10 30 1 GGF 29 6 7 23 22 58 3 Launchpad 17 6 3 15 8 28 1 CCD 27 9 2 28 14 41 1 Semaphore Service 23 10 4 23 18 52 1 FSS 19 7 1 19 14 38 2 File System Service 13 11 3 15 6 33 0 ECLF 15 14 5 14 9 30 1 Socket Library 24 5 8 22 20 60 1 Installation 18 8 3 18 14 41 1 GPC 21 9 3 18 11 35 2 MTL 24 12 8 19 14 48 1 Alert response module 16 8 2 15 13 32 0 Notification Service 22 14 5 22 11 55 1 Blackberry Thick Client 13 6 8 13 10 22 1 Power Backup service 29 12 5 25 20 52 2 Share Point Client 12 15 8 12 9 18 1 Process Service 23 26 10 18 15 31 1 Platform Resource Service 13 11 6 13 6 17 1 Power on/off 20 8 2 16 15 32 0 Thread Service 27 7 11 25 12 36 1 License Management 27 14 5 25 14 41 1 Periodic IPC Service 15 7 4 15 8 27 2 PDD 13 9 3 11 7 21 1 CALF 23 13 10 20 12 37 2 Alert System 26 4 2 24 13 35 3 Empirical Data Set 12 File Number
- 13. Defect Density Defects Detection Density – Phase-wise Post Module / Feature Req DD Design DD Code DD DIT DD SIT DD Release DD Exception Service 0.818 0.409 1.000 0.773 1.909 0.182 External Interface 0.571 0.476 0.857 0.619 2.286 0.048 DL Scheduler 0.893 0.393 0.857 0.679 2.500 0.036 Alert registry module 0.333 0.208 0.917 0.792 1.792 0.083 Rendering 0.789 0.263 0.895 0.526 1.579 0.053 GGF 0.207 0.241 0.793 0.759 2.000 0.103 Launchpad 0.353 0.176 0.882 0.471 1.647 0.059 CCD 0.333 0.074 1.037 0.519 1.519 0.037 Semaphore Service 0.435 0.174 1.000 0.783 2.261 0.043 FSS 0.368 0.053 1.000 0.737 2.000 0.105 File System Service 0.846 0.231 1.154 0.462 2.538 0.000 ECLF 0.933 0.333 0.933 0.600 2.000 0.067 Socket Library 0.208 0.333 0.917 0.833 2.500 0.042 Installation 0.444 0.167 1.000 0.778 2.278 0.056 GPC 0.429 0.143 0.857 0.524 1.667 0.095 MTL 0.500 0.333 0.792 0.583 2.000 0.042 Alert response module 0.500 0.125 0.938 0.813 2.000 0.000 Notification Service 0.636 0.227 1.000 0.500 2.500 0.045 Blackberry Thick Client 0.462 0.615 1.000 0.769 1.692 0.077 Power Backup service 0.414 0.172 0.862 0.690 1.793 0.069 Share Point Client 1.250 0.667 1.000 0.750 1.500 0.083 Process Service 1.130 0.435 0.783 0.652 1.348 0.043 Platform Resource Service 0.846 0.462 1.000 0.462 1.308 0.077 Power on/off 0.400 0.100 0.800 0.750 1.600 0.000 Thread Service 0.259 0.407 0.926 0.444 1.333 0.037 License Management 0.519 0.185 0.926 0.519 1.519 0.037 Periodic IPC Service 0.467 0.267 1.000 0.533 1.800 0.133 PDD 0.692 0.231 0.846 0.538 1.615 0.077 CALF 0.565 0.435 0.870 0.522 1.609 0.087 Alert System 0.154 0.077 0.923 0.500 1.346 0.115 Defect Density = # of Defects / # of Requirements 13 File Number
- 14. Process Representation Y (PR DD) Y1 (Req DD) Y2 (Des DD) Y3 (Code DD) Y4 (DIT DD) Y5 (SIT DD) Y6 (PR DD) Requirement Design Phase Code Phase DIT Phase SIT Phase Release Phase Phase Which sub-process needs attention? 14 File Number
- 15. Investigating Defect Removal Activities Descriptive Statistics: Defect Detection Density 15 File Number
- 16. Investigating Defect Removal Activities Control Chart: Defect Detection Density I Chart of DD by Phase Req Design Code DIT SIT Post Release 3.0 2.5 2.0 Individual Value 1.5 1 1.0 0.5 1 _ UCL=0.177 0.0 X=0.064 LCL=-0.049 1 19 37 55 73 91 109 127 145 163 Observation Is SIT a Critical Sub-Process…!!!??? 16 File Number
- 17. Investigating Defect Removal Activities Trend Chart: Defect Detection Density 3.000 2.500 2.000 1.500 1.000 0.500 0.000 Req DD Design DD Code DD DIT DD SIT DD Post Release DD 17 File Number
- 18. Investigating Defect Removal Activities Trend Chart: Defect Detection Density 3.000 2.500 2.000 1.500 1.000 0.500 0.000 Req DD Design DD Code DD DIT DD SIT DD Post Release DD Min Max Average Min, Max and Mean values representation 18 File Number
- 19. Investigating Defect Source Identifying the Defect Injection phase & classifying them accordingly… Req Review Defects Design Review Defects Code Review Defects DIT Defects SIT Defects Post Release Defects Design Req Design Code Req Design Code Req Design Code Req Design Code Module / Feature # of Req Req Defects Req Defects Defects Defects Defects Defects Defects Defects Defects Defects Defects Defects Defects Defects Defects Exception Service 22 18 2 7 3 2 17 7 6 4 22 15 5 1 0 3 External Interface 21 12 1 9 2 3 13 6 5 2 24 12 12 1 0 0 DL Scheduler 28 25 2 9 2 4 18 9 7 3 34 20 16 0 1 0 Alert registry module 24 8 0 5 1 3 18 9 7 3 20 7 16 1 0 1 Rendering 19 15 1 4 0 3 14 5 4 1 12 8 10 0 0 1 GGF 29 6 1 6 3 2 18 9 7 6 32 12 14 1 0 2 Launchpad 17 6 0 3 0 2 13 4 2 2 13 7 8 1 0 0 CCD 27 9 0 2 3 3 22 7 5 2 11 9 21 0 0 1 Semaphore Service 23 10 1 3 2 4 17 7 9 2 27 6 19 0 1 0 FSS 19 7 1 0 1 4 14 7 4 3 13 11 14 1 0 1 File System Service 13 11 0 3 1 1 13 3 1 2 15 8 10 0 0 0 ECLF 15 14 2 3 2 3 9 5 2 2 17 4 9 0 0 1 Socket Library 24 5 2 6 1 3 18 11 4 5 29 9 22 0 1 0 Installation 18 8 0 3 2 3 13 6 4 4 18 8 15 1 0 0 GPC 21 9 1 2 3 0 15 6 4 1 16 11 8 0 1 1 MTL 24 12 1 7 2 2 15 7 4 3 20 3 25 0 1 0 Alert response module 16 8 1 1 1 1 13 6 5 2 12 5 15 0 0 0 Notification Service 22 14 0 5 5 2 15 4 4 3 15 17 23 1 0 0 Blackberry Thick Client 13 6 1 7 1 1 11 4 4 2 10 2 10 1 0 0 Power Backup service 29 12 0 5 2 5 18 9 6 5 15 11 26 1 1 0 Share Point Client 12 15 2 6 5 1 6 4 4 1 8 4 6 0 0 1 Process Service 23 26 3 7 1 3 14 5 3 7 16 4 11 0 0 1 Platform Resource Service 13 11 0 6 3 1 9 3 1 2 7 3 7 1 0 0 Power on/off 20 8 0 2 2 2 12 5 6 4 12 2 18 0 0 0 Thread Service 27 7 1 10 1 2 22 6 5 1 15 9 12 1 0 0 License Management 27 14 0 5 2 2 21 6 5 3 14 9 18 0 0 1 Periodic IPC Service 15 7 0 4 1 1 13 2 4 2 9 7 11 0 1 1 PDD 13 9 1 2 2 5 4 3 3 1 11 3 7 0 0 1 CALF 23 13 1 9 1 2 17 4 4 4 14 11 12 1 0 1 Alert System 26 4 0 2 0 3 21 6 3 4 20 6 9 1 1 1 19 File Number
- 20. Investigating Defect Source Defect Injection Density: Phase wise defects Phase wise Defects Density Module / Feature # of Req Req Design Code Req DD Design DD Code DD Exception Service 22 53 30 29 2.409 1.364 1.318 External Interface 21 46 29 27 2.190 1.381 1.286 DL Scheduler 28 72 41 37 2.571 1.464 1.321 Alert registry module 24 39 22 38 1.625 0.917 1.583 Rendering 19 33 19 26 1.737 1.000 1.368 GGF 29 52 27 40 1.793 0.931 1.379 Launchpad 17 24 14 23 1.412 0.824 1.353 CCD 27 30 19 46 1.111 0.704 1.704 Semaphore Service 23 47 23 38 2.043 1.000 1.652 FSS 19 30 19 32 1.579 1.000 1.684 File System Service 13 30 13 25 2.308 1.000 1.923 ECLF 15 40 12 21 2.667 0.800 1.400 Socket Library 24 48 23 45 2.000 0.958 1.875 Installation 18 35 18 32 1.944 1.000 1.778 GPC 21 35 18 25 1.667 0.857 1.190 MTL 24 42 17 43 1.750 0.708 1.792 Alert response module 16 28 12 30 1.750 0.750 1.875 Notification Service 22 39 28 41 1.773 1.273 1.864 Blackberry Thick Client 13 23 14 23 1.769 1.077 1.769 Power Backup service 29 39 28 49 1.345 0.966 1.690 Share Point Client 12 34 15 14 2.833 1.250 1.167 Process Service 23 51 17 33 2.217 0.739 1.435 Platform Resource Service 13 25 11 18 1.923 0.846 1.385 Power on/off 20 27 12 34 1.350 0.600 1.700 Thread Service 27 31 26 35 1.148 0.963 1.296 License Management 27 36 21 43 1.333 0.778 1.593 Periodic IPC Service 15 19 17 27 1.267 1.133 1.800 PDD 13 26 13 13 2.000 1.000 1.000 CALF 23 34 26 34 1.478 1.130 1.478 Alert System 26 31 15 35 1.192 0.577 1.346 20 File Number
- 21. Investigating Defect Source Trend Chart: Defect Injection Density 3.000 2.500 2.000 1.500 1.000 0.500 0.000 Req DD Design DD Code DD 21 File Number
- 22. Investigating Defect Removal Activities Trend Chart: Defect Detection Density 3.000 2.500 2.000 1.500 1.000 0.500 0.000 Req DD Design DD Code DD DIT DD SIT DD Post Release DD Min Max Average 22 File Number
- 23. Comparing Detection with Injection Trend Chart: Comparing Defect Density of Detection with Injection 3.000 2.500 2.000 1.500 1.000 0.500 0.000 Req DD Design DD Code DD DIT DD SIT DD Post Release DD Min Max Average Min Max Mean Improvement Opportunity 23 File Number
- 24. Sub-Process Identification Comparing Detection with Injection Defect Density: Requirement Design Phase Coding Phase Phase Min 0.154 0.053 0.783 Defect Detection Max 1.250 0.667 1.154 Density Mean 0.559 0.280 0.925 Min 1.111 0.577 1.000 Defect Injection Max 2.833 1.464 1.923 Density Mean 1.806 0.966 1.533 Mean Difference 1.247 0.686 0.608 Requirement phase Defect Density “Mean” is relatively more compared to that of other phases Requirement Phase needs an attention Requirement Phase is the Critical Sub-Process 24 File Number
- 25. Sub-Process Identification Statistical Justification: Test of Hypothesis H0: μ1 = μ2 H1: μ1 ≠ μ2 Variance DD between Injection to Detection If P ≤ 0.05, Reject H0 Module / Feature Req Design Code If P > 0.05, Accept H0 Exception Service 1.591 0.955 0.318 External Interface 1.619 0.905 0.429 DL Scheduler 1.679 1.071 0.464 Alert registry module 1.292 0.708 0.667 Rendering 0.947 0.737 0.474 GGF 1.586 0.690 0.586 Launchpad 1.059 0.647 0.471 CCD 0.778 0.630 0.667 Semaphore Service 1.609 0.826 0.652 FSS 1.211 0.947 0.684 File System Service 1.462 0.769 0.769 ECLF 1.733 0.467 0.467 Socket Library 1.792 0.625 0.958 Installation 1.500 0.833 0.778 GPC 1.238 0.714 0.333 MTL 1.250 0.375 1.000 Alert response module 1.250 0.625 0.938 Notification Service 1.136 1.045 0.864 Req phase DD is different Blackberry Thick Client 1.308 0.462 0.769 Power Backup service 0.931 0.793 0.828 from Design & Code Share Point Client 1.583 0.583 0.167 Process Service 1.087 0.304 0.652 Platform Resource Service 1.077 0.385 0.385 Statistically proven that Power on/off 0.950 0.500 0.900 Thread Service 0.889 0.556 0.370 Req phase need an License Management 0.815 0.593 0.667 attention…!!! Periodic IPC Service 0.800 0.867 0.800 PDD 1.308 0.769 0.154 CALF 0.913 0.696 0.609 Alert System 1.038 0.500 0.423 25 File Number
- 26. Process Improvement (Setting Quantitative Improvement Goal) 26 File Number
- 27. Improvement Alternatives 1. By reducing the Defect Injection Rate by strengthening the development process 2. By increasing the Defect Detection Rate by strengthening the defect removal process Second alternative is considered for the discussion 27 File Number
- 28. Req Defect Density Mean Shift Histogram of Req Detection DD, Req Injection DD Normal 1.6 Variable Req Detection DD 1.4 Req Injection DD Mean StDev N 1.2 0.5586 0.2732 30 1.806 0.4581 30 1.0 Density 0.8 0.6 0.4 0.2 0.0 0.0 0.4 0.8 1.2 1.6 2.0 2.4 2.8 Data Req Defect Detection Mean need a Shift from 0.5586 to 1.806 28 File Number
- 29. Project Goal Assume project sets a goal of 40% improvement in Requirement Defect Detection Density mean Histogram of Req Detection DD, Req Injection DD, 40% Imp Detectio Normal 1.6 Variable Req Detection DD 1.4 Req Injection DD 40% Imp Detection Req DD 1.2 Mean StDev N 0.5586 0.2732 30 1.0 1.806 0.4581 30 0.7820 0.3825 30 Density 0.8 0.6 0.4 0.2 0.0 0.0 0.4 0.8 1.2 1.6 2.0 2.4 2.8 Data Note: Project team has to document the rationale for selecting 40% improvement 40% improvement is a mean shift from 0.56 to 0.78 Defcets / Req 29 File Number
- 30. Sub-Process Modeling & Control (Finding Sub-Process Control Factors) 30 File Number
- 31. Sub-Process Analysis SW Development Process Requirement Phase Design Phase Code Phase Develop Review Rework Develop Review Rework Develop Review Rework Next Process Steps Requirement Phase Elaboration Change Req Planning Req Capture Req Analyze Docum ent Review Rew ork Baseline Managem ent Planning Developm ent Review Change Managem ent Process Process Process Process Probable Process, Product & People Attributes x2 - Req Complexity x10 - Req Volatility x1 - Author's x8 - Reviewer's Domain Expertise x3 - Development Effort / Req Domain Expertise x9 - Review Effort / Req x4 - Risk of Completeness of Req x5 - Risk of Ambiguity of Req x6 - Risk of Non Testable Req x7 - Risk of Late arrival of Req Which are the Critical Sub-Process Parameters? Consider factors related to Process, Product & People 31 File Number
- 32. Sub-Process Analysis SW Development Process Requirement Phase Design Phase Code Phase Develop Review Rework Develop Review Rework Develop Review Rework Next Process Steps Sub-Process Identification Change Req Planning Req Capture Req Analyze Docum ent Review Rew ork Baseline Managem ent Planning Developm ent Review Change Managem ent Process Process Process Process Available Process, Product & People Attributes x2 - Req Complexity x10 - Req Volatility x1 - Author's x8 - Reviewer's Domain Expertise x3 - Development Effort / Req Domain Expertise x9 - Review Effort / Req x4 - Risk of Completeness of Req x5 - Risk of Ambiguity of Req x6 - Risk of Non Testable Req x7 - Risk of Late arrival of Req Sub-Process Output Measure Y1 = f (x1, x3, x8, x9, x10) Req Defect Density = f (Author’s domain Expt, Dev Effort/Req, Reviewers Domain Expt, Rev Effort/Req, Req Volatility) 32 File Number
- 33. Metrics Definition of selected input factors Metrics Data x Parameter Name Unit Definition / Guidelines Type Type Years of experience in the same or similar domain of x1 = Author's Domain Expertise Objective Continuous Years the author Time spent by author on developing the requirements of x3 = Development Effort / Req Objective Continuous Hrs / Req the feature or module Average Years of experience in the same or similar x8 = Reviewer's Domain Expertise Objective Continuous Years domain of the reviewers Time spent by entire team in reviewing the requirement x9 = Review Effort / Req Objective Continuous Hrs / Req document (# of Req [# of times] changed ) / (Total # of Req in the x10 = Req Volatility Objective Continuous Ratio feature or module) 33 File Number
- 34. Input Parameter Data x1 x3 x8 x9 x10 Authors Domain Reviewer Domain Module / Feature Dev Effort / Req Rev Effort / Req Req Volatility Experience Experience Exception Service 2.00 1.14 1.50 0.90 0.27 External Interface 3.00 1.20 1.75 0.69 0.10 DL Scheduler 2.25 0.43 3.50 1.25 0.29 Alert registry module 5.00 1.46 1.00 0.37 0.25 Rendering 6.00 0.63 2.25 0.95 0.21 GGF 2.00 2.10 0.50 0.21 0.14 Launchpad 3.50 2.12 1.00 0.49 0.18 CCD 5.00 1.40 0.75 0.47 0.22 Semaphore Service 6.00 1.20 1.50 0.48 0.09 FSS 4.50 1.20 1.50 0.44 0.05 File System Service 1.75 0.92 2.50 1.10 0.23 ECLF 3.50 0.60 3.00 0.93 0.33 Socket Library 2.00 2.33 0.75 0.23 0.04 Installation 7.50 1.40 1.00 0.62 0.28 GPC 5.75 1.60 1.75 0.43 0.10 MTL 6.00 1.00 2.00 0.50 0.08 Alert response module 5.00 1.56 1.00 0.70 0.13 Notification Service 2.25 0.95 2.50 0.70 0.27 Blackberry Thick Client 3.50 1.69 0.50 0.69 0.15 Power Backup service 8.00 1.24 0.75 0.50 0.17 Share Point Client 5.00 0.17 3.75 1.75 0.33 Process Service 6.00 0.26 3.50 1.36 0.39 Platform Resource Service 2.50 0.85 2.50 1.10 0.31 Power on/off 8.25 1.40 1.50 0.60 0.05 Thread Service 1.00 1.60 1.00 0.39 0.22 License Management 4.00 1.00 1.50 0.67 0.19 Periodic IPC Service 3.50 1.53 2.00 0.47 0.20 PDD 5.00 1.15 2.00 0.97 0.23 CALF 6.00 1.20 2.25 0.73 0.22 Alert System 2.00 2.31 0.50 0.22 0.08 34 File Number
- 35. Sub-Process Analysis Req Defect Density: Output Measure – Req Defect Density (Y1) I Chart of Req DD 1 1.25 UCL=1.235 1.00 Individual Value 0.75 _ X=0.559 0.50 0.25 0.00 LCL=-0.118 1 4 7 10 13 16 19 22 25 28 Observation 35 File Number
- 36. Sub-Process Analysis Output Measure (Y1) Comparison with Input Measures (x’s) Effect is seen in Output measure, for change in Input measures 36 File Number
- 37. Sub-Process Analysis Analyze the Correlation Scatterplot of Req DD vs Authors Doma, Dev Effort /, Reviewers Do, ... Authors Domain Experience Dev Effort / Req Reviewers Domain Experience 1.5 1.0 0.5 Req DD 0.0 0 4 8 0 1 2 1 2 3 Rev Effort / Req Req Volatility 1.5 1.0 0.5 0.0 0.5 1.0 1.5 0.0 0.2 0.4 Inference: • Reviewer’s Domain Experience, Review Effort / Req and Req Volatility has positive correlation • Dev Effort / Req has a negative correlation • Author's Domain Experience has no correlation 37 File Number
- 38. Model Building Regression Analysis P ≤ 0.05 R-Sq (adj) > 70% (Thumb rule) 38 File Number
- 39. Model Building Regression Analysis – Reduced Model Note: Though Dev Effort / Req & Req Volatility are not statistically significant, they are considered in the reduced model Req Defect Density = 0.153 - 0.0618 Dev Effort / Req + 0.0608 Reviewers Domain Experience + 0.48 Review Effort / Req + 0.23 Req Volatility 39 File Number
- 40. Statistical V/s Practical Project objective is to “Uncover” more defects in the Requirement phase Req Defect Density = 0.153 - 0.0618 Dev Effort / Req + 0.0608 Reviewers Domain Experience + 0.48 Review Effort / Req + 0.23 Req Volatility To have more defect density in the Requirement phase, the Dev Effort / Req should be low, Reviewers Domain Experience should be high, Review Effort should be high, Req Volatility should be high (either few or all). It practically does not make sense that, to have more Req DD the Req Volatility should be high or spend less time in development activities. If we do so, then it means we are intentionally introducing more defects, rather taking any proactive / systemic measures to uncover more defects in Req phase. Reviewers Domain Experience & Review Effort / Requirement are the factors which could help in uncover more defects. It means that, though “Dev Effort / Req, Reviewers Domain Experience, Review Effort / Req & Req Volatility” are Critical Parameters, “Reviewers Domain Experience, Review Effort / Req” are Control Parameter 40 File Number
- 41. How to use the model…? At the beginning of the project: Use the planned or anticipated values of the x’s to predict the defect density, take the appropriate action if the predicted defect density is not within the acceptable range, by changing the values of control factors During execution of the project: Use the actual values of the x’s to predict the defect density and validate the model by actual values of the defect density Calibrate the model with new data set and enhance the model 41 File Number
- 42. Probabilistic Model from Deterministic Model (Study the process behavior by knowing the input distribution) (“What-If” Analysis) 42 File Number
- 43. Probabilistic Model by Simulation Use Crystal Ball tool to arrive at Simulation model Define the simulation model in Crystal Ball tool for the “Regression equation” by fitting the distribution for the input parameters and the forecast for the predictor. 43 File Number
- 44. Probabilistic Model Analysis The probability of detecting 0.5586 defect density is 44.05% 44 File Number
- 45. Process Improvement Steps 1. Do Root Cause Analysis (RCA) and identify the causes for defect leakage in Req phase 2. Prioritize the causes (using Pareto) 3. Identify improvement alternatives in Req phase 4. Study the process behavior by simulating the process for the proposed improvements (What-If analysis) 5. Study the process improvement having an impact on process output measure (Goal) 6. Pilot the process in few projects 7. Analyze results 8. Institutionalize and deploy the process improvement in other projects 45 File Number
- 46. “What If” Analysis…???!!! Assume that, if the new proposed process improvement suggest to have a balanced composition of reviewers with experienced people (Min of 1.5 years, average of 2.4 to the earlier of 0.5 years, average of 1.72, and an improvement in the review process which results an additional review effort of mean 10Hrs and Std Deviation of 1.5 per inspection, then, the New input parameter distributions looks like… Reviewers Domain Experience Review Effort / Req Old New 46 File Number
- 47. “What If” Analysis…???!!! Does the New proposed process meet the project objective of 40% improvement in Requirement Defect Detection Density Mean? Old Req DD of old process = 0.556 Req DD of New proposed process = 0.847 % improvement to that of earlier process = (0.847 – 0.556) / 0.556 = 52.34% The “New” proposed process will improve Req DD Mean by 52.34% New 47 File Number
- 48. Probable Improvements in End Result (Probable change in Post Release Defects and Effort Estimation) 48 File Number
- 49. What is possible changes in “End Measures”? Req Defect Removel Req Review Process Efficiency (DRE) Mean Std Dev Mean Std Dev Current Performance 0.697 0.359 0.302 0.099 Measure Note: Change the input distribution for Req Review New Proposed Effort / Req & Req phase DRE 1.210 0.464 0.474 0.108 Performance Measure 49 File Number
- 50. Possible changes in “Effort” Current Process New Proposed Process 50 File Number
- 51. Possible changes in “Quality” Current Process New Proposed Process Observation: • Though there is increase in Req review effort, there is NOT much change in Total Effort. Because, it is compensated by reduction in effort to fix the defects in later phases • However, there is improvement in the post release defect leakage measure • The certainty of meeting quality goal of 0.1 defects / Req has increased from 78.5% to 83.0% The “New” proposed process can be piloted 51 File Number
- 52. Pilot Improvements in new Project (Validating the predicted improvements) 52 File Number
- 53. At the beginning of Project Predict Req Detection DD from Planned or anticipated values of x’s Regression Equation: Req Defect Density = 0.153 - 0.0618 Dev Effort / Req + 0.0608 Reviewers Domain Experience + 0.48 Review Effort / Req + 0.23 Req Volatility 1.4 1.22 1.10 1.2 1.01 1.00 0.98 0.98 0.95 0.90 1 0.83 Defect Density 0.70 0.68 0.8 0.6 0.4 0.2 0 1 2 3 4 5 6 7 8 9 10 11 Components Predicted Req DD from Planned x's 53 File Number
- 54. During the Execution of Project Monitor & Control the Input Parameters & Monitor Output Predictor Output Measure (Y1) Input Measures (x’s) I Chart of Predicted Req DD from Actual x 1.50 UCL=1.466 1.25 Individual Value 1.00 _ X=0.931 0.75 0.50 LCL=0.396 1 2 3 4 5 6 7 8 9 10 11 Observation 54 File Number
- 55. During the Execution of Project Predict Req Detection DD from actual values of x’s Regression Equation: Req Defect Density = 0.153 - 0.0618 Dev Effort / Req + 0.0608 Reviewers Domain Experience + 0.48 Review Effort / Req + 0.23 Req Volatility 1.4 1.22 1.10 1.09 1.09 1.08 1.06 1.2 1.02 1.01 1.00 1.00 0.98 0.98 0.95 0.90 0.87 1 0.83 Defect Density 0.79 0.77 0.74 0.72 0.70 0.68 0.8 0.6 0.4 0.2 0 1 2 3 4 5 6 7 8 9 10 11 Components Predicted Req DD from Planned x's Predicted Req DD from Actual x's 55 File Number
- 56. During the Execution of Project Compare the actual Defect Density with Predict from planned values of x’s and actual values of x’s 1.33 1.27 1.25 1.4 1.22 1.20 1.15 1.10 1.09 1.09 1.08 1.06 1.2 1.03 1.02 1.01 1.00 1.00 0.98 0.98 0.95 0.91 0.90 0.89 0.87 0.86 1 0.84 0.83 Defect Density 0.79 0.77 0.74 0.72 0.70 0.69 0.68 0.8 0.6 0.4 0.2 0 1 2 3 4 5 6 7 8 9 10 11 Components Predicted Req DD from Planned x's Predicted Req DD from Actual x's Actual Req DD Note: Existing Regression equation may not be valid, because of change in process (Process Improvement) Calibrate the Prediction Equation with New data set 56 File Number
- 57. Is Improvement Statistically Significant? Staged Comparison: I Chart of Req DD - Actual by Process Stage Before After 1.75 UCL=1.674 1.50 1 1.25 _ Mean shift is Individual Value 1.00 X=1.038 0.75 observed…!!! 0.50 LCL=0.402 0.25 0.00 1 5 9 13 17 21 25 29 33 37 41 Observation 57 File Number
- 58. Is Improvement Statistically Significant? Statistical Justification: Test of Hypothesis H0: μ1 = μ2 Mean are same, there is NO significant difference in DD between the data samples H1: μ1 ≠ μ2 Mean are different, there is significant difference in DD between the data samples If P ≤ 0.05, Reject H0 If P > 0.05, Accept H0 The mean of two data set is different The improvement is Statistically Significant Measure and compare the end results after the completion of the project… 58 File Number
- 59. Looking back… We have seen one of the ways of… • Assessing the confidence of project in meeting the project’s multiple goals • Identifying the Critical Sub-Process with Quantitative justification • Setting Quantitative project improvement goal • Defining Sub-Process level Model and arriving at Critical & Controllable factors • Arriving “Probabilistic” Model from a “Deterministic” Model • Doing “What-if” analysis for a proposed process improvement • Demonstrating whether the proposed solution will meet the project’s objective (end process result), before deploying the solution • Demonstrating the usage of models at different stages of the project lifecycle • Demonstrating that the improved process is statistically significant 59 File Number
- 60. 60 File Number
- 61. Acknowledgement Authors wish to thank the Management of Honeywell Technology Solutions Pvt, Ltd, Bangalore for giving an opportunity to present this paper Thanks to Venkatachalam V. & Dakshina Murthy for their guidance & support 61 File Number
- 62. Contact Details Office Address: Sreenivasa M Gangadhara Honeywell Technology Solutions Ltd., Six Sigma Black Belt 151/1, Doraisanipalya, Bannerghatta Road Functional Specialist-Process Bangalore – 560 226 Sreenivasa.gangadhara@honeywell.com Karnataka State, India. Mobile: +91-98804 24780 +91-80-2658 8360 +91-80-4119 7222 Ajay Simha +91-80-2658 4750 Fax Six Sigma Green Belt Principal Engineer Ajay.simha@honeywell.com Mobile: +91-98864 99404 Amit Bhattacharjee Six Sigma Black Belt Principal Engineer Amit.bhattacharjee@honeywell.com Mobile: +91-99860 22908 Archana Kumar Principal Engineer Archana.kumar@honeywell.com Mobile: +91-97407 77667 62 File Number
- 63. 63 File Number
- 64. Click here for: High Maturity best practices HMBP 2010 Presentations organized by QAI Click here 64 File Number